

Abstract
Objective:
To compare the predictive validity of learning and retention measures from the picture version of the Free and Cued Selective Reminding Test with Immediate Recall (pFCSRT+IR) for identifying incident mild cognitive impairment (MCI).
Methods:
Learning was defined by the sum of free recall (FR) and retention by delayed free recall (DFR) tested 15–20 minutes later. 1422 Baltimore Longitudinal Study of Aging (BLSA) participants (mean age 69.6 years, 54% male, mean 16.7 years of education) without dementia or MCI received the pFCSRT+IR at baseline and were followed longitudinally. Cox proportional hazards models were used to evaluate the effect of baseline learning and retention on risk of MCI.
Results:
187 participants developed MCI over a median of 8.1 years of follow-up. FR and DFR each predicted incident MCI adjusting for age, sex and education. Also, each independently predicted incident MCI in the presence of the other with similar effect sizes: around 20% decrease in the hazard of MCI corresponding to one standard deviation increase in FR or DFR.
Conclusion:
The practice of preferring retention over learning to predict incident MCI should be reconsidered. The decision to include retention should be guided by time constraints and patient burden.
Mesh terms: Mild Cognitive Impairment, Alzheimer’s disease, prospective studies, verbal learning, retention, memory disorders, preclinical dementia, Free and Cued Selective Reminding Test
INTRODUCTION
Over several decades the identification of individuals at high risk for AD has been both a priority and a challenge. Neuropsychology has been at the forefront of this effort (Butters & Delis, 1995; Salmon & Bondi, 2009; Bondi 2017; Han et al, 2017). The neuropsychological tests that most consistently and accurately predict incident AD are tests of learning and retention (Albert et al, 2001; Linn et al, 1995; Elias et al, 2000; Jacobs et al, 1995; Tierney et al, 1996; Chen et al, 2001). The earliest studies focused on the inability to learn new information by testing immediate recall of word lists (Miller et al, 1971; Weingartner et al, 1981). Subsequent studies demonstrated that in addition to the hallmark learning deficit, retention tested at delays from 10 to 30 minutes was also impaired (Larrabee & Youngjohn, 1993; Moss, Albert, Butters, & Payne, 1986; Welsh, Butters, Hughes, Mohs, & Heyman, 1991) In some studies, learning measures outperformed retention measures in predicting incident AD whereas the reverse was observed in other studies. Nonetheless, both learning and retention deficits are present in preclinical AD (Bondi et al, 1994; 1999; Grober et al, 2000).
Previously, we argued that the retention deficit in AD is best examined with memory tests like the Free and Cued selective Reminding test (FCSRT) that control initial encoding in order to obtain maximum learning, the basis for subsequent retention (Grober & Kawas, 1997). Measuring retention of inadequately learned material can lead to contradictory results as studies of forgetting have shown (e.g., Becker et al., 1987; Moss et al., 1986). AD participants in the preclinical stage recalled significantly fewer words than matched controls indicating an impairment of learning; their retention, measured by percent retained of initial learning, was identical to that of controls. A retention deficit was documented three years later for AD participants but not for controls, whose retention was still perfect. We concluded that a retention deficit was not present in preclinical AD when hallmark learning deficits can be documented (Grober & Kawas, 1997).
We revisited this issue by examining the trajectories of declines in learning and retention of initially clinically normal participants at baseline in the Baltimore Longitudinal Study of Aging (BLSA) who went on to develop AD dementia over 10 years of follow-up (Grober et al, 2008; 2019). Learning was defined by the sum of free recall (FR) over the three test trials on the picture version of the test with immediate recall (pFCSRT+IR). Retention was defined by delayed free recall (DFR) tested 15–20 minutes after learning. Learning and retention displayed similar profiles of decline in the years prior to the clinical diagnosis of AD with a first acceleration of decline (change point) at 6.6–7.3 years prior to diagnosis and a second at 1.9–2.9 years prior to diagnosis. The change points for learning and retention were not significantly different. Retention defined by savings, percent retained of learning, had only one change point at 5.3 years. These analyses included only persons who prospectively developed AD dementia and did not address predictive validity.
In predictive validity studies, the conventional practice has been to rely on retention rather than learning for identifying mild cognitive impairment (MCI) and dementia (Welsh et al, 1991; Jack et al, 2019). In choosing between measures of learning and retention, evidence which favors retention is required, to offset increment in patient and tester burden. We sought to clarify this issue by comparing the predictive validity of learning and retention measures for the identification of BLSA participants who developed incident MCI over 10 years of follow-up. If retention (DFR) adds predictive value beyond learning (FR), that would justify measuring it. Cox proportional hazards models were used to answer these questions.
METHODS
Participants.
The primary analyses were based on data from 1422 BLSA participants without MCI at baseline who underwent longitudinal assessments with the pFCSRT+IR between July 1985 and December 2015. At enrollment, BLSA participants meet rigorous screening criteria for health and functional status. All participants had at least one follow-up assessment after baseline. All available visits were included in the analysis. The event being modeled was incident MCI. All analyses were repeated on a subsample of 1283 participants who had Apolipoprotein E (APOE) ε4 genotype to determine whether APOE ε4 carriers were at increased the risk of incident MCI. The BLSA study is approved by the local institutional review board, and all participants gave written informed consent before each assessment.
MCI Diagnosis.
Clinical and neuropsychological data from each participant was reviewed at a consensus case conference if their Clinical Dementia Rating score (CDR: Morris, 1993) was greater than or equal to .5 or if they made more than three errors on the Blessed Information-Memory-Concentration (BIMC) Test (Blessed at al., 1968). MCI was defined using the Petersen criteria (Petersen et al, 1999). Diagnoses of dementia and clinical AD were based on criteria outlined in the Diagnostic and Statistical Manual of Mental Disorders, third edition, revised (American Psychiatric Association, 1987) and the National Institute of Neurological and Communication Disorders and Stroke – Alzheimer’s Disease and Related Disorders (McKhann, Drachman, Folstein, & al, 1984). Diagnoses relied on clinical history, informant report, and a broad battery of neurocognitive tests that included pFCSRT+IR scores.
Because knowledge of scores on the pFCSRT+IR may have compromised the test’s independence as a predictor, we performed a sensitivity analysis using an alternative definition of the cognitive impairment defined as four or more errors on the Blessed Information Memory Concentration (BIMC) Test . Persons with incident BIMC scores of 5 to 8 indicate very high risk for incident AD (Katzman et al, 1989). Analyses were repeated using this alternative endpoint.
pFCSRT+IR.
Before the pFCSRT+IR was administered (Grober and Buschke, 1987), the 16-line drawings used in the test were presented for naming. The study phase followed in which participants were asked to search a card containing four of the drawings (e.g., grapes) for an item that goes with a unique category cue (e.g., fruit). After all-four items were identified, immediate recall of just those four items was tested by free recall followed by cued recall for missed items. When cued recall failed, the participant was told the name of the item. The study phase was repeated for all 16 drawings. The test phase consisted of three trials of FR each followed by cued recall for items not retrieved by free recall. The learning measure was the sum of free recall (FR: maximum=48). The retention measure was delayed free recall (DFR) tested 15–20 minutes after learning without re-presentation of the items (maximum=16). Retention defined by the savings method was not used as a predictor because its decline occurred later in the predementia phase and so would not be sensitive to early disease (Grober & Kawas, 1997; Grober et al, 2019).
Statistical Analysis.
The outcome we modeled was time to incident MCI within 10 years of baseline pFCSRT+IR. Some individuals were never observed to have MCI; they were assessed as normal one assessment and as having dementia the next. For those individuals we assume that the onset of MCI was unobserved and occurred prior to or simultaneously with the onset of dementia. As a proxy for time to MCI in those individuals, we use time to dementia. Cox proportional hazards models were used to evaluate the effect of baseline learning (FR) and retention (DFR) on risk of MCI adjusting for age, sex and education. The effects of the predictors were reported as hazard ratios, the ratio of the hazard rate of MCI incidence corresponding to 1 unit difference in the predictor for continuous variable, and in the exposed versus the reference group (e.g., APOE ε4 carriers versus non-carriers). Because learning and retention scores from the same test are highly correlated (r = 0.65), we sought to determine if each score made an independent contribution to prediction of incident MCI. A sensitivity analysis further adjusting for APOE ε4 genotype was performed to evaluate whether APOE e4 genotype (ε4 carriers vs. non-carriers) altered the findings. These analyses were repeated using four or more errors on the BIMC as the outcome as a sensitivity analysis. The partial likelihood ratio test (Cox, 1972) was used to compare nested models (model with DFR and FR vs FR only, adjusting for covariates). A measure of explained variation, defined as the ratio of distance measures between the survival processes and the fitted survival curves with and without predictors in the model, was also reported (Schemper and Henderson, 2000).
RESULTS
Of 1422 participants free of dementia and MCI at baseline, 187 developed MCI over a median of 8.1 years of follow-up. The incidence rate was 1.75% per year. Dementia developed in 88 participants. The group that developed MCI was older (77.1±6.8 vs 68.4±7.9 years, Cohen’s d=1.1, p<.0001), had shorter follow-up time (4.9±2.4 vs 7.5±3.0, Cohen’s d=−0.9, p<.0001) and worse performance on FR (29.5±5.7 vs 32.7± 5.0, Cohen’s d=−0.6, p<.0001) and DFR (10.9±2.5 vs 12.1±2.1, Cohen’s d=−0.6, p<.0001), but did not significantly differ in sex (57.8% vs 53.4% men, p=0.270) or education (16.8±2.7 vs 16.7±2.7 years, Cohen’s d=0.03, p=0.494). 80.3% of the participants were Caucasian, 15.9% were African American, and 3.8% were other races.
Kaplan-Meier curves for incident MCI by FR and DFR are presented in the Figure to graphically illustrate our findings. We dichotomized FR using the cut-off 30 (>30 vs <=30) as >30 indicates intact memory in the stages of objective memory impairment (SOMI) system (Grober et al, 2021a), and dichotomized DFR using cut-off 11 (>11 vs <= 11) which is the lower quantile. In these figures, better performance on FR (HR=0.32, p<.0001) and DFR (HR=0.37, p<.0001) showed lower risk of MCI.
Figure:
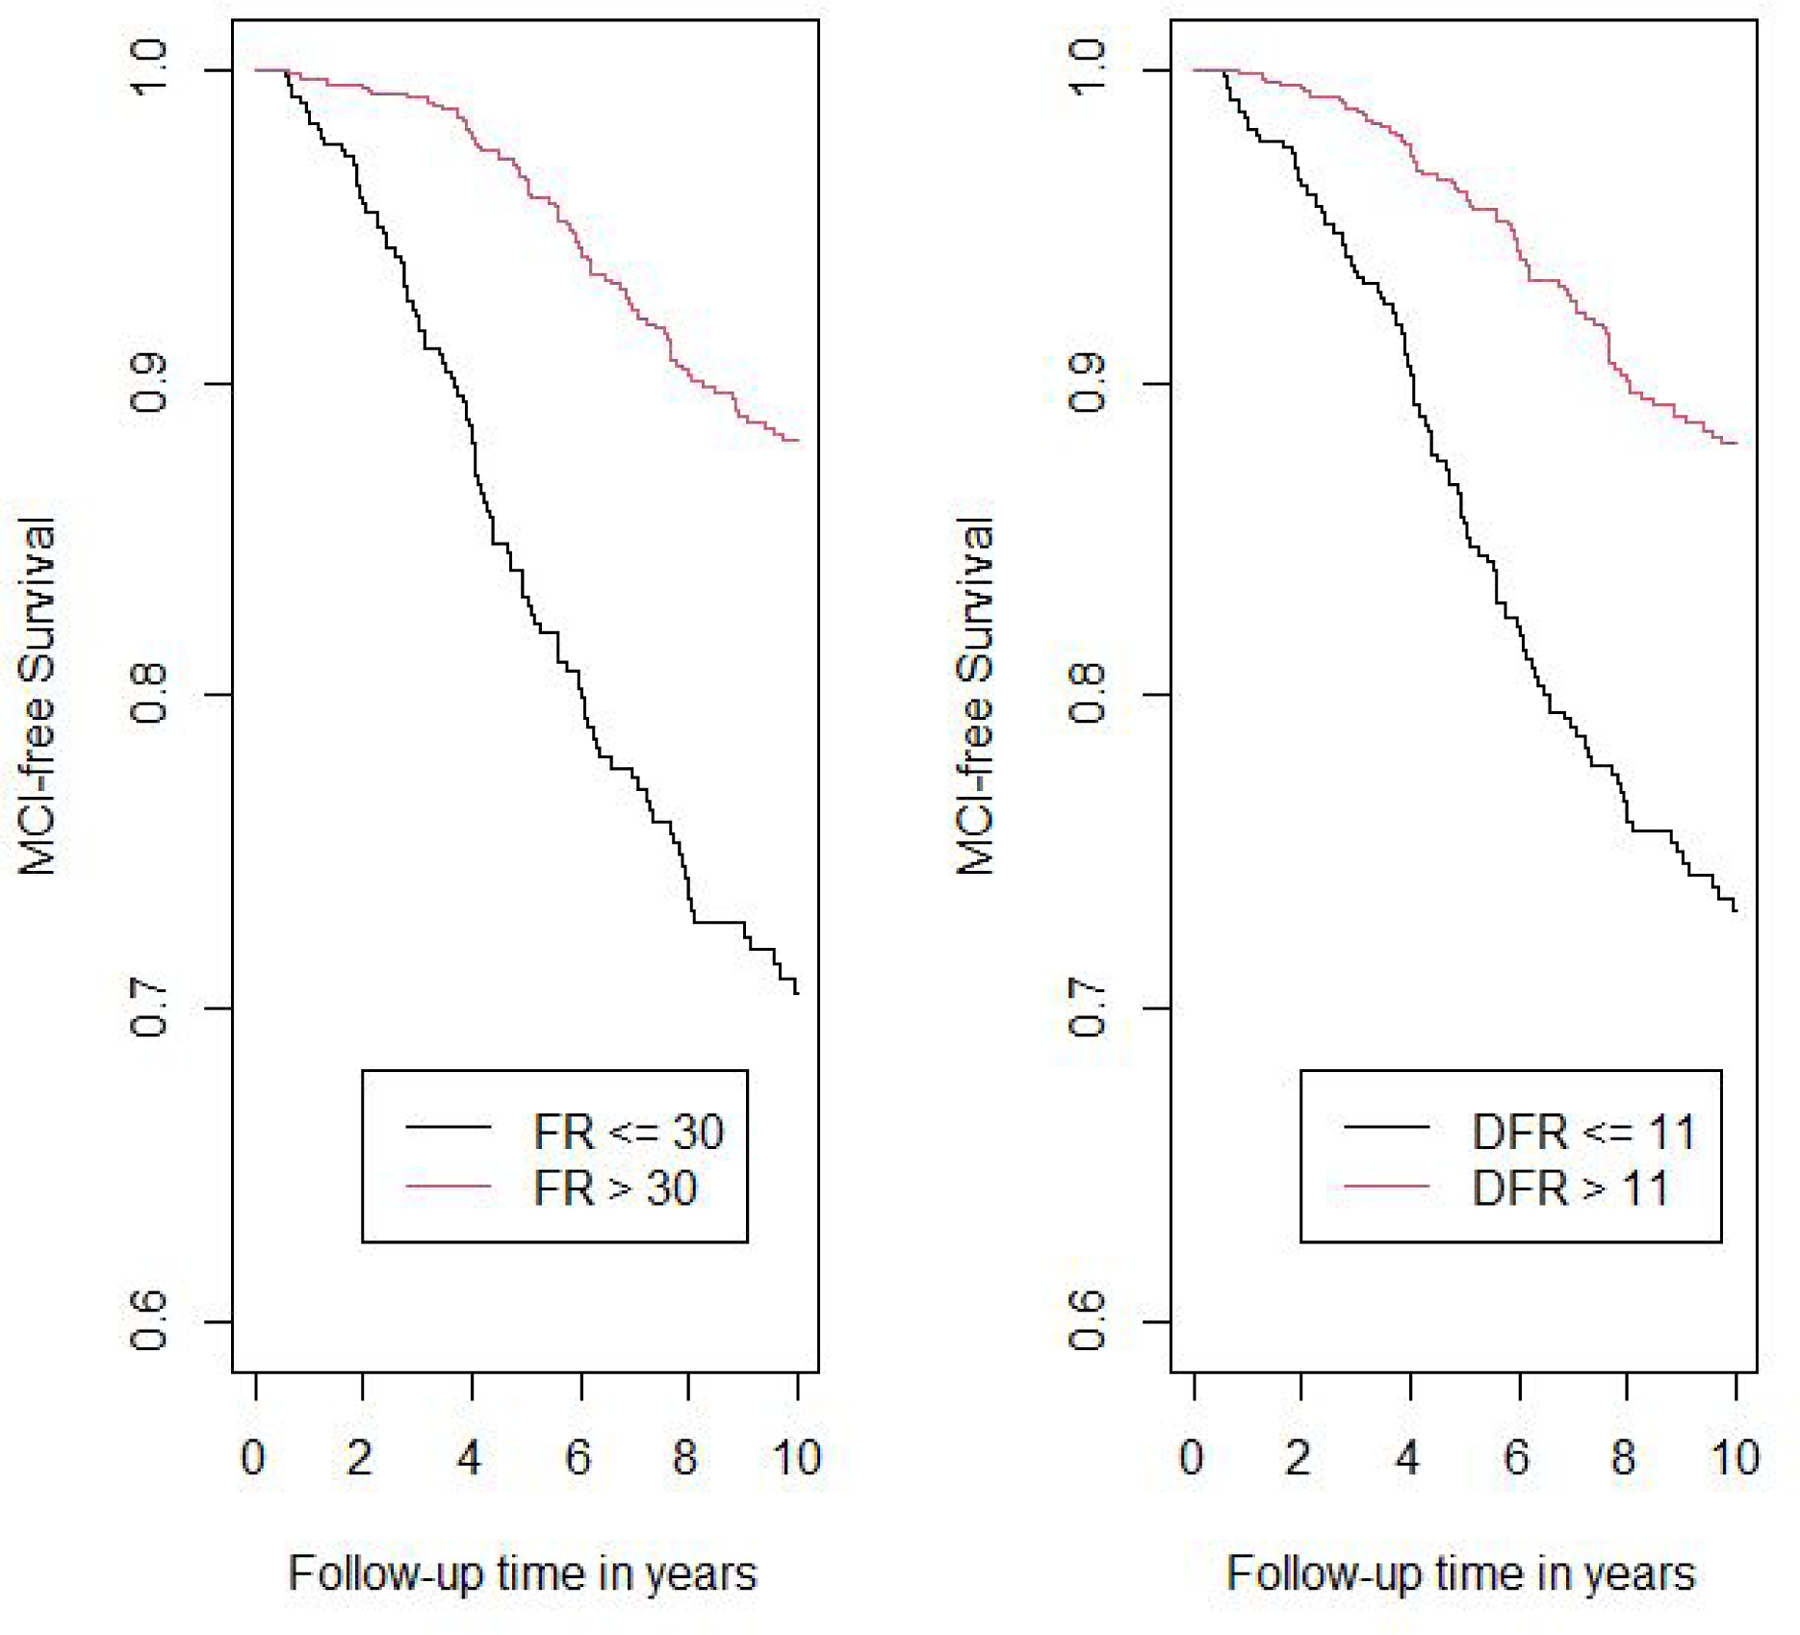
Kaplan-Meier curves for incident MCI by FR and DFR.
The hazard ratios for incident MCI with using learning (model 1) and retention (model 2) in separate models and in the same analysis (model 3), adjusted for covariates, are shown in Table 2. Age was a significant predictor of incident MCI in all models. Both FR and DFR were significant predictors of incident MCI in separate models: for each SD increase in FR, risk of MCI decreased (HR=0.66); for each SD increase in DFR, MCI risk also decreased (HR=0.68). When both FR and DFR were examined simultaneously, both FR (HR=0.77) and DFR (HR=0.81) remained significant, and there was no significant difference between the magnitudes of the two effects (p=0.755). Using the measure of explained variation, the percent explained by FR and covariates is 16.1; the addition of DFR increased the explained variation to 17.0, an increase of 0.9%. For the comparison of adding DFR to the model with FR and covariates, partial likelihood test showed that the addition of DFR significantly improved the model fit (p value=0.018). The results were not materially different when four or more errors on the BIMC was the outcome event being modeled in 1303 eligible participants with BIMC<=3 at baseline and follow-up assessment. Using this endpoint, 261 incident cases developed.
Table 2.
Hazard ratios for incident MCI using baseline FR and DFR as predictors, adjusting for demographic covariates including age at baseline, sex and education.
| Model 1 | Model 2 | Model 3 | |||||||
|---|---|---|---|---|---|---|---|---|---|
| HR | 95% CI | p value | HR | 95% CI | p value | HR | 95% CI | p value | |
| Age at baseline, years | 1.142 | 1.120–1.163 | <0.0001 | 1.143 | 1.122–1.165 | <.0001 | 1.141 | 1.120–1.163 | <.0001 |
| Sex (male vs. female) | 0.936 | 0.693–1.265 | 0.668 | 1.013 | 0.752–1.364 | 0.935 | 0.948 | 0.702–1.280 | 0.727 |
| Education, years | 1.031 | 0.975–1.090 | 0.289 | 1.022 | 0.967–1.081 | 0.434 | 1.030 | 0.974–1.089 | 0.306 |
| FR (per SD increase) | 0.662 | 0.581–0.755 | <.0001 | 0.767 | 0.641–0.918 | 0.004 | |||
| DFR (per SD increase) | 0.676 | 0.595–0.769 | <.0001 | 0.808 | 0.678–0.964 | 0.018 | |||
Model 1: FR on incident MCI adjusting for age, sex and education; Model 2: DFR on incident MCI adjusting for age, sex and education; Model 3: FR and DFR on incident MCI adjusting for age, sex and education.
Of the 1283 participants who had APOE information, 36% of the incident MCI participants were APOE ε4 carriers compared to 25% of the non-cases (p=0.005). APOE ε4 carriers developed incident MCI at more than twice the rate of noncarriers (HR=2.75). The addition of APOE status as a covariate in the Cox models did not materially change the HRs for FR or DFR for predicting incident MCI (Table 4).
Table 4.
Hazard ratios for incident MCI using baseline FR and DFR as predictors, adjusting for age at baseline, sex, education and APOE genotype (APOE e4 carrier status).
| Model 1 | Model 2 | Model 3 | |||||||
|---|---|---|---|---|---|---|---|---|---|
| HR | 95% CI | p value | HR | 95% CI | p value | HR | 95% CI | p value | |
| Age at baseline, years | 1.148 | 1.123–1.173 | <0.0001 | 1.150 | 1.125–1.175 | <.0001 | 1.148 | 1.123–1.173 | <.0001 |
| Sex (male vs. female) | 0.991 | 0.706–1.389 | 0.9562 | 1.053 | 0.752–1.475 | 0.7623 | 1.009 | 0.719–1.415 | 0.959 |
| Education, years | 1.026 | 0.963–1.093 | 0.4311 | 1.017 | 0.955–1.083 | 0.5962 | 1.024 | 0.962–1.091 | 0.452 |
| APOE e4 | 2.275 | 1.611–3.213 | <.0001 | 2.271 | 1.607–3.208 | <.0001 | 2.297 | 1.625–3.247 | <.0001 |
| FR (per SD increase) | 0.675 | 0.576–0.790 | <.0001 | 0.790 | 0.640–0.975 | 0.028 | |||
| DFR (per SD increase) | 0.679 | 0.582–0.792 | <.0001 | 0.790 | 0.624 −0.970 | 0.024 | |||
Model 1: FR on incident MCI adjusting for age, sex, education and ApoE4 (carriers vs non-carriers); Model 2: DFR on incident MCI adjusting for age, sex , education and ApoE4; Model 3: FR and DFR on incident MCI adjusting for age, sex , education and ApoE4.
DISCUSSION
We sought to determine whether the conventional practice of relying on retention rather than learning for identifying MCI was justified when learning and retention were measured with the pFCSRT+IR. We compared their predictive validity for risk of incident MCI among 1422 BLSA participants who were clinically normal at baseline. 187 participants developed MCI over a median of 8.1 years of follow-up. FR (learning) and DFR (retention) each predicted incident MCI with similar hazard ratios, adjusting for age, sex and education. When examined simultaneously, both remained significant with similar magnitude of effect: around 20% decrease in the risk of MCI corresponding to 1 SD increase in FR or DFR, confirming the predictive value of both learning and retention measures. The addition of DFR to the model including FR and covariates increased the explained variation by 0.9%, and significantly increased the partial likelihood. Age was a significant predictor in all models whereas sex and years of education were not significant predictors in any model. Analyses were repeated with four or more errors on the BIMC as the endpoint as a sensitivity analysis to avoid diagnostic circularity given inclusion of pFCSRT+IR in diagnostic consensus conferences. The results were not materially different. APOE ε4 carriers developed incident MCI at rates in line with published studies (Dang et al, 2018). Importantly, adjusting for APOE ε4 allele did not diminish the relationship between FR or DFR and incident MCI. The incidence rate for MCI was 1.75% per year which is low in comparison to the incidence rate in other longitudinal studies (Kantarci et al, 2013; Machulda et al, 2013). The low incidence rate most likely reflects the strict health and functional criteria at BLSA enrollment, and the continuous enrollment of BLSA participants.
The FCSRT has been widely used to identify prevalent dementia, incident dementia and AD, and MCI (Auriacombe et al, 2010; Di Stefano et al, 2016; Derby et al, 2013; Katz et al, 2012; Sarazin et al, 2007). pFCSRT+IR measures, specifically FR, total recall (TR; sum of FR and cued recall) and their combination (FR+TR) are components in the preclinical Alzheimer’s disease clinical composite (PACC) for detecting cognitive change that also includes Logical Memory, Digit Symbol Substitution Test and the Mini Mental State Exam (Donohue et al, 2014; Papp et al, 2017). When the PACC was administered annually to 277 clinically normal participants in the Harvard Aging Brain Study (HABS) grouped according to threshold levels of amyloid imaging and followed for up to five years (Mormino et al, 2017), all combinations including FR resulted in larger magnitude of effect for differences between Aβ groups over three and five years of follow-up than any other PACC component. FR alone or combined with total recall was the only individual component to show differences between the Aβ+ group who progressed to CDR 0.5 versus those that remained stable.
The failure of clinical trials targeted to decreasing the accumulation of Aβ pathology in cognitively normal adults prompted examination of cognitive decline that occurs within the normal range of the amyloid imaging tracer, 18F-florbetapir (Insel et al, 2020). Continuous levels of the tracer were associated with the individual PACC components of 4432 cognitively unimpaired adults screened for inclusion in the A4 trial (Sperling et al, 2014). The magnitude of the decrease in FR and FR+TR scores at subclinical levels of tracer uptake, standard uptake volume ratio (SUVR=1.10) compared to normal levels (SUVR=0.78) was more than twice that of the other PACC components with a larger magnitude of effect than the PACC itself. Though the decline in pFCSRT+IR performance in the subthreshold range of Aβ was small, it marks the start of episodic memory impairment that is the hallmark of AD.
The decline of free recall in the preclinical course of AD was associated with the progression of neurofibrillary tangle (NFT) pathology defined by Braak stage in 300+ cases from Washington University clinic-neuropathologic cohort (Grober et al, 2021). Compared with cases with limited NFT pathology (Braak stage 0 and I), FR of cases with Braak stage III pathology was significantly lower and continued to decline at similar rates in successive Braak stages. Unlike FR, Mini Mental State Exam and CDR sum of boxes scores did not decline until Braak stage IV. We suggest that FR performance may be useful in predicting tau positivity in observational studies and in clinical trials (Grober et al, 2021b)
Other studies have compared measures of learning and retention as predictors of incident AD, with varying results. Differences in the patterns of results can be observed for the same test. When the California Verbal Learning Test (CVLT) measures were used to predict incident dementia in 133 participants without dementia at baseline, neither the short or long delay measures improved prediction over learning, as measured by the sum of free recall over five trials (Bondi et al, 1999). In another comparison of CVLT measures in predicting MCI or dementia, learning was the most powerful predictor of all the measures but predictive value was enhanced by adding delayed story recall (Rabin et al, 2009). The varying results even for the same test is not surprising when the factors that determine predictive value are considered: the stage of an individual with respect to the multi-year process of cognitive decline that precedes dementia (Bilgel et al., 2014); the psychometric properties of the particular test being used (Grober, Ocepek-Welikson, & Teresi, 2009) and the composition of the sample that does not go on to develop dementia.
The most recent example of neuropsychology’s contribution to the identification of individuals at high risk of AD examined trajectories of 35 neuropsychological tests In an APOE ε4 enriched cohort of 784 cognitively normal participants to determine how far in advance of incident MCI cognitive decline can be identified (Caselli et al, 2020). 65 participants developed amnestic MCI during an average follow-up of 9.5 years at mean age of 73. The rate of decline of 34 of the 35 tests was steeper among MCI converters relative to nonconverters following the inflection point when performance of the two groups diverged. Multiple episodic memory tests (Auditory Verbal Learning Test and Selective Reminding Test) displayed the earliest inflection points, nearly 20 years in advance of MCI diagnosis, with retention decline beginning a year earlier than learning decline (Age 54 versus 55). These findings challenge the current disease model of preclinical AD wherein cognition begins to decline after sufficient amyloid and tau deposition has occurred (Sperling et al, 2011; Jack, 2017).
The strength of our data set is the sizable and well-characterized cohort of incident MCI cases and the large number of assessments available over more than 20 years of follow-up. However, generalizability is limited due to the high educational level of the BLSA cohort. The similarity of the findings based on clinical conference diagnosis, where circularity is possible, and an outcome based on a BIMC cut point for impairment, adds confidence that our findings are not an artifact of our diagnostic procedures.
The benefits of testing retention after initial learning may depend on the particular memory test being used and the stage of disease. Our results using the pFCSRT+IR suggest that the practice of preferring retention over learning to predict incident MCI merits reconsideration since both independently predict the outcome in the presence of the other with a similar magnitude of effect. Adding retention to the model that included learning increased the explained variation by about 1%. Thus, the decision to include DFR in the assessment may depend on the setting. In the clinic, if there is time to extend the assessment by 20 minutes to capture DFR, the additional information may be warranted. In a telephone or web-based assessment where time may be more limited and patient burden a greater concern, adding DFR may be inadvisable given its marginal enhancement in predicting MCI.
Table 1.
Baseline Characteristics.
| No incident MCI (N=1235) | Incident MCI (N=187) | All (N=1422) | ||||
|---|---|---|---|---|---|---|
| Mean | Std | Mean | Std | Mean | Std | |
| Sex (% male) | 660 (53%) | 108 (58%) | 768 (54%) | |||
| Age | 68.43 | 7.90 | 77.09 | 6.77 | 69.57 | 8.29 |
| Education (years) | 16.68 | 2.66 | 16.77 | 2.67 | 16.69 | 2.66 |
| Follow-Up Time (years) | 7.49 | 2.97 | 4.94 | 2.36 | 7.15 | 3.02 |
| Free recall (FR) | 32.67 | 5.04 | 29.53 | 5.74 | 32.26 | 5.24 |
| Delayed free recall (DFR) | 12.07 | 2.09 | 10.88 | 2.50 | 11.91 | 2.18 |
Table 3.
Hazard ratios for incident MCI defined by four or more errors on the BIMC using baseline FR and DFR as predictors, adjusting for demographic covariates including age at baseline, sex and education.
| Model 1 | Model 2 | Model 3 | |||||||
|---|---|---|---|---|---|---|---|---|---|
| HR | 95% CI | p value | HR | 95% CI | p value | HR | 95% CI | p value | |
| Age at baseline, years | 1.077 | 1.061–1.094 | <0.0001 | 1.079 | 1.062–1.096 | <.0001 | 1.077 | 1.060–1.094 | <.0001 |
| Sex (male vs. female) | 0.876 | 0.682–1.125 | 0.299 | 0.907 | 0.706–1.165 | 0.445 | 0.880 | 0.685–1.131 | 0.250 |
| Education, years | 0.935 | 0.894–0.978 | 0.003 | 0.927 | 0.886–0.970 | 0.001 | 0.932 | 0.891–0.975 | 0.0003 |
| FR (per SD increase) | 0.714 | 0.637–0.801 | <.0001 | 0.825 | 0.707–0.963 | 0.015 | |||
| DFR (per SD increase) | 0.712 | 0.637–0.796 | <.0001 | 0.808 | 0.695–0.940 | 0.006 | |||
Model 1: FR on incident MCI adjusting for age, sex and education; Model 2: DFR on incident MCI adjusting for age, sex and education; Model 3: FR and DFR on incident MCI adjusting for age, sex and education.
Acknowledgments and Disclosures
This study was supported in part by the Intramural Research Program, National Institute on Aging, NIH and the NIH: 2PO1 AG003949.
The FCSRT+IR is copyrighted by the Albert Einstein College of Medicine and is made freely available for noncommercial purposes. Dr. Ellen Grober receives a small percent-age of any royalties on the FCSRT+IR when it is used for commercial purposes.
Dr. Cuiling has no disclosures. Dr. Susan Resnick has no disclosures other than being an employee of the NIA. Dr. Claudia Kawas has no disclosures.
Dr. Richard B. Lipton is the Edwin S. Lowe Professor of Neurology at the Albert Einstein College of Medicine in New York. He receives research support from the NIH: 2PO1 AG003949 (mPI), 5U10 NS077308 (PI), R21 AG056920 (Investigator), 1RF1 AG057531 (Site PI), RF1 AG054548 (Investigator), 1RO1 AG048642 (Investigator), R56 AG057548 (Investigator), U01062370 (Investigator), RO1 AG060933 (Investigator), K23 NS09610 (Mentor), K23AG049466 (Mentor), K23 NS107643 (Mentor). He also receives support from the Migraine Research Foundation and the National Headache Foundation. He serves on the editorial board of Neurology, senior advisor to Headache, and associate editor to Cephalalgia. He has reviewed for the NIA and NINDS, holds stock options in eNeura Therapeutics and Biohaven Holdings; serves as consultant, advisory board member, or has received honoraria from: American Academy of Neurology, Alder, Allergan, American Headache Society, Amgen, Avanir, Biohaven, Biovision, Boston Scientific, Dr. Reddy’s, Electrocore, Eli Lilly, eNeura Therapeutics, GlaxoSmithKline, Merck, Pernix, Pfizer, Supernus, Teva, Trigemina, Vector, Vedanta. He receives royalties from Wolff’s Headache 7th and 8th Edition, Oxford Press University, 2009, Wiley and Informa.
References
- Albert M, Moss M, Tanzi R, & Jones K (2001). Preclinical prediction of AD using neuropsychological tests. Journal of the International Neuropsychological Society 7, 631–639. [DOI] [PubMed] [Google Scholar]
- American Psychiatric Association. (1987). Diagnostic and Statistical Manual of Mental Disorders (3rd ed.). Washington, D.C.: American Psychiatric Association Press. [Google Scholar]
- Auriacombe SM, Helmer CMDP, Amieva HP, Berr CP, Dubois BM, Dartigues JFMDP (2010) Validity of the Free and Cued Selective Reminding Test in predicting dementia: The 3C Study. Neurology 74, 1760–1767. [DOI] [PubMed] [Google Scholar]
- Becker JT, Boller F, Saxton J, & McGonigle-Gibson KL (1987). Normal rates of forgetting of verbal and non-verbal material in Alzheimer’s disease. Cortex, 23(1), 59–72. [DOI] [PubMed] [Google Scholar]
- Bilgel M, An Y, Lang A, Prince J, Ferrucci L, Jedynak B, & Resnick SM (2014). Trajectories of Alzheimer disease-related cognitive measures in a longitudinal sample. Alzheimers Dement, 10(6), 735–742.e734. doi: 10.1016/j.jalz.2014.04.520 [DOI] [PMC free article] [PubMed] [Google Scholar]
- Blessed G, Tomlinson BE, Roth M. (1968). The association between quantitative measures and senile changes in the cerebral gray matter of elderly subjects. British Journal of Psychiatry. 1968;114:797–811. [DOI] [PubMed] [Google Scholar]
- Bondi MW, Salmon DP, Galasko D, Thomas RG, Thal LJ (1999). Neuropsychological function and apolipoprotein E genotype in the preclinical detection of Alzheimer’s disease. Psychol Aging, 14(2):295–303. [DOI] [PubMed] [Google Scholar]
- Bondi MW, Edmonds EC, & Salmon DP (2017). Alzheimer’s Disease: Past, Present, and Future. Journal of the International Neuropsychological Society, 23(9–10), 818–831. doi: 10.1017/S135561771700100X [DOI] [PMC free article] [PubMed] [Google Scholar]
- Caselli RJ, Langlais BT, Dueck AC, Chen Y, Su Y, Locke DEC, … Reiman EM (2020). Neuropsychological decline up to 20 years before incident mild cognitive impairment. Alzheimers Dement, 16(3), 512–523. doi: 10.1016/j.jalz.2019.09.085 [DOI] [PMC free article] [PubMed] [Google Scholar]
- Chen P, Ratcliff G, Belle SH, Cauley JA, DeKosky ST, & Ganguli M (2001). Patterns of cognitive decline in presymptomatic alzheimer disease: A prospective community study. Archives of General Psychiatry, 58(9), 853–858. doi: 10.1001/archpsyc.58.9.853 [DOI] [PubMed] [Google Scholar]
- Cox David R (1972). “Regression Models and Life-Tables”. Journal of the Royal Statistical Society, Series B. 34 (2): 187–220. JSTOR 2985181. MR 0341758 [Google Scholar]
- Dang C, Harrington KD, Lim YY, Ames D, Hassenstab J, Laws SM, … Maruff P (2018). Relationship Between Amyloid-β Positivity and Progression to Mild Cognitive Impairment or Dementia over 8 Years in Cognitively Normal Older Adults. J Alzheimers Dis, 65(4), 1313–1325. doi: 10.3233/jad-180507 [DOI] [PubMed] [Google Scholar]
- Di Stefano F, Epelbaum S, Coley N, Cantet C, Ousset PJ, Hampel H, … Andrieu S (2015). Prediction of Alzheimer’s Disease Dementia: Data from the GuidAge Prevention Trial. J Alzheimers Dis, 48(3), 793–804. doi: 10.3233/jad-150013 [DOI] [PubMed] [Google Scholar]
- Donohue MC, Sperling RA, Salmon DP, Rentz DM, Raman R, Thomas RG, … Aisen PS (2014). The preclinical Alzheimer cognitive composite: measuring amyloid-related decline. JAMA Neurol, 71(8), 961–970. doi: 10.1001/jamaneurol.2014.803 [DOI] [PMC free article] [PubMed] [Google Scholar]
- Duke Han S, Nguyen CP, Stricker NH, & Nation DA (2017). Detectable Neuropsychological Differences in Early Preclinical Alzheimer’s Disease: A Meta-Analysis. Neuropsychol Rev, 27(4), 305–325. doi: 10.1007/s11065-017-9345-5 [DOI] [PMC free article] [PubMed] [Google Scholar]
- Elias MF, Beiser A, Wolf PA, Au R, White RF, & D’Agostino RB (2000). The Preclinical Phase of Alzheimer Disease: A 22-Year Prospective Study of the Framingham Cohort. Archives of Neurology, 57(6), 808–813. doi: 10.1001/archneur.57.6.808 [DOI] [PubMed] [Google Scholar]
- Grober E, & Buschke H (1987). Genuine memory deficits in dementia. Developmental Neuropsychology, 3, 13–36. [Google Scholar]
- Grober E & Kawas C (1997). Learning and retention in preclinical and early Alzheimer’s Disease. Psychology and Aging, 12:183–188. [DOI] [PubMed] [Google Scholar]
- Grober E, Lipton RB, Hall C, & Crystal H (2000). Memory impairment on free and cued selective reminding predicts dementia. Neurology, 54(4), 827–832. Retrieved from http://www.neurology.org/cgi/content/abstract/54/4/827 [DOI] [PubMed] [Google Scholar]
- Grober E, Ocepek-Welikson K, & Teresi J (2009). The Free and Cued Selective Reminding Test: Evidence of Psychometric Adequacy. Psychology Science Quarterly, 51(3), 266–282. [Google Scholar]
- Grober E, Hall CB, Lipton RB, Zonderman AB, Resnick SM, & Kawas C (2008). Memory impairment, executive dysfunction, and intellectual decline in preclinical Alzheimer’s disease. J Int Neuropsychol Soc, 14(2), 266–278. [DOI] [PMC free article] [PubMed] [Google Scholar]
- Grober E, An Y, Lipton RB, Kawas C, Resnick SM. (2019). Timing of onset and rate of decline in learning and retention in the pre-dementia phase of Alzheimer’s disease. J Int Neuropsychol Soc., 25(7):699–705. [DOI] [PMC free article] [PubMed] [Google Scholar]
- Grober E, Qi Q, Kuo L, Hassenstab J, Perrin RJ, & Lipton RB. (2021a). Stages of Objective Memory Impairment predict Alzheimer’s Disease Neuropathology: Comparison with the Clinical Dementia Rating Scale-Sum of Boxes. J Alzheimers Dis, 2021a, 80, 185–195. [DOI] [PMC free article] [PubMed] [Google Scholar]
- Grober E, Qi Q, Kuo L, Hassenstab J, Perrin RJ, & Lipton RB. (2021b). The Free and Cued Selective Reminding Test predicts Braak stage. J Alzheimers Dis, 2021b, 80, 175–183. [DOI] [PMC free article] [PubMed] [Google Scholar]
- Insel PS, Donohue MC, Sperling R, Hansson O, Mattsson-Carlgren N. The A4 study: β-amyloid and cognition in 4432 cognitively unimpaired adults. Ann Clin Transl Neurol. 2020;7(5):776–785. [DOI] [PMC free article] [PubMed] [Google Scholar]
- Jack CR Jr., Wiste HJ, Therneau TM, Weigand SD, Knopman DS, Mielke MM, … Petersen RC. (2019). Associations of Amyloid, Tau, and Neurodegeneration Biomarker Profiles With Rates of Memory Decline Among Individuals Without Dementia. JAMA, 321(23), 2316–2325. doi: 10.1001/jama.2019.7437. [DOI] [PMC free article] [PubMed] [Google Scholar]
- Jacobs DM, Sano M, Dooneief G, Marder K, Bell KL, & Stern Y (1995). Neuropsychological detection and characterization of preclinical Alzheimer’s disease. Neurology, 45, 957–962. [DOI] [PubMed] [Google Scholar]
- Kantarci K, Weigand SD, Przybelski SA, Preboske GM, Pankratz VS, Vemuri P, … Jack CR Jr. (2013). MRI and MRS predictors of mild cognitive impairment in a population-based sample. Neurology, 81(2), 126–133. doi: 10.1212/WNL.0b013e31829a3329 [DOI] [PMC free article] [PubMed] [Google Scholar]
- Katz MJ, Lipton RB, Hall CB, Zimmerman ME, Sanders AE, Verghese J, …. Derby CA (2012) Age-specific and sex-specific prevalence and incidence of mild cognitive impairment, dementia, and Alzheimer dementia in blacks and whites: a report from the Einstein Aging Study. Alzheimer Disease and Associated Disorders 26, 335–343. [DOI] [PMC free article] [PubMed] [Google Scholar]
- Katzman R, Aronson M, Fuld P, et al.(1989). Development of dementing illnesses in an 80-year-old volunteer cohort. Annals of Neurology, 25(4):317–324. [DOI] [PubMed] [Google Scholar]
- Larrabee GJ, Youngjohn JR, Sudilovsky A, & Crook TH 3rd. (1993). Accelerated forgetting in Alzheimer-type dementia. J Clin Exp Neuropsychol, 15(5), 701–712. doi: 10.1080/01688639308402590 [DOI] [PubMed] [Google Scholar]
- Linn RT, Wolf PA, Bachman DL, Knoefel JE, Cobb JL, Belanger AJ, … D’Agostino RB. (1995). The ‘preclinical phase’ of probable Alzheimer’s disease. A 13-year prospective study of the Framingham cohort. Archives of Neurology, 52(5), 485–490. doi: 10.1001/archneur.52.5.485 [DOI] [PubMed] [Google Scholar]
- Machulda MM, Pankratz VS, Christianson TJ, Ivnik RJ, Mielke MM, Roberts RO, … Petersen RC. (2013). Practice effects and longitudinal cognitive change in normal aging vs. incident mild cognitive impairment and dementia in the Mayo Clinic Study of Aging. Clinical Neuropsychologist, 27(8), 1247–1264. Retrieved from http://elibrary.einstein.yu.edu/login?url=http://ovidsp.ovid.com/ovidweb.cgi?T=JS&CSC=Y&NEWS=N&PAGE=fulltext&D=medl&AN=24041121 [DOI] [PMC free article] [PubMed] [Google Scholar]
- McKhann G, Drachman D, Folstein M, et al. (1984). Clinical diagnosis of Alzheimer’s Disease: Report of the NINCDS-ADRA work group under the auspices of Department of Health and Human Services Task force on Alzheimer’s Disease. Neurology, 34, 939–944. [DOI] [PubMed] [Google Scholar]
- Miller E (1971). On the nature of the memory disorder in presenile dementia. Neuropsychologia, 9(1), 75–81. doi: 10.1016/0028-3932(71)90064-9 [DOI] [PubMed] [Google Scholar]
- Morris JC. Clinical Dementia Rating: Current version and scoring rules. Neurology. 1993;43:2412–2414. [DOI] [PubMed] [Google Scholar]
- Mormino EC, Papp KV, Rentz DM, Donohue MC, Amariglio R, Quiroz YT, … Sperling RA. (2017). Early and late change on the preclinical Alzheimer’s cognitive composite in clinically normal older individuals with elevated beta-amyloid. Alzheimers Dement. doi: 10.1016/j.jalz.2017.01.018 [DOI] [PMC free article] [PubMed]
- Moss MB, Albert MS, Butters N, & Payne M (1986). Differential patterns of memory loss among patients with Alzheimer’s disease, Huntington’s disease, and alcoholic Korsakoff’s syndrome. Arch Neurol, 43(3), 239–246. [DOI] [PubMed] [Google Scholar]
- Papp KV, Rentz DM, Mormino EC, Schultz AP, Amariglio RE, Quiroz Y, … Sperling RA. (2017). Cued memory decline in biomarker-defined preclinical Alzheimer disease. Neurology, 88(15), 1431–1438. doi: 10.1212/wnl.0000000000003812 [DOI] [PMC free article] [PubMed] [Google Scholar]
- Rabin LA, Par√© N, Saykin AJ, Brown MJ, Wishart HA, Flashman LA, & Santulli RB (2009). Differential Memory Test Sensitivity for Diagnosing Amnestic Mild Cognitive Impairment and Predicting Conversion to Alzheimer’s Disease. Aging, Neuropsychology, and Cognition, 16(3), 357–376. doi: 10.1080/13825580902825220 [DOI] [PMC free article] [PubMed] [Google Scholar]
- Sarazin M, Berr C, De Rotrou J, Fabrigoule C, Pasquier F, Legrain S, … Dubois B (2007). Amnestic syndrome of the medial temporal type identifies prodromal AD: A longitudinal study. Neurology, 69(19), 1859–1867. doi: 10.1212/01.wnl.0000279336.36610.f7 [DOI] [PubMed] [Google Scholar]
- Sperling RA, Aisen PS, Beckett LA, Bennett DA, Craft S, Fagan AM, … Phelps CH (2011). Toward defining the preclinical stages of Alzheimer’s disease: recommendations from the National Institute on Aging-Alzheimer’s Association workgroups on diagnostic guidelines for Alzheimer’s disease. Alzheimers Dement, 7(3), 280–292. [DOI] [PMC free article] [PubMed] [Google Scholar]
- Schemper M, and Henderson R (2000). “Predictive Accuracy and Explained Variation in Cox Regression.” Biometrics 56:249–255. [DOI] [PubMed] [Google Scholar]
- Tierney MC, Szalai JP, Snow WG, & Fisher RH (1996). The prediction of Alzheimer disease. The role of patient and informant perceptions of cognitive deficits. Archives of Neurology, 53(5), 423–427. [DOI] [PubMed] [Google Scholar]
- Weingartner H, Kaye W, Smallberg SA, Ebert MH, Gillin JC, & Sitaram N (1981). Memory failures in progressive idiopathic dementia. J Abnorm Psychol, 90(3), 187–196. doi: 10.1037//0021-843x.90.3.187 [DOI] [PubMed] [Google Scholar]
- Welsh K, Butters N, Hughes J, Mohs R, & Heyman A (1991). Detection of abnormal memory decline in mild cases of Alzheimer’s disease using CERAD neuropsychological measures. Arch Neurol, 48(3), 278–281. doi: 10.1001/archneur.48.3.278. [DOI] [PubMed] [Google Scholar]