Abstract
Recent studies have demonstrated the effectiveness of simulation in radiology perceptual education. While current software exists for perceptual research, these software packages are not optimized for inclusion of educational materials and do not have full integration for presentation of educational materials. To address this need, we created a user-friendly software application, RadSimPE. RadSimPE simulates a radiology workstation, displays radiology cases for quantitative assessment, and incorporates educational materials in one seamless software package. RadSimPE provides simple customizability for a variety of educational scenarios and saves results to quantitatively document changes in performance. We performed two perceptual education studies involving evaluation of central venous catheters: one using RadSimPE and the second using conventional software. Subjects in each study were divided into control and experimental groups. Performance before and after perceptual education was compared. Improved ability to classify a catheter as adequately positioned was demonstrated only in the RadSimPE experimental group. Additional quantitative performance metrics were similar for both the group using conventional software and the group using RadSimPE. The study proctors felt that it was qualitatively easier to run the RadSimPE session due to integration of educational material into the simulation software. In summary, we created a user-friendly and customizable simulated radiology workstation software package for perceptual education. Our pilot test using the software for central venous catheter assessment was a success and demonstrated effectiveness of our software in improving trainee performance.
Keywords: Simulation, Perception, Education, Python, Software
Introduction
The use of simulation has blossomed over the past few decades with use in diverse fields from aviation training [1] to gaming [2]. Many studies using simulation have shown promising educational outcomes with respect to more traditional forms of education, such as lectures and books [3, 4]. Recent studies using simulation in radiology have demonstrated promising results [5, 6].
Educational simulation is increasingly becoming important in radiology for both training and assessment. To date, most education tools parallel the teaching paradigms used in classic radiology education, and focus on interpretive training over perceptual education [7]. However, an estimated 60–80% of radiology errors are attributable to perception errors, with only a minority related to interpretive error [8]. Furthermore, recent studies have demonstrated improved radiology performance after perceptual training, which used simulation based training [9, 10].
There are perceptual research software packages, but current software does not feature full integration of educational materials. For example, in studies we had previously conducted using conventional perceptual research software [11], trainees needed to switch between the perceptual software package and several desktop folders to access educational materials and other study documents. Additionally, trainees need to manually enter information in order to load each set of cases. Consequently, conducting a perceptual education session using existing perceptual software is relatively labor intensive on the part of the proctors and trainees, which can lead to errors.
The goal of this research endeavor is to build a customizable software application that simulates a radiology workstation, integrating perception education, and quantitative assessment. We sought to create a fully integrated design that does not require extensive instruction to be provided to the trainee by the instructor, one that is easily customizable for different radiology educational goals and one that allows easy collection of data for further analysis. We consequently developed a Radiology workstation Simulator for Perceptual Education (RadSimPE) described in greater detail below. To show the utility of this software, subject learning was assessed based on their ability to characterize central venous catheters after training using RadSimPE and compared to performance after training using conventional perceptual software.
Materials and Methods
Development of Software
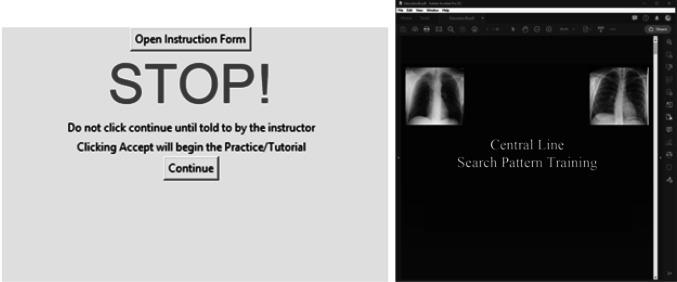
We developed a standalone executable program in Python, RadSimPE, to serve as our simulation environment that can be used on any PC running on the Microsoft (Redmond, WA, USA) Windows operating system, without additional software. The program reads in customizable script files in text/CSV (comma separated value) format, which can be readily read and edited by the instructor. Using a customizable script file allows the simulation environment to be easily changed for new educational paradigms. Additionally, consent, instruction, and educational material can be directly opened from the program. An example of the integrated educational materials is shown in Fig. 1. For the presented study, we used educational documents saved as PDF (portable document format) files.
Fig. 1.
Integrated feature in the RadSimPE program that allows the user to access educational materials
An outline for the key abilities of the RadSimPE software is provided below.
Unique user username and password
Displays a consent document to the trainee
Provides instruction documents for operating the RadSimPE software
Provides instruction documents for the educational session
Provides image manipulation controls similar to a clinical radiology workstation including window/level, pan, and zoom
Shows multiple sets of radiology cases
Allows the user to mark target lesions and answer configurable questions
Provides perceptual education materials between sets of cases
Saves quantitative educational metrics in text/CSV format
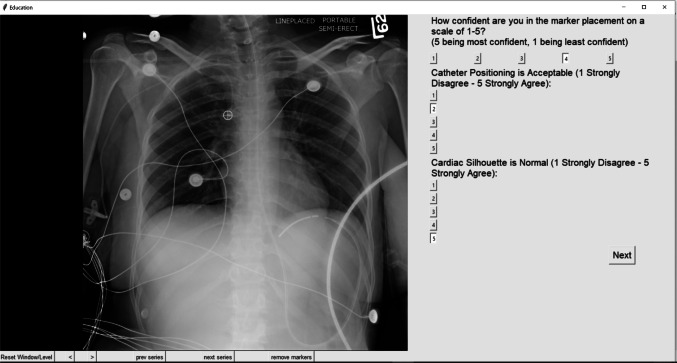
Medical images are loaded from a folder provided by the instructor. Accepted image file formats include DICOM (Digital Imaging and Communications in Medicine) and PNG (Portable Network Graphics). A number of tools for interacting with images are available including window/level, zoom, scrolling through an exam in slow and fast speed, viewing two images from the same study side by side (for example both a frontal and lateral projection of a chest radiograph or both axial and coronal series from a CT), and scout line for three-dimensional images. An example of the RadSimPE interface for the educational module on central venous catheter assessment is shown in Fig. 2. If the user exits the program, they may resume from where they left off. By editing a study script in text/CSV format, an instructor can customize a series of questions they want the trainee to answer for each case.
Fig. 2.
Example case from RadSimPE
Experimental Validation of Our Software Using a Central Venous Catheter Educational Module
This study was approved by our institutional review board. For the pilot test of this software, we focused on training and proficiency in assessing central venous catheter positioning. We compared two different perception training studies performed on separate dates and with different cohorts of participants. Subjects enrolled in each study based on their academic schedule and ability to participate. One session used our software RadSimPE and the other used a conventional perceptual software (CPS) package, ViewDEX [11]. Our purpose was to establish that our software was at least equally effective and more convenient compared to CPS.
For the CPS study, 14 physician assistant students voluntarily participated, with 7 subjects in both the control and experimental groups. For the RadSimPE study, 41 physician assistant students voluntarily participated, with 21 subjects in the control group and 20 subjects in the experimental group. The two groups were distinct and had roughly equivalent amounts of prior radiology education. For each study, the same counterbalanced design was used as is illustrated in Fig. 3, allowing educational interventions to be offered at different times for different groups. Using this design, the efficacy of the educational intervention could be examined, and all participants received the same educational materials by the completion of the educational session.
Fig. 3.
Experimental design. Intro, introductory materials; CS, case set; Atnl Ctrl, attentional control; PT, perceptional training; Survey, post study survey
Other than differences in sample size, the only significant difference between the CPS and RadSimPE studies was the software used to conduct the training. The degree of prior radiology training was similar for each group. For the purposes of clarity, control and experimental groups will refer to the groups within each study. When comparing the RadSimPE study and the CPS study, each study will be referred to by the software used for training.
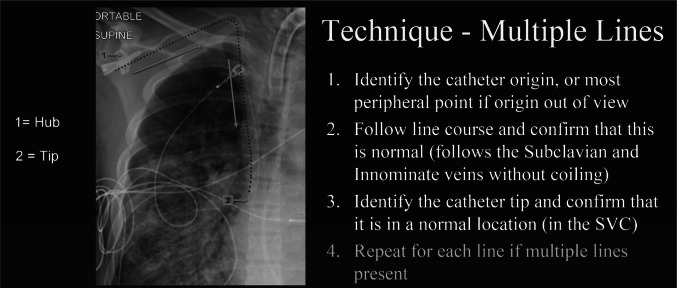
Between case sets 1 and 2, the experimental group was given perceptual training materials on central venous catheter positioning; the key educational slide is shown in Fig. 4, while the control group was given an attentional control. The attentional control used in this test was an article on chest radiograph imaging in the intensive care unit [12]. In order to ensure a comparable educational experience for all the participants, the educational materials were switched between case sets 2 and 3. Each case set consisted of 20 unique chest radiographs, chosen randomly from a larger pool of chest radiographs. Feedback was not given until the end of the entire study, at which point answers were reviewed with the trainees.
Fig. 4.
Example of perceptual education materials
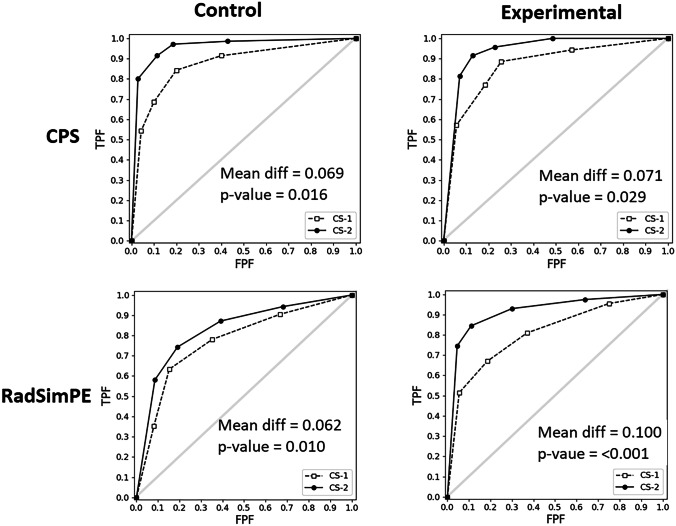
For each individual, the following metrics were computed: accuracy of their localization marking (CorLoc), assessment of whether the catheter position was safe (SafePos), and level of confidence in catheter tip localization (ConfLoc). CorLoc was computed using localization receiver operating characteristic (LROC) analysis and SafePos was computed using receiver operating characteristic (ROC) analysis. The figure of merit for ConfLoc was the mean value of the response. For both the experimental and control groups, the area under the curve was calculated via trapezoid method for ROC and LROC curves for case sets 1 and 2. The pre-education and post-education metrics were compared with non-parametric bootstrap analysis utilizing 1000 bootstrap iterations. The threshold for statistical significance was set for a type I (α) error of 0.01.
Survey
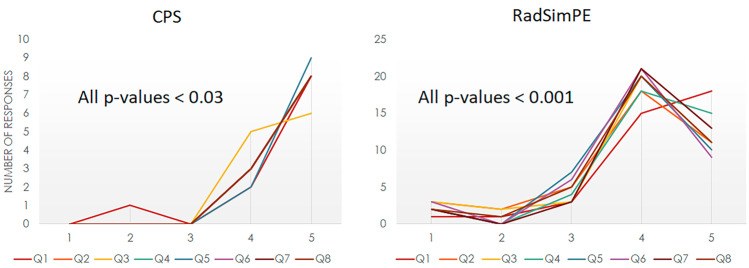
At the end of each course, trainees completed an anonymous survey about their experience with the software. Users were asked to evaluate their experience with the software. Survey response options followed a Likert response format. Survey items are listed in Table 2.
Table 2.
List of survey questions
| Question 1 | In my prior course work and self-study, I have not been shown specific eye movement patterns for evaluation of line/tube positioning on CXRs |
| Question 2 | The search pattern training was helpful for learning the skill needed to evaluate line/tube positioning on CXR |
| Question 3 | The search pattern training helped me feel more confident about my ability to identify line/tube positioning on CXR |
| Question 4 | Search pattern training for other medically relevant abnormalities would be a helpful way to learn about additional topics in radiology |
| Question 5 | The simulated radiology workstation (SRW) used for this study was helpful for learning the skills needed to evaluate line/tube positioning on CXR |
| Question 6 | Compared with conventional learning material s (including printed/electronic textbooks and case files), the SRW provided a more effective way to develop the skills needed to evaluate line/tube positioning on CXR |
| Question 7 | SRW would be a helpful way to learn about additional topics in radiology |
| Question 8 | Participation in this study was an overall positive experience |
Results
Analysis of Catheter Tip Localization Accuracy, Safe Position Assessment, and Confidence in Localization
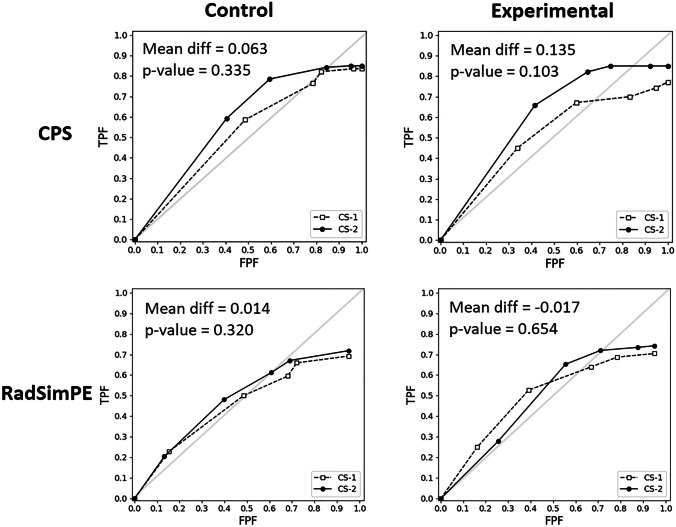
In our central venous catheter education study groups, all participants were able to successfully complete the educational modules. Improved ability to classify a catheter as adequately positioned was demonstrated only in the RadSimPE experimental group. In both CPS and RadSimPE studies, there was no significant improvement in correct localization of catheter tip. Both studies demonstrated statistically significant improvement in confidence in localization. Results are tabulated in Table 1 and graphically displayed in Figs. 5 and 6.
Table 1.
Summary of statistics for correct localization of catheter tip (CorLoc), assessment of safe catheter positioning (SafePos), and confidence in localization accuracy (ConfLoc) for CPS study (above) and RadSimPE study (below)
| CorLoc | SafePos | ConfLoc | |
|---|---|---|---|
| CPS | |||
| Control mean difference | 0.063 | 0.069 | −.064 |
| Control p-value | 0.335 | 0.016 | 0.687 |
| Experimental mean difference | 0.135 | 0.071 | 0.386 |
| Experimental p-value | 0.103 | 0.029 | < 0.001 |
| RadSimPE | |||
| Control mean difference | 0.014 | 0.062 | −.112 |
| Control p-value | 0.32 | 0.01 | 0.882 |
| Experimental mean difference | −.017 | 0.1 | 0.303 |
| Experimental p-value | 0.654 | < 0.001 | < 0.001 |
Fig. 5.
LROC analysis of correct localization (CorLoc) in control and experimental groups in CPS (conventional perceptual software) study versus RadSimPE study
Fig. 6.
ROC analysis of safe positioning (SafPos) in control and experimental groups in CPS (conventional perceptual study) study versus RadSimPE study
Mean differences in AUC values between the RadSimPE and CPS training were computed to best evaluate for changes in subject performance, as they succinctly summarized the ensemble of ROC curves. The results demonstrate that there was significantly improved performance in identifying a catheter position as safe in the RadSimPE study, but not in the CPS study. There was significantly improved performance in localization confidence in both CPS and RadSimPE studies. Neither study demonstrated significantly improved catheter tip localization. The control groups did not statistically improve in any metric in either of the studies, suggesting against increased practice resulting in better performance.
Informal qualitative feedback was collected from proctors who participated in both CPS and RadSimPE studies. They noted that RadSimPE was easier to proctor with fewer proctors needed. Study proctors subjectively stated that it was easier to conduct the study with fewer people using RadSimPE relative to CPS. Additionally, the participants in the CPS study had several questions about using the software, while there were notably fewer software related questions in the RadSimPE session.
Survey Data
Surveys were provided to the trainees to assess their subjective perceptions of their experience with the RadSimPE study software. Survey responses followed a Likert response format from 1 to 5, with 1 = strongly disagree … 3 = neutral … 5 = strongly agree. A total of 14 of 14 subjects in the CPS study and 40 of the 41 participants filled out the survey. The aggregate of subjective survey responses was overall positive in both CPS (all p-values < 0.03) and RadSimPE (all p-values < 0.001) studies. Survey questions are shown in Table 2, and survey responses are summarized in Fig. 7.
Fig. 7.
Survey responses for CPS (conventional perceptual software) and RadSimPE based on questions in Table 2. Both demonstrated positive experiences
Discussion
We developed RadSimPE as a standalone customizable software designed for perception education and research. RadSimPE allows a small number of proctors to train a large number of students in a short period of time. RadSimPE provides a user-friendly, fully digital simulation environment for radiology education with easy customizability, quantitative data collection, and minimal instructor intervention. The easy customizability allows an instructor to choose their own educational materials, medical images, and case-specific assessment questions.
Compared to currently existing perceptual research software, RadSimPE allows the trainee to use the application uninterrupted, as the user does not need to switch between programs, files, and folders. Additionally, RadSimPE stores data from trainees for easy quantitative analysis, lending itself to educational research.
Our study showed subjects performed better using RadSimPE on some, but not all metrics. There was improvement in the RadSimPE experimental group in assessment of safe position, but not in identification of catheter tips. This likely reflects the obscuration of the tips by hardware or soft tissues. While the trainees were unable to identify the tips correctly, they were still able to determine that the catheters were not positioned in an unsafe manner. There are additional qualitative differences in ROC curves, which are not statistically significant given the sample sizes for each group. There are small baseline differences in subject performance in both the RadSimPE and CPS groups, which may be due to differences in radiology knowledge and exposure prior to the beginning of the study.
Survey responses were very positive for both the RadSimPE and CPS groups. Notably, in the CPS study survey free text comment section, trainees expressed concerns about the software design, despite positive comments about the educational content. There were no complaints about software design for RadSimPE. Consequently, we feel our study shows that when used for perceptual education, RadSimPE performed better than the CPS tested in our study.
This study had several limitations. One was unequal sample sizes in the RadSimPE and CPS groups. This difference in sample sizes was based on availability of subjects at the times the studies were performed. Additionally, the smaller group size in the CPS group increases variance and may explain some of the lower p-values in that group, particularly in the surveys. Differences in group composition and size may account for some of the qualitative differences in ROC curves. It is also possible that there are differences in the two groups that are below the limits of resolution for the sample sizes in this study. There may be some small differences in baseline performance between the RadSimPE and CPS groups, but the main metric of interest is change in performance after training. Also, only one radiology educational topic was considered for this pilot study. Our group intends to explore using the RadSimPE software package for additional educational topics in the future.
Future directions include integrating surveys into the program for a more fully streamlined experience. Additionally, we are working on the application of gamification — adding game elements into the simulation experience — to provide a more enjoyable and potentially memorable experience for the users.
Conclusions
Our new radiology simulator for perceptual education, RadSimPE, offers a fully digital simulation software package for radiology perceptual education. The program is user friendly and requires minimal instructors input for an educational session. Quantitative educational results show that our software performs as well or better than conventional perceptual software. Student and proctor feedback suggests that integration of educational materials and simulated cases was preferable to conventional perceptual software packages. In summary, we feel that our RadSimPE software is a customizable and easy to use adjunct to conventional radiology educational materials.
Acknowledgements
We would like to thank the volunteers who participated in our study.
Declarations
Conflict of Interest
The authors declare no competing interests.
Footnotes
Publisher's Note
Springer Nature remains neutral with regard to jurisdictional claims in published maps and institutional affiliations.
References
- 1.Allerton D. Principles of flight simulation. John Wiley & Sons; 2009.
- 2.Zyda M. From visual simulation to virtual reality to games. Computer. 2005;38(9):25–32. doi: 10.1109/MC.2005.297. [DOI] [Google Scholar]
- 3.Barry Issenberg S, Mcgaghie WC, Petrusa ER, Lee Gordon D, Scalese RJ. Features and uses of high-fidelity medical simulations that lead to effective learning: a BEME systematic review. Medical teacher. 2005;27(1):10–28. doi: 10.1080/01421590500046924. [DOI] [PubMed] [Google Scholar]
- 4.Smith HM, Jacob AK, Segura LG, Dilger JA, Torsher LC. Simulation education in anesthesia training: a case report of successful resuscitation of bupivacaine-induced cardiac arrest linked to recent simulation training. Anesthesia & Analgesia. 2008;106(5):1581–1584. doi: 10.1213/ane.0b013e31816b9478. [DOI] [PubMed] [Google Scholar]
- 5.Sica G, Barron D, Blum R, Frenna T, Raemer D. Computerized realistic simulation: a teaching module for crisis management in radiology. AJR American journal of roentgenology. 1999;172(2):301–304. doi: 10.2214/ajr.172.2.9930771. [DOI] [PubMed] [Google Scholar]
- 6.Mirza S, Athreya S. Review of simulation training in interventional radiology. Academic Radiology. 2018;25(4):529–539. doi: 10.1016/j.acra.2017.10.009. [DOI] [PubMed] [Google Scholar]
- 7.Kundel HL. History of research in medical image perception. Journal of the American college of radiology. 2006;3(6):402–408. doi: 10.1016/j.jacr.2006.02.023. [DOI] [PubMed] [Google Scholar]
- 8.Bruno MA, Walker EA, Abujudeh HH. Understanding and confronting our mistakes: the epidemiology of error in radiology and strategies for error reduction. Radiographics. 2015;35(6):1668–1676. doi: 10.1148/rg.2015150023. [DOI] [PubMed] [Google Scholar]
- 9.Auffermann WF, Little BP, Tridandapani S. Teaching search patterns to medical trainees in an educational laboratory to improve perception of pulmonary nodules. Journal of Medical Imaging. 2015;3(1):011006. [DOI] [PMC free article] [PubMed]
- 10.Auffermann WF, Krupinski EA, Tridandapani S. Search pattern training for evaluation of central venous catheter positioning on chest radiographs. Journal of Medical Imaging. 2018;5(3):031407. [DOI] [PMC free article] [PubMed]
- 11.Håkansson M, Svensson S, Zachrisson S, Svalkvist A, Båth M, Månsson LG. ViewDEX: an efficient and easy-to-use software for observer performance studies. Radiation protection dosimetry. 2010;139(1–3):42–51. doi: 10.1093/rpd/ncq057. [DOI] [PubMed] [Google Scholar]
- 12.Bentz MR, Primack SL. Intensive care unit imaging. Clinics in chest medicine. 2015;36(2):219–234. doi: 10.1016/j.ccm.2015.02.006. [DOI] [PubMed] [Google Scholar]


