Abstract
Retinopathy of prematurity (ROP) is a potentially blinding disorder seen in low birth weight preterm infants. In India, the burden of ROP is high, with nearly 200,000 premature infants at risk. Early detection through screening and treatment can prevent this blindness. The automatic screening systems developed so far can detect “severe ROP” or “plus disease,” but this information does not help schedule follow-up. Identifying vascularized retinal zones and detecting the ROP stage is essential for follow-up or discharge from screening. There is no automatic system to assist these crucial decisions to the best of the authors’ knowledge. The low contrast of images, incompletely developed vessels, macular structure, and lack of public data sets are a few challenges in creating such a system. In this paper, a novel method using an ensemble of “U-Network” and “Circle Hough Transform” is developed to detect zones I, II, and III from retinal images in which macula is not developed. The model developed is generic and trained on mixed images of different sizes. It detects zones in images of variable sizes captured by two different imaging systems with an accuracy of 98%. All images of the test set (including the low-quality images) are considered. The time taken for training was only 14 min, and a single image was tested in 30 ms. The present study can help medical experts interpret retinal vascular status correctly and reduce subjective variation in diagnosis.
Keywords: Retinopathy of prematurity(ROP), Automatic zone detection, Machine learning, Artificial Intelligence, Segmentation, U-Net
Introduction
Retinopathy of prematurity (ROP) is one of the important causes of vision impairment in premature infants that weigh less than 1750 g and are born before 34 weeks of gestation (full-term length of pregnancy is 38–42 weeks) [1]. Out of 15 million premature births worldwide, 53,000 children require ROP treatment every year. In India, 200,000 out of 3.5 million premature infants are at the risk of developing ROP [2]. Additionally, the percentage of premature births in rural and inaccessible parts of the country is higher due to various challenges, including the unavailability of good healthcare services and doctors. It is very challenging to get the proper diagnosis and treatment for the ROP-affected babies in such cases.
The tissue at the back of the eye is called the retina, which is affected in ROP. In this disease, blood vessels grow unregulated and in the wrong direction on the baby’s retina. Primary prevention of ROP can be done by improving neonatal care, and secondary prevention is through early detection and treatment of the disease [3]. Since the disease has no outward signs, it is not seen in a cursory examination by ophthalmologists. They need to screen “at risk” babies using a special digital wide-field camera like Retcam (Clarity MSI, US)/Neo (Forus Healthcare, Bangalore, India) camera [4] or binocular indirect ophthalmoscope. The advantage of camera-based screening is that this can be used by trained paramedical staff. Ophthalmologists can grade these images at base hospitals without traveling to neonatal care units where preterm babies are often hospitalized. Screening is performed to determine the likelihood of having the disease. Screening by the ROP specialists at early stages can prove useful in early treatment and subsequent disease control [5].
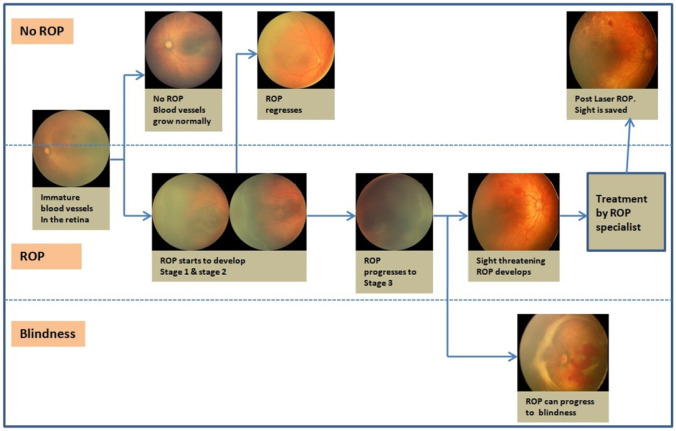
As shown in Fig. 1 [6], immature vessels in an infant’s retina grow completely without ROP development or progress to various ROP stages. Stages 1, 2, or 3 ROP can regress spontaneously with subsequent vessels’ natural growth in some infants. When ROP progresses to stage 3 with Plus disease, it must be treated to save the baby’s sight. Otherwise, it may lead to stages 4 and 5 (retinal detachment), leading to blindness. Timely screening is important to monitor the progress of the stages.
Fig. 1.
ROP regression and progress
Unfortunately, very few ROP specialists are available in India, around 150 [7]. Even among the experts’ diagnosis of level, ROP can be highly subjective. Computer-aided systems are developed for screening to assist medical experts [8]. An automatic ROP screening system can save time for ophthalmologists and provide the opportunity to focus on critical cases requiring treatment. Efficient and effective screening by an automated system can ensure that babies are treated on time and blindness is prevented. Increasing the number of blinding ROP cases [9] and the impact of this blindness on families [10] makes a strong case for inventing newer automated systems for ROP screening.
The severity of ROP is determined by the zones of retina involved and stages. The retina is divided into three zones, and ROP has five stages. Stages are identified from clinical features such as ridge and blood vessels. A thin demarcation line that separates the vascular and avascular retina indicates stage 1, as shown in Fig. 2a. When this line grows thicker into a ridge, it is called stage 2 (Fig. 2b). In stage 3, extraretinal fibrovascular proliferation from the ridge occurs (Fig. 2c). Stages 4 and 5 indicate partial and total retinal detachment, respectively. “Plus disease” is identified by increased tortuosity and dilation of blood vessels in the retina’s most central part.
Fig. 2.

a Stage1, b stage 2, c stage 3
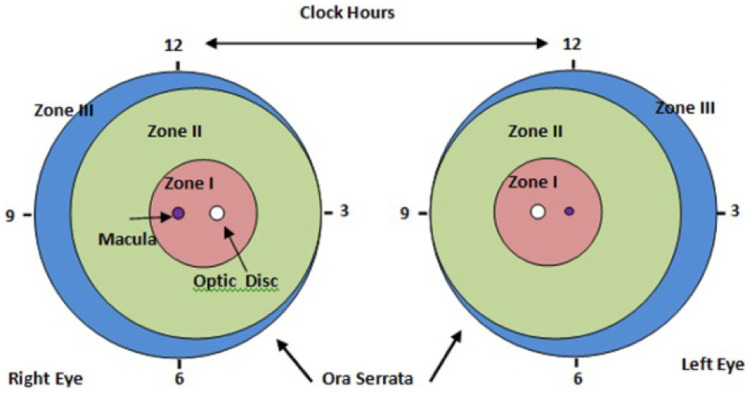
Zones are identified from the optic disc (OD) and macula location with developing retinal blood vessels, as shown in Fig. 3. Zone I is the innermost zone and defined as a circular area around the optic disc with a radius twice the distance from the optic disc to the macula. Zone II is defined as the large circular area around zone I in the direction of retinal vessels. The circle has a radius extending from the optic disc to the nasal Ora Serrata. The remaining retina beyond zone II is defined as zone III and mostly represents the most peripheral temporal retina [11].
Fig. 3.
Standard form for documenting zone
Depending on zones vascularized and stages observed, the patient’s schedule for follow-up is decided, as shown in Table 1. Infants with vessels reaching zone III are seldom affected by ROP and often do not require treatment even if ROP develops. However, it is important to detect zone I and zone II accurately. Identification of optic disc, macula, and blood vessels is necessary for zone detection as their features like tortuosity, dilation, and the width of blood vessels are used to diagnose ROP. It is a challenging task as the retina’s vascular structure is not completely developed in premature babies.
Table 1.
Follow-up schedule
| Sr. no | Zone and stage of ROP | Follow-up duration |
|---|---|---|
| 1 | Zone I, any stage | Once a week or earlier |
| 2 | Zone II, stage 2 or 3 | Once in a week |
| 3 | Zone III | Once in 2–3 weeks |
The existing automated screening systems detect the ROP diseases as “Yes/No ROP” or “Mild/Severe ROP” and presence/absence of “Plus disease.” Identification of all zones and stages of ROP is required in management decisions (“when to discharge a baby from ROP screening follow up”) by a specialist. It is a crucial decision as an early discharge may mean the baby can still develop a vision-threatening disease, and not discharging on time may mean an unnecessary burden on an ophthalmologist. Such a system has not been reported in the literature [12].
Deep learning techniques such as Convolutional Neural Network (CNN) [13] are rapidly proving to be the state-of-art foundation in medical imaging. They are fast and accurate because of automatic feature extraction. The main challenge in medical image analysis is the unavailability of large training data sets and annotations for these images. The scarcity of labeled data in medical imaging can be overcome by using deep belief networks such as Generative Adversarial Networks and U-Networks [14, 15]. U-Net is a CNN that can be trained with fewer images to get high dice coefficient scores in medical image segmentation [16].
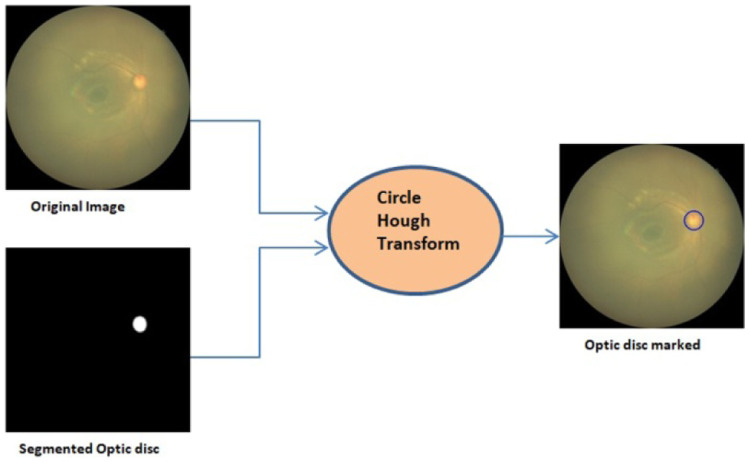
This paper proposes a novel method using an ensemble of “U-Network” and “Circle Hough Transform” to identify zones I, II, and III with optic disc and blood vessel segmentation. The macula may or may not be visible in the images. The segmented optic disc was marked on the original images with the Circle Hough Transform during the post-processing. This work’s novelty estimated the macula center location required to calculate zone distances from the center of these optic discs and marked zone I and zone II. Zone III is beyond zone II temporally, for which the images are captured by positioning the camera probe at a different angle, and in this optic disc is not seen. Our model detects the images that do not have optic discs, with a specificity of 100%.
In summary, the contribution of this work is:
Development of a novel assistive framework based on an Ensemble of U-Network and Circle Hough Transform and for identifying zones I, II, and III in fundus images of premature infants
Estimation of macula center location from the optic disc center in the images where the macula is undeveloped
Identification of zones from the location of the optic disc with developing retinal blood vessels irrespective of visibility of macula in the image
Development of the segmentation framework for optic disc and blood vessels using two separate U-networks to mark the zones
Development of four ROP datasets (not available publicly) from the data collected from different imaging systems (Retcam and Neo)
Preparation of ground truths for segmentation of optic disc and blood vessels
The rest of this paper is organized as follows. “Prior Work” section is the review of previous work done. “Datasets” section describes the datasets used. The methodology for segmentation of optic disc, blood vessels, detecting macula center location, and zone marking is described in the “Methodology” section. Experimental results are in the “Results” section, discussions in “Discussion and Limitations” section followed by the conclusion in “Conclusion” section.
Prior Work
The study of ROP and subsequent computer-aided diagnostic tools for ROP screening has been of interest to researchers worldwide. Traditional image processing and machine learning algorithms were developed for ROP screening using small datasets of images [17, 18]. Their limitation was that they were time-consuming and not accurate for complex problems as they use hand-crafted features. With the increasing number of images in the dataset and GPU availability, Deep learning is becoming popular in medical imaging. Unlike traditional Machine Learning algorithms, Deep learning allows machines to solve complex problems with higher accuracy even if the data set is very diverse and unstructured. A deep learning network learns high-level features of the data incrementally and eliminates the need for human expertise.
A deep neural network (DNN) based approach is proposed to detect ROP to assist the human expert in the ROP screening system [19–21]. The first automated system to detect ROP was developed using convolution Neural Networks (CNN) [22] to assist clinicians in ROP detection. A novel architecture of CNNs was proposed to detect ROP and its severity [23]. It consists of a sub-network to extract the features and a feature aggregate operator to bind these features from various input images. Deep learning with U-Net architecture for vessel segmentation was used [24] to detect No ROP/ROP with pre-plus disease. DeepROP, an automated ROP detection system, was developed [25] using two specific DNN models: Id-Net was developed to identify ROP. Gr-Net was developed for ROP grading tasks. Two separate datasets, viz. identification dataset and grading dataset, were designed for the models. The DNN classifier was trained via a transfer learning scheme [26]. The authors used features automatically extracted by the pre-trained models, namely, AlexNet, VGG-16, and GoogLeNet trained on ImageNet for classification. A deep learning framework was also developed to detect zone I from RetCam images having both optic disc and macula [27].
Currently, the system that can help clinicians decide on the “time of discharge” from ROP screening is not available. It is a crucial decision, and one needs to balance between not missing vision-threatening ROP and avoiding the burden of unnecessary screenings finely. The decision to “discharge” depends on the status of retinal vascularization in zone III. We develop a novel method for zones I, II, and III detections using an ensemble of Circle Hough Transform and optic disc and blood vessel segmentation from retinal fundus images of premature babies. These images need not have a macula visible in them. We estimated the macula location in such images after the optic disc segmentation.
Segmentation of optic disc and blood vessels is challenging due to the complexity and non-uniform illumination of the retinal images and not reported in the literature on ROP datasets. Still, for Diabetic Retinopathy, it has been implemented successfully using deep learning [28]. The publicly available datasets such as DRIVE, RIGA, DRISHTI-GS, and RIMONE were used, and the results were compared with that of state-of-art available. Segmentation of optic disc and cup was done using U-Net and its modifications for glaucoma detection [29–31]. Location and segmentation of optic disc were done using the optic disc as a salient object [32]. Optic disc segmentation was performed using a fully convolutional network with a depth map of retinal images [33]. The authors [34] modified the U-Net model with attention gates to segment the optic disc.
Blood vessel segmentation in retinal images was performed using a parallel fully convolved neural network [35]. It contained two networks: one for extracting thick vessels and the other for thin vessel extraction. Convolutional Neural networks (CNN) and support vector machine (SVM) were used together to segment the blood vessels [36]. Under-segmenting faint vessels and ambiguous regions in retinal images were improved, using a novel stochastic approach proposed [37] to train two deep neural networks. The U-Net architecture was proposed for simultaneous discrimination of retinal arteries-veins and vessel extraction [38].
ROP datasets are not available publicly. Available algorithms for detecting the severity of ROP are primarily based on private data of Retcam images and only report zone I’s detection. We have prepared our datasets from heterogeneous images of Retcam and Neo cameras. We will make them available publicly after completing this work.
Datasets
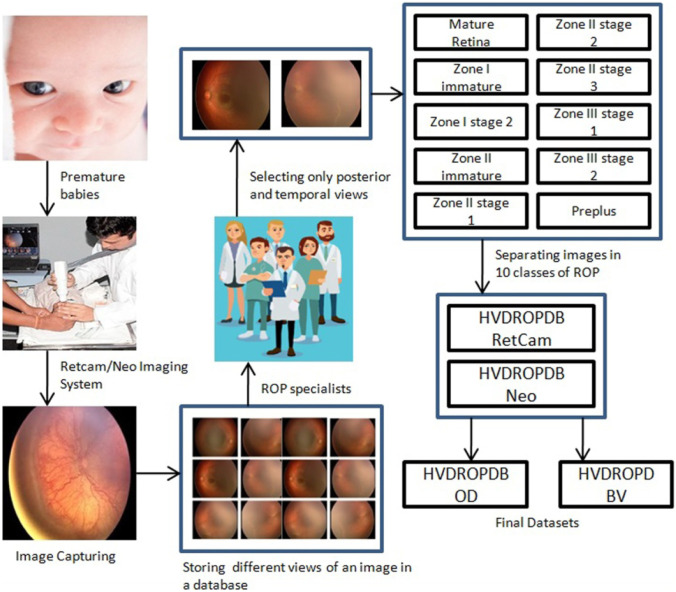
The process of dataset preparation is as shown in Fig. 4. Fundus images were captured by the technicians using Retcam (image size 640 × 480) and Neo camera (image size 2040 × 2040) from PBMA’s H.V. Desai Eye Hospital in Pune. The images of Retcam were more than that of Neo as the hospital has started using Neo cameras recently, whereas Retcam was used for many years. These images were obtained by the temporal, posterior, superior, nasal, inferior view (per eye images 2 to 12) to thoroughly observe an infant’s eye as shown in Fig. 5. A total of 10,000 Retcam images (left and right eye) of 900 patients were collected with gestation ages of 26–60 weeks and birth weight < 3000 g. The images were annotated in detail, specifying zones and stages by a team of 5 trained and experienced ROP specialists. We needed only posterior and temporal views of the image for this work, thus excluding 8100 images from the dataset. We got 1900 images of Retcam with the posterior view and temporal view.
Fig. 4.
Flow diagram for dataset preparation
Fig. 5.
Different views of a fundus image
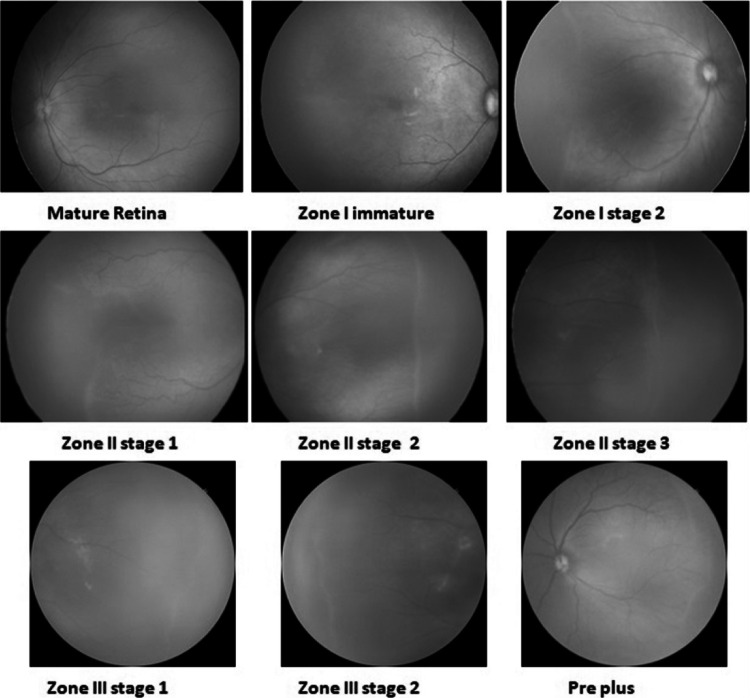
Similarly, we collected 1100 annotated Neo images of 300 patients. The images were labeled in ten ROP classes in detail, as shown in Fig. 6. The number of images in the “Mature retina” class was very high, whereas the number of images in “zone I stage 2” or “zone III stage 3” classes was very low.
Fig. 6.
Annotated ROP images
Then four datasets were prepared from these images as follows:
HVDROPDB Retcam dataset containing posterior and temporal view images of Retcam
HVDROPDB Neo dataset with posterior and temporal view images of Neo
HVDROPDB OD dataset having only posterior view images of Retcam and Neo for optic disc segmentation
HVDROPDB BV dataset containing posterior and temporal view images of Retcam and Neo for blood vessel segmentation.
HVDROPDB Retcam dataset contained 1000 posterior views and 900 temporal view Retcam images. HVDROPDB Neo dataset was prepared with a 550-posterior view and 550-temporal view Neo images. For optic disc segmentation, the HVDROPDB OD dataset was prepared with 1000 images by combining 650 posterior view images of HVDROPDB Retcam and 450 posterior view images HVDROPDB Neo selected randomly. As HVDROPDB OD dataset images were only with the posterior view and many of the images did not have clear vessels visible in them to prepare the ground truths, HVDROPDB BV was prepared with 121 posterior and temporal view images of HVDROPDB Retcam, and 129 images of HVDROPDB Neo selected randomly for blood vessel segmentation as shown in Table 2. These 250 images were then increased to 500 by augmenting them using Adobe Photoshop graphics editor. Ground truth preparation and Datasets splitting are done as follows:
Ground truths of 1000 images of the HVDROPDB OD dataset were prepared manually for optic disc segmentation using Adobe Photoshop graphics editor and verified by the ROP specialists’ team.
Ground truths of 250 images of the HVDROPDB BV dataset were prepared manually by tracing the vessels and verified by the ROP specialists’ team. It is a complex task and still in progress.
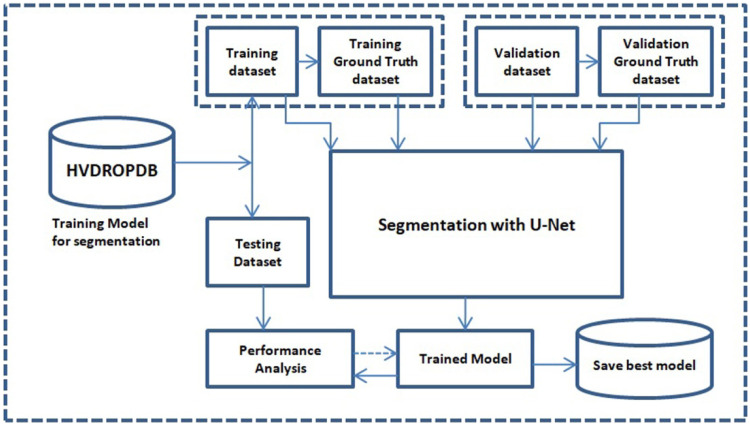
The HVDROPDB OD and HVDROPDB BV datasets and their ground truth datasets were then divided randomly into three sets: training, validation, and testing sets in ratio 70:15:15.
Table 2.
Datasets
| Dataset name | Size | Total images |
|---|---|---|
| HVDROPDB Retcam | 640 × 480 1900 | 1900 |
| HVDROPDB Neo | 2040 × 2040 | 1100 |
| HVDROPDB OD | (640 × 480) and (2040 × 2040) | 1000 |
| HVDROPDB BV | (640 × 480) and (2040 × 2040) | 250 |
Methodology
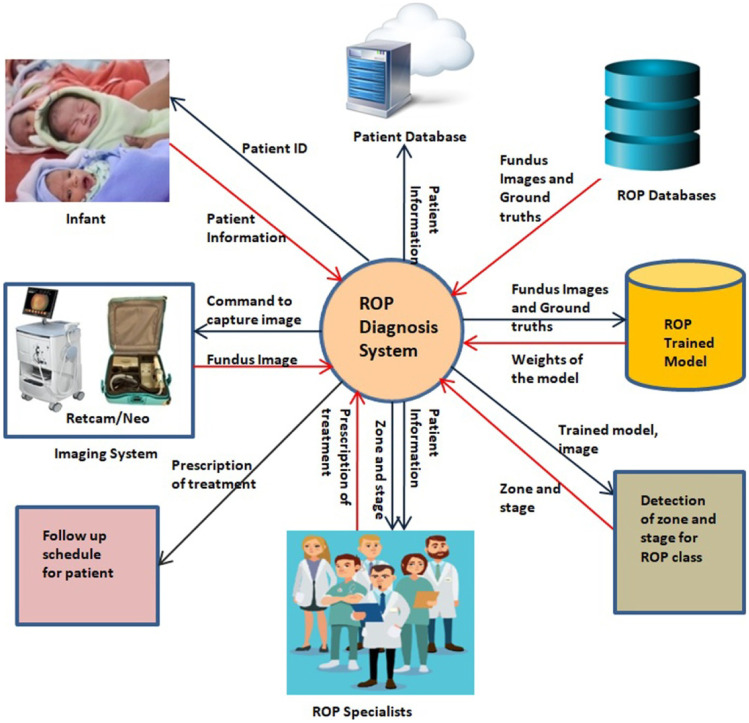
Figure 7 presents the broad view of the ROP diagnosis system. A Retcam/Neo imaging system captured the patient’s fundus images. The patient’s unique ID, name, age, weight, and other history were saved in the patient dataset with access only to the medical team. Image selection and annotation are done with the help of ROP specialists. ROP datasets are prepared according to the annotation. They are partitioned into training, validation, and testing sets. The ROP models are trained to segment optic disc, blood vessels using the train sets. The weights of these trained models will be used to detect zones and stages from the test sets. ROP specialist will read these details provided by the system and the patient’s history and prescribe him/her the next screening schedule. The updated data are in the patient’s dataset. Thus, regular screening from the early stages will be useful in early treatment prescription and subsequent control of the disease, as shown in Fig. 1.
Fig. 7.
ROP system architecture
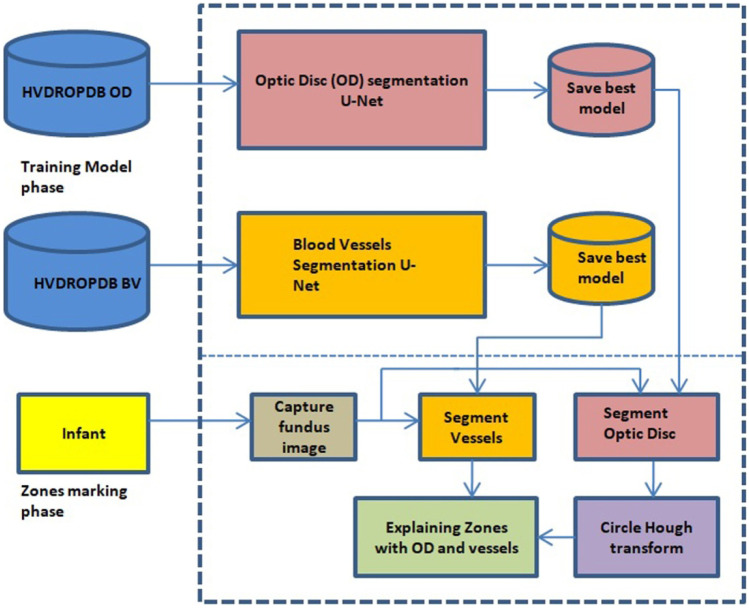
We have divided the work into two parts: (a) zones I, II, and III detection and (b) detection of stages 1, 2, 3 from fundus images. The results will be combined to explain a class of ROP. In this work, we have developed a system to detect zones using U-Net and Circle Hough Transform. The detailed architecture is as shown in Figs. 8 and 9.
Fig. 8.
Zone detection system architecture
Fig. 9.
Segmentation process
As shown in Fig. 8, the zone detection system consists of two separate U-networks for the segmentation (Fig. 9) of the optic disc and blood vessels as the ground truths were different for both datasets. HVDROPDB OD and HVDROPDB BV datasets were used to train the two U-networks. Training models with the best accuracy were saved.
The infant’s image with a posterior view was captured and given to the saved models for testing. The segmented optic disc mask was then used to mark the optic disc on the infant’s image using Circle Hough Transform. The macula distance was calculated from the center of the optic disc, and then zone I was drawn as a circle with the optic disc as a center and radius equal to twice the distance between optic disc and macula. Similarly, zone II distance was estimated in terms of the distance between optic disc and macula. Zone III is beyond zone II temporally. Finally, the second U-net output, i.e., segmented blood vessels, was combined with the zones’ marked image.
U-Net Architecture
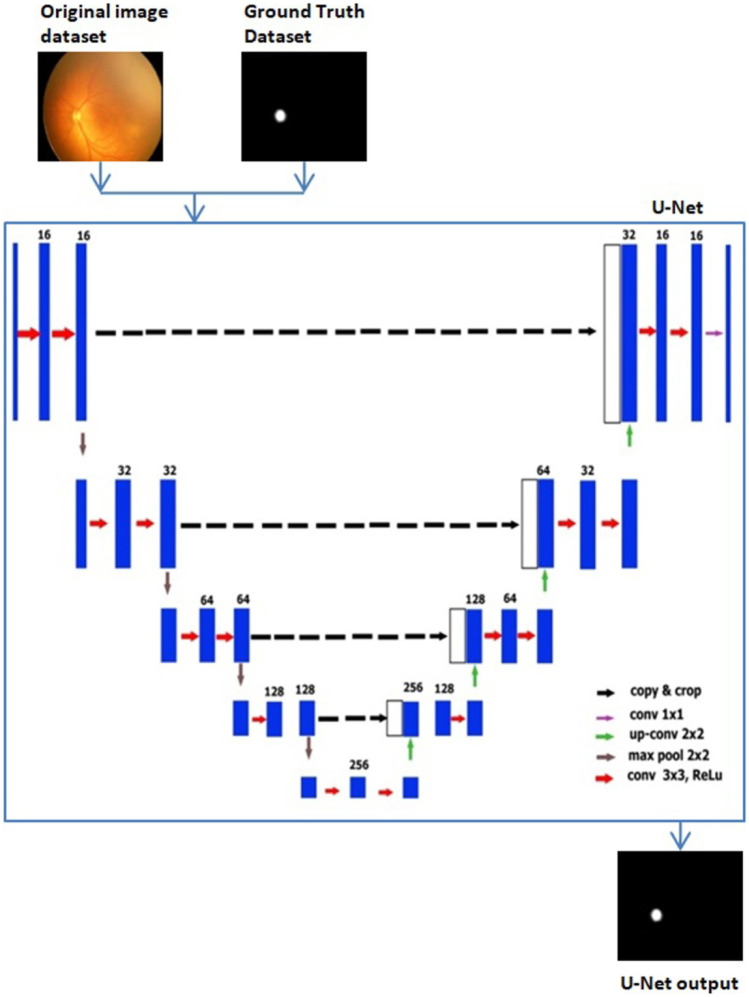
We used the original U-Net, with modified parameters and image size reduced to 128 × 128 × 3 for optic disc segmentation. U-Net is a fully connected network [15], and its architecture is symmetric like U, consisting of two parts: the contraction path and the expansion path. The contraction path is used to extract spatial features from the image, and the expansion path is used to construct the segmentation map from the encoded features. Convolution followed by max-pooling operations was performed for downsampling in the contraction path. We used a 3 × 3 kernel and 16 filters followed by a max-pooling layer of 2 × 2 which reduced the image size to 8 × 8 after the contraction path.
The expansion path performed the convolution transpose followed by concatenation and convolution operations to up-sample the feature maps, and we got an upsized original image of size 128 × 128. Sigmoid and ReLU activation functions were used in this architecture. The main advantage of U-Net is that it requires fewer images for training. U-Net architecture with input and output is as shown in Fig. 10.
Fig. 10.
U-Net architecture
U-net training began with an image of size 128 × 128 × 3, a kernel of size 3 × 3, a stride of 2, and the number of filters 16 applied to the first convolutional layer contraction path. The number of channels increased to 32 after the second convolutional layer. The next layer was the max-pooling layer, in which the size of the image was halved down to 64 × 64 × 32. This formula was repeated three times, which gave the image of size 8 × 8 × 256.
The first transposed convolution was applied to the image that doubled the image’s size and halved the number of channels (16 × 16 × 128) in the expansion path. This image’s concatenation was then performed with the contraction path’s corresponding image, which made the image size 16 × 16 × 256. After that, two convolution layers were added for upsampling. Again, this formula was repeated three times to get the image of the original size.
Circle Hough Transform
Zones are identified with the optic disc center, its radius, and macula center. The optic disc center location is important than its shape in ROP diagnosis. We used Circle Hough Transform to mark the optic disc detected by U-Net output on the original image, as shown in Fig. 11. Circle Hough Transform has been used in many commercial and industrial applications like object recognition, biometrics, and medical applications [39]. It is used to detect a circle’s parameters, i.e., center (a, b) and radius (r). Circle Hough Transform is based on the equation of a process and its parametric equations.
Fig. 11.
Marking of optic disc on the original image
To select the parameters such as the accumulator threshold for the detected circle centers, minimum and maximum circle radii in the HoughCircles function, experimentation was done on 100 images of HVDROPDB Retcam HVDROPDB Neo. The radius of the optic disc was observed in these images. Then minimum and maximum circle radii was varied from 10 to 40, and the outputs were monitored. If the accumulator threshold was kept small, it detected more false circles. If it was increased more, the actual circle was not shown. After testing on 100 images, again and again, these parameter values were fixed.
Macula and Zone Detection
After marking the optic disc, we found the macula center to draw zones on the image. As the macula is not developed fully in premature babies, it was not visible in many images. To find the macula’s location, we plotted the macula with the distance varying from 2.5 to 3.75 times the optic disc diameter on 50 nasal images of Retcam and Neo [40, 41]. Then, zone I was drawn as a circle with the optic disc as a center and radius equal to twice the distance between the optic disc and macula. Similarly, zone II distance was calculated and marked. Zone III is beyond zone II temporally. The senior ROP specialist with her team verified these distances repetitively and finally confirmed them according to the definition of ICROP. The macula’s location was decided as 3 × d (d is the optic disc diameter) for Retcam images, and for Neo images, it was determined as 2.75 × d. With these distances, zones I and II were marked on the original image.
Figure 12 demonstrates the optic disc indicated with the blue circle with center o, macula center m, and optic disc radius r. Zone I is displayed with the red arc, and zone II with the green curve. Zone III could not be marked on the image as it is beyond Zone II. For this, we tested the temporal view image in which the optic disc is not present, but zone III is seen (Fig. 6e–i). Marking the zones on these images is our ongoing work.
Fig. 12.
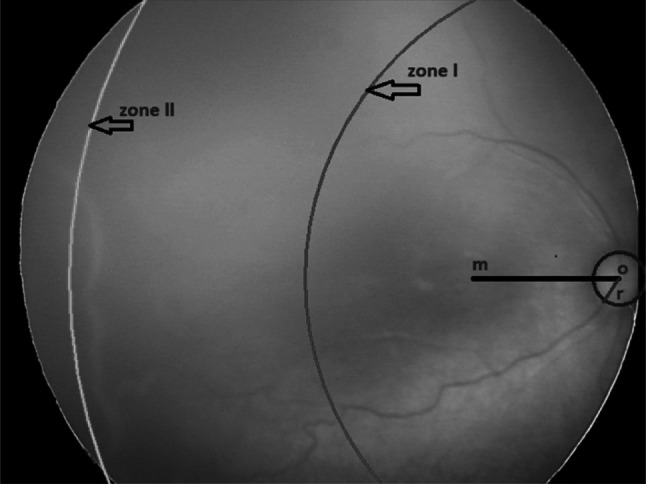
Marking of zones
U-Net for Blood Vessel Segmentation
We trained the second U-Net for blood vessel segmentation with the parameters described in the “U-Net Architecture” section and image size reduced to 256 × 256 × 3 for better accuracy. The blood vessels were detected clearly in most testing images even if the images were poor, as shown in Fig. 13. Figure 13a, c are original images, whereas Fig. 13b, d show their segmented blood vessels.
Fig. 13.
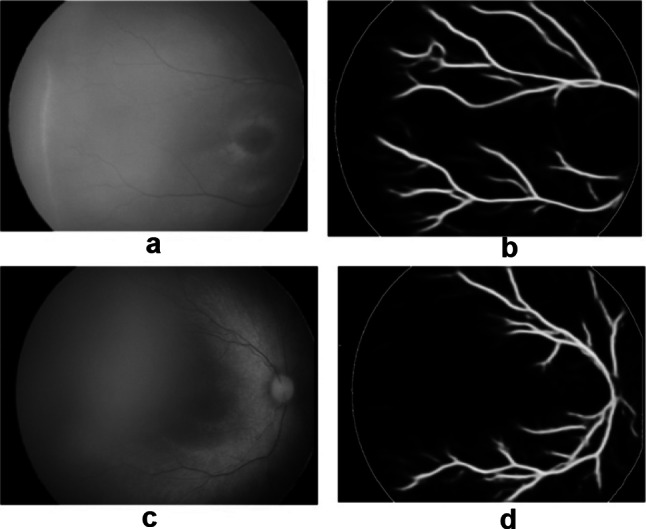
Blood vessel segmentation with U-Net: a, c original images, b, d segmented images
Finally, these U-net results were combined with the image in which zones were marked, as shown in Fig. 14. Original images (a, c, e) are shown with their corresponding outputs (b, d, f) in the figure.
Fig. 14.
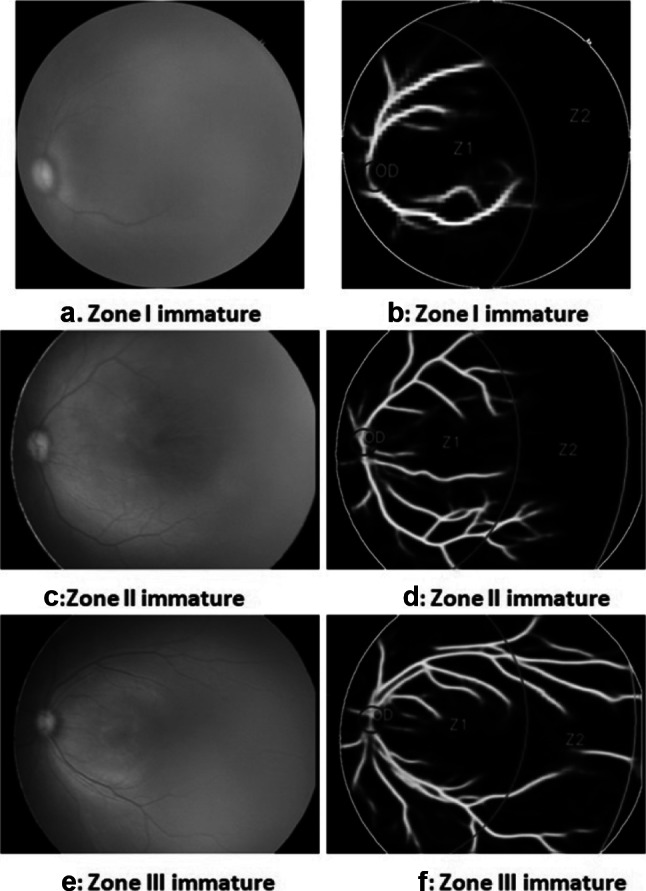
Zone detection with blood vessels. a, b Zone I immature. c, d Zone II immature. e, f Zone III immature
Results
Segmentation Using U-Nets
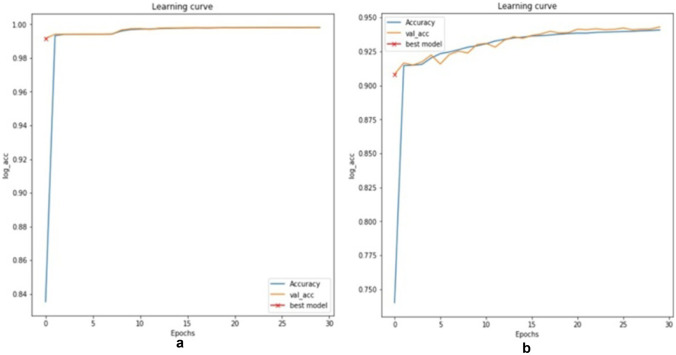
The two U-nets were trained using the training and validation set of HVDROPDB OD and HVDROPDB BV datasets. The number of training, validation, testing images, number of epochs, validation accuracy, and the time to train the models are shown in Table 3.
Table 3.
Validation accuracy and training time
| Dataset | Validation accuracy | No. of epochs | Training images | Validation images | Testing images | Training time |
|---|---|---|---|---|---|---|
| HVDROPDB OD | 0.998 | 50 | 700 | 150 | 150 | 4 min |
| HVDROPDB BV | 0.943 | 100 | 300 | 75 | 75 | 10 min |
Validation accuracy graphs are shown in Fig. 15a, b. The evaluation metrics such as true positive rate (TPR), true negative rate (TNR), false positive rate (FPR), false negative rate (FNR), precision, dice, and accuracy of segmentation were used for performance evaluation of the datasets [42].
Fig. 15.
Validation accuracy for a optic disc segmentation, b blood vessel segmentation
Tables 4 and 5 show the values of evaluation metrics for optic disc and blood vessel segmentation, respectively. Image1, image2, and image3 indicate random sample image values, and the mean of all images is the mean of all 1000 metric values.
Table 4.
Evaluation metrics for optic disc segmentation
| Image | TPR | TNR | Precision | Dice | Accuracy |
|---|---|---|---|---|---|
| Image 1 | 0.865 | 0.999 | 0.933 | 0.898 | 0.998 |
| Image 1 | 0.919 | 0.999 | 0.928 | 0.923 | 0.999 |
| Image 1 | 0.942 | 0.999 | 0.915 | 0.928 | 0.999 |
| Mean of all images | 0.816 | 0.999 | 0.899 | 0.844 | 0.998 |
Table 5.
Evaluation metrics for blood vessel segmentation
| Image | TPR | TNR | Precision | Dice | Accuracy |
|---|---|---|---|---|---|
| Image 1 | 0.516 | 0.984 | 0.752 | 0.612 | 0.945 |
| Image 1 | 0.596 | 0.971 | 0.621 | 0.608 | 0.943 |
| Image 1 | 0.586 | 0.973 | 0.793 | 0.674 | 0.916 |
| Mean of all images | 0.528 | 0.978 | 0.696 | 0.59 | 0.94 |
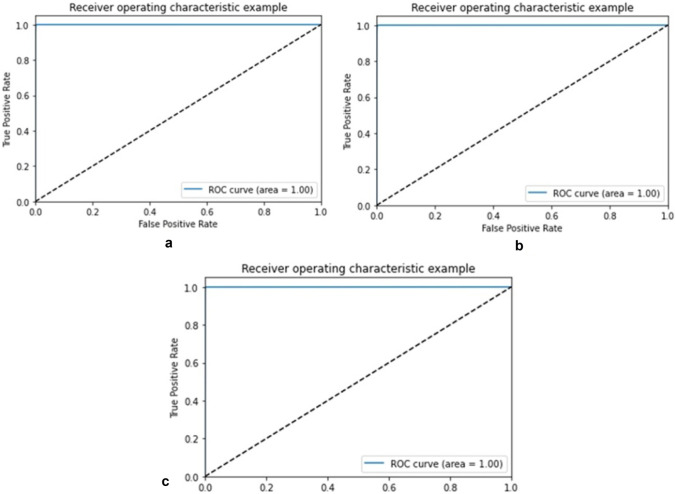
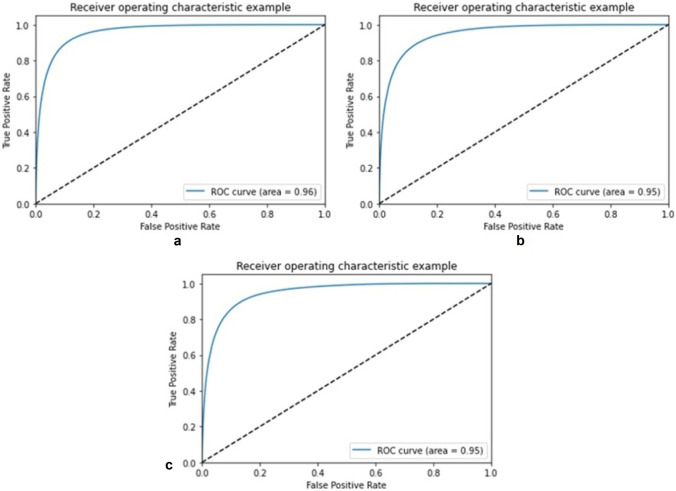
The receiver operating characteristic curve (ROC) or area under the ROC curve (AUC) is also plotted for training, validation, and testing sets of HVDROPDB with TPR on the y-axis and FPR on the x-axis as shown in Figs. 16 and 17. For an excellent model, AUC is 0.9 to 1. For optic disc segmentation (Fig. 17), AUC is 1 for training, validation, and testing sets. For blood vessel segmentation (Fig. 17), AUC is 0.95 for training, with a coefficient of 0.94 for validation and 0.94 for testing, indicating them as excellent models.
Fig. 16.
ROC for a training, b validation, and c testing set of HVDROPDB OD
Fig. 17.
ROC for a training, b validation, and c testing set of HVDROPDB BV
As the public dataset of ROP is not available for comparison, we used the DRION dataset available for Diabetic Retinopathy for optic disc segmentation comparison with radius modified. DRION dataset has a total of 110 images, out of which we selected 80 images randomly, which were divided into training:validation:testing set in ratio 70:15:15. The sensitivity of optic disc detection obtained on testing images was 99.1%, comparable to 99.09% obtained by deep convolution networks [43].
Classification Using Circle Hough Transform
Apart from the HVDROPDB OD and HVDROPDB BV testing sets, we used 50 unknown test images of Retcam and Neo, which were not included in these datasets prepared. The model was run on an NVIDIA GEFORCE GTX GPU and took around 30 ms to test one image. The sensitivity and specificity of optic disc detection were measured by calculating TP, TN, FP, and FN manually. Sensitivity was 98% because of one very poor image, and specificity was 100%.
Zone Detection with Blood Vessels
Zones were detected correctly in the images in which the optic disc was identified, as shown in Fig. 14 with an accuracy of 98%. Public datasets are available for Diabetic Retinopathy research work, and zones are not relevant in diabetic retinopathy. HVDROPDB trained models cannot be used for testing diabetic retinopathy datasets as their optic disc size is different. As there is no ROP dataset available publicly to compare results, they were verified by the ROP specialists’ team. The accuracy of zone detection was measured by calculating TP, TN, FP, and FN manually.
Discussions and Limitations
Our algorithm can detect zones I, II, and III with blood vessels required for assessing the extent of retinal vessel growth or ROP severity in images acquired from two independent sources. Present ROP detecting systems report more about the “Plus disease” and “Mild/severe” categories of the ROP. Identifying zones I and II in ROP images with and without macula is not reported so far.
We have identified zones from fundus images with and without macula. It can help categorize infants into “ high risk” or “low risk” depending on whether retinal vessels are reaching zones I/II. Such categorization can help design a protocol for follow-up for these babies (for example, “high risk” babies to be reviewed weekly and “low risk” to be reviewed on a fortnightly basis). Customized follow-up protocols can reduce the burden on the health system, which is already constrained by resources.
Detecting zones and stages in the temporal view of images are our ongoing work. We are also working on increasing the accuracy of blood vessel segmentation.
Conclusion
This paper discussed the very relevant problem of Retinopathy of Prematurity and the development of an assistive framework for automated screening. ROP is a very important problem, especially in developing countries like India, where premature births are significant (close to 2 million per year). Out of them, babies with ROP are also large in number (about 38%). ROP experts’ dearth to cater to such a huge population of premature babies affected by ROP makes this work very important and relevant.
ROP severity is determined by three zones and five stages of the retina involved. Zones are identified from the location of the optic disc and macula with developing retinal blood vessels. We have developed the framework using an ensemble of Circle Hough Transform and Deep Learning network to automatically identify Zones I, II, and III with blood vessels from fundus images of premature babies in which macula may not be visible. It will help to predict the class of ROP to decide the next schedule of screening. The model’s training time is very less (14 min), and an accuracy of 98% is achieved. This model can be used for the grading of ROP, which will assist the clinicians in screening.
An important aspect of this work is the development of the datasets. Such comprehensive ROP data sets are not available in the public domain, and upon completion of this work, the dataset developed will be made open for public use. ROP specialists’ team has separated the images as posterior view and temporal view images and then annotated the images in different ROP classes in detail. They have also verified the ground truths of training datasets. The dataset created is large (3000 images), heterogeneous, and robust (containing the poor images). Separate ground truth datasets for optic disc and blood vessel segmentation are also available. Future work will involve collecting more images in the dataset to improve segmentation metrics and detect the stage.
Additionally, this system can help patients in low-income setups if modified for smartphone screening. Smartphones and 20 diopter lenses are used as ROP screening tools [44]. It is a relatively cheap way of screening for ROP and can be used for remote screening. Limitations of smartphone screening are the following: (1) it is cumbersome and time-consuming, and (2) it cannot differentiate the zones clearly [45].
Acknowledgements
We thank Dr. Rohit Mendke, Dr.Nilesh Giri, Dr. Pravin Hankare, and Dr. Shrey Rayajiwala from H. V. Desai Eye Hospital, Pune, for providing annotated images for research. We acknowledge H. V. Desai Eye Hospital staff’s help in providing daily fundus images to extend our current work. We also thank Mr.Anup Agrawal for preparing ground truths using Adobe Photoshop.
Author Contribution
Ranjana Agrawal: main author, ideation, programming, and system design, main conceptual work. Dr. Sucheta Kulkarni: domain expert, guidance about the disease-specific concepts and dataset collection and understanding Rahee Walambe: system design, conceptualization and ideation, and paper writing Ketan Kotecha: conceptualization and primary review of work, senior author
Availability of Data and Material
PBMA’s H. V. Desai Eye Hospital, Pune.
Code Availability
Available with authors—custom code Research Involving Human Participants and Animals This study does not contain any studies with human participants or animals performed by any authors.
Declarations
Informed Consent
Images obtained from preterm babies enrolled in the hospital’s screening program were used anonymously (without disclosing identity). As a protocol, written informed consent regarding the use of data for quality assurance and research purpose is obtained from preterm babies' parents before screening for ROP.
Conflict of Interest
The authors declare no competing interests.
Footnotes
Publisher's Note
Springer Nature remains neutral with regard to jurisdictional claims in published maps and institutional affiliations.
Contributor Information
Rahee Walambe, Email: rahee.walambe@sitpune.edu.in.
Ketan Kotecha, Email: director@sitpune.edu.in.
References
- 1.Sen P, Rao C, Bansal N. Retinopathy of prematurity: an update. Medical & Vision Research Foundations. 2015;33(2):93. [Google Scholar]
- 2.Honavar, S. G. (2019). Do we need India-specific retinopathy of prematurity screening guidelines? Indian Journal of Ophthalmology, 67(6), 711.-716, 2019 [DOI] [PMC free article] [PubMed]
- 3.Ju RH, Zhang JQ, Ke XY, Lu XH, Liang LF, Wang WJ. Spontaneous regression of retinopathy of prematurity: incidence and predictive factors. International Journal of Ophthalmology. 2013;6(4):475. doi: 10.3980/j.issn.2222-3959.2013.04.13. [DOI] [PMC free article] [PubMed] [Google Scholar]
- 4.Singh H, Kaur R, Gangadharan A, Pandey AK, Manur A, Sun Y, Kumar P. Neo-bedside monitoring device for integrated neonatal intensive care unit (iNICU) IEEE Access. 2018;7:7803–7813. doi: 10.1109/ACCESS.2018.2886879. [DOI] [Google Scholar]
- 5.Jefferies AL. Retinopathy of prematurity: recommendations for screening. Paediatrics & Child Health. 2010;15(10):667–670. doi: 10.1093/pch/15.10.667. [DOI] [PMC free article] [PubMed] [Google Scholar]
- 6.Murki S, Kadam S. Role of neonatal team including nurses in prevention of ROP. Community Eye Health. 2018;31(101):S11. [PMC free article] [PubMed] [Google Scholar]
- 7.Badarinath, D., Chaitra, S., Bharill, N., Tanveer, M., Prasad, M., Suma, H. N., &Vinekar, A. (2018, July). Study of clinical staging and classification of retinal images for retinopathy of prematurity (ROP) screening. In2018 International Joint Conference on Neural Networks (IJCNN) (pp. 1–6). IEEE.
- 8.Razzak, M. I., Naz, S., &Zaib, A. (2018). Deep learning for medical image processing: overview, challenges and the future. In Classification in BioApps (pp. 323–350). Springer, Cham.
- 9.Blencowe H, Moxon SARAH, Gilbert C. Update on blindness due to retinopathy of prematurity globally and in India. Indian Pediatrics. 2016;53:S89–S92. [PubMed] [Google Scholar]
- 10.Kulkarni S, Gilbert C, Zuurmond M, Agashe S, Deshpande M. Blinding retinopathy of prematurity in Western India: characteristics of children, reasons for late presentation and impact on families. Indian Pediatrics. 2018;55(8):665–670. doi: 10.1007/s13312-018-1355-8. [DOI] [PubMed] [Google Scholar]
- 11.International Committee for the Classification of Retinopathy of Prematurity. (2005). The international classification of retinopathy of prematurity revisited. Archives of Ophthalmology (Chicago, Ill.: 1960), 123(7), 991. [DOI] [PubMed]
- 12.Reid JE, Eaton E. Artificial intelligence for pediatric ophthalmology. Current Opinion in Ophthalmology. 2019;30(5):337–346. doi: 10.1097/ICU.0000000000000593. [DOI] [PubMed] [Google Scholar]
- 13.Krizhevsky, A., Sutskever, I., & Hinton, G. E. (2012). Imagenet classification with deep convolutional neural networks. In Advances in Neural Information Processing Systems (pp. 1097–1105).
- 14.Yi, X., Walia, E., &Babyn, P. (2019). Generative adversarial network in medical imaging: a review. Medical Image Analysis, 58, 101552. [DOI] [PubMed]
- 15.Ronneberger, O., Fischer, P., &Brox, T. (2015, October). U-net: convolutional networks for biomedical image segmentation. In International Conference on Medical Image Computing and Computer-assisted Intervention (pp. 234–241). Springer, Cham.
- 16.Ker J, Wang L, Rao J, Lim T. Deep learning applications in medical image analysis. IEEE Access. 2017;6:9375–9389. doi: 10.1109/ACCESS.2017.2788044. [DOI] [Google Scholar]
- 17.Sivakumar, R., Eldho, M., Jiji, C. V., Vinekar, A., & John, R. (2016, December). Computer aided screening of retinopathy of prematurity—a multiscale Gabor filter approach. In 2016 Sixth International Symposium on Embedded Computing and System Design (ISED) (pp. 259–264). IEEE.
- 18.Rani P, Rajkumar ER. Classification of retinopathy of prematurity using back propagation neural network. International Journal of Biomedical Engineering and Technology. 2016;22(4):338–348. doi: 10.1504/IJBET.2016.081221. [DOI] [Google Scholar]
- 19.Greenspan H, Van Ginneken B, Summers RM. Guest editorial deep learning in medical imaging: overview and future promise of an exciting new technique. IEEE Transactions on Medical Imaging. 2016;35(5):1153–1159. doi: 10.1109/TMI.2016.2553401. [DOI] [Google Scholar]
- 20.Litjens G, Kooi T, Bejnordi BE, Setio AAA, Ciompi F, Ghafoorian M, S´anchez, C. I. A survey on deep learning in medical image analysis. Medical Image Analysis. 2017;42:60–88. doi: 10.1016/j.media.2017.07.005. [DOI] [PubMed] [Google Scholar]
- 21.K.Geethalakshmi,(2018). A survey on deep learning approaches in retinal vessel segmentation for disease identification, IOSR Journal of Engineering (IOSRJEN), pp 47–52.
- 22.Worrall, D. E., Wilson, C. M., &Brostow, G. J. (2016). Automated retinopathy of prematurity case detection with convolutional neural networks. In Deep Learning and Data Labeling for Medical Applications (pp. 68–76). Springer, Cham.
- 23.Hu J, Chen Y, Zhong J, Ju R, Yi Z. Automated analysis for retinopathy of prematurity by deep neural networks. IEEE Transactions on Medical Imaging. 2018;38(1):269–279. doi: 10.1109/TMI.2018.2863562. [DOI] [PubMed] [Google Scholar]
- 24.Brown JM, Campbell JP, Beers A, Chang K, Ostmo S, Chan RP, Chiang MF. Automated diagnosis of plus disease in retinopathy of prematurity using deep convolutional neural networks. JAMA Ophthalmology. 2018;136(7):803–810. doi: 10.1001/jamaophthalmol.2018.1934. [DOI] [PMC free article] [PubMed] [Google Scholar]
- 25.Wang J, Ju R, Chen Y, Zhang L, Hu J, Wu Y, Yi Z. Automated retinopathy of prematurity screening using deep neural networks. EBioMedicine. 2018;35:361–368. doi: 10.1016/j.ebiom.2018.08.033. [DOI] [PMC free article] [PubMed] [Google Scholar]
- 26.Zhang Y, Wang L, Wu Z, Zeng J, Chen Y, Tian R, Zhang G. Development of an automated screening system for retinopathy of prematurity using a deep neural network for wide-angle retinal images. IEEE Access. 2018;7:10232–10241. doi: 10.1109/ACCESS.2018.2881042. [DOI] [Google Scholar]
- 27.Zhao J, Lei B, Wu Z, Zhang Y, Li Y, Wang L, Wang T. A deep learning framework for identifying Zone I in RetCam images. IEEE Access. 2019;7:103530–103537. doi: 10.1109/ACCESS.2019.2930120. [DOI] [Google Scholar]
- 28.Soomro TA, Afifi AJ, Zheng L, Soomro S, Gao J, Hellwich O, Paul M. Deep learning models for retinal blood vessels segmentation: a review. IEEE Access. 2019;7:71696–71717. doi: 10.1109/ACCESS.2019.2920616. [DOI] [Google Scholar]
- 29.Kim, J., Tran, L., Chew, E. Y., &Antani, S. (2019, June). Optic disc and cup segmentation for glaucoma characterization using deep learning. In 2019 IEEE 32nd International Symposium on Computer-based Medical Systems (CBMS) (pp. 489–494). IEEE.
- 30.Civit-Masot J, Luna-Perejon F, Vicente-Diaz S, Corral JMR, Civit A. TPU cloud-based generalized U-Net for eye fundus image segmentation. IEEE Access. 2019;7:142379–142387. doi: 10.1109/ACCESS.2019.2944692. [DOI] [Google Scholar]
- 31.Gu Z, Cheng J, Fu H, Zhou K, Hao H, Zhao Y, Liu J. CE-Net: context encoder network for 2D medical image segmentation. IEEE Transactions on Medical Imaging. 2019;38(10):2281–2292. doi: 10.1109/TMI.2019.2903562. [DOI] [PubMed] [Google Scholar]
- 32.Zou B, Liu Q, Yue K, Chen Z, Chen J, Zhao G. Saliency-based segmentation of optic disc in retinal images. Chinese Journal of Electronics. 2019;28(1):71–77. doi: 10.1049/cje.2017.12.007. [DOI] [Google Scholar]
- 33.Shankaranarayana SM, Ram K, Mitra K, Sivaprakasam M. Fully convolutional networks for monocular retinal depth estimation and optic disc-cup segmentation. IEEE Journal of Biomedical and Health Informatics. 2019;23(4):1417–1426. doi: 10.1109/JBHI.2019.2899403. [DOI] [PubMed] [Google Scholar]
- 34.Bhatkalkar BJ, Reddy DR, Prabhu S, Bhandary SV. Improving the performance of convolutional neural network for the segmentation of optic disc in fundus images using attention gates and conditional random fields. IEEE Access. 2020;8:29299–29310. doi: 10.1109/ACCESS.2020.2972318. [DOI] [Google Scholar]
- 35.Sathananthavathi, V., Indumathi, G., &Ranjani, A. S. (2019, January). Fully convolved neural network-based retinal vessel segmentation with entropy loss function. In International Conference on Artificial Intelligence, Smart Grid and Smart City Applications (pp. 217–225). Springer, Cham.
- 36.Balasubramanian, K., &Ananthamoorthy, N. P. (2019). Robust retinal blood vessel segmentation using convolutional neural network and support vector machine. Journal of Ambient Intelligence and Humanized Computing, 1–11.
- 37.Khanal, A., & Estrada, R. (2019). Dynamic deep networks for retinal vessel segmentation. arXiv preprint
- 38.Hemelings, R., Elen, B., Stalmans, I., Van Keer, K., De Boever, P., &Blaschko, M. B. (2019). Artery–vein segmentation in fundus images using a fully convolutional network. Computerized Medical Imaging and Graphics, 76, 101636. [DOI] [PubMed]
- 39.Bindu S, Prudhvi S, Hemalatha G, Sekhar MN, Nanchariahl MV. Object detection from complex background image using circular Hough Transform. International Journal of Engineering Research and Applications. 2014;4(4):23–28. [Google Scholar]
- 40.Alvarez E, Wakakura M, Khan Z, Dutton GN. The disc-macula distance to disc diameter ratio: anew test for confirming optic nerve hypoplasia in young children. Journal of Pediatric Ophthalmology and Strabismus. 1988;25(3):151–154. doi: 10.3928/0191-3913-19880501-11. [DOI] [PubMed] [Google Scholar]
- 41.De Silva DJ, Cocker KD, Lau G, Clay ST, Fielder AR, Moseley MJ. Optic disk size and optic disk-to-fovea distance in preterm and full-term infants. Investigative Ophthalmology Visual Science. 2006;47(11):4683–4686. doi: 10.1167/iovs.06-0152. [DOI] [PubMed] [Google Scholar]
- 42.Taha AA, Hanbury A. Metrics for evaluating 3D medical image segmentation: analysis, selection, and tool. BMC Medical Imaging. 2015;15(1):29. doi: 10.1186/s12880-015-0068-x. [DOI] [PMC free article] [PubMed] [Google Scholar]
- 43.Bajwa MN, Malik MI, Siddiqui SA, Dengel A, Shafait F, Neumeier W, Ahmed S. Two-stage framework for optic disc localization and glaucoma classification in retinal fundus images using deep learning. BMC Medical Informatics and Decision Making. 2019;19(1):136. doi: 10.1186/s12911-019-0842-8. [DOI] [PMC free article] [PubMed] [Google Scholar]
- 44.Goyal A, Gopalakrishnan M, Anantharaman G, Chandrashekharan DP, Thachil T, Sharma A. Smartphone guided wide-field imaging for retinopathy of prematurity in neonatal intensive care unit–a Smart ROP (SROP) initiative. Indian Journal of Ophthalmology. 2019;67(6):840. doi: 10.4103/ijo.IJO_1177_18. [DOI] [PMC free article] [PubMed] [Google Scholar]
- 45.Lekha T, Ramesh S, Sharma A, Abinaya G. MII RetCam assisted smartphone based fundus imaging for retinopathy of prematurity. Indian Journal of Ophthalmology. 2019;67(6):834. doi: 10.4103/ijo.IJO_268_19. [DOI] [PMC free article] [PubMed] [Google Scholar]
Associated Data
This section collects any data citations, data availability statements, or supplementary materials included in this article.
Data Availability Statement
PBMA’s H. V. Desai Eye Hospital, Pune.
Available with authors—custom code Research Involving Human Participants and Animals This study does not contain any studies with human participants or animals performed by any authors.


