Abstract
Patients who are intubated with endotracheal tubes often receive chest x-ray (CXR) imaging to determine whether the tube is correctly positioned. When these CXRs are interpreted by a radiologist, they evaluate whether the tube needs to be repositioned and typically provide a measurement in centimeters between the endotracheal tube tip and carina. In this project, a large dataset of endotracheal tube and carina bounding boxes was annotated on CXRs, and a machine-learning model was trained to generate these boxes on new CXRs and to calculate a distance measurement between the tube and carina. This model was applied to a gold standard annotated dataset, as well as to all prospective data passing through our radiology system for two weeks. Inter-radiologist variability was also measured on a test dataset. The distance measurements for both the gold standard dataset (mean error = 0.70 cm) and prospective dataset (mean error = 0.68 cm) were noninferior to inter-radiologist variability (mean error = 0.70 cm) within an equivalence bound of 0.1 cm. This suggests that this model performs at an accuracy similar to human measurements, and these distance calculations can be used for clinical report auto-population and/or worklist prioritization of severely malpositioned tubes.
Keywords: Endotracheal tube, Chest X-ray, Convolutional neural network, Bounding box, Machine learning
Introduction
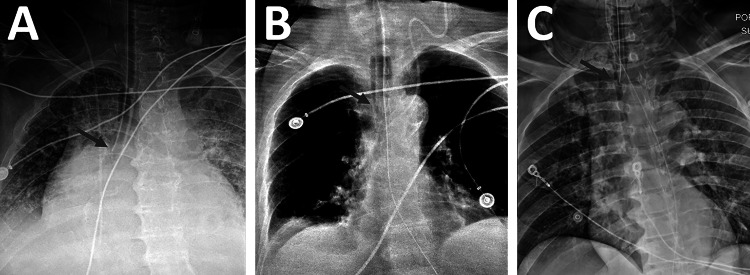
Endotracheal (ET) intubation is used when patients require mechanical ventilation. The ET tube is inserted through the mouth and into the trachea with the tip of the tube ideally placed 2–6 cm above the carina in adults [1, 2] (Fig. 1). Chest x-ray (CXR) is routinely performed immediately after ET tube intubation to ensure proper tube positioning [3]. Many institutions also use daily CXR to ensure that the tube remains properly positioned in patients requiring continued mechanical ventilation. The CXR is viewed by a radiologist who typically records the distance in centimeters between the tip of the ET tube and the carina. If this distance is outside the optimal range, the tube is characterized as malpositioned and is adjusted into proper position. Our radiology platform receives approximately 4000 CXRs per day, of which about 5% contain ET tubes. We hypothesized that, by training a bounding box-based convolutional neural network for localization of the ET tube and the carina, the distance between these two objects could be calculated at an accuracy similar to the variability between radiologist measurements of ET tube distance. This model could then be used for both auto-population of the ET tube distance into the clinical report and for worklist prioritization to ensure that patients with malpositioned tubes have them repositioned as quickly as possible.
Fig. 1.
Endotracheal tubes at various levels of positioning. A An ET tube positioned too low, in the right mainstem bronchus. B A correctly positioned ET tube. C An ET tube positioned too high
Materials and Methods
Natural Language Processing
To collect CXR data where ET tubes were present, a natural language processing (NLP) model was created that could examine the radiologist’s clinical report associated with each CXR and determine whether the radiologist identified an ET tube as present. All CXR clinical reports in our database acquired between 2015 and 2019 were screened for variations of the keyword “endotracheal tube,” and any sentences containing these keywords were extracted. The sentences were then given a binary label for presence or absence of an ET tube (35,926 present, 1016 absent). The NLP model was trained using a stochastic gradient descent (SGD) optimizer in the sklearn package [4]. This NLP model, along with the same keyword list filters, was applied to all incoming CXR data between December 2018 and July 2020 to collect CXRs with ET tubes for image annotation. An additional NLP model was created to extract the ET tube distance measurement in centimeters from the clinical report, if this measurement was explicitly stated by the radiologist. This NLP model included a correction to centimeters if the measurement was listed in millimeters and returned a negative measurement if the report text indicated the tube tip was inferior to the carina.
Image Collection and Annotation
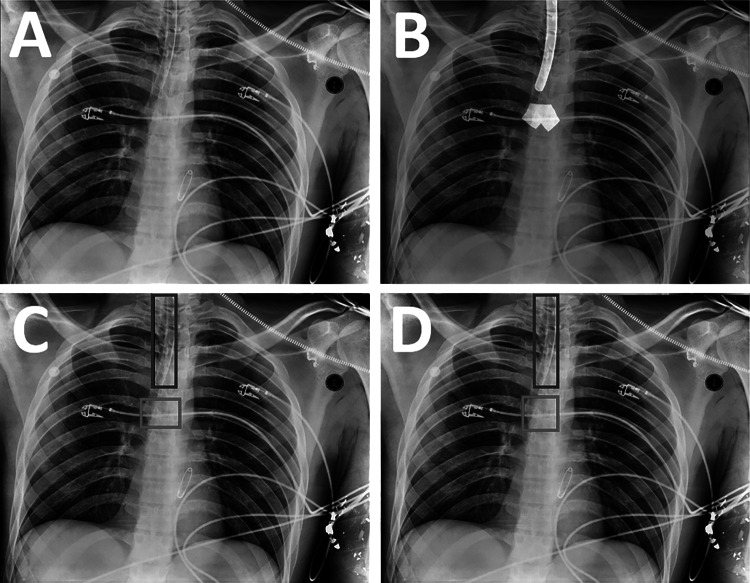
The ET tube presence NLP model was used to identify CXRs usable as training data. These CXRs were placed on an annotation worklist for one of two participating Board Certified radiologists (S.G.B., 12 years of experience; Y.B., 21 years of experience) to annotate. For the initial stages of this project, annotations for the carina and ET tube were drawn using bounding boxes on the CXRs. Radiologists were instructed to make the ET tube box fit as tightly as possible to the boundaries of the tube while still having the entire tube within the boundaries. For the carina bounding box, radiologists were instructed to draw a square bounding box centered on the carina with the box’s cranial edge at the proximal-most origin of the main stem bronchi from the trachea. As this project progressed, the annotating radiologists began marking segmentations rather than just bounding boxes by segmenting the ET tube pixels and carina pixels, rather than drawing boxes around their perimeters (Fig. 2B). To homogenize the data, bounding boxes from the ET tube and carina segmentations were then generated by taking the outermost coordinates of each segmentation and creating a bounding box from these coordinates (Fig. 2C). Therefore, all training data had bounding box annotations available. To standardize the carina bounding box data, the center coordinate of each annotated carina box was calculated, and the box was recreated as a square with side length equal to 0.05 × (h + w)/2, where h and w are the height and width of the full image, respectively (Fig. 2D). This removed variation in the size and proportions of the annotated carina boxes, which varied considerably across the dataset due to the lack of a true boundary of the carina region.
Fig. 2.
Generation of labeled training data from a CXR. A The original image. B Segmentations of the endotracheal tube and carina are drawn on the image by radiologists using a brush tool (white overlays). C The outer perimeters of the segmentations are used to obtain bounding boxes for the endotracheal tube (blue box) and carina (red box). D The carina box (red box) is modified to make it a square of fixed size in proportion to the image size
Since most CXRs do not contain an ET tube, it was necessary to ensure that the model was accustomed to seeing these images as well and would not detect ET tubes when none was present. Therefore, a set of CXRs without ET tubes was extracted using the ET tube presence NLP model. To optimize radiologist annotation time by annotating only CXRs where tubes were present, these non-tube images were passed through an early trained version of the model and only the carina box output was saved. This model-generated carina box was then used as training data during further iterations of the model. All model-generated carina boxes were visually inspected to ensure that the box was generated accurately around the carina.
Model Training
Model training was performed using TensorFlow 2.2 in a Python 3.6 environment with two Quadro P5000 GPUs available (Nvidia, Santa Clara, CA). For the final iteration of training, a set of 2862 images with ET tubes and 755 images without ET tubes were used. This dataset was randomly split into 90% training data and 10% validation data. The model used was an adapted version of the YOLO-v3 framework (https://github.com/experiencor/keras-yolo3) [5, 6]. This model framework was edited to only fit to ET tube and carina bounding box data. An ADAM optimizer with initial learning rate of 0.0001 was used, and the learning rate was reduced by a factor of ten whenever the training loss did not improve for two epochs. If the training loss did not improve for six epochs, the model training ended, and the model checkpoint with the best validation loss was saved. For the final model training, the model stopped after 59 epochs, and the final carina and tube mean average precision (mAP) were 0.929 and 0.920, respectively.
Distance Calculation
The “tube bottom” was defined as the bottom y-coordinate of the tube bounding box. The “carina center” was defined as the center point of the carina bounding box. The distance metric was calculated as the difference between the tube bottom and the y-coordinate of the carina center (Fig. 3A). If the carina center was outside of the left and right x-coordinates of the tube bounding box, then a diagonal distance measurement was taken between the carina center and the closest bottom corner of the tube box (Fig. 3B).
Fig. 3.
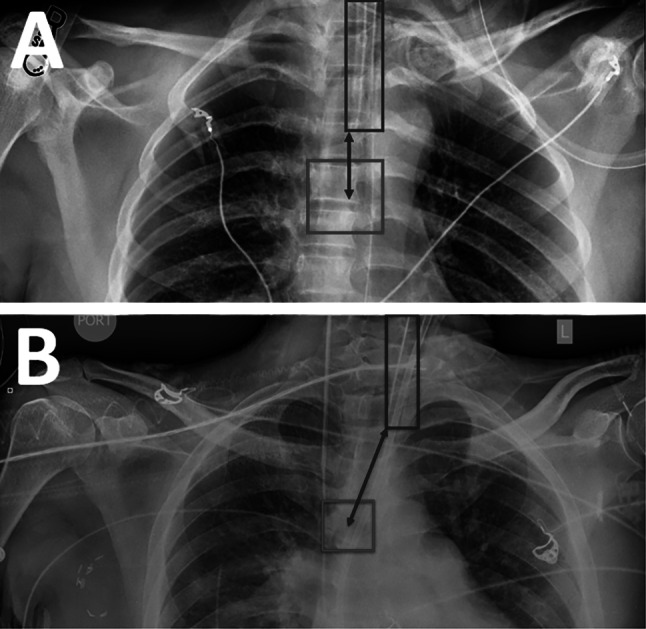
Calculation of distance metric from ET tube and carina bounding boxes. A The distance is calculated vertically when the carina center is within the tube x-coordinate bounds. B The distance is calculated diagonally when the carina center is outside the tube x-coordinate bounds
Inter-Radiologist Variability Test Dataset
To determine how this model’s accuracy compares to human measurement variability, an inter-radiologist variability dataset of 200 randomly selected CXRs with ET tubes was created using the tube presence NLP model. The mean age of these patients was 56.8 ± 21.9 years with a range of 0–94 years. Of these 200 CXRs, three of them did not actually have an ET tube present, despite the clinical report stating otherwise; one contained a nasogastric tube, one contained a tracheostomy tube, and one contained no tubes. For the remaining 197 CXRs, three Board Certified radiologists (Y.B.; A.M., 12 years of experience; G.S., 5 years of experience) were asked to manually measure the distance in centimeters between the tube tip and the carina using a ruler tool that shows the distance between two points within a DICOM viewer. This ruler tool is part of the standard clinical workflow at our radiology practice, and the goal of this test dataset was to mimic a standard clinical workflow. In addition, each radiologist classified the ET tube in each CXR qualitatively as malpositioned, not malpositioned, or undetermined, with the undetermined label being used when the reader was not sure whether the tube was malpositioned or not. The radiologists were not given a measurement cutoff range to base their qualitative classifications on, so that the variance of opinions present clinically could be reflected. The difference between the shortest and longest reader distance measurement in centimeters was calculated for each CXR to quantify the human measurement variability.
Gold Standard Test Dataset
To determine the model accuracy compared to ground-truth distance measurements, a gold standard test dataset was created. To do this, 200 new CXRs with ET tubes were extracted. The mean age of these patients was 60.0 ± 20.6 years with a range of 0–93 years. A Board Certified radiologist (S.G.B.) annotated these with bounding boxes in the same manner as the training dataset. This dataset was then carefully manually reviewed by the lead author (R.J.H.), and if any tube or carina box did not appear to tightly fit its underlying target, it was shown to a second Board Certified radiologist (Y.B.) for either confirmation or rejection of the bounding box annotations. If the CXR was rejected, a new CXR replaced it until the gold standard test dataset contained 200 CXRs with confirmed accurate bounding boxes. The bounding box distance calculation was run on these radiologist annotations to obtain ground-truth distances for this dataset. The model was also run on this test dataset, and distances were calculated from the model output boxes to determine the difference between ground truth and model output for each CXR.
Prospective Dataset
The model was then run on all incoming CXR data over a 2-week period during September 2020. Sensitivity and specificity of overall ET tube detection were calculated by comparing whether the model detected any ET tube bounding box in the image against the tube presence NLP model. Among CXRs where the NLP showed a tube was present, the distance measurement NLP was also run to obtain radiologist measurements from the clinical report when they were available, and these report measurements were compared to the model measurements. To calculate sensitivity and specificity of the model for worklist prioritization of prospective patients, “malpositioning” was defined as distance of < 2 cm or > 6 cm, and “severe malpositioning” as distances of < 0 cm or > 8 cm. These definitions were used for both the model results and the NLP measurement results.
Results
Inter-Radiologist Variability Test Dataset
The mean and median variabilities of the 197 usable CXRs in the inter-radiologist variability test dataset were 0.70 cm and 0.50 cm, respectively, with a range of 0.0 to 6.4 cm. This dataset was not normally distributed (D-Agostino’s K2 test, P < 0.0001). For qualitative classifications of malpositioned/not malpositioned/undetermined, the three readers agreed on a classification in only 93 out of 197 cases (47%), with 69 CXRs unanimously classified as not malpositioned and 24 CXRs unanimously classified as malpositioned. When counting cases as ground-truth malpositioned when two or more readers classified the CXR as malpositioned, and all other cases not malpositioned, the sensitivity for malpositioning was 74.1%, and specificity was 83.3%. However, when counting cases as ground-truth malpositioned only when all three readers agreed that the CXR was malpositioned, the sensitivity was 100% and the specificity was 95.7%.
Gold Standard Test Dataset
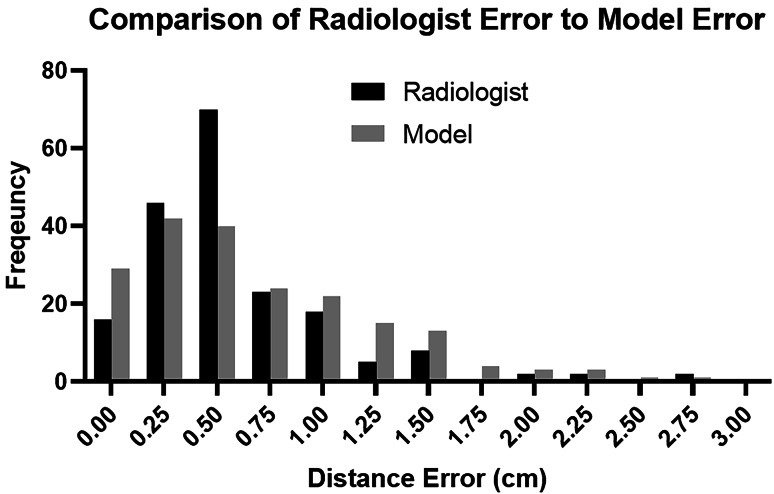
For the gold standard dataset, the mean and median differences between the model results and ground-truth measurements were 0.70 cm and 0.53 cm, respectively, with a range of 0.00 to 5.77 cm. This data was also not normally distributed (D-Agostino’s K2 test, P < 0.0001). To determine whether the model distance results were noninferior to radiologist measurements, the 95% confidence interval for the difference between these two samples was calculated using an unpaired nonparametric test [7]. The 95% confidence interval was −0.07 to 0.1 cm, indicating that the model measurement is noninferiority to radiologist measurements within an equivalence bound of 0.1 cm [8]. A comparison of the inter-radiologist dataset errors to the gold standard model errors is shown in Fig. 4.
Fig. 4.
A histogram comparison of inter-radiologist errors to model errors. While the medians of these two distributions are approximately equal, the radiologist errors show a clear peak around 0.5 cm, while the model errors are distributed more evenly between 0.0 and 1.5 cm
Prospective Dataset
The ET tube model was applied to all prospective CXRs passing through our radiology platform for a 2-week period. During this time, 48,912 CXRs passed through this system, of which 2745 had an ET tube present based on the model results. Of these, there were 1536 CXRs for which the NLP obtained a specific measurement in centimeters. The mean age of patients with ET tubes was 60.5 ± 16.8 years with a range of 0–94 years.
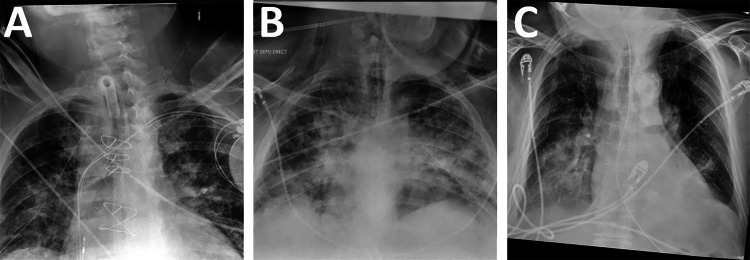
For overall detection of ET tubes, sensitivity was 99.1%, specificity was 98.6%, negative predictive value (NPV) was 99.9%, and positive predictive value (PPV) was 80.3% when using the tube presence NLP as a ground truth. This included 24 false-negatives for which the clinical report stated an ET tube was present but the model did not generate a bounding box; after manually reviewing these CXRs, it was determined that 5 of them (21%) did not actually have an ET tube present. The dataset also included 667 false positives for which the model said that there was an ET tube, but the clinical report did not. Because it was not feasible to manually examine all 667 CXRs, a subset of 100 was manually examined to determine how many of the CXRs genuinely did not have an ET tube and how many did have ET tubes that were not mentioned in the clinical report as they should have been. Out of a subset of 100 false positives, 47 did have an ET tube present that was not mentioned in the clinical report. Under the assumption that approximately 47% of tube detection false positives actually do have a tube present, and counting the false-negative CXRs that did not actually have an ET tube present as true negatives, this indicates a true sensitivity of 99.4% and true specificity of 99.2%, with a true NPV of 99.9% and true PPV of 89.5%. Among confirmed false positives, the leading cause was other types of tubes in the airway region, such as nasogastric or tracheostomy tubes (Fig. 5).
Fig. 5.
Common types of false-positive images, where the model detected an ET tube but none was present. A A patient with a tracheostomy tube. B A patient with a small bore nasogastric feeding tube. C A patient with a standard large bore nasogastric tube
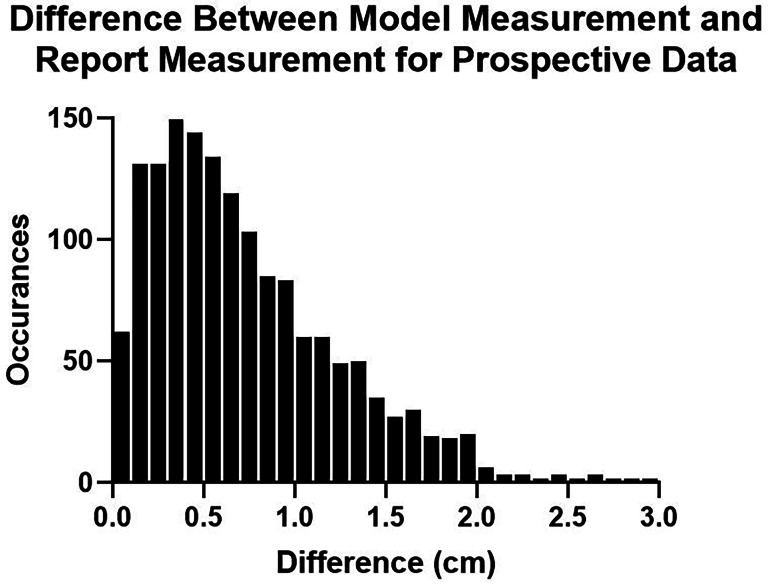
Among the 1536 CXRs for which a distance measurement was extracted from the clinical report, the mean and median differences between model and report measurements were 0.68 cm and 0.56 cm, respectively (Fig. 6). The sensitivity and specificity of tube malpositioning (outside of 2 to 6 cm) was 75.9% and 88.5%, respectively. The sensitivity and specificity for severe tube malpositioning (outside of 0 to 8 cm) was 65.9% and 98.9%, respectively, with NLP measurements showing 6 tubes inferior to the carina and 40 tubes above 8 cm. The 95% confidence interval between the radiologist error test set and this prospective dataset was − 0.090 to 0.030 cm, suggesting that tube measurements done using the model are noninferior to radiologist measurements within an equivalence bound of only 0.03 cm.
Fig. 6.
A histogram showing the accuracy of model measurements in a 2-week prospective dataset compared to measurements extracted from the clinical report
Discussion
A high-volume inference system for automated measurement of ET tube positioning was implemented in our radiology workflow. This model produced measurements with approximately the same accuracy as human radiologist measurements.
A previous study by Lakhani et al. [9] used a whole-image convolutional neural network to classify CXRs as having an ET tube or not (AUC = 0.99) and to classify ET tubes as being in low or normal position (AUC = 0.81). However, this study only used training datasets with 300 images and did not attempt to calculate a distance measurement in centimeters. Frid-Adar et al. [10] developed a segmentation-based model for classifying ET tube pixels by using a synthetic training dataset; however, this study did not attempt to segment the carina or determine tube placement. To our knowledge, this study is the first to use a bounding box-based machine-learning model to localize the ET tube and carina and the first model to output a distance measurement in centimeters. Obtaining a distance measurement rather than just binary mispositioning classification allows for eventual auto-population of clinical reports with these measurements and can provide a technician quantitative information about how many centimeters the tube should be moved during repositioning.
The mean inter-radiologist variability of 0.70 cm was approximately equal to the mean error of 0.70 cm between the gold standard dataset and model measurements. Because it is difficult to statistically determine whether two groups of measurements are equivalent, a noninferiority test was used to show that the model performs at an accuracy comparable to human measurements. The maximum variability from the inter-radiologist test dataset was 6.4 cm, compared to a maximum model error of 5.16 cm in the gold standard dataset. These large outliers suggest that, in a small number of cases, the model will miss the actual tube location badly, but that this effect occurs for human readers as well. With further improvements to model accuracy, the model may be able to reduce these bad misses, eventually outperforming human variability.
The mean model error of 0.68 for prospective data is also noninferior to inter-radiologist variability. This model performed well at determining the overall presence of an ET tube, with true sensitivity and specificity above 99%. Importantly, the large number of CXRs for which the clinical report did not state the patient had an ET tube, but the ET tube was visible in the image and was detected by the model, suggesting that this model could be used to remind the clinician to state something about the ET tube in the report if they initially fail to do so. Similarly, several clinical reports stated that an ET tube was present when it was not, and this model could be used for confirmation of tube presence during a clinical workflow as well. The sensitivity and specificity for severely malpositioned tubes were approximately 66% and 99%, suggesting that this model could be implemented to screen for these severely malpositioned tubes without a high number of false positives.
The rate of disagreement for qualitative malpositioning was notable, with all three radiologists concurring on malpositioning status for less than half of the inter-radiologist variability dataset. This leads to difficulty in defining consistent cutoffs for tube malpositioning, as different radiologists may have varying opinions on what constitutes malpositioning. Although defined cutoffs for malpositioning and severe malpositioning have been used here, the proper positioning can vary by patient size and patient chin positioning. This provides another reason to limit worklist prioritization to severely malpositioned tubes rather than all malpositioned tubes, to focus on extreme cases rather than borderline cases. The proper tube distance also varies by patient age, with pediatric patients requiring shorter ET tube distances. This can be addressed by using an age correction for malpositioning cutoffs, which has not yet been applied here.
This model continues to be subject to further improvement. During development of this model, preliminary trained versions of the model were run on prospective CXRs, and those showing the biggest difference between the model measurement and the clinical report measurement were collected and sent to radiologists for annotation as new training data. Similarly, CXRs where the model detected a tube box but there was no ET tube present in the image were obtained and placed in the dataset with only the carina annotated via previous versions of the model. In theory, this allows for correction of any systematic features the model performs poorly on, continually improving the accuracy of the model. Additionally, the data currently being collected is pixel segmentation data, which could be used for a segmentation-based model such as uNet or Mask-RCNN rather than converted into bounding box data. These segmentation-based models were implemented by our group for tube and carina detection but did not achieve as accurate results as the bounding box YOLO-v3 model did; therefore, they were not used. However, it is possible that the right type of segmentation-based model may be able to achieve improved accuracy and better localization of the tube tip compared to a bounding box model, if such a model can be found. Finally, a follow-up study would be warranted to determine whether integrating these automated ET tube measurements into a clinical workflow would decrease inter-radiologist variability in practice.
There were several limitations to this study. First, patient orientation can be highly variable on CXRs and can affect distance measurement when the trachea is not parallel to the image detector. In these angled images, a calculation of distance between the carina and tube boxes may not reflect the true through-plane distance as this cannot be captured by a 2D x-ray image. However, this is sometimes a problem faced by radiologists as well. Even for well-oriented images, it can sometimes be genuinely difficult for even an experienced radiologist to identify the carina or exact location of the ET tube tip. The carina annotations used for images without tubes in this study were generated by previous versions of the model, rather than done by radiologists; this is not the proper way to collect training data, although given resource constraints, it was appropriate to focus radiologists on images where both the tube and carina could be annotated. Provided the machine-generated carina boxes are reviewed and accurate, this would not be expected to hurt model performance in prospective data. Finally, clinical report error is inherent in all statistics involved in this project, including tube presence and report distance measurement in centimeters. This is human error and is unavoidable in a real-world clinical workflow. However, this model provides an opportunity to improve these human errors by altering the radiologist when objects or distances detected by the model differ from what is present in the radiologist’s report, giving them an opportunity to correct it before submission.
Conclusions
In conclusion, a bounding box-based endotracheal tube machine-learning model was implemented in a high-volume environment at our radiology practice. The model performed at a level approximately equal to human measurement. This workflow can be expanded to other tube types where automated measurements and repositioning are required.
Data Availability
Data is in the author’s possession and is not publicly available.
Code Availability
Code is in the author’s possession and is not publicly available.
Declarations
Conflict of Interest
All authors are employed at the teleradiology practice described here.
Footnotes
Publisher's Note
Springer Nature remains neutral with regard to jurisdictional claims in published maps and institutional affiliations.
References
- 1.Varshney M, Sharma K, Kumar R, Varshney PG: Appropriate depth of placement of oral endotracheal tube and its possible determinants in Indian adult patients. Indian J Anaesth 2011. 10.4103/0019-5049.89880 [DOI] [PMC free article] [PubMed]
- 2.Han JH, Lee SH, Kang YJ, Kang JM: Plain endotracheal tube insertion carries greater risk for malpositioning than does reinforced endotracheal tube insertion in females. Korean J Anesthesiol 2014. 10.4097/kjae.2013.65.6S.S23 [DOI] [PMC free article] [PubMed]
- 3.Hossein-Nejad H, Payandemehr P, Bashiri SA, Nedai HHN: Chest radiography after endotracheal tube placement: is it necessary or not? Am J Emerg Med 2013. 10.1016/j.ajem.2013.04.032 [DOI] [PubMed]
- 4.Pedregosa F, Varoquaux G, Gramfort A, et al: Scikit-learn: machine learning in Python. J Mach Learn Res 2011.
- 5.Redmon J, Farhadi A. Yolov3. Proc IEEE Comput Soc Conf Comput Vis Pattern Recognit 2017. 10.1109/CVPR.2017.690
- 6.Redmon J, Farhadi A: YOLO v.3. Tech Rep 2018.
- 7.Campbell MJ, Gardner MJ: Statistics in medicine: calculating confidence intervals for some non-parametric analyses. Br Med J Clin Res Ed 1988. 10.1136/bmj.296.6634.1454 [DOI] [PMC free article] [PubMed]
- 8.Walker E, Nowacki AS: Understanding equivalence and noninferiority testing. J Gen Intern Med 2011. 10.1007/s11606-010-1513-8 [DOI] [PMC free article] [PubMed]
- 9.Lakhani P: Deep convolutional neural networks for endotracheal tube position and X-ray image classification: challenges and opportunities. J Digit Imaging. 2017. 10.1007/s10278-017-9980-7 [DOI] [PMC free article] [PubMed]
- 10.Frid-Adar M, Amer R, Greenspan H: Endotracheal tube detection and segmentation in chest radiographs using synthetic data. In: Lecture Notes in Computer Science (Including Subseries Lecture Notes in Artificial Intelligence and Lecture Notes in Bioinformatics). 2019. 10.1007/978-3-030-32226-7_87
Associated Data
This section collects any data citations, data availability statements, or supplementary materials included in this article.
Data Availability Statement
Data is in the author’s possession and is not publicly available.
Code is in the author’s possession and is not publicly available.


