Abstract
The combination of air quality (AQ) data from satellites and low‐cost sensor systems, along with output from AQ models, have the potential to augment high‐quality, regulatory‐grade data in countries with in situ monitoring networks and provide much needed AQ information in countries without them, including Low and Moderate Income Countries (LMICs). We demonstrate the potential of free and publicly available USA National Aeronautics and Space Administration (NASA) resources, which include capacity building activities, satellite data, and global AQ forecasts, to provide cost‐effective, and reliable AQ information to health and AQ professionals around the world. We provide illustrative case studies that highlight how global AQ forecasts along with satellite data may be used to characterize AQ on urban to regional scales, including to quantify pollution concentrations, identify pollution sources, and track the long‐range transport of pollution. We also provide recommendations to data product developers to facilitate and broaden usage of NASA resources by health and AQ stakeholders.
Key Points
Satellite data and global air quality models can augment data from surface monitors for health and air quality applications
These resources provide much needed, cost‐effective air quality information for many Low and Moderate Income Countries
With case studies, we show that an effective approach to monitoring combines the strengths of these resources with surface monitors
1. Introduction
de Sherbinin et al. (2014) noted that most of the world's population has little or no information on the health risks of air pollution even though outdoor air pollution is estimated to cause over 4 million premature deaths annually (WHO, 2018) and cost more than $5 trillion in lost labor income and welfare losses annually (World Bank, 2016). Most premature mortalities are attributed to particulate matter <2.5 μm in size (PM2.5). A recent study increased the premature mortality associated with PM2.5 to 8.7 million (Vohra et al., 2021). It is estimated that 91% of the world's population live in areas that exceed the World Health Organization's air quality (AQ) limits, with people living in Low and Moderate Income Countries (LMICs) being disproportionately burdened (WHO, 2018). The annual number of premature deaths associated with outdoor air pollution is projected to more than double by 2060 (OECD, 2016).
Cromar et al. (2019) recommended that health and AQ professionals adopt an approach to AQ monitoring that combines the strengths of various monitoring technologies (i.e., regulatory‐grade stationary monitors, satellite data, low‐cost sensors, and AQ forecast models; Figure 1) and takes advantage of recent improvements in data quality. They note that satellites, low‐cost sensors, and AQ models currently lack the precision and accuracy of regulatory‐grade monitors, though their quality is adequate for monitoring AQ trends, daily risk communication, assessing the efficacy of emission controls, and local health studies. In addition, Cromar et al. (2019) recommended that health and AQ agencies, especially in LMICs, use free/affordable and publicly available technologies to develop their own comprehensive AQ monitoring strategies and health databases given that regulatory‐grade monitors are far too expensive for many stakeholders in LMICs to install and operate.
Figure 1.
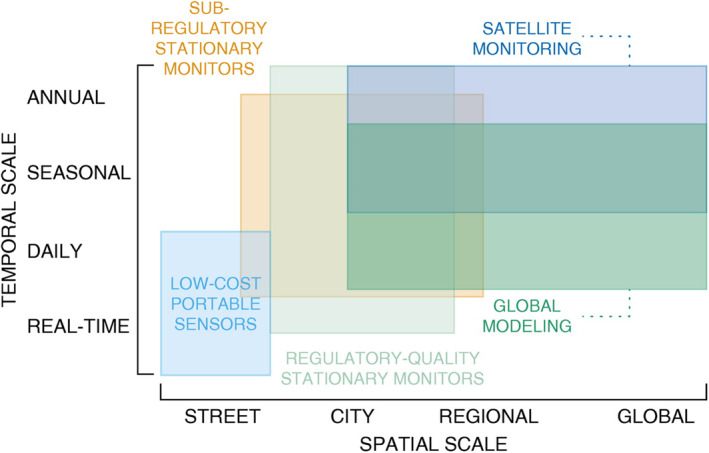
Illustration of general spatio‐temporal coverage of various air pollution monitoring technologies. Figure 1 from Cromar et al. (2019) (Reprinted with permission of the American Thoracic Society. Copyright © 2020 American Thoracic Society. All rights reserved. Cite: Cromar, K. R., Duncan, B. N., Bartonova, A., Benedict, K., Brauer, M., Habre, R., Hagler, G. S. W., Haynes, J. A., Khan, Sean, Kilaru, V., Liu Y., Pawson, S., Peden, D. B., Quint, J. K., Rice, M. B., Sasser, E. N., Seto, E., Stone, S. L., Thurston, G. D., and Volkens, J. (2019), Air Pollution Monitoring for Health Research and Patient Care: An American Thoracic Society Workshop Report. Annals of the American Thoracic Society, 16, 10, https://doi.org/10.1513/AnnalsATS.201906-477ST. Annals of the American Thoracic Society is an official journal of the American Thoracic Society).
The goals of this manuscript are to demonstrate (a) how USA National Aeronautics and Space Administration (NASA) satellite data and global AQ forecasts may be used to complement existing regulatory‐grade sensors or low‐cost sensors to create a cost‐effective and reliable AQ monitoring strategy for health and AQ stakeholders, including for local and national governments, as well as national and international organizations, and (b) how satellite and global AQ forecast model experts, in consultation with stakeholders, may enable broad use of NASA resources by the health and AQ communities. In Section 2, we present background information on the strengths and limitations of various monitoring technologies. In Section 3, we discuss ways that the decision‐support needs of health and AQ stakeholders may be further enabled by capacity building activities, processed satellite data products specifically designed for health and AQ stakeholders, and illustrative case studies. While doing so, we provide examples of how stakeholders may incorporate these technologies into their standard operating procedures.
2. Satellites, Low‐Cost Sensors, and AQ Forecasts
While data from regulatory‐grade AQ monitors are considered the “gold standard” for health and AQ professionals, data from satellites and low‐cost sensors—an emergent technology—alongside AQ forecasts are useful for a number of health and AQ applications (e.g., Anenberg et al., 2020). In this section, we give a general introduction to the strengths and limitations of three monitoring technologies that are some of the building blocks of a cost‐effective AQ monitoring system that, when combined, provide a more comprehensive understanding of the spatio‐temporal characteristics of air pollution. The information provided in this section is not meant to be exhaustive, given the numerous health and AQ datasets, each with their unique peculiarities, now available from instruments on satellites, low‐cost sensors, and AQ regional and global forecast models. Therefore, we highly recommend for health and AQ stakeholders to take advantage of NASA capacity building opportunities (e.g., Section 3.1) to educate themselves on how to evaluate the characteristics of specific datasets from satellites and models for their particular health and AQ applications. There are also other informative reviews that may aid the stakeholder to ascertain the strengths, and limitations of using satellite data for health and AQ applications. For instance, we recommend the reader to the review of Duncan et al. (2014) for satellite data and Giordano et al. (2021) and several recent workshop summaries that provide a comprehensive overview of the state of science of low‐cost sensors for AQ applications (Clements et al., 2017; Duvall et al., 2021; Williams et al., 2019).
2.1. Satellite Data
Most satellite instruments collect AQ data by detecting electromagnetic (EM) radiation from the sun. The incoming radiation, which is absorbed, re‐emitted, reflected, and scattered by the Earth and its atmosphere, is measured as a function of wavelength with the infrared (IR), visible, and ultraviolet (UV) regions of the EM spectrum containing the most useful information for observing pollutants from space. As discussed in Duncan et al. (2014), several important pollutants can be observed from space, including nitrogen dioxide (NO2), sulfur dioxide (SO2), carbon monoxide (CO), formaldehyde (HCHO), ammonia (NH3), and aerosol optical depth (AOD), from which surface particulate matter (PM2.5) may be inferred. PM2.5 is directly emitted to the atmosphere, such as in the form of smoke and dust, but can also form in the atmosphere through chemical reactions that transform gaseous pollutants, such as SO2, NH3, and NO2, to particles (i.e., gas to particle conversion). Satellite observations of these trace gases are therefore used to constrain aerosol formation. Another important pollutant, ozone (O3), is also observed, but it is currently too difficult to differentiate O3 at Earth's surface from the stratospheric O3 layer (e.g., Duncan et al., 2014). However, NO2 and HCHO are used as proxies for O3's primary precursors, nitrogen oxides (NOx = NO + NO2) and volatile organic compounds (VOCs) (e.g., Duncan et al., 2010; Jin et al., 2020).
The primary strength of satellite data over observations from AQ monitors is spatial coverage (e.g., Figure 2). Satellites that orbit Earth from pole to pole (i.e., a polar orbit) collect data over any given geographic location once per day as Earth rotates. A polar orbit is used to map air pollutants over most of the globe within a single day. Satellites in a geosynchronous orbit, an orbit in which the satellite matches the rotation of Earth and appears fixed in the sky by an observer on the ground, collect sub‐hourly data for a specific region (e.g., North America). Whatever the orbit, clouds will limit detection of pollution near the ground, though a satellite in geosynchronous orbit has many more opportunities each day to collect data of cloud‐free scenes at a given location than a satellite in polar orbit.
Figure 2.
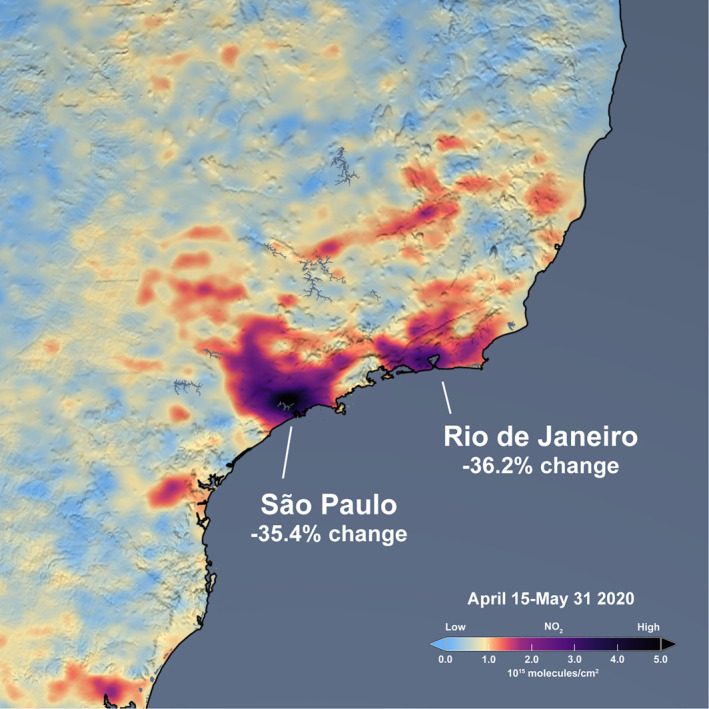
Average tropospheric vertical column densities of NO2 (1015 molecules/cm2) from the Ozone Monitoring Instrument (OMI; Levelt et al., 2006) on the Aura satellite from April 15 to May 31, 2020 over southeastern Brazil. The percent changes in São Paulo and Rio de Janeiro are relative to the average of the same period, April 15–May 31, over 2015–2019. The decrease in NO2 serves as an indicator of the impact of efforts to contain the spread of COVID‐19 on this air pollutant, which is emitted primarily during the combustion of fossil fuels. Aura OMI data were downloaded from the Aura Validation Data Center (https://avdc.gsfc.nasa.gov/) and processed by NASA's Science Visualization Studio. Image courtesy of NASA.
One limitation of satellite data is that the observed levels are typically column quantities instead of “nose‐level concentrations.” These are either vertical column densities (VCDs) in the case of trace gases (i.e., the number of molecules of a pollutant between the satellite and Earth's surface) or unitless measures of the total aerosol amount in the atmospheric column. However, many pollutants are short‐lived (e.g., NO2 and SO2) so they tend to be concentrated near their emission sources at Earth's surface. Atmospheric models that simulate the chemistry and transport of air pollutants may be used to help interpret satellite observations and to infer surface levels of pollutants (e.g., Lamsal et al., 2008). Another limitation is that observations are for a specific local time of day or daylight hours, which would bias concentration averages. These biases can be corrected by using diurnal profiles of the changes in pollutant concentration throughout the day. Such profiles can be obtained from data sources with more complete temporal coverage, such as ground‐based monitors or AQ models.
Several satellite instruments, some of which are not yet launched, promise to provide much denser data (e.g., finer spatial or temporal resolutions) on air pollutants than can be obtained from earlier satellite instruments (e.g., OMI; Figure 2). The European Space Agency's TROPOspheric Monitoring Instrument (TROPOMI; launched in 2017; Veefkind et al., 2012) collects data on NO2, SO2, CO, and methane (CH4) at sub‐urban spatial resolutions (e.g., a few kilometers), much finer than previous instruments. An emergent constellation of satellites in geosynchronous orbit (Judd et al., 2018) is planned to observe NO2, SO2, CO, and CH4 over North America (NASA Tropospheric Emissions: Monitoring Pollution, TEMPO; not launched yet; Chance et al., 2013), East Asia (Korean Aerospace Research Institute's Geostationary Environment Monitoring Spectrometer, GEMS: launched February 2020; Kim et al., 2020), and Europe (European Space Agency's Sentinel‐4; not launched yet; Gulde et al., 2017).
2.2. Global AQ Forecasts
Several large modeling centers, such as NASA and the Copernicus Atmosphere Monitoring Service (CAMS; https://atmosphere.copernicus.eu/), provide global AQ forecasts. The NASA Global Modeling and Assimilation Office (GMAO) develops and maintains their Goddard Earth Observing System (GEOS) Earth system models, which have a suite of capabilities, including simulating weather, climate, and chemistry‐climate interactions. A new GEOS modeling system, GEOS Composition Forecast (GEOS‐CF; https://gmao.gsfc.nasa.gov/weather_prediction/GEOS-CF/), produces a global 5‐day AQ forecast once a day, simulating the chemistry and transport of over 200 gas and particulate phase species and tracers, at a horizontal resolution of ∼25 × 25 km2 (Keller, Knowland, et al., 2021). The forecasts are free and publicly available and the forecasts may be visualized with the GMAO Framework for Live User‐Invoked Data (FLUID) web tool (https://fluid.nccs.nasa.gov/cf).
Keller, Knowland, et al. (2021) present a validation of the GEOS‐CF forecasts that shows that the GEOS‐CF forecasts credibly capture high pollution events (e.g., urban photochemistry, wildfires, and dust storms). Evaluation and validation of modeled trace gases and aerosols compared against satellite observations and surface monitoring data show that GEOS‐CF successfully reproduces the spatial and temporal variability of air pollutants in many regions of the world and during all seasons. For example, GEOS‐CF shows little overall bias and root mean square error for NO2 and O3 as compared to surface observations. For PM2.5, the current version of GEOS‐CF (v1.0) is biased high because of known issues in the chemistry module which powers GEOS‐CF ‐ GEOS‐Chem v12.1 (Bey et al., 2001; Keller et al., 2014; Long et al., 2015); the issues have been addressed in later GEOS‐Chem model versions. The comparisons against surface observations also show that the 5‐day AQ forecasts produced by GEOS‐CF have skill scores comparable to the daily historical model estimates, even though the correlation against hourly observations is reduced for forecasts with a lead time of 3 days or more.
2.2.1. Downscaling Forecasts to Individual AQ Monitors
While the horizontal resolution of GEOS‐CF is one of the finest for a global AQ forecasting system (i.e., 25 × 25 km2), it is too coarse to resolve small‐scale variations (i.e., representational error associated with emissions, chemistry, topography, and weather) in air pollution distributions in urban areas, especially in mountainous or coastal terrain. Even finer‐scale regional AQ models currently have too coarse spatial resolution to simulate the emissions, chemistry, and dynamics that affect the local concentrations of some pollutants, such as NOx near roadways. In addition, a model also has inherent biases because of gaps in scientific knowledge in the processes associated with weather, chemistry, and emissions.
To overcome these issues, the forecasts can be localized (or downscaled) using machine learning (ML) algorithms for locations where historical AQ monitor data exists (e.g., Keller, Evans, et al., 2021; Keller, Knowland, et al., 2021). Based on historical model‐observation comparisons, a ML algorithm can be trained to learn the systematic model‐observation mismatches (i.e., the model “bias”). The model bias is not constant in time but depends on the current meteorological and chemical environment, and the ML algorithm is trained to learn this dependency of the model bias as a function of current conditions at the given location. Once developed, these correction factors can be calculated and applied to the GEOS‐CF forecasts on an ongoing basis to generate localized forecasts that capture the observations much better. For example, Figure 3 shows observed concentrations of NO2, O3, and PM2.5 at Rio de Janeiro (Brazil) and Quito (Ecuador) compared with the corresponding original GEOS‐CF model historical simulations and the bias‐corrected model estimate.
Figure 3.
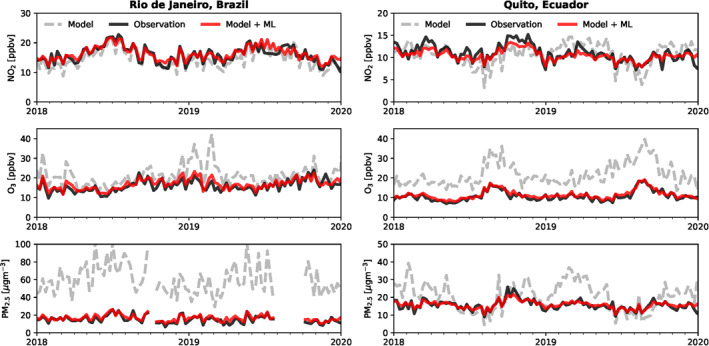
Two examples of localized bias‐corrected Goddard Earth Observing System‐Composition Forecast (GEOS‐CF) model estimates using machine learning (red solid lines; Keller, Evans, et al., 2021; ML code publicly available at https://doi.org/10.5281/zenodo.5484065; Keller & Ronaghi, 2021) applied to AQ monitor data (black solid lines; accessed via the OpenAQ website, https://openaq.org/) compared against the original GEOS‐CF simulated concentrations (gray dashed lines) of NO2, O3, and PM2.5, which were accessed via https://gmao.gsfc.nasa.gov/weather_prediction/GEOS-CF/data_access/. The downscaled model output (red solid lines) has much lower biases than the original model output for all three pollutants, especially PM2.5 in Rio and O3 in Quito; both cities are located in difficult environments (i.e., mountainous and coastal) for the relatively spatially coarse GEOS‐CF model to represent.
The ML bias‐correction approach directly relates the relatively coarse (i.e., 25 × 25 km2) model output to a given observation location and can be easily extended to any location (e.g., Section 3.4) with available AQ observations, such as those archived in the OpenAQ database (https://openaq.org/). Ideally, the historical observation record is at least two years long, but we find that satisfactory results can also be achieved with shorter data records. In addition, the methodology is likely applicable to low‐cost sensor data if the sensor is measuring continuously at the same location.
We recommend that health and AQ stakeholders use ML bias‐corrected model output for their applications, if available. Even without bias correction, there is value in the AQ forecast output for locations without any existing ground‐based monitoring. This is especially true for locales impacted by regional‐scale pollution events, such as from agricultural burning (e.g., Section 3.3.1), wildfires, and dust storms. As part of a NASA pilot project, tailored GEOS‐CF forecasts using site‐specific, bias‐corrected ML estimates of Keller, Evans, et al. (2021) and Keller, Knowland, et al. (2021) are currently produced by NASA for 15 cities in Central and South America (in direct response to end user interest). As mentioned in Section 3.4, the next phase of the project will be to make these localized forecasts available via an app to any world city, which archives their surface AQ monitor data in the OpenAQ database. The ML algorithm code described in Keller, Evans, et al. (2021) and Keller, Knowland, et al. (2021) are also openly available (Keller & Ronaghi, 2021) and health and AQ stakeholders with the corresponding technical expertize may apply it to their own AQ monitor data.
2.3. Low‐Cost Sensors
Low‐cost sensors for AQ monitoring are characterized as being less expensive alternatives to more traditional or regulatory‐grade monitoring instruments (e.g., with a price of several hundred USD as compared to tens of thousands of USD for a regulatory‐grade instrument). This lower cost makes the sensors suitable for larger‐scale deployments than are possible using traditional instruments, as well as for community science applications and portable exposure monitoring (Loh et al., 2017; Snyder et al., 2013; Turner et al., 2017). Low‐cost monitoring packages typically combine electrochemical sensors for gases with optical particle detectors for particulate matter. They also generally include means of data collection and wireless transmission, as well as batteries allowing for autonomous operation. As a trade‐off for their lower cost, they tend to be less accurate than regulatory‐grade monitors and are affected by cross‐sensitives between pollutant species as well as sensitivity to environmental conditions, such as temperature and humidity (Popoola et al., 2016). Extensive calibration of low‐cost sensors during co‐location with regulatory‐grade instruments, using linear or nonlinear methods, can improve the performance of these sensors, although residual uncertainties remain (Cross et al., 2017; Hagan et al., 2018; Malings, Tanzer, Hauryliuk, Kumar, et al., 2019; Malings, Tanzer, Hauryliuk, Saha, et al., 2019; Spinelle et al., 2015; Zimmerman et al., 2018).
In areas where regulatory‐grade AQ monitoring instruments are absent, low‐cost sensors provide an important tool for filling AQ data gaps. For example, deployments of low‐cost sensors in Kigali, Rwanda, were still able to identify and quantify the noticeable impact that a “car‐free Sunday” policy had on AQ in the city during the morning hours. This was possible because of the high temporal resolution and spatial coverage across the city of the low‐cost sensor data. In contrast, the only other source of AQ data in the city at that time, an integrated filter sampler, did not detect these benefits. Integrated filter samplers collect the cumulative mass of pollutants over extended time intervals (in this case, a day), and so could not identify such time‐of‐day‐specific changes in AQ (Subramanian et al., 2020). Low‐cost sensors can also be used for temporary deployments after natural disasters. For instance, sensors deployed to Puerto Rico in the aftermath of Hurricane Maria in 2017, when failures in the local power grid prevented the use of regulatory AQ monitors, tracked elevated SO2 levels because of the extensive use of diesel‐powered emergency generators during the post‐hurricane recovery (Subramanian et al., 2018).
Low‐cost sensors can also be used to supplement regulatory monitoring, improving spatial and temporal data density and coverage. For example, an extensive network of more than fifty low‐cost sensors in the Pittsburgh area operating since 2017 has provided spatially and temporally dense data, which has allowed for quantification of environmental justice issues in the city (Tanzer et al., 2019) as well as identification and quantification of the impacts of individual emission sources (Eilenberg et al., 2020). Overall, while not as accurate as regulatory‐grade monitoring instruments, the relative ease of purchase, deployment and operation of low‐cost sensors allows them to supplement these instruments and fill in gaps where existing coverage is limited or lacking.
Low‐cost sensor data can also be combined with other data sources to improve the overall understanding of local AQ. Combinations of high spatial resolution atmospheric dispersion models and dense networks of low‐cost sensors for near‐real‐time updating of model output showed promising results in Oslo, Norway (Schneider et al., 2017) and Imperial Valley, California, USA (Ahangar et al., 2019). Use of low‐cost sensor data to calibrate statistical models (incorporating land use and meteorological information to estimate AQ) also improved accuracy with respect to the use of the same methods with regulatory monitoring sites in Imperial Valley because of the larger number of sites available through the low‐cost sensor network (Bi et al., 2020). Using low‐cost sensors to provide ground‐based information to relate satellite‐derived quantities (especially AOD) to surface concentrations has also shown promise, especially where low‐cost sensors can provide broader spatial data coverage as compared to more sparsely distributed regulatory monitoring sites (Gupta et al., 2018; Malings et al., 2020). A recent project combining satellite AOD, regulatory monitoring station data, and an extensive network of thousands of low‐cost sensors has facilitated regional‐scale air pollution mapping over the island of Taiwan (Li et al., 2020).
3. Improving Stakeholder Use of NASA Resources
In this section, we discuss three primary methods that are being employed to enable health and AQ stakeholders to use NASA resources in their standard operating procedures. First, we highlight the free and publicly available resources of the NASA Applied Remote Sensing Training (ARSET) program, which provides stakeholder training in the use of satellite data. Second, we discuss how scientists with expertize in satellite data are creating data products that are of interest to the health and AQ communities, thereby eliminating the need for non‐experts to download and process satellite data or AQ forecast output. We also make recommendations for ways that satellite data experts, in consultation with stakeholders, can broaden the use of NASA resources. Third, we provide illustrative case studies to demonstrate how NASA resources may augment existing data from low‐cost sensors and AQ monitors. Finally, we provide a real‐world example, the NASA‐World Resource Institute (WRI) “CityAQ” pilot study, to demonstrate how these methods are integrated into the project design with the goal to improve the use of NASA resources by health and AQ stakeholders.
3.1. Capacity Building Through NASA ARSET
The NASA Earth Science Division's Applied Sciences Program supports the ARSET program (https://appliedsciences.nasa.gov/arset) to promote and facilitate the use of satellite data for decision‐making and environmental management (Prados et al., 2019). The ARSET training activities help users to gain the skills and knowledge necessary to evaluate the suitability and quality of NASA global data products for their own purposes. For example, data quality can vary regionally and temporally, and it is important for stakeholders to gain the technical skills to make these assessments. In 2009, ARSET began providing in‐person courses for AQ stakeholders. Online courses were added in 2011, and since then, the program has expanded to include online and in‐person courses in agriculture, disasters, fire, land, and water resources management. The ARSET website (https://appliedsciences.nasa.gov/what-we-do/capacity-building/arset) contains free instructional materials and past webinar recordings in English and Spanish at various levels of user proficiency. In 2020 alone, the program reached over 27,000 participants from 162 countries who represented more than 6,200 organizations from government, academia, and the for profit and non‐profit private sector.
3.2. Processed Data Products for Health and AQ Applications
NASA categorizes satellite data products based on the degree of processing with the data products designated as “Level 3” (L3) and “Level 4” (L4) having the greatest potential to enable health and AQ applications on a large scale. Level 0 (L0) and 1 (L1) data represent unprocessed and slightly processed data, respectively. These data levels are typically not used by stakeholders. Level 2 (L2) data are derived geophysical variables (e.g., NO2 VCD) on the native (or reduced) resolution of the satellite instrument. L3 data are derived from L2 data and mapped onto a uniform latitude/longitude grid and averaged over time (e.g., monthly). L4 products are geophysical variables either from atmospheric model output (e.g., GEOS‐CF global AQ forecasts; Section 2.2) or developed from analysis of lower Level (0–3) satellite data with an atmospheric model. The most prominent and arguably successful example of a L4 data product for health and AQ applications is yearly mean surface PM2.5 (van Donkelaar et al., 2010), which is derived from satellite data of aerosols (e.g., AOD). The data are publicly available via the NASA Socioeconomic Data and Applications Center (SEDAC), which is one of the Distributed Active Archive Centers (DAACs) in the NASA Earth Observing System Data and Information System (EOSDIS). Both L3 and L4 data products are typically most useful to stakeholders as the data processing and product development are done for them (e.g., Anenberg et al., 2020). That is, there is no need for a stakeholder to have the financial and computational resources, as well as the expertize, to download and process terabytes of satellite data.
To enable broader usage of these L3/4 data products, we recommend that data product developers work in consultation with health and AQ stakeholders to address the following issues (in no particular order). We base these recommendations on feedback from health and AQ stakeholders, including through NASA ARSET program questionnaires. Some of our recommendations echo those in Anenberg et al. (2020).
Validation: Most stakeholders are interested in how a satellite data product relates to data from a surface AQ monitor. For example, how does satellite‐observed AOD relate to surface PM2.5? The Surface Particulate Matter Network (SPARTAN) is an example of a network set up to answer this question (Snider et al., 2015). Though there are a few networks to answer these questions for AOD, NO2, and a few other air pollutants, there needs to be an expansion of these types of networks to instill confidence in the satellite data by the health and AQ communities.
Assessment of Uncertainties and Errors: Many health and AQ stakeholders require robust quantification of the uncertainties associated with L3/4 data products for their applications. As discussed in Duncan et al. (2014), these uncertainties include instrument uncertainties along with those associated with the creation of the data products (e.g., the assumptions used in the creation of VCDs), while errors include both random and systematic ones. The uncertainties associated with L3/4 data products are sometimes documented in journal articles, though the target audience of these journals is primarily expert data users.
Documentation: Health and AQ stakeholders often request that the L3/4 data products be thoroughly documented. This documentation would include information on data product validation and the assessment of uncertainties and errors (as discussed above), but also include guidance on the appropriate use of the data products for specific applications. For example, it would not be appropriate to assume that spatio‐temporal trends in AOD from a satellite reflect trends in surface PM2.5. However, spatio‐temporal trends in NO2 from a satellite may adequately reflect trends in surface NO2 in some situations (e.g., urban settings) given its short atmospheric lifetime and strong near‐surface sources (e.g., cars, power plants). Such documentation would inform stakeholders as to which data products are appropriate and robust for their specific applications and which data products require additional lines of evidence from which to draw conclusions.
Ease‐of‐Access: NASA has invested in a number of data processing and visualization tools (e.g., Duncan et al., 2014), including the interactive visualization and analysis web tool, Giovanni (https://giovanni.gsfc.nasa.gov/giovanni/), and the Worldview visualization tool (https://worldview.earthdata.nasa.gov/). These tools have the potential to further enable the use of L3/4 data products for health and AQ applications if the data are made available within the tools.
Data Product Recommendations: There are numerous examples of L3/4 satellite data products for the same pollutant, including from the same satellite instrument. This situation leads to confusion among health and AQ stakeholders as to which data product they should use. Consequently, health and AQ stakeholders often request that data product developers recommend a specific data product for each pollutant and for each application (e.g., AQ monitoring, plume tracking, and environmental justice).
Mechanism for Stakeholder Feedback: A formal mechanism for stakeholders to provide feedback would help guide improvement of the L3/4 data products for health and AQ applications.
Guidance Directory: Health and AQ stakeholders often request a “guidance directory” of the data, tools, documentation, and other resources that are best suited to their AQ management challenges. This guidance directory would include all of the elements above in a “one‐stop shop” environment, focusing on the L3/4 products known to be most useful to decision‐making agencies. For example, the nascent NASA Pathfinders website (https://earthdata.nasa.gov/learn/pathfinders/) could serve as a model for such a “guidance directory.”
3.3. Illustrative Case Studies of a Cost‐Effective Approach to AQ Monitoring
Illustrative case studies developed by the data product developers, in consultation with health and AQ stakeholders, demonstrate how NASA resources may complement data from low‐cost sensors and surface monitors for health and AQ applications. In this section, we present several illustrative case studies to demonstrate the methodology of how one may use NASA satellite data and AQ model forecasts, two of the AQ technologies in Figure 1, along with free and publicly available software, as part of a cost‐effective way to monitor and understand variations in pollution and to attribute sources. These NASA resources may be supplemented by data from a low‐cost sensor or regulatory‐grade network. The ARSET website contains additional information, tutorials, and recorded presentations on how to use the satellite data tools, and case studies on their use. The resources used in the case studies that follow are:
-
Satellite Data:
NASA Worldview (https://worldview.earthdata.nasa.gov/). Worldview provides the capability to interactively browse a wide variety of global satellite imagery and then download the underlying data. Some air pollution imagery are available within three hours of observation collection.
EO Browser (http://apps.sentinel-hub.com/eo-browser/). EO Browser provides the capability to interactively browse satellite imagery, including of air pollutants (e.g., NO2, SO2, and CO) from TROPOMI.
TROPOMI Data (http://www.tropomi.eu/tools). Free and publicly available tools are available for analyzing and visualizing TROPOMI data.
TROPOMI Data (L2) were also downloaded from the NASA EarthData website (https://search.earthdata.nasa.gov/search) and can be plotted with MATLAB, Python or other similar software, some of which are open source.
NASA Model Forecasts (https://fluid.nccs.nasa.gov/). The GEOS‐CF forecasts are described in Section 2.2. Another GEOS forecast system, GEOS Forward Processing system (GEOS‐FP; https://gmao.gsfc.nasa.gov/weather_prediction/), is run four times a day and predicts weather, aerosols and VCD of O3 (Lucchesi, 2018). Historical model estimates are available for the GEOS‐CF and from GEOS reanalysis products like MERRA‐2 (Modern‐Era Retrospective analysis for Research and Applications, Version 2; https://fluid.nccs.nasa.gov/reanalysis/).
NOAA Hybrid Single Particle Lagrangian Integrated Trajectory (HYSPLIT) Model (https://ready.arl.noaa.gov/HYSPLIT.php). The HYSPLIT model, as used here, is a free and publicly available software program for computing simple air parcel trajectories, though it has more extensive capabilities.
The skill level required to use these tools is beginner, except for processing TROPOMI L2 data, which is intermediate‐advanced. Skill level refers to using the tool, not necessarily accurately interpreting the data.
3.3.1. City AQ Agencies Around World: Kigali, Rwanda (June 10–14, 2020) as an Example
Agricultural burning is a common seasonal source of pollution in many tropical and subtropical cities around the world, while wildfires are typically anomalous events. Smoke from both agricultural burning and wildfires can lead to acute exposures of large populations to very unhealthy levels of pollution. Here, we show an example of how regional pollution generated from seasonal agricultural burning degraded AQ in Kigali, Rwanda, beyond typical air pollution levels associated with traffic and domestic biofuels (Subramanian et al., 2020), and how NASA resources could be used to monitor the regional build‐up of pollution as well as to forecast the long‐range transport of the smoke and potential episodes of unhealthy air in Kigali.
On June 9, 2020, smoke from numerous agricultural fires in the Democratic Republic of Congo created widespread smoke in much of central Africa, including Rwanda. Figure 4 is a true color satellite image, which is similar to how the human eye would see the scene, and clearly shows the haze. Satellite data of fire activity show the locations of numerous active agricultural fires in Figure 4 at the satellite overpass and the AOD indicates the amount of smoke present. These images were generated using the NASA Worldview webtool.
Figure 4.
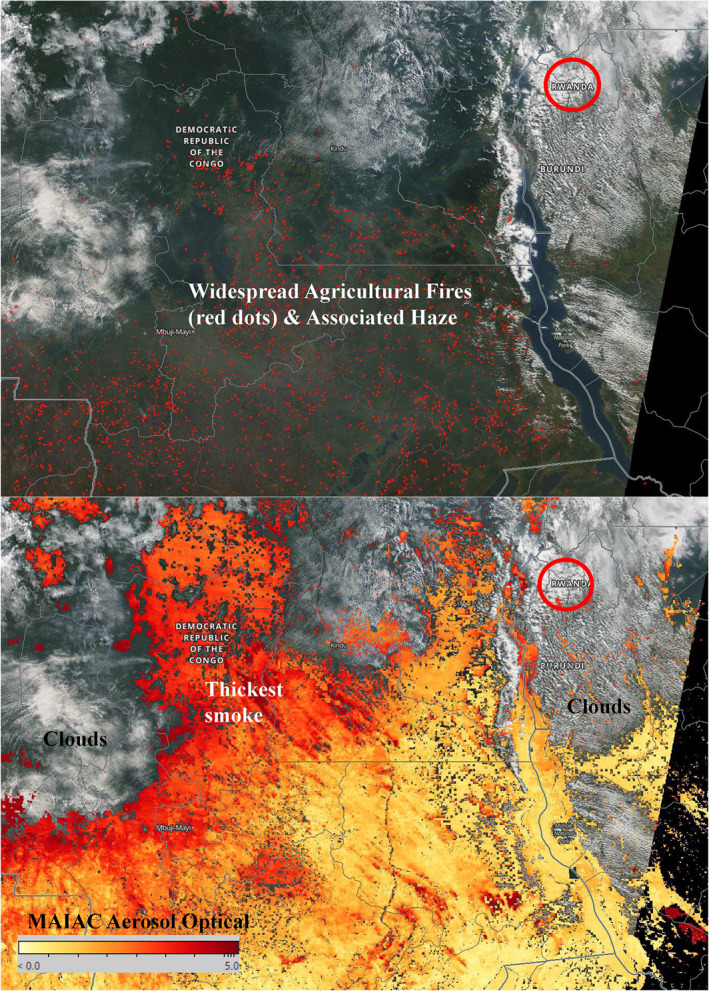
Moderate resolution Imaging Spectrometer fire‐counts (top) and aerosol optical depth (bottom) satellite data on June 9, 2020 accessed from Worldview. Rwanda is indicated with a red circle and was experiencing mostly cloudy skies at the time of the satellite overpass.
The GEOS‐CF 5‐day forecast animation of surface PM2.5 (snapshot provided as Figure 5) shows how the smoke is expected to flirt with Kigali for several days and then impact the city more substantially toward the end of the forecast period. GEOS‐CF forecasts indicate that CO, O3, and PM2.5 all will increase throughout the atmosphere above Kigali, including to unhealthy levels at the surface (Figure 6). The composition (or speciation) of the PM2.5, which will aid in emission source identification, is also output by the GEOS‐CF model and shown with “datagrams” in Figure 6. The plots shown in Figures 5 and 6 were generated with the FLUID webtool. As discussed in Section 2.2.1, the AQ forecast for Kigali may be tailored to specific AQ monitoring stations if a 2+ year data record of one or more pollutants are placed in the OpenAQ archive (https://openaq.org/).
Figure 5.
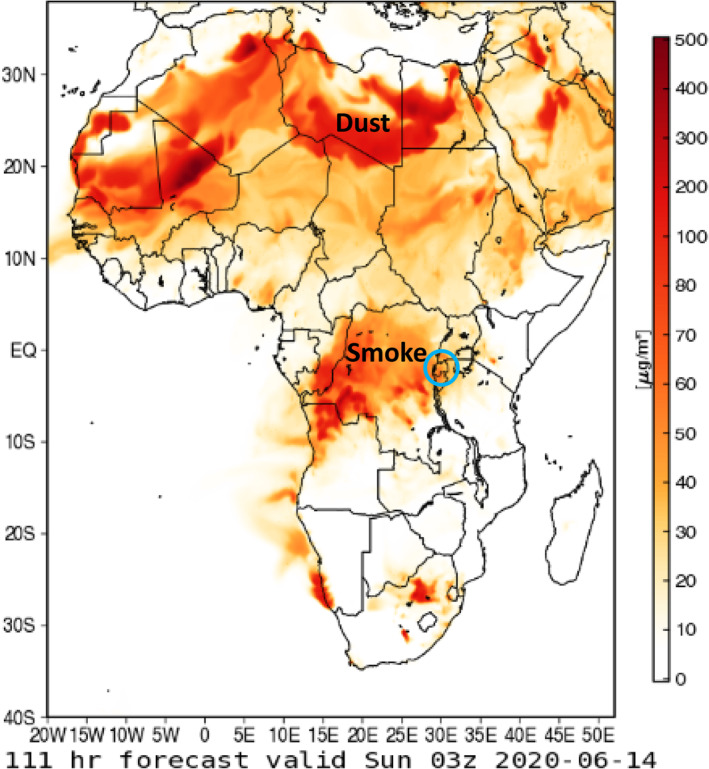
Goddard Earth Observing System‐Composition Forecast image of surface PM2.5 on June 14th accessed via Framework for Live User‐Invoked Data in June 2020. The location of Rwanda is indicated with a blue circle.
Figure 6.
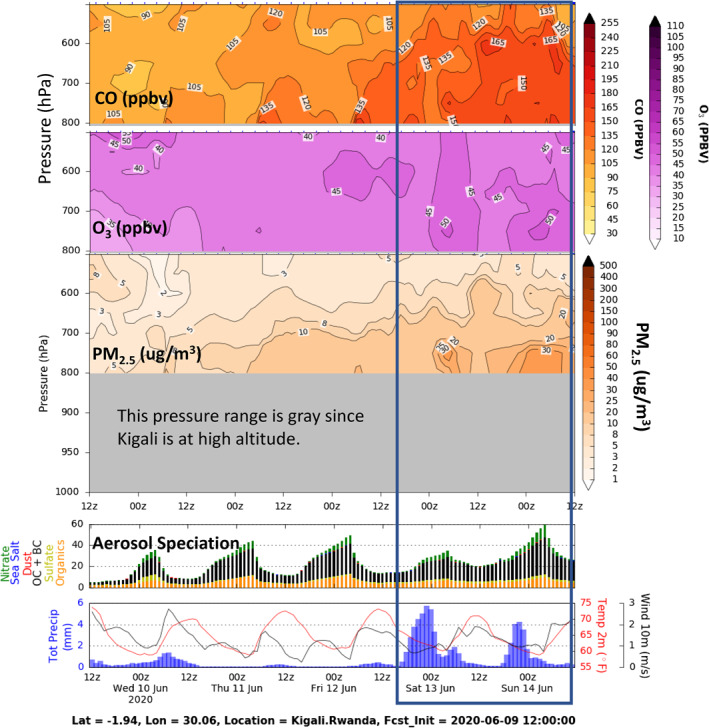
“Datagrams” modified from Framework for Live User‐Invoked Data for Kigali from June 10 to 14, 2020, based on a forecast initiated on June 9, 2020. The images were accessed in June 2020. The smoke is forecasted to continue to degrade air pollution in the city over the forecast period, especially the last two days (outlined in blue). The aerosol speciation indicates that “OC + BC,” organic and black carbon (a major component of smoke), is the dominant contributor to the aerosol loading.
Together, the satellite data and GEOS‐CF forecast animation (Figures 4 and 5) over Africa provide the “big picture,” while the “datagram” in Figure 6 gives local AQ forecasts for Kigali. The forecasts also provide information when clouds or gaps in coverage limit the detection of pollutants by satellites (Figure 7), as well as between overpass times. Conversely, the lack of satellite data does not allow one to verify the forecasted values under cloudy conditions unless surface data, such as from low‐cost sensors, are available (e.g., Subramanian et al., 2020).
Figure 7.
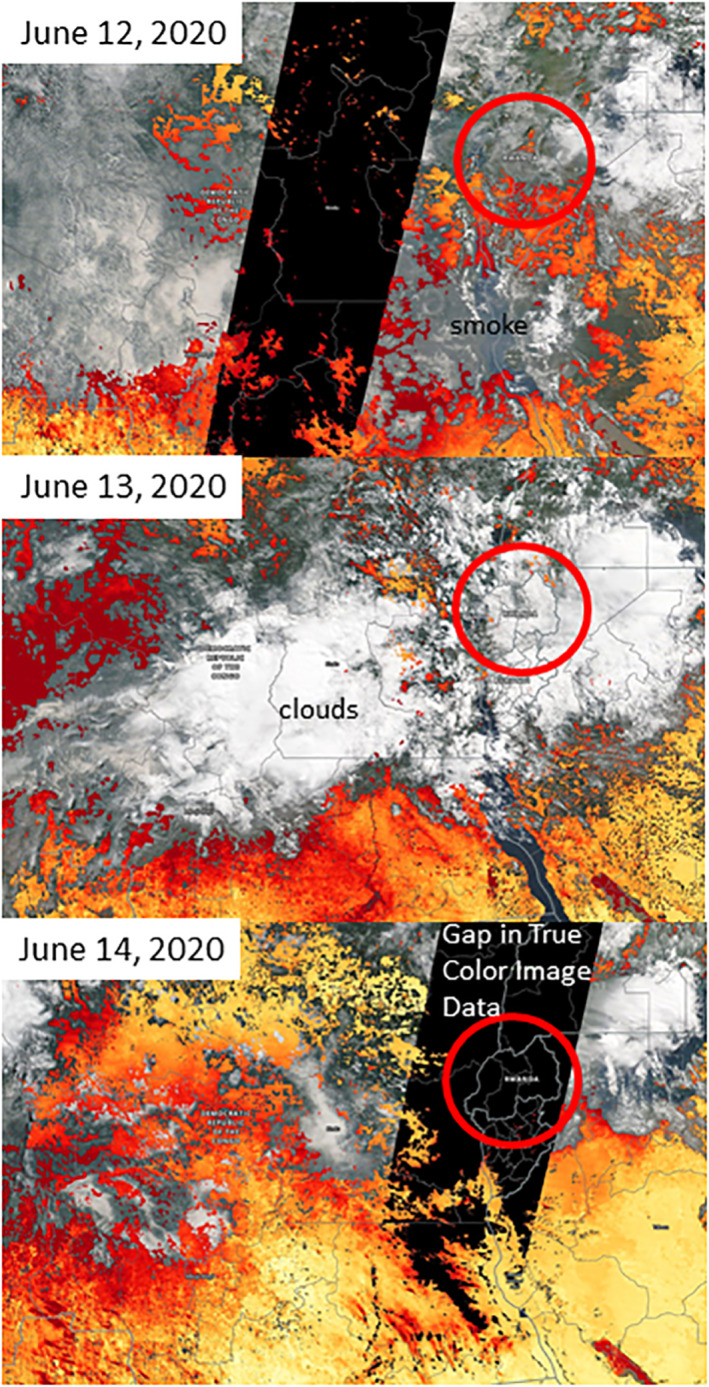
True color image with aerosol optical depth (AOD) visualized with Worldview for three days. The black area indicates a gap in swath overlap of the true color image. Missing AOD data are primarily associated with clouds. The location of Rwanda is indicated with a red circle. Images produced with Worldview.
3.3.2. Offshore and Coastal AQ: USA Bureau of Ocean Energy Management
The Outer Continental Shelf Lands Act (OCSLA) requires the USA Department of Interior Bureau of Ocean Energy Management (BOEM) to ensure compliance with the USA National Ambient AQ Standard (NAAQS) so that Outer Continental Shelf (OCS) oil and natural gas (ONG) exploration, development, and production do not significantly impact the AQ of any USA state. In 2017, BOEM and NASA entered into an interagency agreement to begin a study to scope out the feasibility of BOEM personnel using a suite of NASA and non‐NASA resources to assess how pollutants from ONG exploration, development, and production activities affect AQ. The outcomes of the study are documented in two reports: the first report highlights the NASA resources that may be used to monitor offshore and coastal AQ (Duncan, 2020) and the second provides an evaluation of NASA's remote‐sensing capabilities in coastal environments (Thompson, 2020). Here we present one of the case studies (Duncan, 2020) prepared for BOEM to illustrate a cost‐effective approach to air pollution monitoring in the Gulf of Mexico region.
There was predominately offshore flow near the surface from Cocodrie, Louisiana, USA and points eastward on September 5, 2019, as simulated by the GEOS‐FP forecast (and visualized with the FLUID webtool) and NOAA HYSPLIT models (Figure 8) (Cocodrie is a small town located near areas of intensive ONG operations, including the Gulf of Mexico Louisiana Offshore Oil Port (LOOP), and was the location of a BOEM‐NASA intensive field campaign in May 2019; Thompson, 2020). In this flow pattern, pollution from onshore sources moved offshore, over areas of the Gulf of Mexico ONG operations, and back onshore west of Cocodrie. Recirculation of continental pollution in the Gulf of Mexico is a common feature, which highlights the utility of the GEOS‐CF forecasts to help identify pollution source regions, as we describe below.
Figure 8.
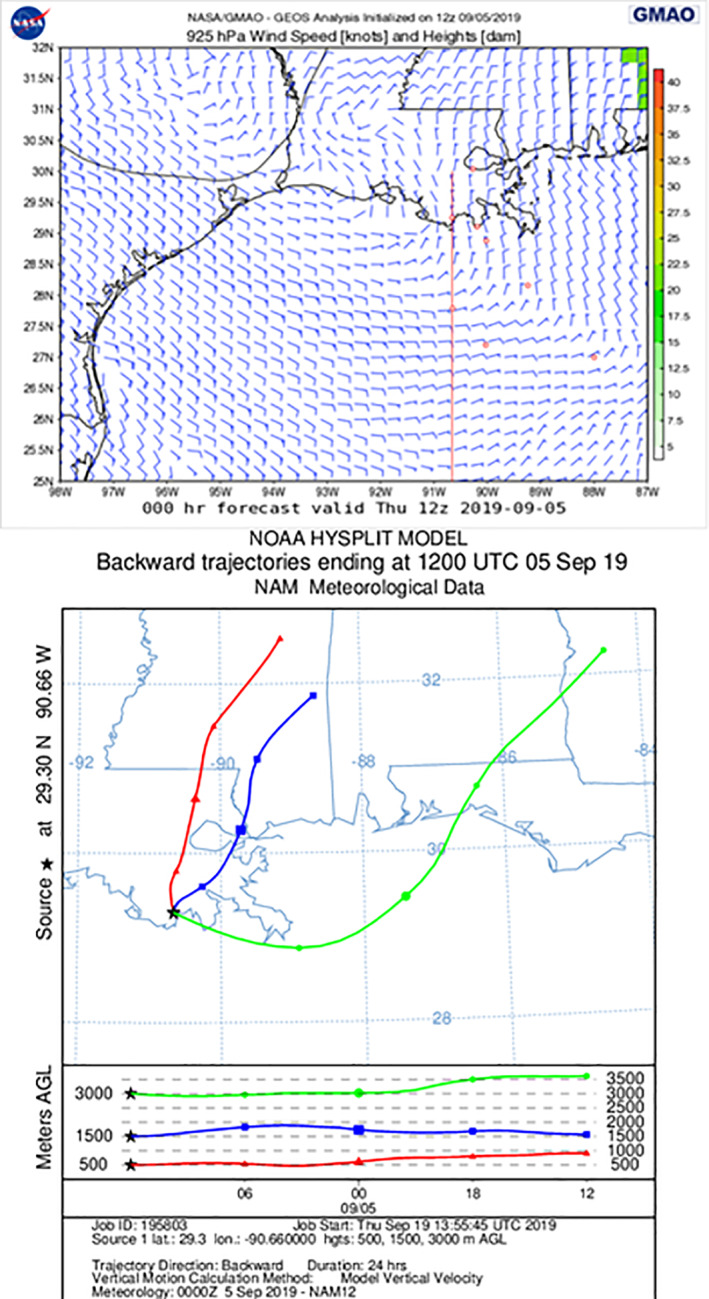
(Top) Wind speed and direction from GEOS Forward Processing system visualized with Framework for Live User‐Invoked Data (FLUID). Feathers on wind barbs indicate the strength (longer for stronger) and direction the wind is blowing from. (bottom) Backward trajectories from the HYSPLIT model on September 5, 2019. The red dots and line (top) represent the locations of specialized forecasts on FLUID created for a field campaign associated with the BOEM‐NASA interagency agreement; they correspond to cities, major ONG platforms and the Louisiana Offshore Oil Port (LOOP) (see Figure 9).
Multiple, simulated pollutants from the GEOS‐CF forecast show the complex gradients of pollutants at the surface as well as in the vertical, including that most of the pollution from onshore sources was confined to a shallow layer generally below 800 hPa in the Gulf of Mexico. Figure 9 illustrates these gradients in CO, NO2, and O3. The simulated pollutants and meteorological variables provide valuable information on the contribution of onshore sources to the Gulf of Mexico even though the GEOS‐CF simulation does not include pollutant emissions from offshore ONG sources (as of the time of writing) and there tends to be a high bias in simulated O3.
Figure 9.
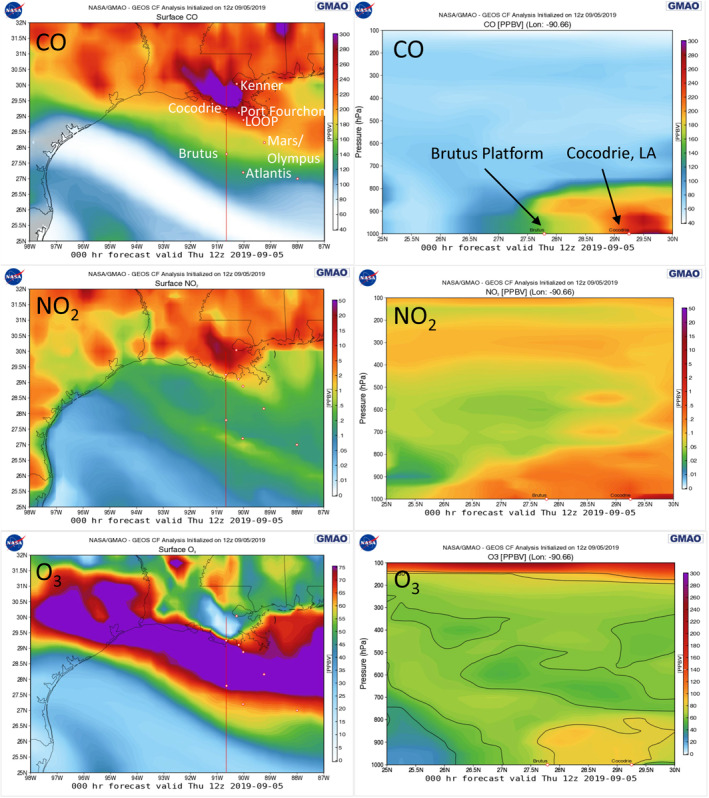
Simulated concentrations for CO (top), NO2 (middle), and O3 (bottom) from the Goddard Earth Observing System‐Composition Forecast forecasts accessed via Framework for Live User‐Invoked Data in September 2019. Near‐surface concentrations for the region of interest are shown for September 5, 2019 (left). The red line in these figures (left) indicates the location for the corresponding cross‐section plots (right).
Clear skies extended far offshore (Figure 10), allowing for satellite data collection over most of the region (Figure 11). The simulated gradients in NO2 and CO are generally similar to those observed from space (Figures 9 and 11). Given its short lifetime (∼hours), the highest TROPOMI NO2 VCDs are near emissions sources. NO2 levels are relatively high near the shore, which is likely associated with onshore emissions that were transported offshore, mixing with offshore pollution, such as from shipping and offshore ONG activities. High NO2 concentrations from large offshore sources, such as the LOOP, are visible in the satellite imagery (Figure 11). There is less of a gradient in CO, which has a longer lifetime (∼month). However, the data indicate rather widespread levels of pollution in the Gulf of Mexico, which is consistent with offshore flow. The white areas indicate where TROPOMI data are missing because of clouds and aerosols. The white areas do not cover the same areas for NO2 and CO even though both datasets were collected from the same instrument. This happens as the processes of generating the products differ and have different sensitivities to clouds and aerosols.
Figure 10.
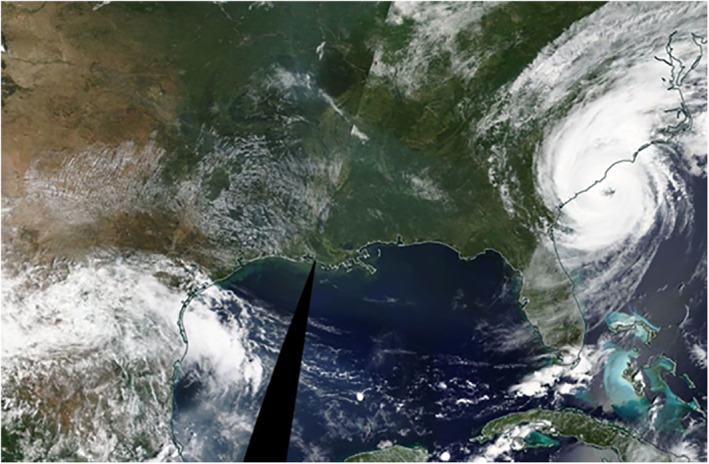
NASA Terra/Aqua Moderate resolution Imaging Spectrometer (MODIS) True Color Imagery of the Gulf of Mexico at midday on September 5, 2019. Image processed and downloaded from Worldview.
Figure 11.
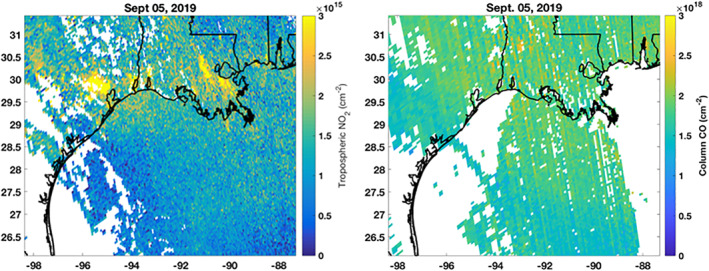
TROPOMI (left) tropospheric vertical column densities (VCDs) of NO2 (×1015 molecules/cm2) and (right) total VCDs of CO (×1018 molecules/cm2) on September 5, 2019. Refer to Figure 9 for locations of large ONG platforms in the Gulf of Mexico. TROPOMI data were downloaded from the NASA EarthData website (https://search.earthdata.nasa.gov/search).
3.3.3. Stratospheric Influence on Surface AQ: Possible Mix of Natural and Anthropogenic O3
Within large‐scale weather systems, the interaction between the troposphere—where weather happens—and the stratosphere above—where there is a protective layer of high concentrations of O3—can lead to stratospheric O3 being brought into the troposphere (e.g., Knowland et al., 2015), possibly leading to bad AQ at the surface (e.g., Lin et al., 2015). While the weather systems that lead to these “stratospheric intrusions” occur year‐round, there is a build‐up of O3 in the lower stratosphere during late winter and early spring, which increases O3 concentrations within intrusions. These events are most likely to directly influence communities at high elevations, as there is less distance between ground‐level and the stratosphere, but the stratospheric air can reach sea‐level when associated with convective systems (Dreessen, 2019) or if the filament remains intact and descends to the surface in a subsequent weather system (Knowland, Doherty, et al., 2017). Because these events are associated with distinct weather phenomena, AQ managers use weather forecasts to identify regions where a stratospheric intrusion is likely to happen. Using a combination of meteorological and chemical forecasting products from GMAO, AQ managers could have early warnings of natural sources of O3 and the potential impact on surface O3 concentrations. Here, we demonstrate a case with GMAO's state‐of‐the‐science weather forecasting system, GEOS‐FP (Lucchesi, 2018), and then use GEOS‐CF forecasts to view the vertical distribution of O3 concentrations in the troposphere and, thereby, identify where high O3 concentrations may impact surface AQ.
Meteorological indicators include air masses with characteristics of the stratosphere, such as air that is cooler and dryer than the tropospheric air around it. Stratospheric intrusions are associated with upper‐level (300–500 hPa) troughs and cut‐off lows, which can be seen in geopotential height maps as protruding toward the equator, instead of a ridge pointing toward the poles. A 36‐h forecast from GEOS‐FP, initialized on April 26, 2021, predicts a cut‐off low (the closed circle in the geopotential height) over the southwest USA with air temperatures colder than the air to the west over the eastern North Pacific Ocean and to the east over the southeast USA at 500 hPa (Figure 12a). At the base of the trough, the wind speeds increase as the air converges, and this air sinks toward the surface, bringing with it the filaments of stratospheric air. In the forecast example, at the base of the trough, around the cut‐off low, there is a “jet maximum” (strongest wind speeds) stretching from northern California to Texas (Figure 12b). Over much of California, within this region of fast winds converging into the base of the trough, there is a large area of descending air to the west of the cut‐off low (blue colors, Figure 12c) (It is counter‐intuitive that positive vertical velocity is descending motion; higher atmospheric pressures are at the surface so an increase in pressure is toward the ground). Stratospheric air is also more stable than the troposphere, and for this, we look for high levels of potential vorticity (at least greater than 1 PVU [potential vorticity units]). In the forecast, we see a fine‐scale feature of high PV stretching from western Nevada through southern California (Figure 12d). We expect a stratospheric intrusion to be within this fine filament of PV, where air is descending, passing over areas with large populations from Reno, Nevada to Los Angeles, California. Selecting a location near Los Angeles, NASA's Jet Propulsion Laboratory (JPL) Table Mountain Facility (TMF), high levels of O3 are descending from the top of the image toward the surface starting at 00 UTC April 28, 2021 for about 24 h. While it appears that this intrusion will influence the surface on April 29, surface O3 concentrations are predicted to remain below the US National Ambient Air Quality Standard (NAAQS: daily maximum 8 h average O3 of 70 ppbv; U.S. Environmental Protection Agency, 2015; O3 < 60 ppbv, Figure 13a).
Figure 12.
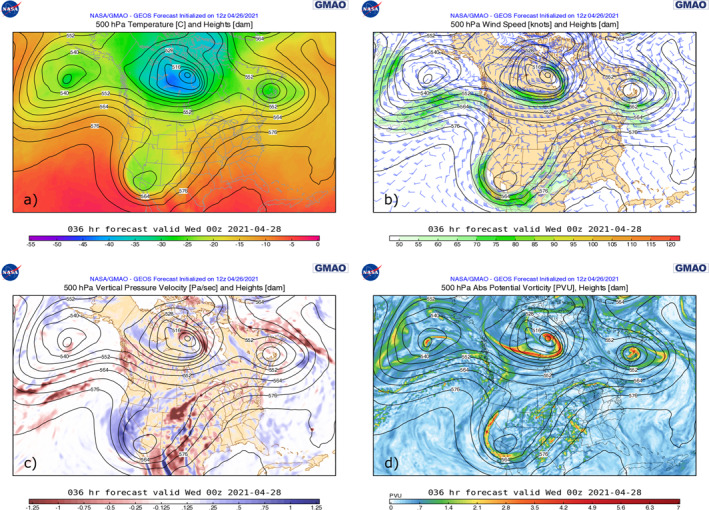
Goddard Earth Observing System‐Forward Processing 36‐h forecasts of indicators of a stratospheric intrusion which could impact surface air quality in communities in the western USA. Upper‐level (500 hPa) temperature (a), wind speed (b), vertical pressure velocity (c), and potential vorticity (d) are accessed from the Framework for Live User‐Invoked Data (FLUID) website (April 2021). Forecasts are initialized at 12 UTC on April 26, 2021 and valid for 00 UTC on April 28, 2021. Note that “00z” in the FLUID images are short‐hand for Universal Time Coordinates (UTC), and Pacific Daylight Time is −7 h offset from UTC.
Figure 13.
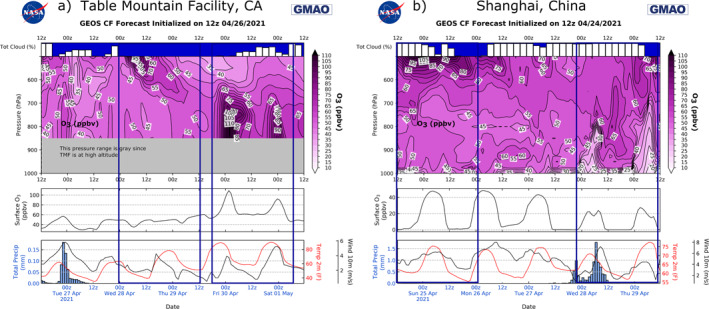
Goddard Earth Observing System‐Composition Forecast 5‐day forecasts, accessed via the Framework for Live User‐Invoked Data website in April 2021, for NASA Jet Propulsion Laboratory Table Mountain Facility, located at 2290 m elevation (over 7,000 ft) and 1.5 h to the north east from Los Angeles (left) and Shanghai, China (right). Note different forecast initialization times and different y‐axis scales for the surface O3 and meteorology timeseries in the bottom two panels.
For AQ managers and policy makers, it is critical to know if and how often the stratospheric air from above can mix down to the surface, raising O3 concentrations to unhealthy levels. The GEOS‐CF forecasts surface O3 concentrations at TMF on April 30, 2021, reaches 100 ppbv (Figure 13a), well above the NAAQS, but the model indicates this is from anthropogenic pollution, transported from Los Angeles, and not directly connected to the stratospheric air descending from above on April 28th. Stratospheric intrusions happen all over the world since they are associated with weather patterns common to the mid‐latitudes. While rare, there are also documented cases of these events happening in the subtropics in cities like Mexico City (Barrett et al., 2019) and Hong Kong (Zhao et al., 2021). As another example, a similar investigation of meteorological indicators over Shanghai, China (31.2°N, 121.5°E; not shown) led to the identification of stratospheric air likely descending toward Shanghai on April 24 and 25, 2021; however, the GEOS‐CF indicates this air remains well above the surface (above 600 hPa, Figure 13b).
In addition to meteorological indicators, a stratospheric intrusion is likely located along the tight gradient in total VCD of O3 (Knowland, Ott, et al., 2017; Olsen et al., 2000; Ott et al., 2016) and this can be seen over Nevada and California in the forecast of total VCD of O3 (Figure 14a), in a similar location as the PV filament (Figure 12d). We use satellite data to confirm the forecasts of total VCD of O3, with a similar feature of high total VCD of O3 within the area of the cut‐off low, which connects to the stratospheric reservoir over Canada. The forecast imagery on FLUID for relative humidity is tailored toward moist environments, with relative humidity greater than 70% (Figure 14b). For a stratospheric intrusion, a threshold of 20% is often set; using satellite imagery of relative humidity at 500 hPa, there is evidence of such dry air within the cut‐off low and the filament that stretches to Canada (relative humidity less than about 30% indicated by brown colors, Figure 14d). The higher values of relative humidity spatially agree well with the GEOS‐FP forecast (Figures 14b and 14d).
Figure 14.
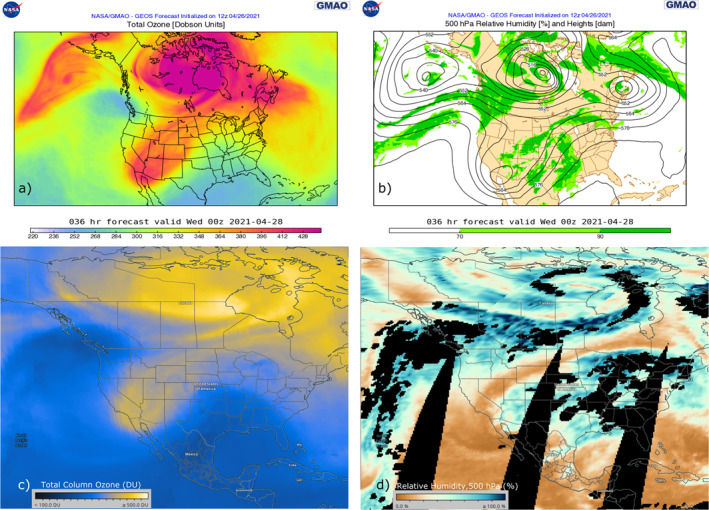
Goddard Earth Observing System‐Forward Processing 36‐h forecast, initialized April 26, 2021, of additional indicators of a weather pattern conducive for a stratospheric intrusion to occur which could impact surface air quality in communities in the western USA. Total vertical column densities of O3 panel (a) and upper‐level (500 hPa) relative humidity panel (b) were accessed from the FLUID website in April 2021. Satellite imagery of total VCD of O3 from the OMPS instrument on the Suomi NPP satellite panel (c) and 500 hPa relative humidity from AIRS, aboard the Aqua satellite, were both accessed from Worldview in April 2021.
3.4. NASA‐WRI CityAQ Pilot Study
The goal of the “CityAQ” pilot study is to work with the AQ agencies of several pilot cities, such as Quito and Rio de Janeiro, to integrate localized forecasts (Section 2.2.1; Keller, Evans, et al., 2021; Keller, Knowland, et al., 2021; Figure 3), a NASA L4 data product, into their standard operating procedures. The next phase of the project will be to make localized forecasts available to any world city which archives their surface AQ monitor data in the OpenAQ database (https://openaq.org/).
A complementary effort to the CityAQ project, is funded through the NASA Health and AQ Applied Sciences Team (HAQAST; https://haqast.org), which has the goal to facilitate the use of NASA resources by the health and AQ communities. It will expand the use of NASA resources by the CityAQ pilot cities to include satellite data in combination with their low‐cost sensors and regulatory‐grade AQ monitors—an integrated approach to cost‐effective AQ monitoring (Figure 1). Several important components of this complementary effort are capacity building activities through the NASA ARSET program (Section 3.1) and illustrative case studies (e.g., Section 3.3.1) for each city to demonstrate how the pilot cities may bring NASA resources into their standard operating procedures. An additional component of the effort is to use pollutant concentrations (PM2.5, NO2, and O3) from the GEOS‐CF forecasts (Section 2.2) as input to a health‐based AQ index (HAQI; Cromar et al., 2021), another L4 data product (Figure 15). A HAQI is a simple way to communicate the combined health risks of forecasted levels of air pollution, such as by a color‐coded numeric scale.
Figure 15.
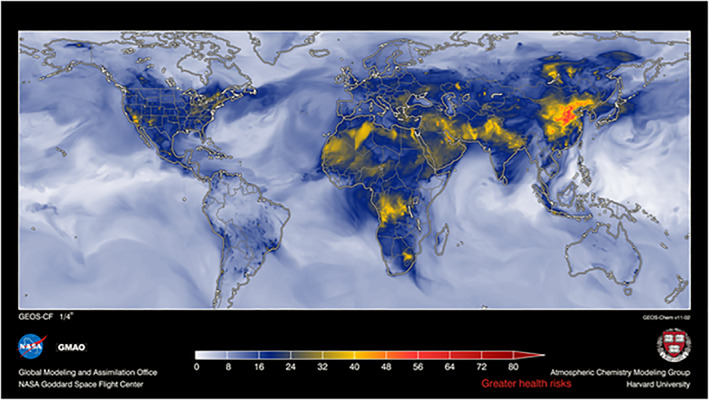
A forecast of a health‐based air quality index for July 1, 2017 that uses pollutant concentrations from the NASA Goddard Earth Observing System‐Composition Forecast air quality forecasts, which were accessed via https://gmao.gsfc.nasa.gov/weather_prediction/GEOS-CF/data_access/.
4. Summary and Recommendations
Across many health and AQ stakeholder communities, use of satellite data and AQ model output has increased with advances over the last decade in (a) satellite instrument technology and data product development, and (b) the representation of chemical and dynamical processes in AQ models along with computational efficiency. For example, a number of stakeholders regularly rely on satellite data and AQ forecasts, such as for AQ forecasting and tracking wildfire smoke. Nevertheless, most health and AQ stakeholders do not use these resources or only use them sparingly. For instance, environmental public health professionals are a large and diverse community, including burden of disease researchers, environmental justice advocates, mitigation and policy planners, and real‐time avoidance behavior operational forecasters. A few environmental public health professionals have begun successfully using satellite data and model output for their applications (e.g., Anenberg et al., 2020; Cohen et al., 2017; Demetillo et al., 2020), taking advantage of the spatio‐temporal coverage of satellite data and AQ models relative to the typical sparse coverage of data from regulatory‐grade monitors.
With several illustrative case studies, we demonstrate how NASA satellite data, NASA weather and AQ forecasts, and other NASA and non‐NASA resources may be combined (i.e., an integrated approach as recommended by Cromar et al., 2019) to monitor AQ in a cost‐effective way or to complement existing monitoring resources, such as regulatory‐grade instruments and low‐cost sensors. We highlight some of the strengths and limitations of the various technologies and discuss how the strengths may be used to benefit stakeholder decision‐making. We also show how some of the limitations may be overcome, including in combination with other technologies. For example, we show how the relatively coarse spatial resolution of the GEOS‐CF AQ forecasts can be localized (or downscaled) using machine learning algorithms for locations where historical AQ monitoring data exist. As another example, the GEOS‐CF AQ forecasts may be used to interpret the vertical structure of pollution within a satellite VCD and to “fill in the gaps” in satellite data coverage because of clouds.
We make the following recommendations (in no particular order) to health and AQ stakeholders:
Take advantage of the free and publicly available NASA resources and capacity building opportunities in order to develop or augment AQ monitoring systems that may include low‐cost sensors and regulatory‐grade monitors.
Provide feedback to NASA product developers so that they may improve the utility and ease‐of‐use of the data products for health and AQ applications. Such feedback could also be given in focused workshops between stakeholders and product developers.
Based on health and AQ stakeholder feedback, we make the following specific recommendations (in no particular order) to data product developers:
-
Develop processed data products (i.e., L3/4) that remove the necessity of stakeholders to be experts in satellite data processing.
Thoroughly document the data products, paying special attention on how the data products relate to “nose‐level” air pollution levels and the quantification of uncertainties and errors.
Improve the ease‐of‐access and ease‐of‐use of the data products by including the data in existing processing and visualization tools.
Provide a formal mechanism for stakeholders to provide feedback to guide improvement of the data products for health and AQ applications.
Provide a “guide” of NASA AQ resources specifically tailored for health and AQ applications. It may take the form of a dedicated website or document. Make recommendations for specific data products for specific applications.
Develop illustrative case studies for health and AQ applications that demonstrate how NASA resources may complement other sources of AQ data, such as regulatory‐grade AQ monitors and low‐cost sensors.
Conflict of Interest
The authors declare no conflicts of interest relevant to this study.
Acknowledgments
B. Duncan, A. Prados, and D. Anderson are supported in part by the NASA HAQAST program (grant # 20‐HAQ20‐0011). C. Malings is supported by an appointment to the NASA Postdoctoral Program at the Goddard Space Flight Center, administered by Universities Space Research Association (USRA) through a contract with NASA. C. Keller, K. E. Knowland, and S. Pawson acknowledge support by NASA's Modeling, Analysis, and Prediction (MAP) program. Kevin Cromar is supported by New York University. H. Ensz is supported by BOEM. Development of GEOS‐CF is supported by GMAO's core funding administered by NASA's MAP Program. Resources supporting the model simulations were provided by the NASA Center for Climate Simulation at the Goddard Space Flight Center (https://www.nccs.nasa.gov/services/discover).
Duncan, B. N., Malings, C. A., Knowland, K. E., Anderson, D. C., Prados, A. I., Keller, C. A., et al. (2021). Augmenting the standard operating procedures of health and air quality stakeholders with NASA resources. GeoHealth, 5, e2021GH000451. 10.1029/2021GH000451
Data Availability Statement
All data sources and visualization tools used in this manuscript are free and publicly available via NASA, NOAA and other data centers, which are all listed explicitly in figure captions throughout the manuscript and in the introduction to Section 3.3. Surface AQ monitor data were accessed from https://openaq.org. Aura OMI data were downloaded from the Aura Validation Data Center (https://avdc.gsfc.nasa.gov/). The machine learning code of Keller, Evans, et al. (2021) is publicly available at https://doi.org/10.5281/zenodo.5484065. GEOS‐CF simulated pollutant concentrations and weather variables were accessed via FLUID (https://gmao.gsfc.nasa.gov/weather_prediction/GEOS-CF/data_access/). MODIS fire‐counts and MAIAC AOD were accessed from Worldview (https://worldview.earthdata.nasa.gov/). TROPOMI data (L2) were downloaded from NASA EarthData (https://search.earthdata.nasa.gov/search). NOAA Hybrid Single Particle Lagrangian Integrated Trajectory (HYSPLIT) model output was accessed via https://ready.arl.noaa.gov/HYSPLIT.php.
References
- Ahangar, F., Freedman, F., & Venkatram, A. (2019). Using low‐cost air quality sensor networks to improve the spatial and temporal resolution of concentration maps. International Journal of Environmental Research and Public Health, 16, 1252. 10.3390/ijerph16071252 [DOI] [PMC free article] [PubMed] [Google Scholar]
- Anenberg, S. C., Bindl, M., Brauer, M., Castillo, J. J., Cavalieri, S., Duncan, B. N., et al. (2020). Using satellites to track indicators of global air pollution and climate change impacts: Lessons learned from a NASA‐supported science‐stakeholder collaborative. GeoHealth, 4, e2020GH000270. 10.1029/2020GH000270 [DOI] [PMC free article] [PubMed] [Google Scholar]
- Barrett, B. S., Raga, G. B., Retama, A., & Leonard, C. (2019). A multiscale analysis of the tropospheric and stratospheric mechanisms leading to the March 2016 extreme surface ozone event in Mexico City. Journal of Geophysical Research: Atmosphere, 124, 4782–4799. 10.1029/2018JD029918 [DOI] [Google Scholar]
- Bey, I., Jacob, D. J., Yantosca, R. M., Logan, J. A., Field, B. D., Fiore, A. M., et al. (2001). Global modeling of tropospheric chemistry with assimilated meteorology: Model description and evaluation. Journal of Geophysical Research: Atmospheres, 106, 23073–23095. 10.1029/2001JD000807 [DOI] [Google Scholar]
- Bi, J., Stowell, J., Seto, E. Y. W., English, P. B., Al‐Hamdan, M. Z., Kinney, P. L., et al. (2020). Contribution of low‐cost sensor measurements to the prediction of PM2.5 levels: A case study in Imperial County, California, USA. Environmental Research, 180, 108810. 10.1016/j.envres.2019.108810 [DOI] [PMC free article] [PubMed] [Google Scholar]
- Chance, K. V., Liu, X., Suleiman, R. M., Flittner, D. E., Al‐Saadi, J., & Janz, S. J. (2013). Tropospheric emissions: Monitoring of pollution (TEMPO). In Butler J. J., Xiong X., & Gu X. (Ed.), Proceeding of SPIE 8866, Earth observing systems XVIII, 88660D. SPIE—International Society for Optical Engineering. 10.1117/12.2024479 [DOI] [Google Scholar]
- Clements, A. L., Griswold, W. G., Abhijit, R. S., Johnston, J. E., Herting, M. M., Thorson, J., et al. (2017). Low‐cost air quality monitoring tools: From research to practice (A workshop summary). Sensors, 17, 2478. 10.3390/s17112478 [DOI] [PMC free article] [PubMed] [Google Scholar]
- Cohen, A. J., Brauer, M., Burnett, R., Anderson, H. R., Frostad, J., Estep, K., et al. (2017). Estimates and 25‐year trends of the global burden of disease attributable to ambient air pollution: An analysis of data from the Global Burden of Diseases Study 2015. The Lancet, 389(10082), 1907–1918. 10.1016/S0140-6736(17)30505-6 [DOI] [PMC free article] [PubMed] [Google Scholar]
- Cromar, K., Gladson, L., Jaimes Palomera, M., Perlmutt, L. (2021). Development of a health‐based index to identify the association between air pollution and health effects in Mexico City. Atmosphere. 12(3), 372. 10.3390/atmos12030372 [DOI] [Google Scholar]
- Cromar, K. R., Duncan, B. N., Bartonova, A., Benedict, K., Brauer, M., Habre, R., et al. (2019). Air pollution monitoring for health research and patient Care: An American thoracic society workshop report. Annals of the American Thoracic Society, 16, 10. 10.1513/AnnalsATS.201906-477ST [DOI] [PMC free article] [PubMed] [Google Scholar]
- Cross, E. S., Williams, L. R., Lewis, D. K., Magoon, G. R., Onasch, T. B., Kaminsky, M. L., et al. (2017). Use of electrochemical sensors for measurement of air pollution: Correcting interference response and validating measurements. Atmospheric Measurement Techniques, 10, 3575–3588. 10.5194/amt-10-3575-2017 [DOI] [Google Scholar]
- Demetillo, M. A. G., Navarro, A., Knowles, K. K., Fields, K. P., Geddes, J. A., Nowlan, C. R., et al. (2020). Observing nitrogen dioxide air pollution inequality using high‐resolution remote sensing measurements in Houston, Texas. Environmental Science & Technology, 54(16), 9882–9895. 10.1021/acs.est.0c01864 [DOI] [PubMed] [Google Scholar]
- de Sherbinin, A., Levy, M. A., Zell, E., Weber, S., & Jaiteh, M. (2014). Using satellite data to develop environmental indicators. Environmental Research Letters, 9, 084013. 10.1088/1748-9326/9/8/084013 [DOI] [Google Scholar]
- Dreessen, J. (2019). A sea level stratospheric ozone intrusion event induced within a thunderstorm gust front. Bulletin of the American Meteorological Society, 100(7), 1259–1275. 10.1175/BAMS-D-18-0113.1 [DOI] [Google Scholar]
- Duncan, B., Yoshida, Y., Olson, J., Sillman, S., Retscher, C., Martin, R., et al. (2010). Application of OMI observations to a space‐based indicator of NOx and VOC controls on surface ozone formation. Atmospheric Environment, 44, 2213–2223. 10.1016/j.atmosenv.2010.03.010 [DOI] [Google Scholar]
- Duncan, B. N. (2020). NASA resources to monitor offshore and coastal air quality. Sterling (VA). U.S. Department of the Interior, Bureau of Ocean Energy Management. Retrieved from https://espis.boem.gov/final%20reports/BOEM_2020-046.pdf [Google Scholar]
- Duncan, B. N., Prados, A. I., Lamsal, L., Liu, Y., Streets, D. G., Gupta, P., et al. (2014). Satellite data of atmospheric pollution for U.S. Air quality applications: Examples of applications, summary of data end‐user resources, answers to FAQs, and common mistakes to avoid. Atmospheric Environment, 94, 647–662. 10.1016/j.atmosenv.2014.05.061 [DOI] [Google Scholar]
- Duvall, R. M., Hagler, G. S. W., Clements, A. L., Benedict, K., Barkjohn, K., Kilaru, V., et al. (2021). Deliberating performance targets: Follow‐on workshop discussing PM10, NO2, CO, and SO2 air sensor targets. Atmospheric Environment, 246. 10.1016/j.atmosenv.2020.118099 [DOI] [PMC free article] [PubMed] [Google Scholar]
- Eilenberg, R. S., Subramanian, R., Malings, C., Hauryliuk, A., Presto, A. A., & Robinson, A. L. (2020). Using a network of lower‐cost monitors to identify the influence of modifiable factors driving spatial patterns in fine particulate matter concentrations in an urban environment. Journal of Exposure Science and Environmental Epidemiology, 30(6), 949–961. 10.1038/s41370-020-0255-x [DOI] [PubMed] [Google Scholar]
- Giordano, M. R., Malings, C., Pandis, S. N., Presto, A. A., McNeill, V. F., Westervelt, D. M., et al. (2021). From low‐cost sensors to high‐quality data: A summary of challenges and best practices for effectively calibrating low‐cost particulate matter mass sensors. Journal of Aerosol Science, 158, 105833. 10.1016/j.jaerosci.2021.105833 [DOI] [Google Scholar]
- Gulde, S. T., Kolm, M. G., Smith, D. J., Maurer, R., Bazalgette Courrèges‐Lacoste, G., Sallusti, M., & Bagnasco, G. (2017). Sentinel 4: A geostationary imaging UVN spectrometer for air quality monitoring: Status of design, performance and development. Proceeding of SPIE 10563 (Vol. 2014, p. 1056341). International Conference on Space Optics—ICSO. 10.1117/12.2304099 [DOI]
- Gupta, P., Doraiswamy, P., Levy, R., Pikelnaya, O., Maibach, J., Feenstra, B., et al. (2018). Impact of California fires on local and regional air quality: The Role of a low‐cost sensor network and satellite observations. GeoHealth, 2, 172–181. 10.1029/2018GH000136 [DOI] [PMC free article] [PubMed] [Google Scholar]
- Hagan, D. H., Isaacman‐VanWertz, G., Franklin, J. P., Wallace, L. M. M., Kocar, B. D., Heald, C. L., & Kroll, J. H. (2018). Calibration and assessment of electrochemical air quality sensors by co‐location with regulatory‐grade instruments. Atmospheric Measurement Techniques, 11, 315–328. 10.5194/amt-11-315-2018 [DOI] [Google Scholar]
- Jin, X., Fiore, A. M., Boersma, K. F., De Smedt, I., & Valin, L. C. (2020). Inferring changes in summertime surface ozone‐NOx‐VOC chemistry over U.S. urban areas from two decades of satellite and ground‐based observations. Environmental Science & Technology, 54(11), 6518–6529. 10.1088/1748-9326/ab2dcb [DOI] [PMC free article] [PubMed] [Google Scholar]
- Judd, L., Al‐Saadi, J., Valin, L. C., Pierce, R. B., Yang, K., Janz, S., et al. (2018). The dawn of geostationary air quality monitoring: Case studies from Seoul and Los Angeles. Frontiers in Environmental Science, 6, 85. 10.3389/fenvs.2018.00085 [DOI] [PMC free article] [PubMed] [Google Scholar]
- Keller, C., & Ronaghi, Z. (2021). GEOS‐CF/Covid_no2: Analyzing the impact of COVID‐19 restrictions on the surface concentrations of nitrogen dioxide (release‐v0). Zenodo. 10.5281/zenodo.5484065 [DOI] [Google Scholar]
- Keller, C. A., Evans, M. J., Knowland, K. E., Hasenkopf, C. A., Modekurty, S., Lucchesi, R. A., et al. (2021). Global impact of COVID‐19 restrictions on the surface concentrations of nitrogen dioxide and ozone. Atmospheric Chemistry and Physics, 21, 3555–3592. 10.5194/acp-21-3555-2021 [DOI] [Google Scholar]
- Keller, C. A., Knowland, K. E., Duncan, B. N., Liu, J., Anderson, D. C., Das, S., et al. (2021). Description of the NASA GEOS composition forecast modeling system GEOS‐CF v1.0. Journal of Advances in Modeling Earth Systems, 13, e2020MS002413. 10.1029/2020MS002413 [DOI] [PMC free article] [PubMed] [Google Scholar]
- Keller, C. A., Long, M. S., Yantosca, R. M., Da Silva, A. M., Pawson, S., & Jacob, D. J. (2014). HEMCO v1.0: A versatile, ESMF‐compliant component for calculating emissions in atmospheric models. Geoscientific Model Development, 7, 1409–1417. 10.5194/gmd-7-1409-2014 [DOI] [Google Scholar]
- Kim, J., Jeong, U., Ahn, M., Kim, J. H., Park, R. J., Lee, H., et al. (2020). New era of air quality monitoring from space: Geostationary environment monitoring spectrometer (GEMS). Bulletin of the American Meteorological Society, 101(1), E1–E22. 10.1175/BAMS-D-18-0013.1 [DOI] [Google Scholar]
- Knowland, K. E., Doherty, R. M., & Hodges, K. I. (2015). The effects of springtime mid‐latitude storms on trace gas composition determined from the MACC reanalysis. Atmospheric Chemistry and Physics, 15, 3605–3628. 10.5194/acp-15-3605-2015 [DOI] [Google Scholar]
- Knowland, K. E., Doherty, R. M., Hodges, K. I., & Ott, L. E. (2017). The influence of mid‐latitude cyclones on European background surface ozone. Atmospheric Chemistry and Physics, 17, 12421–12447. 10.5194/acp-17-12421-2017 [DOI] [PMC free article] [PubMed] [Google Scholar]
- Knowland, K. E., Ott, L. E., Duncan, B. N., & Wargan, K. (2017). Stratospheric intrusion‐influenced ozone air quality exceedances investigated in the NASA MERRA‐2 reanalysis. Geophysical Research Letters, 44, 10691–10701. 10.1002/2017gl074532 [DOI] [PMC free article] [PubMed] [Google Scholar]
- Lamsal, L. N., Martin, R. V., van Donkelaar, A., Steinbacher, M., Celarier, E. A., Bucsela, E., et al. (2008). Ground‐level nitrogen dioxide concentrations inferred from the satellite‐borne Ozone Monitoring Instrument. Journal of Geophysical Research, 113, D16308. 10.1029/2007jd009235 [DOI] [Google Scholar]
- Levelt, P. F., van den Oord, G. H. J., Dobber, M. R., Malkki, A., Visser, H., de Vries, J., et al. (2006). The ozone monitoring instrument. IEEE Transactions on Geoscience and Remote Sensing, 44(5), 1093–1101. 10.1109/TGRS.2006.872333 [DOI] [Google Scholar]
- Li, J., Zhang, H., Chao, C.‐Y., Chien, C.‐H., Wu, C.‐Y., Luo, C. H., et al. (2020). Integrating low‐cost air quality sensor networks with fixed and satellite monitoring systems to study ground‐level PM2.5 . Atmospheric Environment, 223, 117293. 10.1016/j.atmosenv.2020.117293 [DOI] [Google Scholar]
- Lin, M., Fiore, A., Horowitz, L., Langford, A., Oltmans, S. J., Tarasick, D., & Rieder, H. E. (2015). Climate variability modulates western US ozone air quality in spring via deep stratospheric intrusions. Nature Communications, 6, 7105. 10.1038/ncomms8105 [DOI] [PMC free article] [PubMed] [Google Scholar]
- Loh, M., Sarigiannis, D., Gotti, A., Karakitsios, S., Pronk, A., Kuijpers, E., et al. (2017). How sensors might help define the external exposome. International Journal of Environmental Research and Public Health, 14, 434. 10.3390/ijerph14040434 [DOI] [PMC free article] [PubMed] [Google Scholar]
- Long, M. S., Yantosca, R., Nielsen, J. E., Keller, C. A., da Silva, A., Sulprizio, M. P., et al. (2015). Development of a grid‐independent GEOS‐Chem chemical transport model (v9‐02) as an atmospheric chemistry module for Earth system models. Geoscientific Model Development, 8, 595–602. 10.5194/gmd-8-595-2015 [DOI] [Google Scholar]
- Lucchesi, R. (2018). File specification for GEOS FP. Retrieved from http://gmao.gsfc.nasa.gov/pubs/office_notes [Google Scholar]
- Malings, C., Tanzer, R., Hauryliuk, A., Kumar, S. P. N., Zimmerman, N., Kara, L. B., et al. (2019). Development of a general calibration model and long‐term performance evaluation of low‐cost sensors for air pollutant gas monitoring. Atmos. Meas. Tech., 12, 903–920. 10.5194/amt-12-903-2019 [DOI] [Google Scholar]
- Malings, C., Tanzer, R., Hauryliuk, A., Saha, P. K., Robinson, A. L., Presto, A. A., & Subramanian, R. (2019). Fine particle mass monitoring with low‐cost sensors: Corrections and long‐term performance evaluation. Aerosol Science & Technology, 1–15. 10.1080/02786826.2019.1623863 [DOI] [Google Scholar]
- Malings, C., Westervelt, D. M., Hauryliuk, A., Presto, A. A., Grieshop, A., Bittner, A., et al. (2020). Application of low‐cost fine particulate mass monitors to convert satellite aerosol optical depth to surface concentrations in North America and Africa. Atmospheric Measurement Techniques, 13, 3873–3892. 10.5194/amt-13-3873-2020 [DOI] [Google Scholar]
- OECD . (2016). The economic consequences of outdoor air pollution. OECD Publishing. Retrieved from https://www.oecd.org/environment/indicators-modelling-outlooks/Policy-Highlights-Economic-consequences-of-outdoor-air-pollution-web.pdf [Google Scholar]
- Olsen, M. A., Gallus, W. A., Stanford, J. L., & Brown, J. M. (2000). Fine‐scale comparison of TOMS total ozone data with model analysis of an intense Midwestern cyclone. Journal of Geophysical Research, 105(D16), 20487–20495. 10.1029/2000jd900205 [DOI] [Google Scholar]
- Ott, L. E., Duncan, B. N., Thompson, A. M., Diskin, G., Fasnacht, Z., Langford, A. O., et al. (2016). Frequency and impact of summertime stratospheric intrusions over Maryland during DISCOVER‐AQ (2011): New evidence from NASA's GEOS‐5 simulations. Journal of Geophysical Research: Atmospheres, 121, 3687–3706. 10.1002/2015jd024052 [DOI] [PMC free article] [PubMed] [Google Scholar]
- Popoola, O. A. M., Stewart, G. B., Mead, M. I., & Jones, R. L. (2016). Development of a baseline‐temperature correction methodology for electrochemical sensors and its implications for long‐term stability. Atmospheric Environment, 147, 330–343. 10.1016/j.atmosenv.2016.10.024 [DOI] [Google Scholar]
- Prados, A. I., Carleton‐Hug, A., Gupta, P., Mehta, A., Blevins, B., Schmidt, et al. (2019). Impact of the ARSET program on use of remote‐sensing data. ISPRS International Journal of Geo‐Information, 8, 261. 10.3390/ijgi8060261 [DOI] [Google Scholar]
- Schneider, P., Castell, N., Vogt, M., Dauge, F. R., Lahoz, W. A., & Bartonova, A. (2017). Mapping urban air quality in near real‐time using observations from low‐cost sensors and model information. Environment International, 106, 234–247. 10.1016/j.envint.2017.05.005 [DOI] [PubMed] [Google Scholar]
- Snider, G., Weagle, C. L., Martin, R. V., van Donkelaar, A., Conrad, K., Cunningham, D., et al. (2015). SPARTAN: A global network to evaluate and enhance satellite‐based estimates of ground‐level particulate matter for global health applications. Atmospheric Measurement Techniques, 8, 505–521. 10.5194/amt-8-505-2015 [DOI] [Google Scholar]
- Snyder, E. G., Watkins, T. H., Solomon, P. A., Thoma, E. D., Williams, R. W., Hagler, G. S. W., et al. (2013). The changing paradigm of air pollution monitoring. Environmental Science & Technology, 47, 11369–11377. 10.1021/es4022602 [DOI] [PubMed] [Google Scholar]
- Spinelle, L., Gerboles, M., Villani, M. G., Aleixandre, M., & Bonavitacola, F. (2015). Field calibration of a cluster of low‐cost available sensors for air quality monitoring. Part A: Ozone and nitrogen dioxide. Sensors and Actuators B: Chemical, 215, 249–257. 10.1016/j.snb.2015.03.031 [DOI] [Google Scholar]
- Subramanian, R., Ellis, A., Torres‐Delgado, E., Tanzer, R., Malings, C., Rivera, F., et al. (2018). Air quality in Puerto Rico in the aftermath of Hurricane Maria: A case study on the use of lower cost air quality monitors. ACS Earth Space Chemistry, 2, 1179–1186. 10.1021/acsearthspacechem.8b00079 [DOI] [Google Scholar]
- Subramanian, R., Kagabo, A. S., Baharane, V., Guhirwa, S., Sindayigaya, C., Malings, C., et al. (2020). Air pollution in Kigali, Rwanda: Spatial and temporal variability, source contributions, and the impact of car‐free Sundays. Clean Air Journal, 30, 2. 10.17159/caj/2020/30/2.8023 [DOI] [Google Scholar]
- Tanzer, R., Malings, C., Hauryliuk, A., Subramanian, R., & Presto, A. A. (2019). Demonstration of a low‐cost multi‐pollutant network to quantify intra‐urban spatial variations in air pollutant source impacts and to evaluate environmental justice. International Journal of Environmental Research and Public Health, 16, 2523. 10.3390/ijerph16142523 [DOI] [PMC free article] [PubMed] [Google Scholar]
- Thompson, A. M. (2020). Evaluation of NASA's remote‐sensing capabilities in coastal environments. U.S. Department of the Interior, Bureau of Ocean Energy Management. Retrieved from https://espis.boem.gov/final%20reports/BOEM_2020-047.pdf [Google Scholar]
- Turner, M. C., Nieuwenhuijsen, M., Anderson, K., Balshaw, D., Cui, Y., Dunton, G., et al. (2017). Assessing the exposome with external measures: Commentary on the state of the science and research recommendations. Annual Review of Public Health, 38, 215–239. 10.1146/annurev-publhealth-082516-012802 [DOI] [PMC free article] [PubMed] [Google Scholar]
- U.S. Environmental Protection Agency . (2015). National ambient air quality standards for ozone: Final rule. Federal Register, 80(206), 65292–65468. [Google Scholar]
- van Donkelaar, A., Martin, R. V., Brauer, M., Kahn, R., Levy, R., Verduzco, C., & Villeneuve, P. J. (2010). Global estimates of ambient fine particulate matter concentrations from satellite‐based aerosol optical depth: Development and application. Environmental Health Perspectives, 118(6), 847–855. 10.1289/ehp.0901623 [DOI] [PMC free article] [PubMed] [Google Scholar]
- Veefkind, J. P., Aben, I., McMullan, K., Förster, H., de Vries, J., Otter, G., et al. (2012). TROPOMI on the ESA Sentinel‐5 Precursor: A GMES Mission for global observations of the atmospheric composition for climate, air quality, and ozone layer applications. Remote Sensing of Environment, 120, 70–83. 10.1016/j.rse.2011.09.027 [DOI] [Google Scholar]
- Vohra, K., Vodonos, A., Schwartz, J., Marais, E., Sulprizio, M. P., & Mickley, L. J. (2021). Global mortality from outdoor fine particle pollution generated by fossil fuel combustion: Results from GEOS‐Chem. Environmental Research, 195, 110754. 10.1016/j.envres.2021.110754 [DOI] [PubMed] [Google Scholar]
- WHO . (2018). Retrieved from http://www.who.int/airpollution/ambient/en/
- Williams, R., Duvall, R., Kilaru, V., Hagler, G., Hassinger, L., Benedict, K., et al. (2019). Deliberating performance targets workshop: Potential paths for emerging PM2.5 and O3 air sensor progress. Atmospheric Environment, 2, 100031. 10.1016/j.aeaoa.2019.100031 [DOI] [PMC free article] [PubMed] [Google Scholar]
- World Bank . (2016). Retrieved from https://www.worldbank.org/en/news/press-release/2016/09/08/air-pollution-deaths-cost-global-economy-225-billion
- Zhao, K., Hu, C., Yuan, Z., Xu, D., & Zhang, S. (2021). A modeling study of the impact of stratospheric intrusion on ozone enhancement in the lower troposphere over the Hong Kong regions, China. Atmospheric Research, 247, 105158. 10.1016/j.atmosres.2020.105158 [DOI] [Google Scholar]
- Zimmerman, N., Presto, A. A., Kumar, S. P. N., Gu, J., Hauryliuk, A., Robinson, E. S., et al. (2018). A machine learning calibration model using random forests to improve sensor performance for lower‐cost air quality monitoring. Atmospheric Measurement Techniques, 11, 291–313. 10.5194/amt-11-291-2018 [DOI] [Google Scholar]
Associated Data
This section collects any data citations, data availability statements, or supplementary materials included in this article.
Data Availability Statement
All data sources and visualization tools used in this manuscript are free and publicly available via NASA, NOAA and other data centers, which are all listed explicitly in figure captions throughout the manuscript and in the introduction to Section 3.3. Surface AQ monitor data were accessed from https://openaq.org. Aura OMI data were downloaded from the Aura Validation Data Center (https://avdc.gsfc.nasa.gov/). The machine learning code of Keller, Evans, et al. (2021) is publicly available at https://doi.org/10.5281/zenodo.5484065. GEOS‐CF simulated pollutant concentrations and weather variables were accessed via FLUID (https://gmao.gsfc.nasa.gov/weather_prediction/GEOS-CF/data_access/). MODIS fire‐counts and MAIAC AOD were accessed from Worldview (https://worldview.earthdata.nasa.gov/). TROPOMI data (L2) were downloaded from NASA EarthData (https://search.earthdata.nasa.gov/search). NOAA Hybrid Single Particle Lagrangian Integrated Trajectory (HYSPLIT) model output was accessed via https://ready.arl.noaa.gov/HYSPLIT.php.


