Abstract
Purpose
Cone‐beam CT (CBCT)‐based synthetic CTs (sCT) produced with a deep convolutional neural network (DCNN) show high image quality, suggesting their potential usability in adaptive proton therapy workflows. However, the nature of such workflows involving DCNNs prevents the user from having direct control over their output. Therefore, quality control (QC) tools that monitor the sCTs and detect failures or outliers in the generated images are needed.
This work evaluates the potential of using a range‐probing (RP)‐based QC tool to verify sCTs generated by a DCNN. Such a RP QC tool experimentally assesses the CT number accuracy in sCTs.
Methods
A RP QC dataset consisting of repeat CTs (rCT), CBCTs, and RP acquisitions of seven head and neck cancer patients was retrospectively assessed. CBCT‐based sCTs were generated using a DCNN. The CT number accuracy in the sCTs was evaluated by computing relative range errors between measured RP fields and RP field simulations based on rCT and sCT images.
Results
Mean relative range errors showed agreement between measured and simulated RP fields, ranging from −1.2% to 1.5% in rCTs, and from −0.7% to 2.7% in sCTs.
Conclusions
The agreement between measured and simulated RP fields suggests the suitability of sCTs for proton dose calculations. This outcome brings sCTs generated by DCNNs closer toward clinical implementation within adaptive proton therapy treatment workflows. The proposed RP QC tool allows for CT number accuracy assessment in sCTs and can provide means of in vivo range verification.
Keywords: adaptive proton therapy, neural networks, proton radiography, quality control, synthetic CT
1. INTRODUCTION
The outcome of proton therapy treatments can be compromised by anatomical variations.1 To evaluate and mitigate the impact of anatomical variations on dose distributions, adaptive treatment strategies can be adopted.2, 3 Treatment plan adaptations require recurrent feedback, which is supplied by different imaging techniques on which dose calculations are performed.4
CBCTs are currently used in some proton therapy centers for patient alignment purposes.5, 6, 7 Since CBCTs are acquired on a frequent basis, they contain up‐to‐date information about the patient anatomy, and they can provide input within an adaptive proton treatment workflow.8, 9, 10
However, CBCTs are subject to various image artifacts that prevent them from being used directly for proton dose calculations.11 To this end, various corrective approaches were developed to transform CBCTs into images suitable for proton dose calculations, typically called synthetic CT (sCT) images.10, 12 With the rapid development of artificial intelligence, a growing number of deep learning‐based correction approaches has recently been presented.13, 14
For head and neck cancer (HNC) patients, Thummerer et al. recently showed an enhanced performance of a deep convolutional neural network (DCNN) approach to transform CBCTs into sCTs.15 The DCNN strategy was compared against a deformable image registration and an analytical image‐based correction method. Furthermore, comparable sCT image quality and dosimetric accuracy were found with respect to other deep learning sCT generation strategies.15, 16, 17, 18 Preliminary dosimetric tests showed the potential for employing DCNN CBCT‐based sCTs in an adaptive proton therapy workflow.15 However, DCNNs are trained on specific datasets which do not guarantee a predictable performance when they receive input images that fall outside the training dataset. Outliers from the training dataset could arise due to different patient anatomy or image acquisition settings.19 Therefore, quality control (QC) tools that monitor the sCT generation and detect failures or outliers in the output images are needed.
Range probing (RP) has been suggested as a QC tool for in vivo proton range verification.20, 21, 22, 23, 24, 25, 26 Farace et al. presented a method to detect setup errors, in which proton spots in a RP field are measured by a multilayer ionization chamber (MLIC) at the exit of a head phantom. Meijers et al. acquired RP measurements in HNC patients and evaluated the discrepancies between measured and simulated depth dose profiles, demonstrating the feasibility to employ RP‐based QC in clinical practice.26
Although many studies have demonstrated the feasibility of deep learning‐based methods for sCT generation,13, 14, 15, 17, 18 their implementation into clinical practice remains as a challenge due to the lack of QC tools to verify the output images. The work presented here aims to investigate the potential of using RP as a QC tool to verify CBCT‐based sCTs. For the first time, RP patient measurements are used to experimentally assess the CT number accuracy in sCT images.
2. MATERIALS AND METHODS
Retrospective RP QC measurements from seven HNC patients were retrieved, together with CBCT and repeat CT (rCT) images, acquired on the same days as the RP.26 RP QC measurements were performed in our clinic as an in vivo QC check for HNC patients treated with proton therapy.26 RP fields in two different fractions (referred as sessions 1 and 2) were collected for each patient (numbered from 1 to 7), resulting in a dataset of 14 RP fields with their corresponding rCT and CBCT.
2.1. CBCT and rCT features
CBCT images were acquired using an on‐board imaging device of an IBA Proteus®PLUS gantry (IBA, Louvain‐la‐Neuve, Belgium), with a tube voltage of 100kVp and a tube current of 160 mA. CBCTs were reconstructed on a grid of 0.51 mm x 0.51 mm x 2.50 mm. They covered a cylindrical field of view with an axial diameter of 260 mm and an inferior–superior length of 175 mm (70 slices).
rCT scans were acquired on a Siemens SOMATOM Confidence scanner (Siemens, Erlangen, Germany), using an image reconstruction grid of 0.98 mm x 0.98 mm x 2.00 mm, a varying scan length (between 198 and 229 slices), and an axial field of view with a diameter of 500 mm. A fixed tube voltage of 120 kV and a variable tube current were used for rCT acquisition.
2.2. RP acquisition
The setup for the acquisition of the retrieved RP measurements was in accordance with the methodology described by Meijers et al.26 Each RP field was composed of 9x9 proton spots with a spacing of 5 mm, resulting in 81 proton spots covering an area of 40x40 mm2. The center of the RP field was aligned with the treatment isocenter, allowing proton spots to intersect a wide variety of tissues. Figure 1 shows one example patient geometry, in which the edges of the RP field are highlighted.
FIGURE 1.
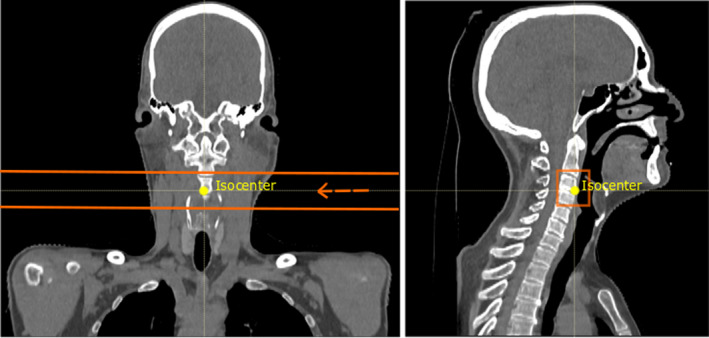
Coronal and sagittal views of an example patient geometry (patient 3). The treatment isocenter is shown in yellow and the edges of the RP field are highlighted in orange. In the coronal view, the beam direction is marked by the arrow and the MLIC would be located at the left side of the patient (not depicted). In the sagittal view, the proton spots are directed from behind the patient toward the observer [Color figure can be viewed at wileyonlinelibrary.com]
Each RP field delivered a dose of approximately 1 cGyRBE. The proton spot energy was 210 MeV, resulting in a spot size of FWHM = 8.2 mm in air at the isocenter. Given that MLIC acquisitions are only possible from cardinal angles, and easy access to the patient with the equipment is desired, the beams were directed toward the patient from a gantry angle of 90 degrees.
A Giraffe MLIC (IBA Dosimetry, Schwarzenbruck, DE), composed of 180 parallel plane ionization chambers, was used to measure the residual integral depth dose profile (IDD) of each proton spot. Prior to each RP acquisition, a gain calibration of the MLIC was performed in air. After the CBCT‐based patient positioning procedure was completed, the MLIC was placed along the beam axis at the exit of the patient on a trolley (Figure 2), and the RP field was delivered before the start of the treatment.
FIGURE 2.
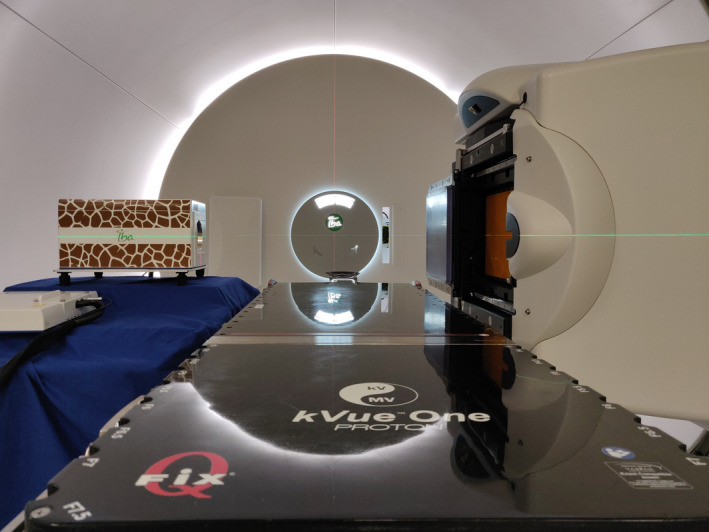
Setup for RP acquisition. The gantry is set to an angle of 90 degrees, directing proton beams from right to left through a patient (not depicted) laying on the table. The MLIC is positioned on a trolley26 [Color figure can be viewed at wileyonlinelibrary.com]
2.3. sCT generation
sCTs were generated using a DCNN, initially implemented for MR‐to‐CT conversion by Spadea et al.,27 and later shown suitable also for CBCT‐based sCT generation.15, 16 CBCTs and CTs of 28 HNC patients treated with proton therapy at our institution were used for training and validation of the neural network (25 for training, 3 for validation). CBCTs and rCTs were acquired using the devices and parameters described above.
To generate sCTs for the seven HNC patients, a rigid registration of CBCT to planning CT images and an automatic segmentation of the patient outline were performed in Plastimatch (www.plastimatch.org). A 25 mm margin was added to the resulting segmentation mask, to assure full coverage of the patient and the immobilization devices, which were sometimes partially excluded by the automatic segmentation. Afterwards the trained DCNN was used to generate the sCTs. More details on the DCNN architecture, as well as a visualization of CBCT, sCT, and rCT for each patient can be found in the supplementary material section.
2.4. RP simulation in sCT and rCT
In order to evaluate the quality of the sCTs, RP simulations based on rCT and sCT were compared to RP measurements. The seven patients for whom RP measurements were acquired were not part of the training or validation datasets of the DCNN.
RP simulations were performed using the clinical Monte Carlo dose engine of RayStation 9A (RaySearch, Stockholm, Sweden), with a statistical uncertainty of 0.5%.28 The MLIC detector was represented by an homogeneous water volume attached to each CT at the beam exit side of the patient.20 An isotropic dose grid with a voxel size of 1 mm was used. The IDD in the beam direction for each proton spot was extracted by integrating the dose in the water volume over the axes perpendicular to the beam direction, using the scripting capabilities of RayStation.
RP simulations were performed for both rCT and sCT. In order to reproduce the treatment position as closely as possible and to have agreement with the CBCT registration, a rigid registration of the rCT to planning CT was performed in RayStation. The RP simulations based on rCTs were used as ground truth. The rCT was acquired on the same day as the RP measurement, so it was used as a reference regarding the anatomy of that day. However, unlike the CBCTs, the rCTs were not acquired in the treatment room, but in a separate CT room within the building.
2.5. Data preparation
For some patients, the isocenter was located close to the shoulders, leading to some proton spots to go across the shoulder area (see RP field edges and beam direction in Figure 3(a)). Given that the field size of the CBCTs was limited and did not enclose the shoulders and trapezius muscles entirely (Figure 3), IDDs going through the shoulders and trapezius muscles were excluded from the dataset.
FIGURE 3.
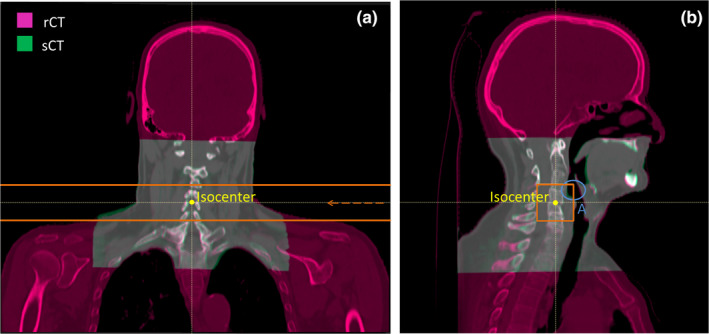
Fusion of a rCT (magenta) with the corresponding sCT (green) in an example patient (patient 1). The treatment isocenter is marked in yellow and the RP field edges are marked in orange. (a): Coronal view of the patient, in which the beam direction is indicated by an orange arrow. (b): Sagittal view of the patient in which a region referred as “A” is highlighted by a blue circle. Region A encloses an exemplary area in the throat that is anatomically unstable [Color figure can be viewed at wileyonlinelibrary.com]
Since rCTs were not acquired in the treatment room, there were inconsistencies between the anatomical configuration of the patient during the rCT and the CBCT acquisition. For instance, the base of the tongue could be in a different position in the rCT compared to the CBCT. For this reason, IDDs in the base of tongue and swallowing muscles areas (e.g., Region A in Figure 3(b)), which are anatomically unstable regions, were excluded for the purpose of this study. The resulting dataset is referred to as “post‐processed” dataset. It enables a comparison between rCT and sCT in anatomically stable areas. After post‐processing, 18–76 IDDs remained per RP field, depending on the patient.
2.6. Data analysis
The comparison between a measured RP field and its corresponding simulated RP fields (based on rCT and sCT) was performed by computing the residual range error for each proton spot in the RP field. Residual range errors were obtained as the offset that provides the best alignment between a measured and a simulated IDD along the beam axis, calculated using the least square method.20, 29 This calculation was performed in openREGGUI20, 30 (openreggui.org). With this procedure, residual range errors were obtained with an accuracy of 0.5 mm. The final analysis is expressed in terms of relative range errors (RREs) with respect to the water‐equivalent path length of each proton spot across the patient. The water‐equivalent path length was extracted from each measured IDD by calculating the shift with respect to an air IDD measurement.31
In total, taking into account 2 RP fields for 7 patients, 14 RRE maps were obtained comparing RP field measurements and the corresponding simulated RP fields based on the rCT, and another 14 maps for a comparison between measured RP fields and simulated RP fields based on the sCT. For each of the maps, the mean and 1.5 times the standard deviation (1.5SD) of the RREs were computed.
3. RESULTS
Figure 4 shows two RRE maps for rCT‐ and sCT‐based RP simulations. Figure 4 displays in different colors which proton spots were excluded from the dataset due to proximity to the shoulders (black positions) and due to anatomical instability (white positions). The post‐processed dataset is, thus, composed by the spots corresponding to the yellow positions.
FIGURE 4.
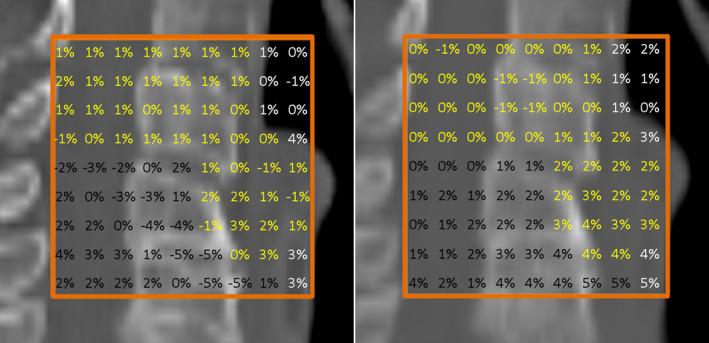
RRE maps obtained for patient 1 in session 1 overlaid with a sagittal view of the corresponding CT where RP simulations were performed. Left and right side maps correspond to RP simulations performed in rCT and sCT, respectively. RREs corresponding to proton spots close to the shoulders or in anatomically unstable regions are shown in black and white, respectively. RREs included in the post‐processed dataset are shown in yellow. The edges of the RP field are highlighted in orange [Color figure can be viewed at wileyonlinelibrary.com]
Figure 5 shows RREs for all patients using the post‐processed dataset. Each data point in the graph represents the mean RRE, which refers to a comparison between the RP field measured in each patient and the corresponding RP field simulation in the rCT (blue) or in the sCT (red). Error bars are represented by 1.5SD. There are four data points for each patient, corresponding to rCT and sCT of sessions 1 and 2.
FIGURE 5.
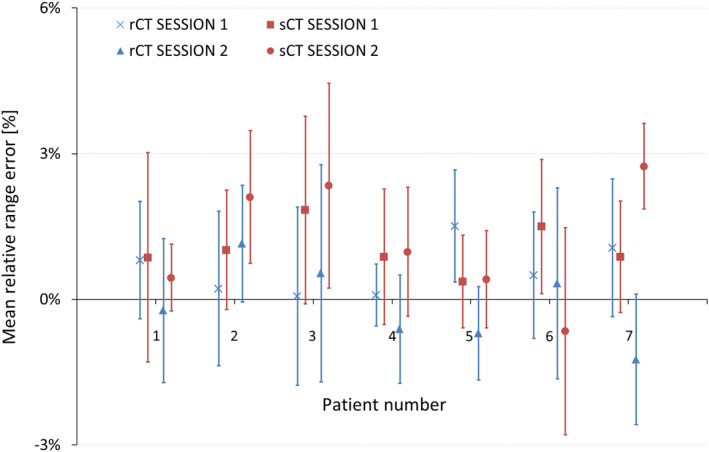
Mean RREs and 1.5SD (error bars) for each patient using the post‐processed dataset. Mean RREs are displayed as a result of comparing RP measurements and RP simulations based on rCT (blue color) or sCT (red color). The quantification is reported for both measurement sessions (session 1 and session 2) [Color figure can be viewed at wileyonlinelibrary.com]
Figure 5 shows that RP simulations in rCT and sCT lead to similar results in terms of mean and standard deviations of RREs. Mean RREs range from −1.2% to 1.5% in rCTs, and from −0.7% to 2.7% in sCTs. Standard deviations lay between −3% and +3% in rCTs, and between −3% and 4.5% in sCTs.
4. DISCUSSION
In this work, RP measurements were investigated as a QC tool to verify CBCT‐based sCTs generated by a DCNN. The CT number accuracy of sCTs was assessed by evaluating the agreement between measured and simulated IDDs. RP measurements acquired for seven HNC patients were retrospectively assessed and compared to corresponding RP simulations based on rCT and sCT in terms of RREs.
Figure 5 shows the agreement between measured and simulated RP fields based on rCTs, proving the already demonstrated reliability of the RP measurements.26 Furthermore, mean RREs and standard deviations based on rCTs and sCTs are consistent, with a difference in mean RREs of about −1% and standard deviations that lay mostly within the ±3% boundaries. Thummerer et al.15 described in detail the generation of CBCT‐based sCTs by means of the DCNN employed in this study. Image quality as well as dosimetric evaluations indicated the potential suitability of sCTs for proton dose calculations and, thus, their integrability within adaptive proton therapy workflows.15, 16 Our outcomes suggest that CT numbers in the sCT images are representative and that sCTs can be used for proton dose calculations in HNC patients, supporting the hypothesis of Thummerer et al.
A tendency toward positive mean RREs in sCTs were observed in Figure 5. In most of the patients, the difference in mean RRE between simulations based on rCT and sCT is about −1%, meaning that RREs in sCTs are slightly higher with respect to mean RREs in rCTs, although not in all cases. A t‐test was carried out between all RREs based on rCT and all RREs based on sCT, showing that the difference in mean RREs between rCT and sCT is statistically significant (P‐value = 1.4e‐27, see Table S1 in supplementary material). If such sCTs were used for dose calculations, a higher‐range uncertainty should be considered than the one employed for dose calculations based on rCTs.
The −1% mean RRE difference between simulations based on rCT and sCT could origin from the sCT generation process, resulting in a shift toward lower values in the CT numbers of the sCTs. To confirm or discard the relevance of a systematic shift in CT numbers of the sCTs, further investigations would be required. The appearance of this effect, however, demonstrates the importance of QC tools for sCTs and the capability of RP measurements to detect small range errors. With the proposed RP QC procedure, residual range errors can be obtained with an accuracy of 0.5 mm.20, 26, 29, 31, 32 For the current dataset, Meijers et al. estimated an overall uncertainty for the RRE of 1%, taking into account energy fluctuations, interfractional motion, residual setup errors, rigid registration of the planning CT and rCT, and anatomical inconsistencies between acquisitions in the treatment room and in the CT imaging room.26
Some acquisition settings for future studies specific to sCT validation could be improved. The location of the RP field sometimes lead to an acquisition too close to the shoulders, which resulted in a weak MLIC signal. Furthermore, the size of the CBCTs was limited and did not enclose the shoulders and trapezius muscles entirely. In addition, the center of the RP fields was aligned with the treatment isocenter, where anatomically unstable areas such as the swallowing muscles and the base of the tongue were present. In order to make CBCTs and rCTs anatomically comparable, a post‐processing of the dataset was required, in which IDDs going across the shoulders or in anatomically unstable areas were excluded. The post‐processed dataset considered for this study still contained a total of 596 proton spots which intersected a wide variety of tissues and allowed for a reliable evaluation of the CT number accuracy in sCTs. Future RP QC acquisitions could include a pre‐selection of spots, avoiding the delivery of those that would be excluded from the analysis.
The features of the RP field (size, number of proton spots, and energy) are based on prior studies performed with the same MLIC detector.20 However, CT numbers in the sCT are only assessed within the limits of the RP field, meaning that if the sCT generation process introduced an artifact outside of the RP field, it would not be detected by this QC procedure. Therefore, the ability to acquire bigger RP fields would be desired. The development of larger size detectors would allow for bigger RP field acquisitions.33
In the current proton therapy treatment workflow, rCTs are frequently acquired on a weekly basis for QC purposes. The acquisition is done in the same immobilization as used during the treatment, but often outside of the treatment room. Anatomical variations can lead to discrepancies between measured RP fields (in the treatment room) and RP simulations based on the rCT (outside the treatment room). If a RP QC procedure for sCT validation would be established clinically, sCTs could be used reliably for the purpose of dose calculations. In this way, more frequent and accurate information on the patient anatomy would be provided by sCTs, and the necessity of regular rCT acquisition would be reduced.
High dosimetric accuracy is a pre‐requisite of any sCT generation method to be suitable for clinical implementation in adaptive proton therapy workflows. The dosimetric accuracy of the sCT generation method used in this study was investigated previously,15, 16 recalculating clinical treatment plans on sCTs and same‐day rCTs. However, this procedure requires a reference CT image. On the contrary, the proposed RP QC tool does not rely on reference CT acquisitions to verify the CT number accuracy of sCTs. Furthermore, it provides in vivo range measurements of the patient in the treatment room and in treatment position, acquired immediately after the CBCT acquisition; thus, minimizing anatomical differences and position inaccuracies between RP and CBCT acquisitions.
Previous studies have demonstrated the feasibility of deep learning‐based methods to generate sCTs with a high image quality.13, 14, 15, 16, 17, 18, 27 However, the clinical implementation of sCTs has been hampered by the lack of QC tools that verify the images generated by the DCNN. The proposed QC tool provides a direct assessment of the CT number accuracy in the sCTs, by means of in vivo range measurements. Given that the proposed QC tool is independent from the method to generate sCTs, future investigations could apply the QC tool developed in this study to verify synthetic CTs generated by different deep learning models.
The RP QC tool presented here could support adaptive proton therapy workflows by providing means of in vivo range verification, targeted to the assessment of the CT number accuracy in sCT images. If the analysis of the RP QC measurements against RP simulations based on sCT was performed online, the proposed procedure could be compatible with online adaptive proton therapy treatment workflows.
5. CONCLUSIONS
The potential of RP as a QC tool for CBCT‐based sCTs verification has been demonstrated.
RP could offer means of in vivo range verification and assessment of the CT number accuracy of the sCTs; thus, detecting outliers in the sCTs generated by the DCNN. The agreement between measured and simulated RP fields indicates the suitability of sCTs for proton dose calculations in HNC patients. This brings sCTs generated by means of a DCNN closer toward clinical implementation within adaptive proton therapy treatment workflows.
CONFLICT OF INTEREST
Langendijk JA is a consultant for proton therapy equipment provider IBA.
DISCLOSURES
University of Groningen, University Medical Centre Groningen, Department of Radiation Oncology has active research agreements with RaySearch, Philips, IBA, Mirada, Orfit.
Meijers A discloses being in a paid working relationship with Varian Medical Systems, USA, as of 01/Apr/2020 outside of the scope of the work reported on this manuscript.
Supporting information
Figure s1
Figure s2
Table S1
Caption
ACKNOWLEDGMENT
This study was financially supported by a grant from the Dutch Cancer Society (KWF research project 11518) called “INCONTROL‐ Clinical Control Infrastructure for Proton Therapy Treatments”.
Seller Oria C, Thummerer A, Free J, et al. Range probing as a quality control tool for CBCT‐based synthetic CTs: In vivo application for head and neck cancer patients. Med Phys. 2021;48:4498–4505. 10.1002/mp.15020
REFERENCES
- 1.Lim‐Reinders S, Keller BM, Al‐Ward S, Sahgal A, Kim A. Online adaptive radiation therapy. Int J Radiat Oncol Biol Phys. 2017;99:994–1003. [DOI] [PubMed] [Google Scholar]
- 2.Yan D, Vicini F, Wong J, Martinez A. Adaptive radiation therapy. Phys Med Biol. 1997;42:123–132. [DOI] [PubMed] [Google Scholar]
- 3.Albertini F, Matter M, Nenoff L, Zhang Y, Lomax A. Online daily adaptive proton therapy. Br J Radiol. 2020;93:20190594. [DOI] [PMC free article] [PubMed] [Google Scholar]
- 4.Sonke JJ, Aznar M, Rasch C. Adaptive radiotherapy for anatomical changes. Semin Radiat Oncol. 2019;29:245–257. [DOI] [PubMed] [Google Scholar]
- 5.Veiga C, Janssens G, Teng C‐L, et al. First clinical investigation of cone beam computed tomography and deformable registration for adaptive proton therapy for lung cancer. Int J Radiat Oncol Biol Phys. 2016;95:549–559. [DOI] [PubMed] [Google Scholar]
- 6.Veiga C, Alshaikhi J, Amos R, et al. Cone‐beam computed tomography and deformable registration‐based “dose of the day” calculations for adaptive proton therapy. Int J Part Ther. 2015;2:404–414. [Google Scholar]
- 7.Cho MK, Kim JS, Cho Y‐B, et al. CBCT/CBDT equipped with the x‐ray projection system for image‐guided proton therapy. Med Imaging 2009 Phys Med Imaging. 2009;7258:72582V. [Google Scholar]
- 8.Posiewnik M, Piotrowski T. A review of cone‐beam CT applications for adaptive radiotherapy of prostate cancer. Phys Medica. 2019;59:13–21. [DOI] [PubMed] [Google Scholar]
- 9.Kurz C, Dedes G, Resch A, et al. Comparing cone‐beam CT intensity correction methods for dose recalculation in adaptive intensity‐modulated photon and proton therapy for head and neck cancer. Acta Oncol (Madr). 2015;54:1651–1657. [DOI] [PubMed] [Google Scholar]
- 10.Kurz C, Kamp F, Park Y‐K, et al. Investigating deformable image registration and scatter correction for CBCT‐based dose calculation in adaptive IMPT. Med Phys. 2016;43:5635–5646. [DOI] [PubMed] [Google Scholar]
- 11.Nagarajappa A, Dwivedi N, Tiwari R. Artifacts: the downturn of CBCT image. J Int Soc Prev Community Dent. 2015;5:440. [DOI] [PMC free article] [PubMed] [Google Scholar]
- 12.Park YK, Sharp GC, Phillips J, Winey BA. Proton dose calculation on scatter‐corrected CBCT image: feasibility study for adaptive proton therapy. Med Phys. 2015;42:4449–4459. [DOI] [PMC free article] [PubMed] [Google Scholar]
- 13.Hansen DC, Landry G, Kamp F, et al. ScatterNet: a convolutional neural network for cone‐beam CT intensity correction. Med Phys. 2018;45:4916–4926. [DOI] [PubMed] [Google Scholar]
- 14.Landry G, Hansen D, Kamp F, et al. Corrigendum: comparing Unet training with three different datasets to correct CBCT images for prostate radiotherapy dose calculations (Physics in Medicine and Biology (2019) 64 (035011) DOI: 10.1088/1361‐6560/aaf496). Phys Med Biol. 2019;64:089501. [DOI] [PubMed] [Google Scholar]
- 15.Thummerer A, Zaffino P, Meijers A, et al. Comparison of CBCT based synthetic CT methods suitable for proton dose calculations in adaptive proton therapy. Phys Med Biol. 2020;65:095002. [DOI] [PubMed] [Google Scholar]
- 16.Thummerer A, de Jong BA, Zaffino P, et al. Comparison of the suitability of CBCT‐ And MR‐based synthetic CTs for daily adaptive proton therapy in head and neck patients. Phys Med Biol. 2020;65:235036. [DOI] [PubMed] [Google Scholar]
- 17.Yuan N, Dyer B, Rao S, et al. Convolutional neural network enhancement of fast‐scan low‐dose cone‐beam CT images for head and neck radiotherapy. Phys Med Biol. 2020;65:035003. [DOI] [PMC free article] [PubMed] [Google Scholar]
- 18.Liang X, Chen L, Nguyen D, et al. Generating synthesized computed tomography (CT) from cone‐beam computed tomography (CBCT) using cyclegan for adaptive radiation therapy. Phys Med Biol. 2019;64:125002. [DOI] [PubMed] [Google Scholar]
- 19.van Harten LD , Wolterink JM, Verhoeff JJC, Išgum I. Automatic online quality control of synthetic CTs. Med Imaging 2020 Image Process Int Soc Opt Photonics. 2020;11313.
- 20.Farace P, Righetto R, Meijers A. Pencil beam proton radiography using a multilayer ionization chamber. Phys Med Biol. 2016;61:4078–4087. [DOI] [PubMed] [Google Scholar]
- 21.Knopf AC, Lomax A. In vivo proton range verification: a review. Phys Med Biol. 2013;58:131–160. [DOI] [PubMed] [Google Scholar]
- 22.Schneider U, Pedroni E, Lomax A. The calibration of CT Hounsfield units for radiotherapy treatment planning. Phys Med Biol. 1996;41:111–124. [DOI] [PubMed] [Google Scholar]
- 23.Schneider U, Pemler P, Besserer J, Pedroni E, Lomax A, Kaser‐Hotz B. Patient specific optimization of the relation between CT‐Hounsfield units and proton stopping power with proton radiography. Med Phys. 2005;32:195–199. [DOI] [PubMed] [Google Scholar]
- 24.Schneider U, Pedroni E. Proton radiography as a tool for quiality control in proton therapy. Med Phys. 1994;22:353–363. [DOI] [PubMed] [Google Scholar]
- 25.Doolan PJ, Testa M, Sharp G, Bentefour EH, Royle G, Lu HM. Patient‐specific stopping power calibration for proton therapy planning based on single‐detector proton radiography. Phys Med Biol. 2015;60:1901–1917. [DOI] [PubMed] [Google Scholar]
- 26.Meijers A, Seller Oria C, Free J, Langendijk JA, Knopf AC, Both S. Technical Note: first report on an in vivo range probing quality control procedure for scanned proton beam therapy in head and neck cancer patients. Med Phys. 2021;48:1372–1380. [DOI] [PubMed] [Google Scholar]
- 27.Spadea MF, Pileggi G, Zaffino P, et al. Deep Convolution Neural Network (DCNN) multiplane approach to synthetic CT generation from MR images—application in brain proton therapy. Int J Radiat Oncol. 2019;105:495–503. [DOI] [PubMed] [Google Scholar]
- 28.Widesott L, Lorentini S, Fracchiolla F, Farace P, Schwarz M. Improvements in pencil beam scanning proton therapy dose calculation accuracy in brain tumor cases with a commercial Monte Carlo algorithm. Phys Med Biol. 2018;63:145016. [DOI] [PubMed] [Google Scholar]
- 29.Meijers A, Free J, Wagenaar D, et al. Validation of the proton range accuracy and optimization of CT calibration curves utilizing range probing. Phys Med Biol. 2020;65:03NT02. [DOI] [PubMed] [Google Scholar]
- 30.Deffet S, Macq B, Righetto R, Vander Stappen F, Farace P. Registration of pencil beam proton radiography data with X‐ray CT. Med Phys. 2017;44:5393–5401. [DOI] [PubMed] [Google Scholar]
- 31.Meijers A, Seller Oria C, Free J, et al. Assessment of range uncertainty in lung‐like tissue using a porcine lung phantom and proton radiography. Phys Med Biol. 2020;65:155014. [DOI] [PubMed] [Google Scholar]
- 32.Farace P, Righetto R, Deffet S, Meijers A, Vander SF. Technical Note: a direct ray‐tracing method to compute integral depth dose in pencil beam proton radiography with a multilayer ionization chamber. Med Phys. 2016;43:6405–6412. [DOI] [PubMed] [Google Scholar]
- 33.Harms J, Maloney L, Sohn JJ, Erickson A, Lin Y, Zhang R. Flat‐panel imager energy‐dependent proton radiography for a proton pencil‐beam scanning system. Phys Med Biol. 2020;65:0–10. [DOI] [PubMed] [Google Scholar]
Associated Data
This section collects any data citations, data availability statements, or supplementary materials included in this article.
Supplementary Materials
Figure s1
Figure s2
Table S1
Caption


