Abstract
Although enormous achievements have been made in targeted molecular therapies against hepatocellular carcinoma (HCC), the treatments can only prolong the life of patients with extrahepatic metastases. We evaluated thymoquinone (TQ), a compound from Nigella sativa Linn., for its anti‐cancer effect on SK‐Hep1 cells and HCC‐xenograft nude mice. TQ effectively triggered cell death and activated p38 and extracellular signal‐regulated kinases (Erk) pathways up to 24 h after treatment in cells. TQ‐induced cell death was reversed by p38 inhibitor; however, it was enhanced by si‐Erk. The caspase3 activation and TUNEL assay revealed a stronger toxic effect upon co‐treatment with TQ and si‐Erk. Our study suggested that phosphorylation of p38 in SK‐Hep1 cells constituted the major factor leading to cell apoptosis, whereas phosphorylation of Erk led to drug resistance. Furthermore, TQ therapeutic effect was improved upon Erk inhibition in HCC‐xenograft nude mice. TQ could present excellent anti‐HCC potential under suitable p‐Erk inhibiting conditions.
Keywords: Erk, hepatocellular carcinoma, p38, SK‐Hep1 cells, thymoquinone
1. BACKGROUND
Hepatocellular carcinoma (HCC) is a common type of cancer, and one of the leading causes of cancer‐related mortality worldwide.1, 2 Although early stage patients with HCC usually feel asymptomatic, they have a risk of recurrence after surgery.3 However, there is yet no curative therapy for advanced HCC. Resection and transplantation comprise the available treatment options for advanced stages; nevertheless, the patients remain prone to HCC recurrence with a 5‐year survival rate below 20%.4, 5
Numerous compounds with antitumor effects are considered to have potential application in the treatment of HCC.6, 7, 8, 9 However, the latter is difficult to cure and a large proportion of these compounds can only extend the life of patients by several months. This could be attributed to the fact that the physiological response of HCC is usually caused by multiple pathways occurring either simultaneously or randomly. Moreover, normal liver tissue around HCC may also metabolize these drugs to reduce their toxicity toward HCC.
A characteristic of effective drugs in clinical HCC treatments is multiple target inhibition, such as shown by sorafenib.10 Sorafenib is a Ras–Raf–Erk signaling pathway inhibitor that is usually combined with other drugs in HCC clinical trials, such as the EGFR tyrosine kinase inhibitor gefitinib, or MEK inhibitor trametinib.11, 12
Thymoquinone (TQ) is a compound extracted from Black Seed (Nigella sativa Linn.), which is reported to have an anti‐tumor effect.13 TQ has also been reported to induce tumor cell apoptosis by cell cycle check point p53 through p38‐MAPK signaling pathway activation.14 Recently, TQ was reported to inhibit the proliferation of HCC as well.15
However, our preliminary results revealed that TQ treatment triggers the apoptotic pathway induced by p‐p38 MAPK and simultaneously leads to the upregulation of Erk phosphorylation. Phosphorylated Erk or JNK has been reported to inhibit apoptosis and produce drug resistance in tumor cells by maintaining the BCL‐2 and Bad binding.16 Therefore, the aim of this study was to determine whether Erk pathway activation is involved in the regulation of TQ‐induced apoptosis in human HCC.
2. METHODS
2.1. Chemicals and reagents
TQ (Catalog no. 274 666) and anisomycin were purchased from Sigma Aldrich, St Louis, MO. U0126 and SB203580 were purchased from Promega, Madison, WI.
2.2. Animal survival curve
A total of 120 BALB/c‐nu male mice (25.0 ± 0.4 g) were purchased from the Experimental Animal Center of Southern Medical University (Guangdong, China), and the experimental protocol was approved by the Institutional Animal Care and Use Committee of Guangzhou Medical University (2019–740). In this study, all mice were housed in standard conditions with 25°C temperature, 60% humidity, and a 12‐h light/dark cycle. All mice were fed normal diet (Laboratory Rodent Diet 5001) and administered water ad libitum. Before the experiment was initiated, SK‐Hep1 cells (1 × 10⁶ cells in 0.5 ml of 50% Matrigel‐Dulbecco's modified Eagle medium (DMEM) (Gibco BRL, Gaithersburg, MD) were xenografted into the back skin of each mouse. After 4 weeks, the diameter of each tumor on the mouse back was measured and only those mice with a tumor diameter larger than 3 mm were considered for the next step; the remainder with no or tiny tumors were considered to have failed the xenograft. After 40 days of tumor xenograft, 80 mice were randomized into four groups (n = 20 each). Group 1 was designated as the control group; the mice in this group were treated with normal saline (1 ml/kg/day) through intraperitoneal‐injection (IP‐injection). Group 2 was designated as the Erk‐inhibition group; mice in this group were treated with U0126‐normal saline (10 mg/kg/day) through IP‐injection. Group 3 was designated as the TQ treatment‐only group; mice in this group were treated with TQ‐normal saline solution (50 mg/kg/day) through IP‐injection. Group 4 was designated as the TQ treatment combined with Erk‐inhibition group; mice in this group were treated with TQ‐normal saline solution (50 mg/kg/day) and U0126‐normal saline (10 mg/kg/day) though IP‐injection. The largest tumor diameter in Group 1 was 22 mm and did not disturb the general behaviors of the mice. The mouse survival curve was evaluated until the number of mice in one group became zero; animals in other groups were sacrificed using CO2 at the end of survival curve evaluation. In the study, animals meeting the criteria of humane endpoint were subjected to euthanasia. We considered that the humane endpoint had been reached when animals exhibited the following conditions: losing over 25% body weight, weakness, moribund appearance, and tumor size over 20‐mm diameter. Before animals were euthanized, half of the mice in both Group 1 and Group 2 presented with tumors greater than 20‐mm diameter. Mice in Group 3 and Group 4 with TQ treatment presented with the largest tumors, 10‐mm diameter. For CO2 euthanasia, the flow rate was set to displace 30% cage volume/min. Upon occurrence of animal cardiac and respiratory arrest, CO2 flow was maintained for 1 min, after which death was confirmed by physical examination.
2.3. Cell culture
The SK‐Hep1 (TCHu109), Hep G2 (TCHu72), and Hep3B (SCSP‐5045) liver cancer cell lines used in this study were purchased from SGST (Shanghai, China) and cultured in DMEM with 10% vol/vol fetal bovine serum. Cells were maintained in a culture dish at 1 × 10⁵ cells/cm2 and the culture medium was changed every 48 h.
2.4. MTT assay
Cell viability and proliferation were evaluated using MTT assay. In this study, SK‐Hep1, HepG2, and Hep3B cells were seeded in wells and allowed to adhere for 4 h, following which the original culture medium was replaced by medium containing 0, 5, 10, 15, and 25 μM TQ, and cells were further cultured for 24 h. MTT (Sigma Aldrich, St Louis, MO) was applied to these cells. After 4 h, the tetrazolium compound (MTT) was bio‐reduced by cells into a colored formazan product. The formazan product was dissolved in DMSO and its absorbance measured at 490 nm. The concentration ranged from 0 to 200 μM of TQ treatments in each cell line was previously evaluated and the IC50 was further determinate by linear calibration equation from the cell viabilities of the 0, 5, 10, 15, and 25 μM TQ treatments for 24 h in each cell line. The linear calibration equation in SK‐Hep1 is Y = 123.67–16.857[X + 1]; (Y = viability of cells in percentage; X = folds of 5 μM TQ). The linear calibration equation in HepG2 is Y = 118.27–9.171[X + 1]; (Y = viability of cells in percentage; X = folds of 5 μM TQ). The linear calibration equation in Hep3B is Y = 109.07–11.114[X + 1]; (Y = viability of cells in percentage; X = folds of 5 μM TQ). IC50 is calculated by five times X, when Y = 50.
2.5. Inhibition and silencing assay
SK‐Hep1 cells were treated with TQ and different inhibitors including SB203580 (p38 MAP kinase inhibitor) and U0126 (Erk inhibitor). Erk expression of SK‐Hep1 cells was silenced by using si‐Erk (sc‐29 307; Santa Cruz Biotechnology, Dallas, TX) and negative control siRNA (4 390 843; Thermo Fisher Scientific, Shanghai, China). The siRNA was dissolved in RNase‐free solution and transfected into the cells using transfection reagent (sc‐29 528; Santa Cruz Biotechnology). After 36‐h culture, Erk expression was silenced in SK‐Hep1 cells.
2.6. Protein analysis
All cell‐pellet samples were collected by centrifugation and lysed in a protein extraction solution (PRO‐PREP, iNtRON Biotechnology, Inc., Korea) at 4°C. Supernatants containing proteins were obtained after centrifugation at 12000g for 30 min. The protein samples were analyzed by western blot assay, after separation by SDS gel electrophoresis and their transfer to PVDF membrane. After blocking in blocking buffer (5% skim milk, 20 mM Tris–HCl, 150 mM NaCl, and 0.1% Tween‐20) the PVDF membranes with target proteins were hybridized with specific primary antibodies purchased from Cell Signaling Technology, Inc. (Danvers, MA) including against Erk (#4695), p‐Erk (#4370), p38 (#8690), p‐p38 (#4511), Bad (#9239), p‐Bad (#5284), 14–3‐3 (#9636), cleaved caspase‐3 (# 9664), and GAPDH (#5174) at 4 °C overnight. After soaking in anti‐rabbit IgG HRP‐linked antibody (#7074) for 30 min, the blots were visualized by Immobilon Western Chemiluminescent HRP Substrate, ECL (p90719, Millipore Corporation, Billerica, MA) and the image data captured for further analysis.
2.7. 4,6‐diamidino‐2‐phenylindole and deoxynucleotidyl transferase dUTP‐mediated nick‐end labeling (TUNEL) staining
For TUNEL assay, the cells were fixed and permeablized with 0.1% Triton X‐100 (in PBS) for 10 min and washed twice with PBS. The TUNEL reagent (In Situ Cell Death Detection Kit, POD, Roche Diagnostics GmbH, Mannheim, Germany) was applied to the fixed cells for 60 min at 37°C. 4,6‐diamidino‐2‐phenylindole (DAPI) (0.1 μg/ml) was added to the cells for 5 min, causing the nucleus to fluoresce blue light at 454 nm. TUNEL‐positive nuclei (fragmented DNA) fluoresced bright green light at 460 nm. Photomicrographs were obtained using Zeiss Axiophot microscopes (Oberkochen, Germany).
2.8. Statistical analysis
Results are presented as the means ± SD of at least three independent replications. Statistical analysis was performed using one‐way ANOVA and the Tukey's test, and two‐way ANOVA and the Bonferroni test for Figure 3(C),(D) Differences were considered significant for p < .05. Mouse survival curves were analyzed using Kaplan–Meier analysis followed by the log‐rank test (***p < .001).
FIGURE 3.
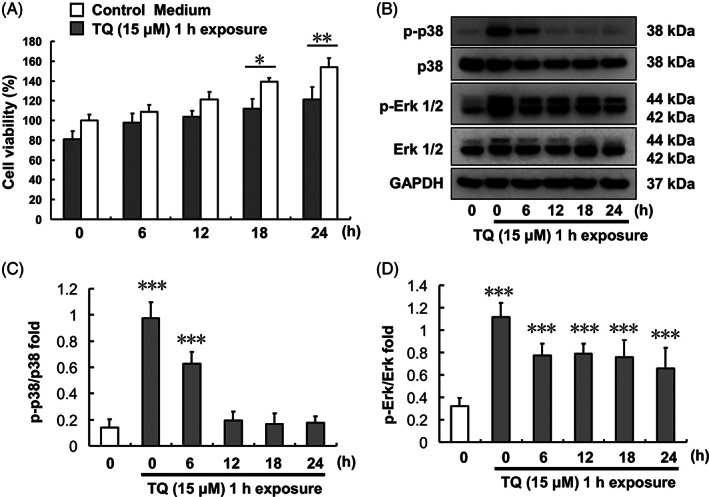
Effect of 1‐h TQ exposure on SK‐Hep1 cells. (A) Cell viability at different times after 1‐h TQ exposure. (B) Erk and p38 protein expression levels. (C) p‐p38/p38 protein expression ratio after 1‐h TQ exposure over different time courses. (D) p‐Erk/Erk protein expression ratio after 1‐h TQ exposure over different time courses (***p < .001). TQ, thymoquinone
3. RESULTS
3.1. TQ treatment inhibits liver cancer cell viability and regulates p38 and Erk activation
SK‐Hep1, Hep G2, and Hep 3B cell viabilities were evaluated by MTT assay after treatment with various TQ concentrations (0, 5, 10, 15, 20, and 25 μM) for 24 h (Figure 1(A)). The inhibitory IC50 of TQ in each cell line, SK‐Hep1, Hep G2, and Hep 3B, was found to be 17, >25, and 22 μM, respectively. MAPK activation was observed for both p‐p38 and p‐Erk in a dose‐dependent manner based on the various TQ concentration treatments in SK‐Hep1 cells (Figure 1(B)–(D)).
FIGURE 1.
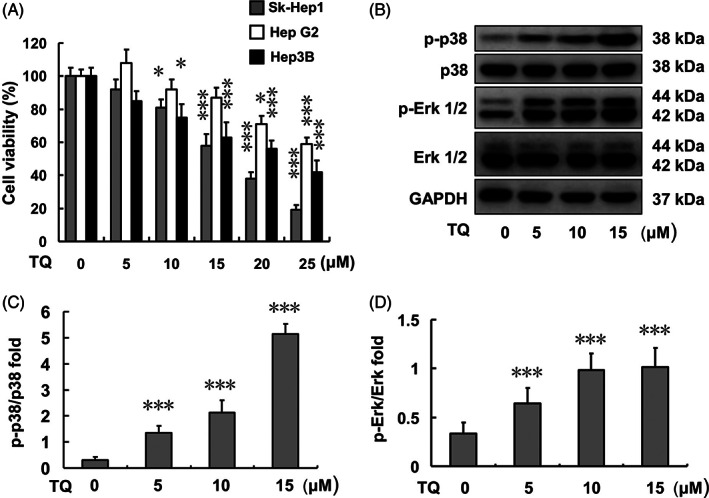
TQ treatment effect in liver cancer cell lines and related protein expression in SK‐Hep1 cells. (A) SK‐Hep1, Hep G2, and Hep3B cell viabilities after 24‐h TQ (0, 5, 10, 15, 20, and 25 μM) treatments. (B) Related p38 and Erk protein expression after 24‐h TQ (0, 5, 10, and 15 μM) treatments in SK‐Hep1 cells. (C) p‐p38/p38 protein expression ratio after 24‐h TQ (0, 5, 10, and 15 μM) treatments in SK‐Hep1 cells. (D) p‐Erk/Erk protein expression ratio after 24‐h TQ (0, 5, 10, and 15 μM) treatments in SK‐Hep1 cells (***p < .001). TQ, thymoquinone
3.2. Time‐course evaluation of p38 and Erk activation regulated by TQ treatment
Regulation of p38 and Erk activation by TQ treatment in SK‐Hep1 cells was evaluated using p38 and Erk phosphorylation. Both p‐p38 and p‐Erk expression levels were increased within 0.5 h following 15 μM TQ treatment and the expression level was retained up to 24 h thereafter (Figure 2). The p‐p38 and p‐Erk expression levels were further increased following 0.5 h of 15 μM TQ co‐treatment with 10 μM anisomycin compared to that obtained with 15 μM TQ treatment alone. SK‐Hep1 cell viability after 24 h was reduced to a greater degree upon 15 μM TQ co‐treatment with 10 μM anisomycin compared to that with 15 μM TQ treatment only.
FIGURE 2.
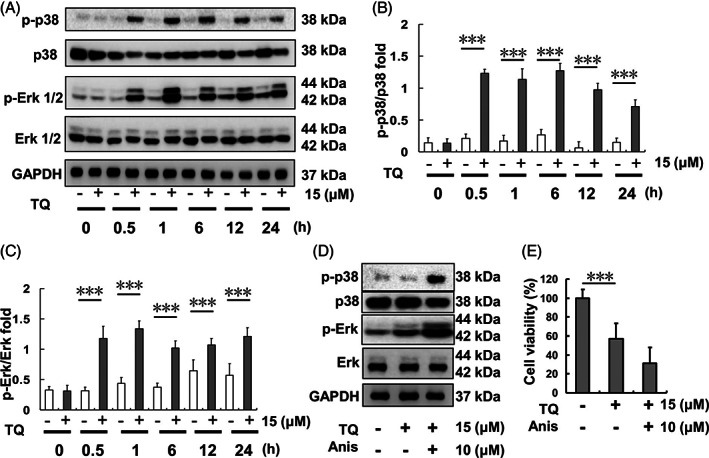
Erk and p38 expression after different time courses of TQ (15 μM)‐exposure in SK‐Hep1 cells. (A) Erk and p38 protein expression levels. (B) p‐p38/p38 protein expression ratio after TQ exposure over different time courses. (C) p‐Erk/Erk protein expression ratio after TQ exposure over different time courses. (D) Erk and p38 protein expression levels upon TQ‐only treatment or TQ‐anisomycin (Anis) co‐treatment. (E) Cell viability of SK‐Hep1 cells after 24‐h TQ and anisomycin co‐treatment. (***p < .001). TQ, thymoquinone
3.3. Time‐course evaluation of p38 and Erk activation following 1‐h TQ treatment
Both p38 and Erk were activated in SK‐Hep1 cells after 1‐h TQ (15 μM) treatment, following which the medium was refreshed to culture medium (Figure 3). Phosphorylated‐p38 expression was reduced at 6 h after 1‐h TQ exposure and significantly reduced 12 h after 1‐h TQ exposure. However, Erk remained activated up to 24 h (which was the end of the experiment) following 1‐h TQ exposure.
3.4. Inhibition of p38 activation decreases the anti‐tumor effect of TQ in SK‐Hep1 cells
SK‐Hep1 cells were pretreated with 5 μM SB203580 (p38 inhibitor) for 1 h prior to treatment with 15 μM TQ. Following 0.5‐h TQ treatment, the protein samples of SK‐Hep1 cells were collected and analyzed. Protein analysis results showed p‐p38 expression to have increased following TQ treatment whereas it was inhibited by SB203580 pretreatment (Figure 4(A)–(C)). After 24‐h TQ treatment, SK‐Hep1 cell viability was evaluated by MTT assay. It decreased in the TQ treatment‐only group (Figure 4(D)) but showed no difference across control, SB203580‐treatment, and SB203580 and TQ‐co‐treatment groups.
FIGURE 4.
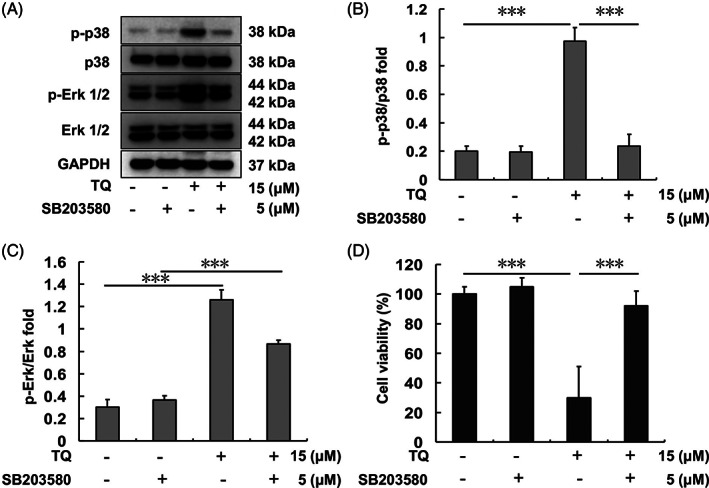
Erk and p38 expression after TQ and/or SB203580 treatment in SK‐Hep1 cells. (A) Erk and p38 protein levels after each indicated treatment. (B) p‐p38/p38 protein expression ratio upon each indicated treatment. (C) p‐Erk/Erk protein expression ratio upon each indicated treatment. (D) SK‐Hep1 cell viability after 24 h of each indicated treatment (***p < .001). TQ, thymoquinone
3.5. Inhibition of Erk activation shows no effect on the anti‐tumor properties of TQ in SK‐Hep1 cells
SK‐Hep1 cells were pretreated with 10 μM U0126 (Erk inhibitor) for 1 h, followed by treatment with 15 μM TQ. After 0.5‐h TQ treatment, protein samples of SK‐Hep1 cells were collected and analyzed. Expression of p‐Erk increased following TQ treatment, whereas it was inhibited by U0126 pretreatment (Figure 5(A)–(C)). After 24‐h TQ treatment, SK‐Hep1 cell viability was evaluated by MTT assay. Viability decreased in the TQ‐treatment and U0126‐TQ‐co‐treatment groups (Figure 5(D)), but it showed no difference between control and U0126 treatment‐only groups.
FIGURE 5.
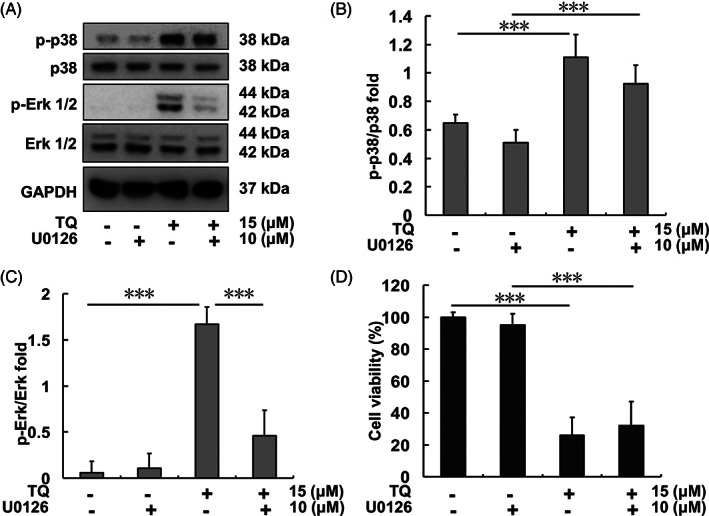
Erk and p38 expression after TQ and U0126 treatments in SK‐Hep1 cells. (A) Erk and p38 protein levels upon each indicated treatment. (B) p‐p38/p38 protein expression ratio upon each indicated treatment. (C) p‐Erk/Erk protein expression ratio upon each indicated treatment. (D) SK‐Hep1 cell viability after 24 h of each indicated treatment (***p < .001). TQ, thymoquinone
3.6. Silencing of Erk expression in SK‐Hep1 cells enhances SK‐Hep1 cell apoptosis following TQ treatment
Erk expression in SK‐Hep1 cells was silenced after 10 μM si‐Erk pretreatment for 48 h; moreover, the original higher p‐Erk expression in the TQ treatment group was also reduced following si‐Erk pretreatment (Figure 6(A)–(C)). For the same treatments, 14–3‐3 protein expression levels did not significantly differ in each group (Figure 6(D)). p‐Bad expression was reduced in both TQ‐only‐treatment and si‐Erk‐combined‐TQ‐co‐treatment groups (Figure 6(E)). In addition, the cleaved caspase 3 expression level increased in the TQ‐only group and was further enhanced in the si‐Erk‐combined‐TQ co‐treatment group (Figure 6(G)).
FIGURE 6.
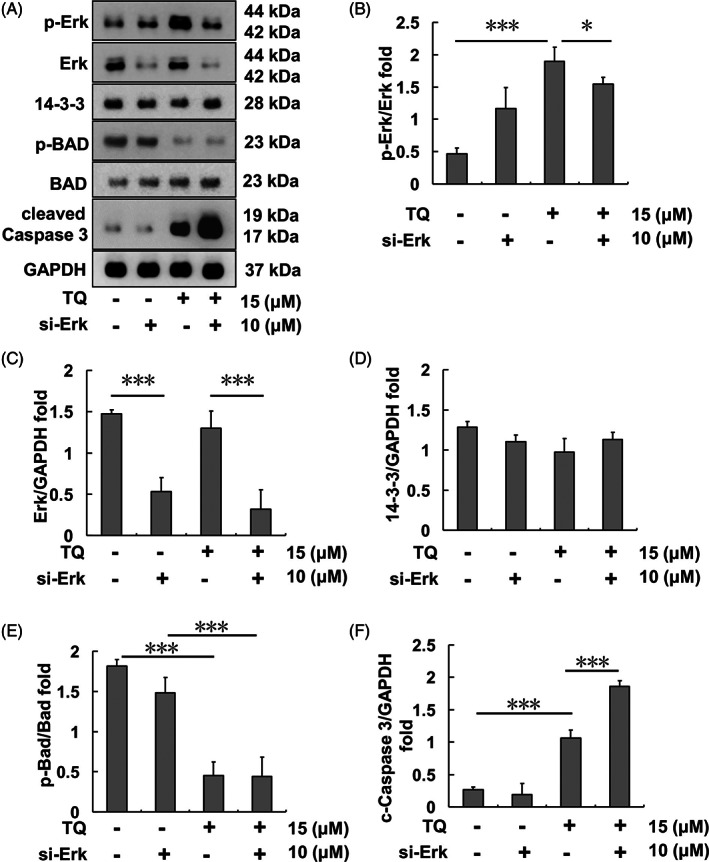
Apoptosis‐related protein expression after TQ and si‐Erk treatment in SK‐Hep1 cells. (A) Bad‐regulated apoptotic protein levels upon each indicated treatment. (B) p‐Erk/Erk protein expression ratio upon each indicated treatment. (C) Erk/GAPDH protein expression ratio upon each indicated treatment. (D) 14–3‐3/GAPDH protein expression ratio upon each indicated treatment. (E) p‐Bad/Bad protein expression ratio upon each indicated treatment. (F) Cleaved Caspase 3/GAPDH protein expression ratio upon each indicated treatment (*p < .05, ***p < .001). TQ, thymoquinone
For the same treatment design, apoptosis of SK‐Hep1 cells was evaluated using the TUNEL/DAPI staining assay following 24‐h TQ treatment. The results showed SK‐Hep1 cell apoptosis to be increased in the TQ‐only group and further enhanced in the si‐Erk‐TQ co‐treatment group (Figure 7). Moreover, nude mice subjected to SK‐Hep1 cell‐xenograft showed a better survival ratio following TQ‐only treatment and further improvements were observed in TQ and U0126 co‐treatment group compared to that in the control group (Figure 7(C)).
FIGURE 7.
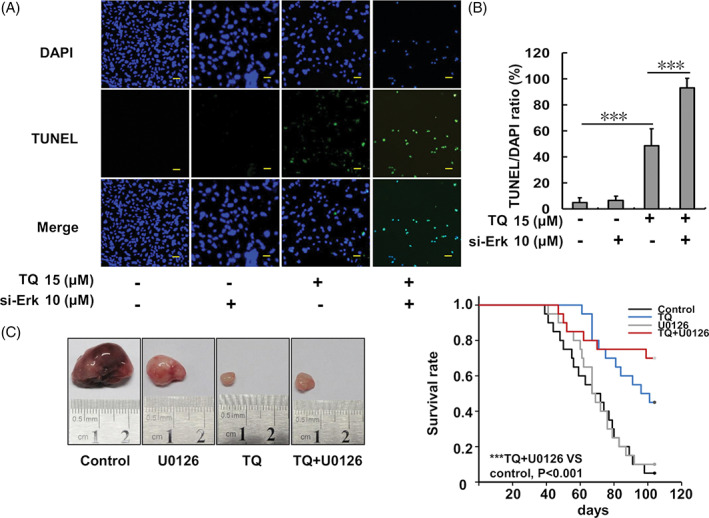
Analysis of SK‐Hep1 cell apoptosis analysis following TQ and si‐Erk treatment and the animal model. (A) Cell apoptosis evaluation using DAPI and TUNEL staining assays. (B) The TUNEL/DAPI ratio of SK‐Hep1 cells after TQ and si‐Erk treatments. (C) BALB/c‐nu mouse survival curve and a representative tumor following SK‐Hep1 xenograft and the indicated treatments. Survival curve analysis by Kaplan–Meier analysis and the log rank test is shown. A statistically significant difference was observed between survival curves (p < .001). For all pairwise multiple comparison procedures (Holm‐Sidak method) the significance level = 0.05. TQ versus control, p = .00171; TQ + U0126 versus control, p = .000193; TQ versus U0126, p = .00584; TQ + U0126 versus U0126, p = .00116; TQ versus TQ + U0126, p = .36; control versus U0126, p = .752 (***p < .001 compared to the control group). TQ, thymoquinone
4. DISCUSSION
TQ has been reported to cause cell apoptosis in several cancer types.17, 18 In the present study, the cell apoptosis‐related IC50 of TQ in SK‐Hep1 cells was found to be 17 μM, which suggest the potential of this agent for HCC treatment (Figure 1). Similarly, TQ treatment enhanced p38 phosphorylation in SK‐Hep1 cells and caused cell apoptosis, as reported in other tumor cells.19, 20 However, the expression of p‐Erk and p38 in SK‐Hep1 cells occurred almost simultaneously following exposure to TQ (Figure 2). After the removal of TQ, p‐Erk but not p‐p38 continued to be expressed (Figure 3). In contrast, pretreatment of SK‐Hep1 cells with SB203580, a p38 phosphorylation inhibitor, attenuated the toxicity of TQ to effectively induce SK‐Hep1 cell apoptosis (Figure 4).
Several studies have pointed out that p‐Erk expression maintains phosphorylation of the Bad protein and enhances the binding of 14–3‐3 protein to Bad, further reducing apoptosis.21, 22 Phosphorylated Erk is also involved in cell migration, invasion, and metastasis in prostate cancer.23 Therefore, the continued expression of p‐Erk in HCC following TQ treatment is quite unfavorable for subsequent treatment.
U0126, a non‐ATP‐dependent Mek1/2 inhibitor, was also used, and observed to effectively inhibit the phosphorylation of Erk in SK‐Hep1 cells without affecting TQ treatment results (Figure 5). In fact, Ras–Raf‐Mek1/2‐Erk has a variety of compensatory pathways. It is, therefore, necessary to combine multiple drugs simultaneously, such as CH5126766, GDC‐0623, and trametinib, to completely prevent the phosphorylation of Erk in clinical treatment.24
In the present study, we used si‐Erk to silence the expression of Erk and also attenuate the expression of p‐Erk following TQ treatment (Figure 6). Si‐Erk treatment potentially enhanced the apoptosis‐inducing effect of TQ in SK‐Hep1 cells (Figure 7). Thus, Erk inhibition appeared to constitute a promising strategy to improve the TQ effects both in vitro and in vivo. Samarghandian et al., reported that TQ can also promote the apoptosis of lung cancer cells by increasing the expression of p35 and then causing the DNA fragmentation in A549 cells.17 In addition, the results of Zhang et al. also pointed out that TQ inhibited the metastasis effect on both 786‐Q and ACHN renal cell cancer cell lines by inducing autophagy via AMPK/mTOR signaling pathway.18 However, the TQ effect was not evaluated outside of HCC cell lines in the present study and apoptosis was not confirmed nor examined in further detail using other approaches, which represented study limitations that should be addressed in future research. Nevertheless, we consider that the mouse survival experiment served to verify the therapeutic effect of this approach without obvious adverse outcomes in vivo.
The results of the present study suggest that numerous potential anti‐hepatoma molecules may exist with discrete effects. However, p‐Erk is usually over‐activated during chemical stress, resulting in drug resistance or poor subsequent treatment. The clinical drug sorafenib is effective against HCC under a p‐Erk over‐activated condition, although a combination of multiple drugs is still required. Clinical treatment also suggests the need for a stronger Ras‐MEK1/2‐Erk blocker, either single or in combination.24, 25 Notably, inhibition of Ras‐Mek1/2‐Erk signaling may also lead to anti‐aging intervention benefits.26
5. CONCLUSIONS
In conclusion, the rapid response of Erk phosphorylation constitutes a drug resistance factor for many potential anti‐HCC drugs. The anti‐HCC effect of TQ also presents good therapeutic potential under suitable p‐Erk‐inhibitory conditions.
CONFLICT OF INTEREST
The authors declare that they have no competing interests.
AUTHOR CONTRIBUTIONS
Bin Zhang and Wei‐Jen Ting: Conception and design, interpretation of data; Jun Gao and Zhan‐Fang Kang: Acquisition and analysis of data, drafting the manuscript; Chih‐Yang Huang: Conception and design, given final approval of the version to be published; Yi‐Jiun Weng: Analysis and interpretation of data, drafting and revising the manuscript. All authors have read and approved the manuscript.
ACKNOWLEDGMENT
This study was supported by the Qingyuan People's Hospital (2018B033).
Zhang B, Ting W‐J, Gao J, Kang Z‐F, Huang C‐Y, Weng Y‐J. Erk phosphorylation reduces the thymoquinone toxicity in human hepatocarcinoma. Environmental Toxicology. 2021;36(10):1990‐1998. 10.1002/tox.23317
Bing Zhang and Wei‐Jen Ting have contributed equally to this article.
Funding information Qingyuan People's Hospital, Grant/Award Number: 2018B033
DATA AVAILABILITY STATEMENT
All data generated or analysed during this study are included in this published article.
REFERENCES
- 1.Torre LA, Bray F, Siegel RL, Ferlay J, Lortet‐Tieulent J, Jemal A. Global Cancer statistics, 2012. CA Cancer J Clin. 2015;65:87‐108. [DOI] [PubMed] [Google Scholar]
- 2.Wang WY, Qin HL, Zhou L, Ma JL. Meta‐analysis of the relationship between microRNA‐499 rs3746444 polymorphism and hepatocellular carcinoma risk in Asians. J Cancer Res Ther. 2016;12:676‐680. [DOI] [PubMed] [Google Scholar]
- 3.Hsu SC, Kuo CL, Lin JP, et al. Crude extracts of Euchresta formosana radix inhibit invasion and migration of human hepatocellular carcinoma cells. Anticancer Res. 2007;27:2377‐2384. [PubMed] [Google Scholar]
- 4.Bai HQ, Gao P, Gao H, et al. Improvement of survival rate for patients with hepatocellular carcinoma using transarterial chemoembolization in combination with three‐dimensional conformal radiation therapy: a meta‐analysis. Med Sci Monit. 2016;22:1773‐1781. [DOI] [PMC free article] [PubMed] [Google Scholar]
- 5.Lee JG, Kang CM, Park JS, et al. The actual five‐year survival rate of hepatocellular carcinoma patients after curative resection. Yonsei Med J. 2006;47:105‐112. [DOI] [PMC free article] [PubMed] [Google Scholar]
- 6.El‐Khoueiry AB, Sangro B, Yau T, et al. Nivolumab in patients with advanced hepatocellular carcinoma (CheckMate 040): an open‐label, non‐comparative, phase 1/2 dose escalation and expansion trial. Lancet. 2017;389:2492‐2502. [DOI] [PMC free article] [PubMed] [Google Scholar]
- 7.Wang P, Gao C, Wang W, et al. Juglone induces apoptosis and autophagy via modulation of mitogen‐activated protein kinase pathways in human hepatocellular carcinoma cells. Food Chem Toxicol. 2018;116:40‐50. [DOI] [PubMed] [Google Scholar]
- 8.Lee DW, Lee KH, Kim HJ, et al. A phase II trial of S‐1 and oxaliplatin in patients with advanced hepatocellular carcinoma. BMC Cancer. 2018;18:252. [DOI] [PMC free article] [PubMed] [Google Scholar]
- 9.Feun LG, Wangpaichitr M, Li YY, et al. Phase II trial of SOM230 (pasireotide LAR) in patients with unresectable hepatocellular carcinoma. J Hepatocell Carcinoma. 2018;5:9‐15. [DOI] [PMC free article] [PubMed] [Google Scholar]
- 10.Hatooka M, Kawaoka T, Aikata H, et al. Hepatic arterial infusion chemotherapy followed by sorafenib in patients with advanced hepatocellular carcinoma (HICS 55): an open label, non‐comparative, phase II trial. BMC Cancer. 2018;18:633. [DOI] [PMC free article] [PubMed] [Google Scholar]
- 11.Lim HY, Merle P, Weiss KH, et al. Phase II studies with refametinib or refametinib plus sorafenib in patients with RAS‐mutated hepatocellular carcinoma. Clin Cancer Res. 2018;24:4650‐4661. [DOI] [PubMed] [Google Scholar]
- 12.Xia H, Dai X, Yu H, et al. EGFR‐PI3K‐PDK1 pathway regulates YAP signaling in hepatocellular carcinoma: the mechanism and its implications in targeted therapy. Cell Death Dis. 2018;9:269. [DOI] [PMC free article] [PubMed] [Google Scholar]
- 13.Abdelfadil E, Cheng YH, Bau DT, et al. Thymoquinone induces apoptosis in oral cancer cells through p38β inhibition. Am J Chin Med. 2013;41:683‐696. [DOI] [PubMed] [Google Scholar]
- 14.Dastjerdi MN, Mehdiabady EM, Iranpour FG, Bahramian H. Effect of thymoquinone on P53 gene expression and consequence apoptosis in breast cancer cell line. Int J Prev Med. 2016;7:66. [DOI] [PMC free article] [PubMed] [Google Scholar]
- 15.Ashour AE, Abd‐Allah AR, Korashy HM, et al. Thymoquinone suppression of the human hepatocellular carcinoma cell growth involves inhibition of IL‐8 expression, elevated levels of TRAIL receptors, oxidative stress and apoptosis. Mol Cell Biochem. 2014;389:85‐98. [DOI] [PubMed] [Google Scholar]
- 16.McCubrey JA, Steelman LS, Franklin RA, et al. Targeting the RAF/MEK/ERK, PI3K/AKT and p53 pathways in hematopoietic drug resistance. Adv Enzyme Regul. 2007;47:64‐103. [DOI] [PMC free article] [PubMed] [Google Scholar]
- 17.Samarghandian S, Azimi‐Nezhad M, Farkhondeh T. Thymoquinone‐induced antitumor and apoptosis in human lung adenocarcinoma cells. J Cell Physiol. 2019;234:10421‐10431. [DOI] [PubMed] [Google Scholar]
- 18.Zhang Y, Fan Y, Huang S, et al. Thymoquinone inhibits the metastasis of renal cell cancer cells by inducing autophagy via AMPK/mTOR signaling pathway. Cancer Sci. 2018;109:3865‐3873. [DOI] [PMC free article] [PubMed] [Google Scholar]
- 19.Chen MC, Lee NH, Hsu HH, et al. Inhibition of NF‐κB and metastasis in irinotecan (CPT‐11)‐resistant LoVo colon cancer cells by thymoquinone via JNK and p38. Environ Toxicol. 2017;32:669‐678. [DOI] [PubMed] [Google Scholar]
- 20.Woo CC, Hsu A, Kumar AP, Sethi G, Tan KH. Thymoquinone inhibits tumor growth and induces apoptosis in a breast cancer xenograft mouse model: the role of p38 MAPK and ROS. PLoS One. 2013;8:e75356. [DOI] [PMC free article] [PubMed] [Google Scholar]
- 21.El‐Najjar N, Chatila M, Moukadem H, et al. Reactive oxygen species mediate thymoquinone‐induced apoptosis and activate ERK and JNK signaling. Apoptosis. 2010;15:183‐195. [DOI] [PubMed] [Google Scholar]
- 22.Mann J, Githaka JM, Buckland TW, et al. Non‐canonical BAD activity regulates breast cancer cell and tumor growth via 14‐3‐3 binding and mitochondrial metabolism. Oncogene. 2019;38:3325‐3339. [DOI] [PMC free article] [PubMed] [Google Scholar]
- 23.Lin CC, Chen KB, Tsai CH, et al. Casticin inhibits human prostate cancer DU 145 cell migration and invasion via Ras/Akt/NF‐kappaB signaling pathways. J Food Biochem. 2019;43:e12902. [DOI] [PubMed] [Google Scholar]
- 24.Caunt CJ, Sale MJ, Smith PD, Cook SJ. MEK1 and MEK2 inhibitors and cancer therapy: the long and winding road. Nat Rev Cancer. 2015;15:577‐592. [DOI] [PubMed] [Google Scholar]
- 25.Samatar AA, Poulikakos PI. Targeting RAS–ERK signalling in cancer: promises and challenges. Nat Rev Drug Discov. 2014;13:928‐942. [DOI] [PubMed] [Google Scholar]
- 26.Slack C, Alic N, Foley A, Cabecinha M, Hoddinott MP, Partridge L. The Ras‐Erk‐ETS‐signaling pathway is a drug target for longevity. Cell. 2015;162:72‐83. [DOI] [PMC free article] [PubMed] [Google Scholar]
Associated Data
This section collects any data citations, data availability statements, or supplementary materials included in this article.
Data Availability Statement
All data generated or analysed during this study are included in this published article.


