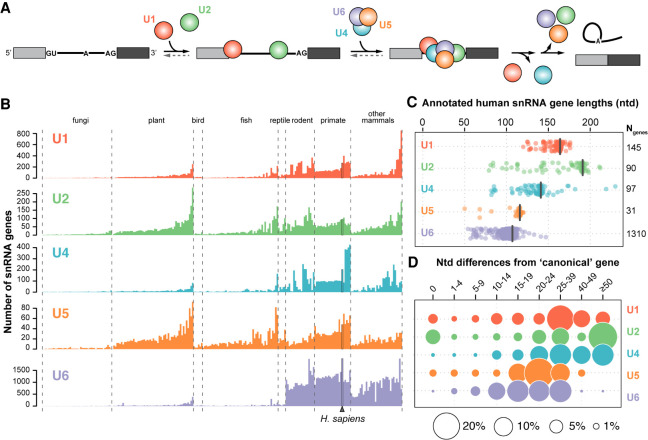
FIGURE 1.
The human genome contains more than a thousand snRNA gene variants. (A) Simplified splicing schematic. Shown are two exons (filled rectangles) flanking an intron (black line). The U1 snRNP (red) binds the 5′ splice site (GU) and the U2 snRNP (green) binds the branch site (A), upstream of the 3′ splice site (AG). The U4/U6.U5 tri-snRNP (blue, purple, orange) then joins and the U1 and U4 snRNPs are released upon catalytic activation. The intron is excised as a branched “lariat” concomitant with exon ligation and the snRNPs are recycled. For simplicity, non-snRNP splicing factors are not shown. (B) Number of snRNA genes per haploid genome identified based on a computational genome annotation and comparison of sequence homology with the main snRNA genes. Only genes annotated in both the Ensembl (Zerbino et al. 2018) and Rfam (Kalvari et al. 2018) databases were included. Genomes within each clade are sorted according to their average number of snRNA genes, excluding U6. The number of genomes analyzed in each clade is: fungi (46), plant (54), bird (6), fish (50), reptile (5), rodent (19), primate (24), and other mammals (34). (C) Distribution of annotated human snRNA gene lengths. The length in nucleotides of the canonical snRNA of each type is indicated by a black bar and corresponds to: U1 (164), U2 (191), U4 (141), U5 (116), U6 (107). The total number of genes per snRNA family are noted on the right. (D) Number of nucleotide mismatches or indels compared to the canonical snRNA. Differences were calculated according to a Needleman–Wunsch alignment (Needleman and Wunsch 1970). A nucleotide difference of zero indicates snRNA genes with the canonical sequence. Circle area is proportional to the percentage of genes for a given type of snRNA.

