

Abstract
XRN1 is a highly conserved exoribonuclease which degrades uncapped RNAs in a 5′–3′ direction. Degradation of RNAs by XRN1 is important in many cellular and developmental processes and is relevant to human disease. Studies in D. melanogaster demonstrate that XRN1 can target specific RNAs, which have important consequences for developmental pathways. Osteosarcoma is a malignancy of the bone and accounts for 2% of all pediatric cancers worldwide. Five-year survival of patients has remained static since the 1970s and therefore furthering our molecular understanding of this disease is crucial. Previous work has shown a down-regulation of XRN1 in osteosarcoma cells; however, the transcripts regulated by XRN1 which might promote osteosarcoma remain elusive. Here, we confirm reduced levels of XRN1 in osteosarcoma cell lines and patient samples and identify XRN1-sensitive transcripts in human osteosarcoma cells. Using RNA-seq in XRN1-knockdown SAOS-2 cells, we show that 1178 genes are differentially regulated. Using a novel bioinformatic approach, we demonstrate that 134 transcripts show characteristics of direct post-transcriptional regulation by XRN1. Long noncoding RNAs (lncRNAs) are enriched in this group, suggesting that XRN1 normally plays an important role in controlling lncRNA expression in these cells. Among potential lncRNAs targeted by XRN1 is HOTAIR, which is known to be up-regulated in osteosarcoma and contributes to disease progression. We have also identified G-rich and GU motifs in post-transcriptionally regulated transcripts which appear to sensitize them to XRN1 degradation. Our results therefore provide significant insights into the specificity of XRN1 in human cells which are relevant to disease.
Keywords: XRN1, RNA-seq, Ewing sarcoma, lncRNAs, RNA degradation
INTRODUCTION
Spatial and temporal control of gene expression is critical to maintain cellular homeostasis. A crucial part of this regulatory network is the post-transcriptional control of RNA turnover in the cytoplasm. Deficiencies in RNA degradation can result in excesses of particular RNAs, which has implications for organism development, cell proliferation, and a variety of human diseases including inflammation and viral infection (Astuti et al. 2012; Moon et al. 2015; Towler et al. 2015, 2016, 2020; Pashler et al. 2016; Towler and Newbury 2018). A major pathway operating within this network to provide post-transcriptional control of RNA expression is the 5′–3′ cytoplasmic RNA decay machinery. At the core of this pathway is the highly conserved 5′–3′ exoribonuclease XRN1. XRN1, the only cytoplasmic 5′–3′ exoribonuclease, functions as a complex with the decapping proteins DCP1/DCP2 (Braun et al. 2012) to remove the protective 5′ methylguanosine cap, resulting in an RNA with a 5′ phosphate which is susceptible to decay by XRN1.
Recent work suggests a model where XRN1-mediated decay is critical to maintain a complex regulatory feedback loop to control RNA Polymerase II (RNA pol II) activity (Abernathy et al. 2015; Gilbertson et al. 2018). Additional work has suggested that XRN1 itself is able to function as a transcriptional regulator in yeast cells (Blasco-Moreno et al. 2019). Modulation of XRN1 activity has been demonstrated to result in the cellular redistribution of a number of RNA binding proteins, which in turn affect RNA pol II activity (Gilbertson et al. 2018). XRN1 has also been demonstrated to be involved in cotranslational decay (Tuck et al. 2020). Work in yeast has shown that XRN1 is able to directly interact with the ribosome, where the mRNA is directly channeled from the ribosomal decoding site into the active site of XRN1 (Tesina et al. 2019). Additionally, XRN1 has been shown to facilitate the clearance of transcripts on which the ribosome is stalled in mouse embryonic stem cells (Tuck et al. 2020). During nonsense mediated decay in mammalian cells, XRN1 rapidly removes the 3′ portion of the transcript after SMG-6-catalyzed cleavage (Boehm et al. 2016). Therefore, XRN1 plays a key role in many cellular pathways to regulate RNA levels.
Previous work in model organisms, such as D. melanogaster, C. elegans and A. thaliana, has shown null mutations/depletion of XRN1 result in specific developmental defects and/or lethality, strongly suggesting that XRN1 can target specific RNAs important in cellular or physiological processes. In D. melanogaster, null mutations result in defects during embryonic dorsal closure, small imaginal discs and lethality at the early pupal stage (Grima et al. 2008; Jones et al. 2012, 2013, 2016; Waldron et al. 2015). A key target in the larval stage is dilp8, encoding a secreted insulin-like peptide, which is known to coordinate developmental timing (Colombani et al. 2012; Jones et al. 2016). In C. elegans, knockdown of xrn-1 results in defects in embryonic ventral enclosure and subsequent lethality, although the targets are unknown (Newbury and Woollard 2004). While this work highlights the crucial developmental role of XRN1, the specific, physiologically relevant XRN1 targets in human cells remain elusive. The only well characterized role of XRN1 in human cells is during the host response to viral infection where its activity is inhibited, resulting in the stabilization of short-lived RNAs such as FOS and TUT1 (Moon et al. 2012, 2015; Chapman et al. 2014).
Here we set out to identify and categorize XRN1-sensitive transcripts which are directly and indirectly sensitive to XRN1 activity in human cancer cells. Using modern techniques, we confirm previous findings by Zhang et al. (2002) to show that XRN1 transcripts are reduced in levels in both osteosarcoma cell lines and patient samples, and extend these findings to two Ewing sarcoma cell lines. We identify a specific subset of transcripts that show sensitivity to XRN1 expression in osteosarcoma SAOS-2 cells and develop a method to assess the nature of their sensitivity. Using this method, we demonstrate that transcripts that are directly and indirectly regulated by XRN1 are involved in specific cellular processes and display features which may confer their XRN1 sensitivity.
RESULTS
XRN1 is misexpressed in a subset of cancers of the mesenchymal lineage
XRN1 is an enzyme expressed ubiquitously with a critical role in regulating cytoplasmic RNA degradation. Semi-quantitative RT-PCR has been used previously to show that XRN1 has reduced expression in human osteosarcoma cell lines and patient samples compared to fetal osteoblast (HOb) cells (Zhang et al. 2002). We confirmed these findings using modern quantitative PCR (qRT-PCR) on a range of human osteosarcoma cell lines and observed reductions in XRN1 transcript levels in HOS and U-2 OS cells compared to HOb control cells. No difference was observed in the SAOS-2 cell line compared to the HOb cells, showing XRN1 down-regulation was not ubiquitous across osteosarcoma cell lines. HOb cells were used as controls because they were the most suitable control line at the time of this study, as they are primary fetal osteoblast cells and are not cancerous. The levels of XRN1 are similar in the primary HOb cells and the least proliferative osteosarcoma cell line, SAOS-2, showing that the HOb control cells do not have an abnormally high level of XRN1 (Fig. 1A). Interestingly, the HOS cell line, which expresses the lowest levels of XRN1, is also the most proliferative, whereas SAOS-2 cells, which do not show reduced XRN1 expression, proliferate more slowly (Supplemental Fig. 1A). In contrast to XRN1, levels of other ribonucleases, XRN2, DIS3, DIS3L1 and DIS3L2 were not reduced, demonstrating that down-regulation is specific to XRN1 and not a general reduction in RNA stability mediators (Supplemental Fig. 1B). Indeed, our results show an increase in the levels of all these other ribonucleases in HOS cells, suggesting a compensatory mechanism to maintain normal RNA levels. We then assessed the levels of XRN1 pre-mRNA to test if transcription of XRN1 was inhibited in these cells. Interestingly, we did not observe pre-XRN1 down-regulation in HOS or U-2 OS cells, suggesting the observed effects are a result of differential regulation at the post-transcriptional level (Fig. 1B).
FIGURE 1.

XRN1 is down-regulated in osteo- and Ewing sarcoma. (A) qRT-PCR quantification of XRN1 mRNA expression across osteosarcoma (OS) cell lines in comparison to the HOb control cell line, normalized to HPRT1. Error bars represent SEM, n ≥ 5. (B) qRT-PCR quantification of pre-XRN1 across osteosarcoma cell lines in comparison to the HOb control cell line, normalized to HPRT1. Error bars represent SEM, n ≥ 6. (C) qRT-PCR quantification of XRN1 across osteosarcoma patient samples in comparison to the HOb control cell line, normalized to PES1. Error bars represent SEM, n ≥ 5, P = 0.0296. (Red) Samples from hip and femur. (Blue) Samples from scapula or humerus. (Green) Unknown origin. (D) Representative western blot and graphical analysis showing expression of XRN1 protein in osteosarcoma cells as a proportion of that expressed in HOb control cells, normalized to a total protein stain. Error bars represent SEM, n ≥ 4, (**) P < 0.01. (E) qRT-PCR quantification of XRN1 mRNA expression in Ewing sarcoma (EWS) cell lines in comparison to the HOb control cell line, normalized to GAPDH. Error bars represent SEM, n ≥ 6. (F) Representative western blot and graphical analysis showing expression of XRN1 protein in Ewing sarcoma cells as a proportion of that expressed in HOb control cells. Error bars represent SEM, n ≥ 4. For all panels (****) P < 0.0001, (**) P < 0.01, (*) P < 0.05, and ns = P > 0.05.
To determine whether reduced levels of XRN1 might have clinical importance in osteosarcoma, we measured XRN1 mRNA expression in nine patient samples. Strikingly, all nine samples showed reduced XRN1 mRNA expression compared to HOb cells (Fig. 1C). Consistent with our qRT-PCR data, western blotting confirmed the reduction in XRN1 protein expression in both HOS and U-2 OS cells, whereas XRN1 protein expression was unaffected in SAOS-2 cells when compared to the HOb control line (Fig. 1D). To test if our observations were specific to osteosarcoma progression, we next assessed XRN1 expression in the pathologically related bone sarcoma, Ewing sarcoma. A decrease in both XRN1 mRNA and protein was observed in two Ewing sarcoma cell lines, RD-ES and SK-ES-1, showing that our previous observations are not specific to osteosarcoma and suggesting XRN1 may have broader clinical importance (Fig. 1E,F). Taken together, these data suggest that XRN1 may have clinical relevance to osteosarcoma progression but further work is needed to understand the mechanisms involved.
Phenotypic behavior of SAOS-2 cells is not affected by XRN1 knockdown
Given the clear reduction of XRN1 expression in the majority of osteosarcoma and Ewing sarcoma cells, we set out to identify cellular processes specifically regulated by XRN1 within these cells. To achieve this, we performed a variety of phenotypic assays to determine the effect of XRN1 down-regulation on cancer cell behavior. For these experiments we used SAOS-2 cells as they showed wild-type levels of XRN1 expression compared to the HOb control. We hypothesized that depletion of XRN1 in SAOS-2 cells may induce a phenocopy of the HOS or U-2 OS cell lines which show an increased growth rate (Supplemental Fig. 1A). Using siRNA we successfully reduced XRN1 expression to 20% of the levels observed in the scrambled siRNA controls within 24 h. XRN1 protein levels remained depleted until at least 144 h post transfection (Fig. 2A; Supplemental Fig. 2).
FIGURE 2.

XRN1 knockdown in SAOS-2 cells does not result in observable phenotypes. (A) Successful knockdown of XRN1 in SAOS-2 cells using RNAi 24 h post transfection. Scr samples treated with 20 pmol scrambled siRNA and KD cells treated with 20 pmol XRN1 siRNA. Error bars represent SEM, (***) P = 0.0008. (B) Quantification and representative images (40× objective) of the BrdU proliferation assay. Error bars represent SEM, n ≥ 25, P = 0.7938, scale bar = 50 µM. (C) WST-1 assay at 24 h time intervals following transfection with either Scrambled (Scr) or XRN1 (KD) siRNA. Error bars represent SEM, n = 3. (D) Caspase Glo 3/7 assay at 24 h time intervals following transfection with either Scrambled (Scr) or XRN1 (KD) siRNA. Error bars represent SEM, n = 3. (E) Quantification and representative images (20× objective) of transwell migration assay 6, 24, or 30 h post seeding. Seeding was performed 24 h post transfection with either Scrambled (Scr) or XRN1 (KD) siRNA. Error bars represent SEM, n = 4, P > 0.05, scale bar = 100 µM. (F) Knockdown of XRN1 does not affect nascent translation rates. Quantification of Puromycin incorporation or XRN1 expression (normalized to GAPDH relative to its own scrambled partner) 24 h post transfection in cells treated with either Scrambled (Scr) or XRN1 (KD) siRNA. Error bars represent SEM, (***) P = 0.0003, ns = P = 0.7432, n = 5.
Using this model, we assessed proliferation and cell viability using BrdU staining and WST-1 assays, respectively. Although XRN1 expression was reduced by 81.8% (−5.49-fold) we did not observe phenotypic changes when compared to the scrambled siRNA control (Fig. 2B,C). Similarly, a Caspase-Glo 3/7 assay showed no strong change in the levels of apoptosis following XRN1 depletion (Fig. 2D). In addition to viability and proliferation, cell migration is another crucial hallmark of cancer progression (Hanahan and Weinberg 2011). To assess if XRN1 depletion affects the rate of cell migration, we used a transwell assay. However, we observed no statistically significant changes in cell migration between XRN1-depleted and scrambled siRNA treated control cells over a 30-h period (Fig. 2E).
Finally, given that XRN1 has recently been shown to have strong roles in cotranslational regulation in human and yeast cells (Tesina et al. 2019; Tuck et al. 2020) and translation factors are XRN4 targets in plant cells (Nagarajan et al. 2019), we hypothesized that the loss of XRN1 may affect translation rates. To test this we used SUnSET labeling to assess the rates of translation in XRN1-deficient cells. SUnSET labeling involves incubating cells with the tRNA analog puromycin and subsequent blotting with a monoclonal α-puromycin antibody to detect and measure nascent translation. As puromycin is known to inhibit translation, careful optimization of the concentration and time of incubation for each specific cell line is essential. We used 2.5 µg/mL for 60 min in SAOS-2 cells as we observed sufficient labeling while minimizing the chances of saturation, in contrast to 10 µg/mL which demonstrated reduced labeling after 60–90 min, suggesting an inhibitory role on translation (Supplemental Fig. 3). Although successful knockdown was achieved in each sample, we did not observe any difference in the rate of translation between XRN1 knockdown and scrambled siRNA control cells (Fig. 2F). In summary, depletion of XRN1 in SAOS-2 cells does not appear to affect cell growth, viability, migration, or translation. It is possible, however, that XRN1 affects a phenotype we did not specifically test. Another possible reason is that immortalization of SAOS-2 cells has been achieved through a mechanism not dependent upon XRN1, and that subsequent reduction in XRN1 level does not have an additive effect on this mechanism. Alternatively, there could be redundant or compensatory mechanisms within human cells following the loss of XRN1, although this seems unlikely based on observations in other organisms.
RNA-sequencing reveals XRN1-sensitive transcripts in SAOS-2 cells
The results presented above show that although XRN1 is post-transcriptionally depleted in human osteo- and Ewing sarcoma cells and patient samples, its depletion appears to have no effect on the cell behaviors tested within SAOS-2 cells. We therefore adopted a molecular approach in order to identify transcripts that show specific sensitivity to XRN1 expression in SAOS-2 cells. By identifying these transcripts, we aimed to gain insights into the role of XRN1 in osteosarcoma cells.
We performed RNA-sequencing on SAOS-2 cells treated with either siRNAs to XRN1 or a scrambled control, with six biological replicates for each condition; each XRN1 knockdown sample had a minimum XRN1 depletion of 75% (Supplemental Fig. 4A). For our initial analysis we removed adapters and quality trimmed raw RNA-sequencing files using Sickle and Scythe. Next, we used HiSat2 to map reads to the human genome (Ensembl release GRCh38.93). To account for potential expression changes due to conducting the knockdowns over consecutive weeks (one Scrambled and one knockdown sample per week), we assessed gene expression using paired analysis. featureCounts was used to count the number of reads mapping to each gene and paired differential expression analysis was subsequently performed using edgeR. Hierarchical clustering confirmed the paired nature of the samples, justifying our bioinformatic approach (Supplemental Fig. 4B). Our analyses identified 1178 differentially expressed genes (defined as fold change >2 and FDR <0.05), of which 777 genes were up-regulated and 401 genes were down-regulated (Supplemental Fig. 4C). A greater number of up-regulated transcripts is in line with the nature of XRN1 as an exoribonuclease with targets expected to increase in expression in the absence of XRN1.
While the initial analysis revealed a specific set of XRN1-sensitive transcripts, it did not explicitly identify those transcripts that are directly regulated by XRN1. For example, the 777 up-regulated transcripts stabilized following XRN1 depletion may potentially represent direct effects (where transcripts are actively degraded by XRN1), or alternatively they could be transcriptionally up-regulated as indirect consequences of loss of XRN1. We therefore repurposed our analysis pipeline to allow genome-wide assessment of transcriptional (indirect) and post-transcriptional (potentially direct) effects of XRN1 depletion. To achieve this, we created a GTF annotation file containing the coordinates of every intron in the human genome. We then used featureCounts to count the number of exon (or intron) mapping reads in each XRN1 knockdown and control sample to find transcripts that increased post-transcriptionally. This was determined by identifying those with transcripts showing increases in exon-mapping reads but not in intron-mapping reads, indicating increased levels of mature mRNAs. Alternatively, those transcripts with increases in both exon and intron-mapping reads would show increases in pre-mRNA, indicating increased transcription. The resulting count files were processed in a paired manner using edgeR and the same criteria were used to determine differential expression (fold change of >2 and an FDR of <0.05).
Using this approach, we saw high correlation between exon and gene related fold changes (r2 = 0.91, Supplemental Fig. 4D) with 722 transcripts passing the threshold in both samples. When we included the intron level data, we observed a clear differentiation between post-transcriptional and transcriptional expression changes (Fig. 3A–C; Supplemental Fig. 4E). For example, transcriptionally up-regulated transcripts (orange data points in Fig. 3A,B) show increased expression at both the exon (Fig. 3A) and intron (Fig. 3B) levels. In contrast, 134 transcripts show the characteristics of post-transcriptional regulation (which could imply direct regulation by XRN1) where increased expression is observed at the exon level but not the intron level (where the red data points in Fig. 3B are within the gray, unchanged, region). We performed the same analyses on the down-regulated transcripts and again observed examples of transcriptional (blue data points) and post-transcriptional (purple data points) changes in expression. We hypothesize that both transcriptional and post-transcriptional down-regulation represent indirect effects due to XRN1 depletion. The transcripts that show post-transcriptional down-regulation are likely to be themselves regulated by transcripts that are directly regulated by XRN1 such as miRNAs or those encoding RNA binding proteins. These analyses provide the first genome-wide differentiation between post-transcriptional and transcriptional changes in gene expression following XRN1 depletion in human cells, and is summarized in Tables 1–4 and Supplemental File 1.
FIGURE 3.

Overview of RNA-sequencing of XRN1-depleted SAOS-2 cells. (A) Scrambled versus XRN1 knockdown FPKM based demonstrating differentially expressed transcripts using exon counting. Exon FPKM used for direct comparison with intron counting. (Gray) No change, (red) post-transcriptionally up-regulated, (orange) transcriptionally up-regulated, (purple) post-transciptionally down-regulated, (blue) transcriptionally down-regulated, (green) no intron data. (B) Differentially expressed transcripts when counting intron mapping reads allowing differentiation between transcriptional and post-transcriptional changes represented in A. Legend as in A. (C) Volcano plot demonstrating statistical information of all expressed transcripts. Legend as in A. (D) Gene ontology analysis using DAVID and Biological processes level “BPFAT” at highest stringency on all differentially expressed transcripts in XRN1-depleted SAOS-2 cells.
TABLE 1.
Post-transcriptionally up-regulated
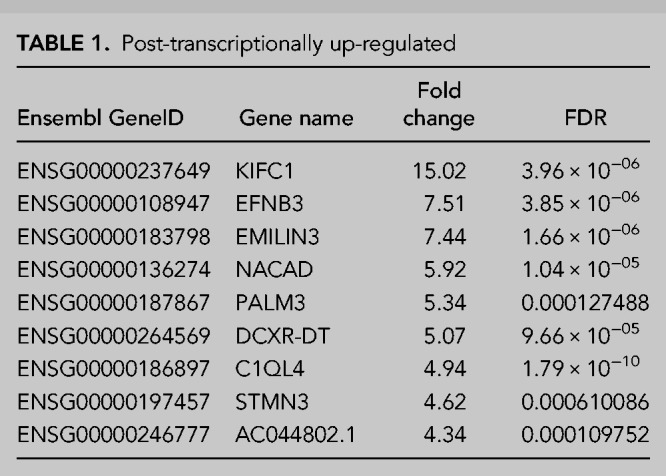
TABLE 2.
Transcriptionally up-regulated
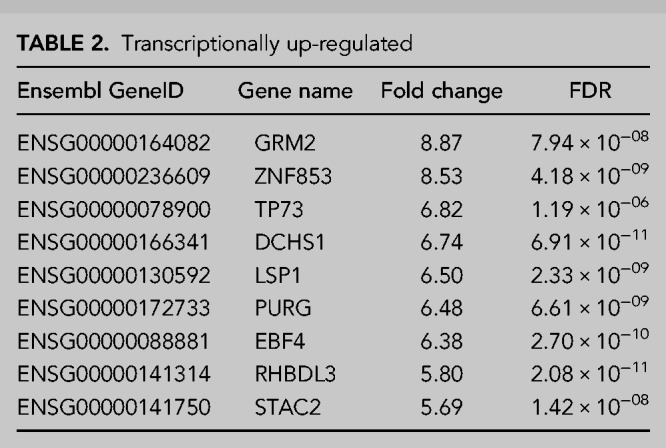
TABLE 3.
Post-transcriptionally down-regulated

TABLE 4.
Transcriptionally down-regulated

To validate our RNA-seq analyses, we next selected 10 transcripts for validation by qRT-PCR which included the three transcripts showing the greatest up-regulation in the transcriptional and post-transcriptional categories, in addition to four transcripts showing a more moderate increase in expression from both up-regulation categories (three post-transcriptional and one transcriptional). This showed widespread agreement between the RNA-seq and qRT-PCR data with only KIFC1 failing to show significant up-regulation suggesting we can have confidence in our RNA-seq data (Fig. 4A).
FIGURE 4.
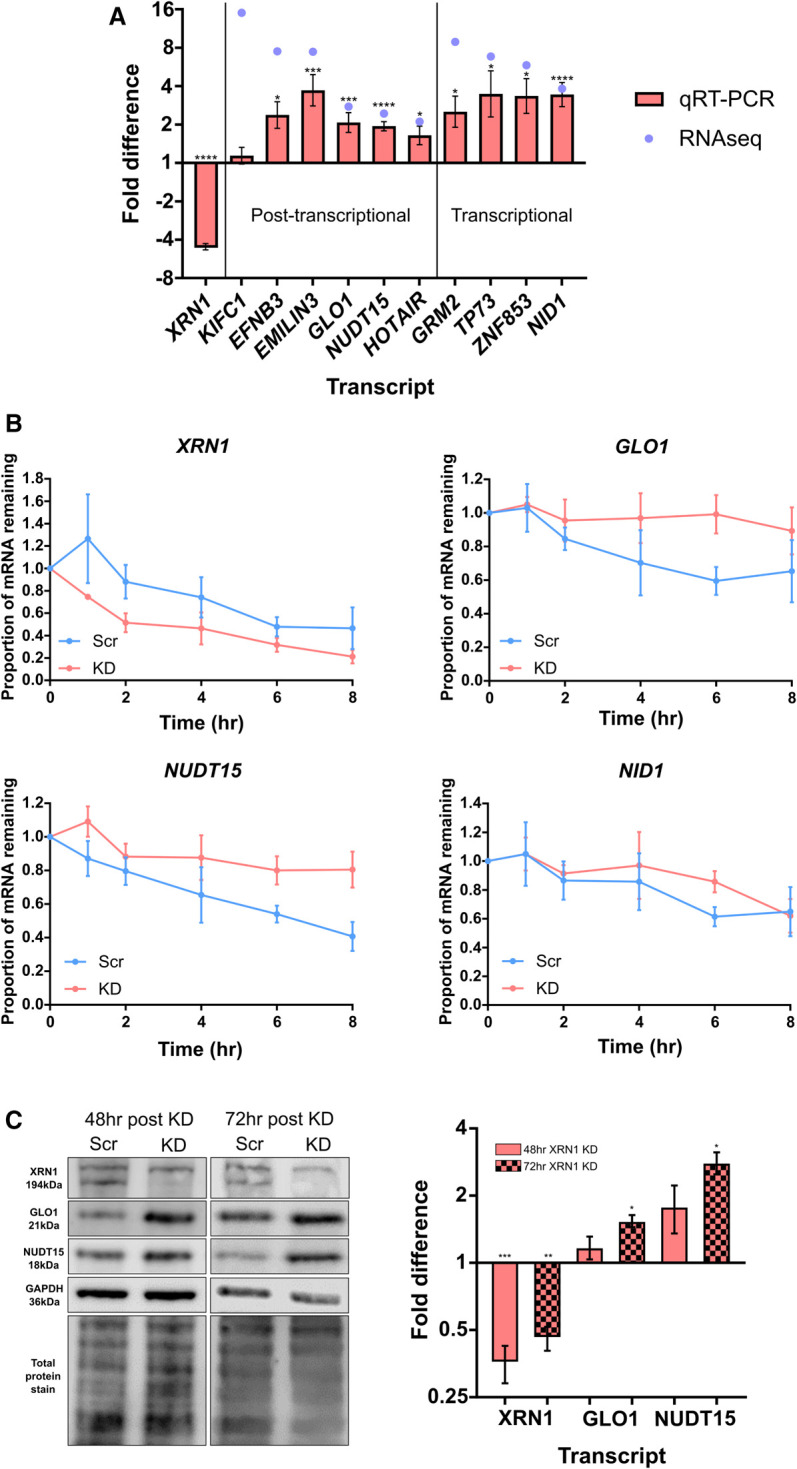
Validation of RNA-seq computational analysis. (A) qRT-PCR validation of 10 up-regulated transcripts in XRN1 knockdown cells demonstrating fold difference compared to the paired scrambled control. Error bars represent SEM, n ≥ 5, (*) P < 0.05, (**) P < 0.01, (***) P < 0.001, (****) P < 0.0001. (B) Decay profiles of selected transcripts following transcriptional inhibition by Actinomycin D (5 µg/mL) validate computational prediction. XRN1 demonstrates destabilization in XRN1 knockdown (KD) cells, GLO1 and NUDT15 demonstrate stabilization in the absence of XRN1, while NID1 shows no change between control (Scr) and knockdown cells. Error bars represent SEM, n ≥ 3. (C) Loss of XRN1 results in an increase in GLO1 and NUDT15 at the protein level 72 h post knockdown. Representative blot with both total protein stain and GAPDH loading control and subsequent quantification and fold difference compared to paired scrambled control. Error bars represent SEM, n ≥ 3, (*) P < 0.05, (**) P < 0.01, (***) P < 0.001.
Next, to assess the accuracy of our computational prediction of the nature of the change in expression we used transcriptional inhibition experiments to estimate the effect of XRN1 depletion on the selected transcript stability. Following transcriptional inhibition using 5 µg/mL Actinomycin D (ActD), we were able to obtain convincing decay profiles of four selected transcripts which all showed the expected trend. For example, GLO1 and NUDT15 which were both predicted to be post-transcriptionally stabilized in the absence of XRN1 do indeed show a reduced rate of decay in our knockdown cells suggesting their degradation is, as predicted, XRN1-sensitive (Fig. 4B). We also demonstrate that the stabilization of both transcripts results in an increase at the protein level 72 h post transfection (Fig. 4C). NID1, a transcript we predicted to be transcriptionally regulated shows no difference between our control and XRN1 depleted cells. Finally, as expected and computationally predicted, XRN1 transcripts show an increased rate of decay due to the presence of the siRNA in our knockdown cells. Unfortunately, due to low level expression of the remaining transcripts previously validated by qRT-PCR we were unable to accurately assess their decay rates. Nevertheless these data suggest that we can have confidence in our computational analysis.
XRN1-sensitive transcripts are involved in distinct biological processes
Having experimentally validated our computational approach we used Gene Ontology (GO) analysis to identify specific biological processes affected following XRN1 depletion. Interestingly, GO analysis of all misregulated transcripts revealed an enrichment of genes involved in cell migration, a crucial hallmark of cancer progression (Fig. 3D). However, we did not observe migration phenotypes in our transwell assay, although this could be due to the nature of the knockdown experiments (discussed further below). Interestingly, we also observe potential roles of XRN1 in epithelial and epidermal development. This is consistent with our previous work in D. melanogaster and C. elegans where we demonstrated that the XRN1 homologs are required for wound healing and epithelial sheet closure (Newbury and Woollard 2004; Grima et al. 2008). Movement of cell layers over other cells is also relevant for this solid cancer. We also observed a strong enrichment of transcripts involved in synaptic transmission suggesting a role for XRN1 in neuronal regulation. This is consistent with data showing that XRN1 forms discrete clusters associated with the post-synapse in hippocampal neurons and its knockdown impairs the translational repression triggered by NMDA (N-methyl-D-aspartate) (Luchelli et al. 2015).
To discriminate between the functional roles of transcripts directly and indirectly regulated by XRN1, we repeated our GO analysis with the specific sets of transcriptionally or post-transcriptionally up- or down-regulated transcripts (Supplemental Fig. 4F). This revealed that transcripts directly regulated by XRN1 have roles in cell morphogenesis and neurogenesis. Further, transcriptionally up-regulated and post-transcriptionally down-regulated genes are involved in a range of processes including epithelial development and cell migration. These analyses also demonstrate that transcriptionally down-regulated genes are involved in cell signaling including the regulation of MAPK signaling.
XRN1-sensitive transcripts demonstrate specific characteristics
Having identified transcriptional and post-transcriptional changes in gene expression following XRN1 knockdown in SAOS-2 cells, we wished to identify specific features or characteristics that may render the transcripts susceptible to XRN1-mediated decay. We first assessed the types of transcripts affected by loss of XRN1. A genome-wide assessment of transcript proportions detected in our samples revealed that 85.5% of detected RNAs were protein coding, 11.3% were lncRNAs, 3.1% were pseudogenes and the final <0.01% were classified as “other” transcripts (Fig. 5A). Interestingly, while our transcriptionally up- and down-regulated groups mirrored the same proportions as the genome-wide samples, ncRNAs appeared to be enriched among the post-transcriptionally up-regulated genes with lncRNAs and pseudogenes representing 17.16% and 6% of the transcripts, respectively (Fig. 5A). While the majority of misregulated transcripts were still protein coding (76.9%) this suggests that XRN1 directly regulates both mRNAs and ncRNAs in SAOS-2 cells. Of note is the post-transcriptional increase in expression of the lncRNA HOTAIR (2.11-fold, FDR < 0.001) which is known to be up-regulated in osteosarcoma cells and to contribute to disease progression (Wang et al. 2015; Li et al. 2017), suggesting a potential mechanistic link between XRN1-targets and osteosarcoma progression. Strikingly, lncRNAs were depleted from the post-transcriptionally down-regulated transcripts (3% of the group). A possible explanation for this is that XRN1 normally targets miRNAs or transcripts encoding RNA binding proteins, which are then expressed at higher levels resulting in lower levels of their own target transcripts (Fig. 5A).
FIGURE 5.

XRN1 also regulates ncRNAs in SAOS-2 cells. (A) Assessment of transcript proportions affected by XRN1 depletion relative to the genome-wide proportions detected in our sequencing data. (B) Scatter plot of changes in expression of all ncRNAs detected in our sequencing data. HOTAIR highlighted in black, (gray) no change, (red) post-transcriptionally up-regulated, (orange) transcriptionally up-regulated, (purple) post-transcriptionally down-regulated, (blue) transcriptionally down-regulated, (green) no intron data. (C–E) Boxplots of (C) expression, (D) GC content, and (E) length (bp) of ncRNAs in our data. Grouped by their nature of change in expression and compared to the genome average as detected in our data set.
Due to the enrichment of ncRNAs within the post-transcriptionally up-regulated data set we next searched for features of these specific ncRNAs that may render them sensitive to XRN1-mediated decay. We first observed that the post-transcriptionally up-regulated ncRNAs are usually expressed at low levels in control SAOS-2 cells (Fig. 5B,C). We hypothesize that these ncRNAs are normally maintained at low levels of expression as a result of XRN1-mediated degradation. Interestingly, the post-transcriptionally regulated ncRNAs have a higher GC content than the genome average (Fig. 5D, gray) or those that are transcriptionally regulated (Fig. 5D orange/blue). We also observed a slight reduction in GC content in those transcripts that are transcriptionally down-regulated (Fig. 5D, blue). It is important to note that there are only seven post-transcriptionally down-regulated ncRNAs (Fig. 5D, purple) and therefore this data must be interpreted with caution. Finally, ncRNAs that are post-transcriptionally regulated have a shorter locus length than the genome average or those that are either up- or down-regulated in a transcriptional manner (Fig. 5E).
Next, we set out to assess if these transcript characteristics were specific to ncRNAs or if they were observed across all the transcripts post-transcriptionally regulated by XRN1. We observed the same pattern in expression levels and GC content that was previously observed for the ncRNAs suggesting XRN1-sensitive transcripts are at low levels of expression in control cells and have a higher GC content than the genome average (discussed below) (Fig. 6A,B). A number of recent studies have shown that XRN1 is able to directly interact with the ribosome and that the level of translation can influence the stability of an mRNA transcript (Hanson et al. 2018; Tesina et al. 2019; Wu et al. 2019). To test if XRN1 targets have specific translational features, we utilized published ribosome profiling data. As ribosome profiling data is not available for SAOS-2 cells, we used published data from an alternative osteosarcoma cell line, U-2 OS (Jang et al. 2015). This revealed that up-regulated transcripts are usually translated in a less efficient manner than the genome average (Fig. 6C).
FIGURE 6.

XRN1-sensitive transcripts show specific transcript characteristics. Boxplots of (A) expression, (B) GC content, (C) translational efficiency, (D) 5′UTR length, (E) coding sequence (CDS) length, and (F) 3′UTR length of all transcripts within our data set. Grouped by their nature of change in expression and compared to the genome average as detected in our data set. Translational efficiency calculated as ribosome protected footprint FPKM/total RNA FPKM for each transcript. (G,H) MEME analysis of 3′UTR of 103 mRNAs reveal (G) 18 GU-rich sites across 10 unique transcripts and (H) 233 G-rich sites across 69 unique transcripts, motifs which may confer XRN1 sensitivity. (I) Similar analysis of 30 ncRNAs post-transcriptionally up-regulated in XRN1-depleted SAOS-2 cells reveals a similar G-rich motif to that observed in H (89 sites across 21 unique transcripts).
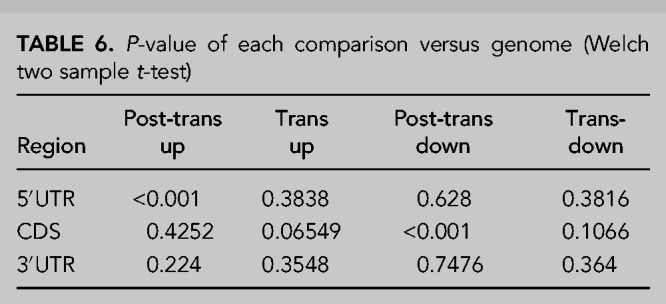
Finally, to specifically assess the features of mRNAs and compare with the previous ncRNA analyses, we assessed the lengths of the major defined regions of an mRNA, the 5′ and 3′ untranslated regions (UTRs) and the coding sequence (CDS). This revealed that direct, post-transcriptional targets of XRN1 have shorter 5′UTRs than the genome average (272.5 bp vs. 401.1 bp, respectively, P < 0.001) while the CDS was marginally longer and the 3′UTR was slightly shorter than the genome average (Fig. 6D–F). Interestingly, the post-transcriptionally down-regulated genes had a shorter CDS than the genome average, a phenomenon unique to this group of transcripts (mean length 1062.0 bp vs. 1600.9 bp, respectively, P < 0.001) (Fig. 6D–F). This suggests that these transcripts may have disproportionately long 3′UTRs, which may render them susceptible to post-transcriptional regulators such as miRNAs and RNA binding proteins. Summary statistics for these analyses are shown in Tables 5, 6.
TABLE 5.
Average size of each mRNA region (bp)
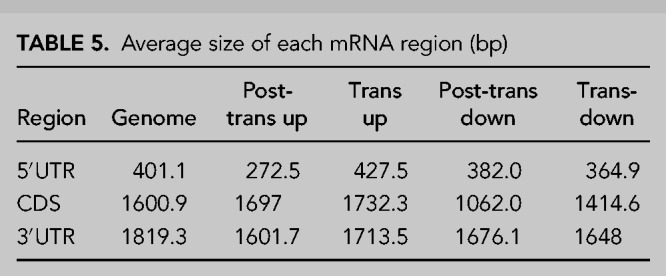
TABLE 6.
P-value of each comparison versus genome (Welch two sample t-test)
Specific motifs may render transcripts susceptible to XRN1-mediated decay
mRNA 3′UTRs are known to control stability through cis-acting elements such as AU-rich elements (AREs). Therefore, we hypothesized that transcripts showing post-transcriptional up-regulation (i.e., direct XRN1 sensitivity) may contain specific sequence motifs that allow for their targeting to XRN1 through interaction with other RNA binding proteins. To this end we used MEME (Bailey et al. 2009) to search the 3′UTR of 103 post-transcriptionally up-regulated mRNAs for enriched motifs that may confer XRN1-sensitivity. This analysis revealed a section of significantly enriched motifs, of which two stood out; a G-rich motif (in 69/103 UTRs [67.0%]) and a second strong GU-rich motif in 10 (9.7%) of the 3′UTRs (Fig. 6G,H). Of the transcripts containing the GU-rich motif, all but one also include the G-rich motif (Supplemental File 2). Interestingly, GU-rich elements have been shown to function similar to AREs in promoting RNA decay so it is possible that GU-rich element binding proteins, such as the BRUNO/CELF family (Vlasova et al. 2008; Halees et al. 2011), may bind and promote 5′–3′ decay by XRN1. The most common motif shows a strong string of guanine residues which fulfill the criteria of forming G-quadruplexes. Recent work has shown that G-quadruplexes within 3′UTRs play important regulatory roles and consistent with the findings here, XRN1 has been shown to degrade transcripts containing G-rich regions (Bashkirov et al. 1997; Chernukhin et al. 2001).
Finally, as we also observed an enrichment of ncRNAs within the post-transcriptionally regulated transcripts, we performed a similar analysis using the whole ncRNA sequence to assess if similar motifs are identified. Analysis of the 30 post-transcriptionally regulated ncRNAs revealed a strikingly similar G-rich motif to that discussed above in 21 of the 30 submitted transcripts (70%) (Fig. 6I). A total of 89 G-rich motifs were identified across these 21 transcripts with six sites within the ncRNA HOTAIR. These analyses suggest that this G-rich motif, which is likely to form G-quadruplex structures, is also able to sensitize specific transcripts to XRN1-mediated degradation in osteosarcoma cells. Although further work is required to address the biological contribution of these motifs to XRN1-mediated decay, these findings suggest a novel mechanism through which transcripts could be targeted for degradation by XRN1.
DISCUSSION
Here we have expanded on previous findings using cell lines and patient samples to show that XRN1 expression is reduced in osteosarcoma cells as well as in the cells of the related Ewing sarcoma. Using RNA-sequencing of XRN1 depleted SAOS-2 cells we performed a detailed genome-wide assessment of gene expression. We differentiated between transcriptional and post-transcriptional changes in expression and present a list of 134 transcripts that demonstrate post-transcriptional regulation and are therefore potential direct targets of XRN1. Gene ontology analysis of differentially expressed transcripts revealed strong enrichment of transcripts associated with cell migration; a critical process required for cancer progression. This result is consistent with our previous findings in D. melanogaster and C. elegans, where depletion of Pacman or Xrn-1 result in defects in cell migration during embryonic dorsal closure and ventral enclosure, respectively (Newbury and Woollard 2004; Grima et al. 2008). Transcripts directly regulated by XRN1 also appear to have roles in neurogenesis and neuron projection. Interestingly, proteins known to bind GU-rich regions, as identified in the MEME analysis have also been shown to be important regulators of neuronal gene regulation (Gallo and Spickett 2010; Dasgupta and Ladd 2012), and XRN1 activity may be important in the neurodegenerative disorder intranuclear inclusion body disease (Mori et al. 2018). XRN1 has also previously been shown to be localized in XRN1-positive bodies at the post-synapse in neurones where it contributes to local translational silencing elicited by NMDA (Luchelli et al. 2015).
Although RNA-sequencing revealed a number of transcripts that become misexpressed following loss of XRN1 in SAOS-2 cells, we observed no additional phenotypic defects within these cells. This is in contrast to XRN1 knockout HEK-293T cells which showed a twofold reduction in growth (Gilbertson et al. 2018). Although our RNA-sequencing experiments revealed differential expression of transcripts involved in regulating cell migration; migration rates over 30 h were no different between XRN1-depleted and control cells. This could, however, be due to technical issues including the specific migration assay used or the use of RNA interference to deplete XRN1. While we achieved a strong and consistent knockdown of ∼80%, the 20% remaining may have sufficient residual activity to maintain cellular homeostasis. It is also possible that the changes in expression observed here were not sufficient in magnitude to elicit a phenotypic change. Another possible explanation would be the redundancy between the cytoplasmic ribonucleases within the cell. Although the specific phenotypes observed in ribonuclease-deficient model organisms show that specific targeting and sensitivity does exist (Jones et al. 2013, 2016; Towler et al. 2015, 2016, 2020; Waldron et al. 2015), it is well known that transcripts can be degraded by multiple ribonucleases as for example, XRN1 and DIS3L2 have been shown to coprecipitate in an RNA dependent manner (Lubas et al. 2013). It is therefore plausible that the remaining XRN1, in addition to redundancy with DIS3L2 and the exosome provides sufficient activity to prevent severe, observable phenotypes in our model.
The lack of phenotype is intriguing given that deletion of the XRN1 homolog in D. melanogaster, Pacman, has severe phenotypic effects resulting in widespread apoptosis, reduction in tissue growth and male fertility, developmental delay and subsequent pupal lethality (Zabolotskaya et al. 2008; Jones et al. 2013, 2016; Waldron et al. 2015). The extensive conservation of XRN1 throughout eukaryotes suggests it has a critical function in maintaining homeostasis, however it is possible that in immortalized cell lines the role is less important. Another possibility is that SAOS-2 cells carry mutations that affect pathways redundant with XRN1 and therefore depletion of XRN1 may not present phenotypic effects. It is also conceivable that XRN1 in humans has a critical developmental role, as observed by the developmental phenotypes in D. melanogaster and C. elegans but these functions are specifically required in normal, multicellular tissues, rather than individual immortalized cells grown in culture.
We have identified specific sets of transcripts that are sensitive to XRN1 activity, including those directly regulated and those that are indirectly affected. We show that XRN1 is crucial for the direct regulation of both coding and noncoding RNAs, including the oncogenic lncRNA HOTAIR. Increased expression of HOTAIR has been shown to promote proliferation and metastasis of a variety of cancers (Özes¸ et al. 2016; Sharma Saha et al. 2016; Deng et al. 2017; Sun et al. 2017) and crucially has been frequently implicated in the progression of osteosarcoma (Wang et al. 2015, Li et al. 2017). Within these transcripts we identified specific motifs enriched in transcripts post-transcriptionally up-regulated following XRN1 depletion, including a striking G-rich motif which is present in both mRNAs and ncRNAs directly regulated by XRN1. Recent work has shown that G-rich regions, that are capable of forming G-quadruplex structures, are crucial regulators of gene expression (Huppert et al. 2008). XRN1 shows increased efficiency of degrading transcripts containing G-rich regions (Bashkirov et al. 1997; Chernukhin et al. 2001), and therefore it is possible that stretches of Guanine residues sensitize transcripts to XRN1-mediated decay, for example, through the binding of particular RNA-binding proteins to GU-rich regions, such as members of the CELF family, which in turn promote their decay via XRN1. Our results are also consistent with a previous study using HeLa and HCT116 cells, where transcripts with higher GC content are more sensitive to enzymes in the 5′–3′ degradation pathway such as DDX6 and XRN1 (Courel et al. 2019). The presence of this motif may also explain the increase in GC content in transcripts that show post-transcriptional up-regulation. The ability of XRN1 to degrade G-rich RNAs is likely to be crucial as work on the cytoplasmic 3′–5′ ribonuclease Dis3L2 in D. melanogaster has revealed that Dis3L2 shows reduced efficiency for Guanine nucleotides and an absence of G-rich motifs within Dis3L2 targets (Reimão-Pinto et al. 2016; Towler et al. 2020). These transcripts may therefore normally depend on XRN1 for their degradation. It is important to note that these interesting observations require further work to characterize the biological relevance of our predictions and understand the molecular basis of these motifs in XRN1 mediated decay.
The data presented here also showed that XRN1 targets are normally maintained at low levels of expression and are likely to be rapidly turned over, similar to signatures of a number of oncogenes. Recent work in mouse embryonic stem cells has shown that XRN1 is directly recruited to the ribosome to remove transcripts that show reduced or stalled translation (Tuck et al. 2020). This is congruent with our findings that direct targets of XRN1 show reduced translational efficiency. It is possible that in the absence of XRN1, stalled/slowly translating ribosomes remain in contact with the RNA, increasing the chance of translational errors, which in turn could have detrimental effects upon the cell. Finally, XRN1-sensitive transcripts also tended to be shorter that the genome average, with shorter 5′UTRs. 5′UTRs are generally highly structured; therefore a shorter 5′UTR may result in a reduction of structure that would facilitate XRN1 activity. We also observe an array of indirect transcriptional changes in expression in XRN1-depleted SAOS-2 cells. This could be explained by recent work demonstrating that changes in expression or activity of XRN1 results in relocation of a number of RNA binding proteins. This includes other members of the decay machinery, which affect the mRNA-decay-RNA polymerase II transcriptional feedback loop (Abernathy et al. 2015; Gilbertson et al. 2018). Since an increase in XRN1 activity results in the relocation of a number of RNA binding proteins to the nucleus, it is possible that depletion of XRN1 causes these proteins to remain in the cytoplasm, contributing to the post-transcriptional down-regulation of transcripts that we also observed here.
Taken together, the analyses presented in this study identify a number of features in coding and noncoding RNAs that may sensitize transcripts to XRN1-mediated decay. We present a group of high confidence direct targets of XRN1 in addition to a large group of transcripts that show indirect sensitivity to the ribonuclease. In the future, it would be of great interest to further validate the direct interaction between XRN1 and the targets predicted here in addition to the identified motifs and features of these RNAs and begin to build a mechanism to explain the specificity of XRN1 targeting. This will shed light on the reasons for the selective down-regulation of XRN1 in osteo- and Ewing sarcoma cells.
MATERIALS AND METHODS
Cell culture
Osteosarcoma cell lines, HOS, SAOS-2, and U-2 OS (ECACC), were cultured in DMEM-F12 (Gibco #21331-020) medium supplemented with 10% FBS (PAN-Biotech #P40-37100), 2 mM l-Gln (Gibco #25030-024) and 100 IU/mL penicillin, 100 µg streptomycin (Gibco #15140-122). Cells were cultured at 37°C in a humidified incubator at 5% CO2. The fetal osteoblast cell line HOb (hFOB 1.19) (ECACC) was cultured in the same conditions. Ewing sarcoma cell line, SK-ES-1 was cultured in McCoy's 5A (Modified) medium (Gibco #26600-080) supplemented with 10% FBS, 2 mM l-Gln and 100 IU/mL penicillin, 100 µg streptomycin. RD-ES was cultured in RPMI 1640 medium (Gibco #12633-020) supplemented in the same way. These Ewing sarcoma cell lines were provided by Professor Sue Burchill, University of Leeds. Both were incubated at 37°C in a 5% CO2 humidified incubator.
Patient samples
Samples were released by the Children's Cancer and Leukaemia Group (CCLG) and sample details are outlined in Supplemental Table 1. Samples 11/650, 12/299, and 16/755 displayed large necrosis of the sample, and so were not included in the analysis. Details of sample 16/591 were not disclosed.
Western blotting
Western blots were performed on pellets of 1 × 10⁶ cells. Samples were run on either 7% Tris-acetate or 4%–12% Bis-Tris Novex gradient gels. GAPDH or Revert Total Protein Stain (LI-COR #926-11010) were used as loading controls which showed excellent correlation (Supplemental Fig. 5). Blots were blocked in either 5% milk in 0.1% PBS-Tween or Odyssey Blocking Buffer (LI-COR #927-40000). Primary antibodies used were Mouse anti-GAPDH (1:10,000, Abcam #ab8245), Rabbit anti-XRN1 (1:2000, Bethyl Labs #A300-443A), Mouse anti-GLO1 (1:1000, Invitrogen #MA1-13029X), and Rabbit anti-NUDT15 (1:1000, Novus Biologicals #NBP2-93605). Anti-mouse and anti-rabbit fluorescent antibodies were used at 1:20,000 (LICOR Donkey anti-mouse IR Dye 800CW and Goat anti-rabbit IRDye 680RD). Detection and quantification were performed using the LI-COR Odyssey Fc Imager and Image Studio (version 5.2).
qRT-PCR analysis
Total RNA was isolated from cell pellets and patient samples using a miRNeasy Mini Kit (Qiagen #217084) with on-column DNase digestion (Qiagen #79254). RNA concentrations were measured on a NanoDrop One spectrophotometer. Total RNA was converted to cDNA in duplicate using the High Capacity Reverse Transcription Kit (Applied Biosystems #4368814) and 500 ng of RNA (according to manufacturer's instructions) with random primers. A control “no RT” reaction was performed in parallel to confirm that all genomic DNA had been degraded. qRT-PCRs were carried out on each cDNA replicate in duplicate (for a total of four technical replicates) using TaqMan Universal PCR Master Mix, No AmpErase UNG (Applied Biosystems #4324018) and TaqMan specific assays on a ViiA 7 or QuantStudio 7 machine. For the production of the custom pre-XRN1 assay, the pre-mRNA sequence was submitted to Life Technologies’ web-based custom TaqMan Assay Design Tool as in Jones et al. (2013) and resulted in an assay that binds across the boundary between intron 12 and exon 13. Details of all custom and commercially available TaqMan assays used in this study can be found in Supplemental File 3.
RNAi-mediated factor depletion
For siRNA transfections, 3 × 10⁵ SAOS-2 cells were seeded in a six-well plate (34.8 mm diameter). Transfections were carried out using Lipofectamine RNAiMAX reagent (Invitrogen #13778100) according to manufacturer's instructions using Opti-MEM medium (Gibco #31985070) and DMEM-F12 medium without antibiotic. For each transfection, 20 pmol of either siXRN1 (targeting exon 11, Invitrogen #125199) or siScrambled (Invitrogen #AM4611) were added for depletion of XRN1. For control cells, 20 pmol scrambled siRNA was added. siRNA was removed after 24 h and replaced with fresh media.
Phenotyping assays
Apoptosis assays were performed using Caspase-Glo 3/7 reagent according to manufacturer's instructions (Promega #0000239042). Cell viability assays were performed using WST-1 cell viability reagent according to manufacturer's instructions (Sigma #18993700). In both assays, 2 × 10⁴ cells were plated in black-walled 96-well plates overnight. XRN1 was knocked down using 5 pmols siRNA in full medium and incubated for 24 h. The reagent was then applied and luminescence (Caspase-Glow 3/7) or absorbance (WST-1) was measured on a plate reader. SUnSET labeling was performed using 2.5 µg/mL puromycin (Merck #540411) incorporated into 4 × 10⁵ cells in six-well plates where XRN1 had been knocked down for 24 h. Puromycin was added for 1 h before cells were harvested and western blotting performed with GAPDH as a loading control, using an anti-puromycin antibody (Merck #MABE343). Puromycin incorporation was measured using Image Studio (version 5.2). Cell proliferation was determined by measuring Brd-U incorporation during DNA synthesis. Briefly, 10 µM BrdU (Sigma #B5002-100MG) was added to 5 × 10⁴ cells in a 24-well plate 24 h post transfection with either siXRN1 or siScrambled (10 pmols) for 6 h. Cells were subsequently fixed in 4% paraformaldehyde and permeabilized for 45 min in 0.3% Triton X-100 in PBS (PBTX). Following permeabilization, cells were incubated for 30 min in 4 M HCl followed by a 10 min incubation in 0.1 M sodium borate. Following washes in PBTX, cells were incubated in αBrdU diluted 1:20 in PBTX (Developmental Studies Hybridoma Bank G3G4). Cells were washed in PBTX before incubation in α-Mouse-Cy3 1:350 (Jackson ImmunoResearch #715-165-150). Cells were then washed in PBTX and mounted in Vectorshield containing DAPI (Vector Laboratories #H-1200). The ImageJ Dead_Easy Mitoglia Plug-In was used to measure the proportion of cells undergoing active DNA synthesis with the total number of cells counted using DAPI staining. Migration assays were performed using a transwell assay (Thermo Fisher). Cells were added to the insert 48 h post transfection and left to migrate for the desired time. Cells were then fixed for 10 min in 4% PFA, washed twice in PBS, permeabilized in 100% methanol for 20 min and then washed twice in PBS. Cells were then incubated in 0.1% Trypan blue for 15 min to allow for visualization. Following two final PBS washes, the migrated cells were visualized under a light microscope and the number of cells were counted using ImageJ.
RNA-seq sample preparation and RNA library preparation
RNA was extracted from cell pellets, six replicates from siScrambled or siXRN1 treated cells were collected for sequencing over consecutive weeks. Total RNA was extracted using miRNEasy Micro Kit (Qiagen #217084) with on-column DNase digestion (Qiagen #79254). Total RNA concentration and quality were measured on a NanoDrop One, RNA integrity was assessed on an Agilent 2100 Bioanalyzer. RNA concentration was further assessed on a Qubit (Invitrogen #Q32852). An amount of 500 ng of total RNA was depleted for rRNA by Leeds Genomics using the Ribo-Zero Kit. Library preparation was also performed by Leeds Genomics using the Illumina TruSeq standard protocol. Subsequent libraries were run in a 75 bp single-end sequencing run on a Next Seq generating between 36 and 45 million reads per sample. Raw sequencing reads are deposited in ArrayExpress under accession number E-MTAB-10808.
Bioinformatic analysis of RNA-seq data
Sequence quality was assessed using FastQc c0.11.7 (http://www.bioinformatics.babraham.ac.uk/projects/fastqc/) and adapters were removed using Scythe v0.993b (https://github.com/vsbuffalo/scythe). Further quality control and read trimming was achieved using Sickle v1.29 (https://github.com/najoshi/sickle). The remaining high-quality reads were mapped to the human genome GRCh38.93 from Ensembl using HiSat2 v2.01.0 (Kim et al. 2015), and SAM files were sorted and converted to BAM using SAMtools (Li et al. 2009). Paired analysis of control and knockdown cells was achieved using featureCounts (Liao et al. 2014) and edgeR (Robinson et al. 2010). Mapped reads were counted using featureCounts using GrCh38.93.gtf from Ensembl. Reads were counted at either the Gene, Exon or Intron level. For Intron data a novel .gtf file was computed from the exon boundaries within the original GRCh38.93.gtf. Only genes with a sum of 60 reads across the 12 biological replicates were retained for further analysis. Raw counts were used as an input for normalization, quantification, and differential expression analysis in edgeR. Transcripts were further filtered within edgeR and only those expressed in >10 samples were retained. Counts were then normalized, and differential expression was assessed in a pairwise manner using the quasi-likelihood F-test where siXRN1 replicate 1 was compared to siScr replicate 1 and so on. Differentially expressed genes were initially determined as those showing a fold change of greater than twofold and an FDR of <0.05. The same procedure was used for Exon and Intron level assessment, although intron reads were not filtered as this may have removed post-transcriptional changes. Post-transcriptional changes were determined as exon level changes of greater than twofold and an FDR < 0.05 and intron level changes of less than twofold or an FDR > 0.05. The genes that showed changes at the exon and intron levels of greater than twofold and an FDR < 0.05 were classified as transcriptional changes.
Data used that was not produced in this study
Translational efficiency data from U-2 OS cells were obtained from Jang et al. (2015) where an average of all recorded time points was used. GC content and locus length were obtained from Ensembl using the BioMart tool.
Transcriptional inhibition experiments
Cells were plated and transfected as previously with XRN1 or Scrambled control siRNA and incubated for 48 h. Forty-eight hours post transfection, 5 µg/mL Actinomycin D (Sigma #A9415-2MG) was added and incubated for the demonstrated times. Cells were harvested by direct lysis in QIAzol and subsequent RNA extraction, reverse transcription and qRT-PCR were performed as previously described. In our hands, GAPDH was not stable enough to act as a housekeeper and therefore 18S rRNA was used for data normalization.
Gene Ontology and motif analysis
Functional annotation clustering of the differentially expressed genes was carried out using DAVID (Huang da et al. 2009a,b). Only the significantly enriched GO terms from the biological process category (BPFAT, using highest stringency and an enrichment score >1.3) were included in further analysis. 3′UTR and ncRNA motif analysis was conducted using the Meme Suite (Bailey et al. 2009).
Statistical tests
All statistical analyses were performed in GraphPad Prism 8 or R (version 3.6.3). Unpaired Student t-tests were used to compare the means of single test groups to single control groups. Paired analysis with the quasi-likelihood F-test was used to determine differential gene expression using edgeR as outlined above. Welch's two sample t-tests were used to determine significant changes in transcript features.
SUPPLEMENTAL MATERIAL
Supplemental material is available for this article.
Supplementary Material
ACKNOWLEDGMENTS
The authors wish to thank Helen Stewart, Peter Bush, Sophie Robinson, Lisa Mullen, and Stefano Caserta for helpful discussions. We would also like to thank Clare Rizzo-Singh for technical help and Sue Burchill (University of Leeds) for providing the Ewing sarcoma cell lines. Osteosarcoma samples were provided by the Children's Cancer and Leukaemia Group (CCLG). This work was funded by a University of Brighton studentship (WC003-30) to A.L.P., a University of Brighton “Rising Stars Initiative” grant to C.I.J. and S.F.N. (WB002-34), and a Sussex Research Development grant to S.F.N. and C.I.J. (WC001-08). B.P.T. was financed by a Biotechnology and Biological Sciences Research Council grant (BB/P021042/1) to S.F.N.
Author contributions: A.L.P designed and performed most of the experiments and analyzed some of the data. C.I.J. supervised and carried out the initial work, advised on the bioinformatics experiments, and commented on the manuscript. H.J.H. performed the RNA-seq validation experiments. T.B. performed and analyzed the experiments on Ewing sarcoma cells. B.P.T. contributed to experimental design, analyzed and interpreted the RNA-seq data, prepared the figures, and wrote the majority of the manuscript. S.F.N. coordinated the study, contributed to the design and interpretation of the experiments, and contributed to the writing of the manuscript.
Footnotes
Article is online at http://www.rnajournal.org/cgi/doi/10.1261/rna.078872.121.
Freely available online through the RNA Open Access option.
REFERENCES
- Abernathy E, Gilbertson S, Alla R, Glaunsinger B. 2015. Viral nucleases induce an mRNA degradation-transcription feedback loop in mammalian cells. Cell Host Microbe 18: 243–253. 10.1016/j.chom.2015.06.019 [DOI] [PMC free article] [PubMed] [Google Scholar]
- Astuti D, Morris MR, Cooper WN, Staals RH, Wake NC, Fews GA, Gill H, Gentle D, Shuib S, Ricketts CJ, et al. 2012. Germline mutations in DIS3L2 cause the Perlman syndrome of overgrowth and Wilms tumor susceptibility. Nat Genet 44: 277–284. 10.1038/ng.1071 [DOI] [PubMed] [Google Scholar]
- Bailey TL, Boden M, Buske FA, Frith M, Grant CE, Clementi L, Ren J, Li WW, Noble WS. 2009. MEME SUITE: tools for motif discovery and searching. Nucleic Acids Res 37: W202–W208. 10.1093/nar/gkp335 [DOI] [PMC free article] [PubMed] [Google Scholar]
- Bashkirov VI, Scherthan H, Solinger JA, Buerstedde JM, Heyer WD. 1997. A mouse cytoplasmic exoribonuclease (mXRN1p) with preference for G4 tetraplex substrates. J Cell Biol 136: 761–773. [DOI] [PMC free article] [PubMed] [Google Scholar]
- Blasco-Moreno B, de Campos-Mata L, Böttcher R, García-Martínez J, Jungfleisch J, Nedialkova DD, Chattopadhyay S, Gas ME, Oliva B, Pérez-Ortín JE, et al. 2019. The exonuclease Xrn1 activates transcription and translation of mRNAs encoding membrane proteins. Nat Commun 10: 1298. 10.1038/s41467-019-09199-6 [DOI] [PMC free article] [PubMed] [Google Scholar]
- Boehm V, Gerbracht JV, Marx MC, Gehring NH. 2016. Interrogating the degradation pathways of unstable mRNAs with XRN1-resistant sequences. Nat Commun 7: 13691. 10.1038/ncomms13691 [DOI] [PMC free article] [PubMed] [Google Scholar]
- Braun JE, Truffault V, Boland A, Huntzinger E, Chang CT, Haas G, Weichenrieder O, Coles M, Izaurralde E. 2012. A direct interaction between DCP1 and XRN1 couples mRNA decapping to 5′ exonucleolytic degradation. Nat Struct Mol Biol 19: 1324–1331. 10.1038/nsmb.2413 [DOI] [PubMed] [Google Scholar]
- Chapman EG, Moon SL, Wilusz J, Kieft JS. 2014. RNA structures that resist degradation by Xrn1 produce a pathogenic Dengue virus RNA. Elife 3: e01892. 10.7554/eLife.01892 [DOI] [PMC free article] [PubMed] [Google Scholar]
- Chernukhin IV, Seago JE, Newbury SF. 2001. Drosophila 5′→3′-exoribonuclease Pacman. Methods Enzymol 342: 293–302. 10.1016/S0076-6879(01)42553-5 [DOI] [PubMed] [Google Scholar]
- Colombani J, Andersen DS, Léopold P. 2012. Secreted peptide Dilp8 coordinates Drosophila tissue growth with developmental timing. Science 336: 582–585. 10.1126/science.1216689 [DOI] [PubMed] [Google Scholar]
- Courel M, Clément Y, Bossevain C, Foretek D, Vidal Cruchez O, Yi Z, Bénard M, Benassy MN, Kress M, Vindry C, et al. 2019. GC content shapes mRNA storage and decay in human cells. Elife 8: e49708. 10.7554/eLife.49708 [DOI] [PMC free article] [PubMed] [Google Scholar]
- Dasgupta T, Ladd AN. 2012. The importance of CELF control: molecular and biological roles of the CUG-BP, Elav-like family of RNA-binding proteins. Wiley Interdiscip Rev RNA 3: 104–121. 10.1002/wrna.107 [DOI] [PMC free article] [PubMed] [Google Scholar]
- Deng J, Yang M, Jiang R, An N, Wang X, Liu B. 2017. Long non-coding RNA HOTAIR regulates the proliferation, self-renewal capacity, tumor formation and migration of the cancer stem-like cell (CSC) subpopulation enriched from breast cancer cells. PLoS One 12: e0170860. 10.1371/journal.pone.0170860 [DOI] [PMC free article] [PubMed] [Google Scholar] [Retracted]
- Gallo JM, Spickett C. 2010. The role of CELF proteins in neurological disorders. RNA Biol 7: 474–479. 10.4161/rna.7.4.12345 [DOI] [PMC free article] [PubMed] [Google Scholar]
- Gilbertson S, Federspiel JD, Hartenian E, Cristea IM, Glaunsinger B. 2018. Changes in mRNA abundance drive shuttling of RNA binding proteins, linking cytoplasmic RNA degradation to transcription. Elife 7: e37663. 10.7554/eLife.37663 [DOI] [PMC free article] [PubMed] [Google Scholar]
- Grima DP, Sullivan M, Zabolotskaya MV, Browne C, Seago J, Wan KC, Okada Y, Newbury SF. 2008. The 5′–3′ exoribonuclease pacman is required for epithelial sheet sealing in Drosophila and genetically interacts with the phosphatase puckered. Biol Cell 100: 687–701. 10.1042/BC20080049 [DOI] [PubMed] [Google Scholar]
- Halees AS, Hitti E, Al-Saif M, Mahmoud L, Vlasova-St Louis IA, Beisang DJ, Bohjanen PR, Khabar K. 2011. Global assessment of GU-rich regulatory content and function in the human transcriptome. RNA Biol 8: 681–691. 10.4161/rna.8.4.16283 [DOI] [PMC free article] [PubMed] [Google Scholar]
- Hanahan D, Weinberg RA. 2011. Hallmarks of cancer: the next generation. Cell 144: 646–674. 10.1016/j.cell.2011.02.013 [DOI] [PubMed] [Google Scholar]
- Hanson G, Alhusaini N, Morris N, Sweet T, Coller J. 2018. Translation elongation and mRNA stability are coupled through the ribosomal A-site. RNA 24: 1377–1389. 10.1261/rna.066787.118 [DOI] [PMC free article] [PubMed] [Google Scholar]
- Huang da W, Sherman BT, Lempicki RA. 2009a. Bioinformatics enrichment tools: paths toward the comprehensive functional analysis of large gene lists. Nucleic Acids Res 37: 1–13. 10.1093/nar/gkn923 [DOI] [PMC free article] [PubMed] [Google Scholar]
- Huang da W, Sherman BT, Lempicki RA. 2009b. Systematic and integrative analysis of large gene lists using DAVID bioinformatics resources. Nat Protoc 4: 44–57. 10.1038/nprot.2008.211 [DOI] [PubMed] [Google Scholar]
- Huppert JL, Bugaut A, Kumari S, Balasubramanian S. 2008. G-quadruplexes: the beginning and end of UTRs. Nucleic Acids Res 36: 6260–6268. 10.1093/nar/gkn511 [DOI] [PMC free article] [PubMed] [Google Scholar]
- Jang C, Lahens NF, Hogenesch JB, Sehgal A. 2015. Ribosome profiling reveals an important role for translational control in circadian gene expression. Genome Res 25: 1836–1847. 10.1101/gr.191296.115 [DOI] [PMC free article] [PubMed] [Google Scholar]
- Jones CI, Zabolotskaya MV, Newbury SF. 2012. The 5′→3′ exoribonuclease XRN1/Pacman and its functions in cellular processes and development. Wiley Interdiscip Rev RNA 3: 455–468. 10.1002/wrna.1109 [DOI] [PubMed] [Google Scholar]
- Jones CI, Grima DP, Waldron JA, Jones S, Parker HN, Newbury SF. 2013. The 5′–3′ exoribonuclease Pacman (Xrn1) regulates expression of the heat shock protein Hsp67Bc and the microRNA miR-277-3p in Drosophila wing imaginal discs. RNA Biol 10: 1345–1355. 10.4161/rna.25354 [DOI] [PMC free article] [PubMed] [Google Scholar]
- Jones CI, Pashler AL, Towler BP, Robinson SR, Newbury SF. 2016. RNA-seq reveals post-transcriptional regulation of Drosophila insulin-like peptide dilp8 and the neuropeptide-like precursor Nplp2 by the exoribonuclease Pacman/XRN1. Nucleic Acids Res 44: 267–280. 10.1093/nar/gkv1336 [DOI] [PMC free article] [PubMed] [Google Scholar]
- Kim D, Langmead B, Salzberg SL. 2015. HISAT: a fast spliced aligner with low memory requirements. Nat Methods 12: 357–360. 10.1038/nmeth.3317 [DOI] [PMC free article] [PubMed] [Google Scholar]
- Li H, Handsaker B, Wysoker A, Fennell T, Ruan J, Homer N, Marth G, Abecasis G, Durbin R. 2009. The Sequence Alignment/Map format and SAMtools. Bioinformatics 25: 2078–2079. 10.1093/bioinformatics/btp352 [DOI] [PMC free article] [PubMed] [Google Scholar]
- Li E, Zhao Z, Ma B, Zhang J. 2017. Long noncoding RNA HOTAIR promotes the proliferation and metastasis of osteosarcoma cells through the AKT/mTOR signaling pathway. Exp Ther Med 14: 5321–5328. 10.3892/etm.2017.5248 [DOI] [PMC free article] [PubMed] [Google Scholar]
- Liao Y, Smyth GK, Shi W. 2014. featureCounts: an efficient general purpose program for assigning sequence reads to genomic features. Bioinformatics 30: 923–930. 10.1093/bioinformatics/btt656 [DOI] [PubMed] [Google Scholar]
- Lubas M, Damgaard CK, Tomecki R, Cysewski D, Jensen TH, Dziembowski A. 2013. Exonuclease hDIS3L2 specifies an exosome-independent 3′–5′ degradation pathway of human cytoplasmic mRNA. EMBO J 32: 1855–1868. 10.1038/emboj.2013.135 [DOI] [PMC free article] [PubMed] [Google Scholar]
- Luchelli L, Thomas MG, Boccaccio GL. 2015. Synaptic control of mRNA translation by reversible assembly of XRN1 bodies. J Cell Sci 128: 1542–1554. 10.1242/jcs.163295 [DOI] [PubMed] [Google Scholar]
- Moon SL, Anderson JR, Kumagai Y, Wilusz CJ, Akira S, Khromykh AA, Wilusz J. 2012. A noncoding RNA produced by arthropod-borne flaviviruses inhibits the cellular exoribonuclease XRN1 and alters host mRNA stability. RNA 18: 2029–2040. 10.1261/rna.034330.112 [DOI] [PMC free article] [PubMed] [Google Scholar]
- Moon SL, Dodd BJ, Brackney DE, Wilusz CJ, Ebel GD, Wilusz J. 2015. Flavivirus sfRNA suppresses antiviral RNA interference in cultured cells and mosquitoes and directly interacts with the RNAi machinery. Virology 485: 322–329. 10.1016/j.virol.2015.08.009 [DOI] [PMC free article] [PubMed] [Google Scholar]
- Mori F, Tanji K, Miki Y, Toyoshima Y, Sasaki H, Yoshida M, Kakita A, Takahashi H, Wakabayashi K. 2018. Immunohistochemical localization of exoribonucleases (DIS3L2 and XRN1) in intranuclear inclusion body disease. Neurosci Lett 662: 389–394. 10.1016/j.neulet.2017.10.061 [DOI] [PubMed] [Google Scholar]
- Nagarajan VK, Kukulich PM, von Hagel B, Green PJ. 2019. RNA degradomes reveal substrates and importance for dark and nitrogen stress responses of Arabidopsis XRN4. Nucleic Acids Res 47: 9216–9230. 10.1093/nar/gkz712 [DOI] [PMC free article] [PubMed] [Google Scholar]
- Newbury S, Woollard A. 2004. The 5′–3′ exoribonuclease xrn-1 is essential for ventral epithelial enclosure during C. elegans embryogenesis. RNA 10: 59–65. 10.1261/rna.2195504 [DOI] [PMC free article] [PubMed] [Google Scholar]
- Özes¸ AR, Miller DF, Özes¸ ON, Fang F, Liu Y, Matei D, Huang T, Nephew KP. 2016. NF-κB-HOTAIR axis links DNA damage response, chemoresistance and cellular senescence in ovarian cancer. Oncogene 35: 5350–5361. 10.1038/onc.2016.75 [DOI] [PMC free article] [PubMed] [Google Scholar]
- Pashler AL, Towler BP, Jones CI, Newbury SF. 2016. The roles of the exoribonucleases DIS3L2 and XRN1 in human disease. Biochem Soc Trans 44: 1377–1384. 10.1042/BST20160107 [DOI] [PubMed] [Google Scholar]
- Reimão-Pinto MM, Manzenreither RA, Burkard TR, Sledz P, Jinek M, Mechtler K, Ameres SL. 2016. Molecular basis for cytoplasmic RNA surveillance by uridylation-triggered decay in Drosophila. EMBO J 35: 2417–2434. 10.15252/embj.201695164 [DOI] [PMC free article] [PubMed] [Google Scholar]
- Robinson MD, McCarthy DJ, Smyth GK. 2010. edgeR: a Bioconductor package for differential expression analysis of digital gene expression data. Bioinformatics 26: 139–140. 10.1093/bioinformatics/btp616 [DOI] [PMC free article] [PubMed] [Google Scholar]
- Sharma Saha S, Roy Chowdhury R, Mondal NR, Chakravarty B, Chatterjee T, Roy S, Sengupta S. 2016. Identification of genetic variation in the lncRNA HOTAIR associated with HPV16-related cervical cancer pathogenesis. Cell Oncol (Dordr) 39: 559–572. 10.1007/s13402-016-0298-0 [DOI] [PubMed] [Google Scholar]
- Sun MY, Zhu JY, Zhang CY, Zhang M, Song YN, Rahman K, Zhang LJ, Zhang H. 2017. Autophagy regulated by lncRNA HOTAIR contributes to the cisplatin-induced resistance in endometrial cancer cells. Biotechnol Lett 39: 1477–1484. 10.1007/s10529-017-2392-4 [DOI] [PubMed] [Google Scholar]
- Tesina P, Heckel E, Cheng J, Fromont-Racine M, Buschauer R, Kater L, Beatrix B, Berninghausen O, Jacquier A, Becker T, et al. 2019. Structure of the 80S ribosome-Xrn1 nuclease complex. Nat Struct Mol Biol 26: 275–280. 10.1038/s41594-019-0202-5 [DOI] [PubMed] [Google Scholar]
- Towler BP, Newbury SF. 2018. Regulation of cytoplasmic RNA stability: lessons from Drosophila. Wiley Interdiscip Rev RNA 9: e1499. 10.1002/wrna.1499 [DOI] [PubMed] [Google Scholar]
- Towler BP, Jones CI, Viegas SC, Apura P, Waldron JA, Smalley SK, Arraiano CM, Newbury SF. 2015. The 3′–5′ exoribonuclease Dis3 regulates the expression of specific microRNAs in Drosophila wing imaginal discs. RNA Biol 12: 728–741. 10.1080/15476286.2015.1040978 [DOI] [PMC free article] [PubMed] [Google Scholar]
- Towler BP, Jones CI, Harper KL, Waldron JA, Newbury SF. 2016. A novel role for the 3′–5′ exoribonuclease Dis3L2 in controlling cell proliferation and tissue growth. RNA Biol 13: 1286–1299. 10.1080/15476286.2016.1232238 [DOI] [PMC free article] [PubMed] [Google Scholar]
- Towler BP, Pashler AL, Haime HJ, Przybyl KM, Viegas SC, Matos RG, Morley SJ, Arraiano CM, Newbury SF. 2020. Dis3L2 regulates cell proliferation and tissue growth through a conserved mechanism. PLoS Genet 16: e1009297. 10.1371/journal.pgen.1009297 [DOI] [PMC free article] [PubMed] [Google Scholar]
- Tuck AC, Rankova A, Arpat AB, Liechti LA, Hess D, Iesmantavicius V, Castelo-Szekely V, Gatfield D, Bühler M. 2020. Mammalian RNA decay pathways are highly specialized and widely linked to translation. Mol Cell 77: 1222–1236.e1213. 10.1016/j.molcel.2020.01.007 [DOI] [PMC free article] [PubMed] [Google Scholar]
- Vlasova IA, Tahoe NM, Fan D, Larsson O, Rattenbacher B, Sternjohn JR, Vasdewani J, Karypis G, Reilly CS, Bitterman PB, et al. 2008. Conserved GU-rich elements mediate mRNA decay by binding to CUG-binding protein 1. Mol Cell 29: 263–270. 10.1016/j.molcel.2007.11.024 [DOI] [PMC free article] [PubMed] [Google Scholar]
- Waldron JA, Jones CI, Towler BP, Pashler AL, Grima DP, Hebbes S, Crossman SH, Zabolotskaya MV, Newbury SF. 2015. Xrn1/Pacman affects apoptosis and regulates expression of hid and reaper. Biol Open 4: 649–660. 10.1242/bio.201410199 [DOI] [PMC free article] [PubMed] [Google Scholar]
- Wang B, Su Y, Yang Q, Lv D, Zhang W, Tang K, Wang H, Zhang R, Liu Y. 2015. Overexpression of long non-coding RNA HOTAIR promotes tumor growth and metastasis in human osteosarcoma. Mol Cells 38: 432–440. 10.14348/molcells.2015.2327 [DOI] [PMC free article] [PubMed] [Google Scholar] [Retracted]
- Wu Q, Medina SG, Kushawah G, DeVore ML, Castellano LA, Hand JM, Wright M, Bazzini AA. 2019. Translation affects mRNA stability in a codon-dependent manner in human cells. Elife 8: e45396. 10.7554/eLife.45396 [DOI] [PMC free article] [PubMed] [Google Scholar]
- Zabolotskaya MV, Grima DP, Lin MD, Chou TB, Newbury SF. 2008. The 5′–3′ exoribonuclease Pacman is required for normal male fertility and is dynamically localized in cytoplasmic particles in Drosophila testis cells. Biochem J 416: 327–335. 10.1042/BJ20071720 [DOI] [PubMed] [Google Scholar]
- Zhang K, Dion N, Fuchs B, Damron T, Gitelis S, Irwin R, O'Connor M, Schwartz H, Scully SP, Rock MG, et al. 2002. The human homolog of yeast SEP1 is a novel candidate tumor suppressor gene in osteogenic sarcoma. Gene 298: 121–127. 10.1016/S0378-1119(02)00929-0 [DOI] [PubMed] [Google Scholar]
Associated Data
This section collects any data citations, data availability statements, or supplementary materials included in this article.