

Abstract
Objectives
This study aims to retrospectively assess C‐lectin‐like molecule 1 (CLL‐1) bimodal expression on CD34+ blasts in acute myeloid leukemia (AML) patients (total N = 306) and explore potential CLL‐1 bimodal associations with leukemia and patient‐specific characteristics.
Methods
Flow cytometry assays were performed to assess the deeper immunophenotyping of CLL‐1 bimodality. Cytogenetic analysis was performed to characterize the gene mutation on CLL‐1‐negative subpopulation of CLL‐1 bimodal AML samples.
Results
The frequency of a bimodal pattern of CLL‐1 expression of CD34+ blasts ranged from 8% to 65% in the different cohorts. Bimodal CLL‐1 expression was most prevalent in patients with MDS‐related AML (P = .011), ELN adverse risk (P = .002), NPM1 wild type (WT, P = .049), FLT3 WT (P = .035), and relatively low percentages of leukemia‐associated immunophenotypes (P = .006). Additional immunophenotyping analysis revealed the CLL‐1− subpopulation may consist of pre‐B cells, immature myeloblasts, and hematopoietic stem cells. Furthermore, (pre)‐leukemic mutations were detected in both CLL‐1+ and CLL‐1− subfractions of bimodal samples (N = 3).
Conclusions
C‐lectin‐like molecule 1 bimodality occurs in about 25% of AML patients and the CLL‐1− cell population still contains malignant cells, hence it may potentially limit the effectiveness of CLL‐1‐targeted therapies and warrant further investigation.
Keywords: acute myeloid leukemia, bimodality, bone marrow aspirates, CD34+ blasts, CLL‐1, flow cytometry
1. INTRODUCTION
C type lectin‐like molecule (CLL‐1), also known as C‐type lectin domain family 12 member A (CLEC12A) or CD371, is a transmembrane protein expressed on the surface of cells arising from the myeloid lineage.1, 2 In acute myeloid leukemia (AML), CLL‐1 expression has been reported on roughly 72.5%‐92% of AML blasts at the time of diagnosis and 70%‐87% of the CD34+CD38− AML blasts (the presumed ‘stem cell’ enriched population) at diagnosis.3, 4, 5, 6 CLL‐1 is currently being used in flow cytometry panels as a marker to distinguish CD34+CD38− leukemic stem cells (LSCs) from normal hematopoietic stem cells (HSCs).7
Recently, CLL‐1 has emerged as a potential drug target in patients with AML due to its consistent expression on LSCs but absence from HSCs.3, 8, 9, 10 CLL‐1‐targeted therapies provide the possibility of improved safety over other targeted therapies (like CD33 and CD123) because the CLL‐1 target would be hypothesized to spare normal HSCs.11, 12, 13, 14, 15, 16, 17, 18, 19, 20
Previous studies have reported a wide range of CLL‐1 expression levels was detected in patients with AML.13, 16, 19, 20, 21 Moreover, within the CLL‐1‐positive blasts, only unimodal expression of CLL‐1 was identified.13, 16, 19, 20, 21 Based on these studies, various CLL‐1‐targeted therapies are being developed and tested in clinical trials.22, 23, 24, 25, 26, 27, 28 In this study, we observed various bimodal expression patterns of CLL‐1 in AML patient samples (Figure 1A‐C). The bimodal expression can be identified as two distinct (positive vs. negative) populations within the CD34+ AML blasts. This bimodal expression pattern for the CLL‐1 target is an important finding, as it could substantially impact the efficacy of CLL‐1‐targeted therapeutics in current clinical development plans for AML. In this study, we therefore investigated the prevalence of CLL‐1 bimodality across a large number of AML patients from four different patient cohorts, and assessed its potential association with clinical features. The fact that we confirmed bimodal expression of CLL‐1 warrants further investigation into the malignant or normal nature of the positive and negative cell fractions with different CLL‐1 bimodal expression patterns. Our findings may help inform current investigators to potentially find a biomarker to select patients that may or may not benefit from CLL‐1‐targeted therapy.
FIGURE 1.
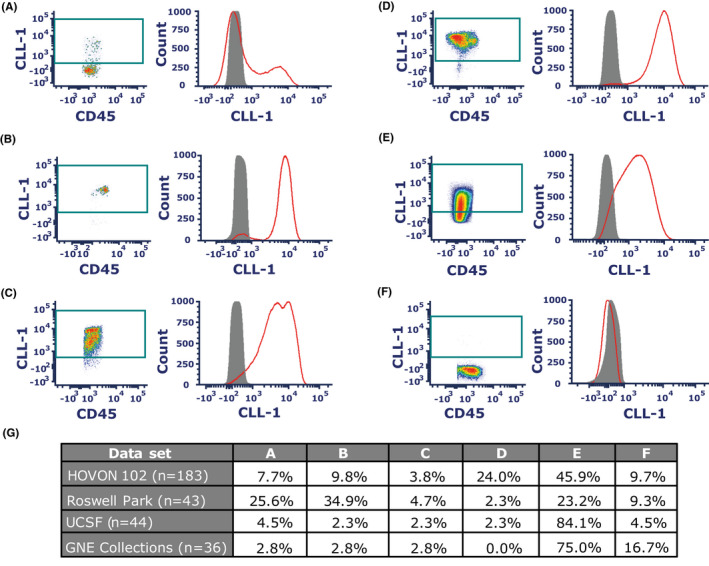
Example histograms of CLL‐1 bimodal (A‐C) vs unimodal expression (D‐F) in fresh primary CD34+ blasts in AML patients and frequencies of each expression pattern (G). CLL‐1 bimodal expression was defined by two distinct populations (A) Negative >positive. (B) Negative <positive. (C) Double‐positive bimodal peak. CLL‐1 unimodal expression was defined as a single peak. (D) Bright intensity (max peak around 104). (E) Intermediate intensity (max peak below 104). (F) Negative CLL‐1 expression. (G) Percentage of specific CLL‐1 expression pattern of the whole dataset shown per dataset. On each histogram, red: CD34+ blasts, grey: isotype control
2. METHODS
2.1. Acute myeloid leukemia patient samples
Available flow cytometry data of the Dutch‐Belgian Hemato‐Oncology Cooperative Group (HOVON) and Swiss Group for Clinical Cancer Research (SAKK) 102 trial (total n = 183) containing a subset of fresh and frozen non‐APL AML and high‐risk MDS with excess blasts (RAEB, n = 23) patients at diagnosis were used for the retrospective analysis of the CLL‐1 expression on CD34+ blasts (Table S1).7, 29 Subset selection was based on CLL‐1 being acquired in one fluorochrome channel and the clinical features of the patients were as complete as possible. CLL‐1 was available in the leukemic stem cell panel in the HOVON102.7 In summary, fresh bone marrow (n = 151) and peripheral blood (n = 32) were acquired by the hematologist or internist through bone marrow aspiration and anticoagulated with heparin. Samples were kept at room temperature (RT) through transport until multiparameter flow cytometry staining, which was performed within 72 hours of collection. Staining procedures were performed by Amsterdam UMC, VU medical center in Amsterdam, the Netherlands. For detailed protocol, see supplementary data in our earlier publication.7, 30, 31
A second study of fresh non‐APL AML patient bone marrow aspirates (n = 43) were acquired and stained within 48 hours of collection for a multiparameter flow cytometry assay by Roswell Park Comprehensive Cancer Center in Buffalo, New York, USA. The other two studies of cryopreserved non‐APL AML bone marrow‐derived mononuclear cells (BMMCs, n = 80) were acquired from different US collaborators. Samples were stained and analyzed by the Flow Biomarker Lab in Genentech, South San Francisco, CA. A summary of the AML samples tested during this investigation is outlined in Tables S1 and S2.
2.2. Flow cytometry
For fresh AML bone marrow samples originating from Roswell Park, red blood cells (RBCs) were lysed using lysing buffer (ThermoFisher Scientific) after surface staining with the following fluorochrome‐conjugated anti‐human monoclonal antibodies: CD34 (clone 581), CLL‐1/CD371 (clone 50C1), CD45 (clone 2D1), CD117 (clone 104D2), CD38 (clone HB7), CD33 (clone WM53), HLA‐DR (clone G46‐6), and Zombie UVTM fixable viability kit. The antibodies and viability kit were commercially available from BioLegend and BD Biosciences. Bone marrow samples collected by the Hematologic Malignancies Tissue Bank at the University of California, San Francisco (UCSF) underwent red cell lysis, followed by washing and cryopreservation of bone marrow mononuclear cells. Clinical information was collected with approval by the UCSF Institutional Review Board and sample annotations were provided in a de‐identified manner for the current study.
Cryopreserved AML bone marrow‐derived mononuclear cells (BMMCs), after cell recovery and resuspension in phosphate buffered saline (PBS), were first stained with Live/DeadTM fixable near‐IR dead cell stain kit (ThermoFisher). Samples were then stained with fluorescently conjugated monoclonal anti‐human antibodies: CD45 (clone 2D1), CD34 (clone 581), CD117 (clone 104D2), CD38 (clone HIT2), CLL‐1 (Genentech proprietary clone), CD33 (clone UCHT1), and HLA‐DR (clone L243). The following 18‐color flow panel was used to specify and characterize the cell populations of the CLL‐1‐positive and ‐negative on CD34+ blasts in AML samples: blasts identification CD45 (clone 2D1), CD34 (clone 581), CD117 (clone 104D2); myeloid progenitor cells CD38 (clone HIT2), HLA‐DR (clone L243); mono/myeloid cells CD33 (clone UCHT1), CLL‐1 (Genentech proprietary clone), CD123 (clone 6H6), CD13 (clone WM15), CD14 (clone M5E2), CD15 (clone W6D3), CD16 (clone 3G8) and other cell types CD7 (clone M‐T701), CD19 (clone SJ25C1), PDL‐1 (14D3 Genentech proprietary clone), CD56 (clone R19‐760), and CD71 (clone CY1G4). Stained samples were fixed and acquired on either FACSCanto IITM. FACSFortessaTM X‐20 or LSRFortessaTM (BD Biosciences, San Jose, USA).
2.3. CD34+CLL‐1 blasts analysis and scoring of CLL‐1 modality status
Gating strategy was performed as described in supplementary Figure S1. Briefly doublets, dead cells, and debris were first excluded. Second, CD45dim blasts were gated using CD45 vs. SSC‐A bivariate plot. Blasts were then further defined into CD34+ and CD34− myeloid precursors. CLL‐1 expression was assessed on CD34+ blast population in bivariate plot and histogram. A histogram of CLL‐1 on the CD34+ blasts was used to evaluate CLL‐1 expression pattern. As a negative control, fluorescence minus one (FMO) or CLL‐1 expression on lymphocytes was used. Immunophenotypic data from the HOVON 102 subset were analyzed with Infinicyt version 1.8 (Cytognos AL). Data from other patient sets were analyzed using FCSExpress 6.0 (De Novo Software).
To allow consistent assessment among the cohorts, strict criteria for analysis were defined based on the negative lymphocyte population and/or FMO. CLL‐1 bimodality was determined based on density plots configuration and confirmed with histograms of CLL‐1 on CD34+ blasts showing two distinct populations (Figure 1A‐C). In contrast, if the density plots or histograms of CLL‐1 on CD34+ blasts showed one uniform population, the sample was identified as CLL‐1 unimodal (Figure 1D‐F). The following criteria were applied when reporting the data sets: 1. If CD34+ percentage on white blood cells (WBCs) was below 1%, data were excluded. 2. If the percentage of CLL‐1‐positive population on CD34+ blasts was below 10%, this was categorized as CLL‐1 dim or negative for expression (Figure 1F). 3. If a sample was identified as CLL‐1 unimodal and the median fluorescent intensity on the histogram was below 104 on the X‐axis, this was categorized as unimodal intermediate expression (Figure 1E). If a sample was identified as CLL‐1 unimodal and the median fluorescent intensity was greater than or equal to 104 on the histograms, it was considered unimodal bright expression (Figure 1D).
2.4. Cell sorting
Cryopreserved non‐APL AML samples with CLL‐1 bimodal expression on CD34+ blasts (n = 3) were thawed and stained by the procedure as published before.30 Samples were stained with CLEC12A (clone 50C1), CD14 (clone MoP9), CD34 (clone 8G12), Fixable viability dye 780 (BD Biosciences), CD33 (clone P67.6), and CD45 (clone 2D1). Sorting experiment was gated on the CLL‐1‐positive and ‐negative fraction of CD34+ cells, CD45dim live singlet cells without monocytes (CD33+CD14+) (Figure S2). Cells were sorted in RPMI 1640 (ThermoFisher) and 10% Fetal Calf Serum on FACSAriaTM III (BD Biosciences). The equal cell numbers were sorted for both selected CLL‐1+ and CLL‐1− populations. After sorting the CD34+CLL‐1+ and CD34+CLL‐1− fractions from the samples, samples were then lysed in TRIzolTM (Life Technologies Corporation) and snap frozen for further DNA and/or RNA isolation according to the manufacturer's protocol with dilution to the right concentration in H2O.
2.5. Next generation sequencing (NGS)
The TruSight Amplicon Myeloid panel (Illumina) was used for NGS, which includes most recurrent AML mutations. Libraries were generated according to the manufacturer's protocol. Libraries were purified using AMPure Magnetic Beads (Beckman Coulter) and quantified using the TapeStation (Agilent). Normalized libraries were run on a MiSeq (Illumina) using the PE150v2 kit. Mutation calling and annotation were performed using SOPHiA DDM (SOPHiA Genetics analytics software, version 5.8.4), and QC statistics were generated.
2.6. Polymerase chain reaction CBFB‐MYH11
RNA (1 μg) was converted to cDNA using random hexamer primers (pdN6, Roche). For the PCR reaction,32 standard primers were used: 5'GCA GGC AAG GTA TAT TTG AAG GC 3' and 5' CTT CCA AGC TCT TGG CTT TCT TC 3'. ME‐1 and HL60 cell lines were used as positive and negative control respectively. The PCR products and size markers (50 bp, Invitrogen) were electrophoresed for 1 hour in a 1.7% agarose gel (Roche) containing ethidium bromide (0.0025%) and bands were visualized on an OptiGo‐650 imaging system (Isogen Life Sciences).
2.7. Statistical analysis
The CD34− (or <1% CD34+ blasts) AML patients (n = 72) and patients classified as CLL‐1‐negative (Table S1) were excluded from statistical analysis. As leukemic stem cells could not be assessed in all cohorts, patients were classified as having CD34− AML if the percentage of CD34+ on total white blood cells was less than 1%.33, 34 The statistical analysis was performed using GraphPad Prism 8 (GraphPad Software, Inc) or IBM SPSS statistics for Windows, version 26 (IBM Corp.). The significance of differences between percentages of cell populations was determined using the unpaired, nonparametric Mann‐Whitney U‐test. Association tests of CLL‐1 and patient characteristics such as MDS‐related AML (patients with prior MDS or classified as RAEB), leukemic‐associated immunophenotypes (LAIP), cytogenetics, and molecular aberrations determined in the HOVON 102 trial29 or provided by the corresponding centers, were done using Pearson's chi‐squared test or Fisher's exact test. Association tests were performed on the separate subsets. Statistical significance was considered if P < .05 (*). Tile plots, bar charts, and violin charts were generated using ggplot2 R package (version 3.3.0) in R (version 3.6.1).35, 36
3. RESULTS
3.1. CLL‐1 bimodality in four distinct AML studies
Total of 306 AML patient samples (four independent cohorts) were analyzed for CLL‐1 expression on CD34+ blasts and determined for CLL‐1 either unimodality or bimodality (Table S1). CLL‐1 bimodality was observed in all four independent subsets with a wide range of prevalence (8%‐65%). In 24% (74 out of 306) of total samples, CLL‐1 bimodal expression on CD34+ blasts was observed. We further categorized bimodal expression patterns. CLL‐1 bimodality can be consisted of both distinct positive and negative populations (Figure 1A‐B). Another bimodal pattern can be consisted of two positive CLL‐1 populations (intermediate and high expression) as shown in Figure 1C. In 68% (207 out of 306) of total samples, CLL‐1 unimodal expression on CD34+ blasts was observed. CLL‐1 unimodality on CD34+ blasts can be varied in expression intensity (Figure 1D‐F). Lastly, 8% (25 out of 306) of total samples were categorized as dim or no CLL‐1 expression on CD34+ blasts (Figure 1F).
In order to confirm whether bimodal expression of CLL‐1 was a true biological phenomenon, a series of experiments were conducted to rule out a potential technical artifact that may have contributed to this phenomenon. Experimental testing included antibody clones, sample collection tube types, cryopreservation (fresh vs frozen), and sample preprocessing procedures (eg Ficoll‐Paque vs no Ficoll‐Paque density centrifugation; Figures S3‐S6). Our experimental results suggested that none of these technical factors could account for the detection of bimodal CLL‐1 expression in any of the tested samples. Furthermore, we found that the bimodal expression of CLL‐1 was stably detectable for up to 72 hours after sample collection. This result suggested that the bimodal phenomenon was not due to the differences in sample handling or assessment time (Figure S4).
3.2. Association study of patient characteristics and CLL‐1 modality
In order to investigate specific patient subgroups harboring CLL‐1 bimodal expression, association studies were conducted on the HOVON 102 subset. Significant associations using the chi‐square test were identified between CLL‐1 modality and MDS‐related AML (prior MDS and/or RAEB, Fisher's exact test, P = .011), NPM1 mutations status (χ 2 = 3.879, P = .049), FLT3 mutation status (χ 2 = 4.427, P = .035), and ELN risk classification (χ2 = 12.051, P = .002; Figure 2). CLL‐1 bimodality was more common in patients with, NPM1 wild type (26% vs 9%), FLT3 wild type (29% vs 10%), and ELN adverse risk disease (42% vs 14%‐23%) compared to other groups. A higher proportion of CLL‐1 bimodality was observed in patients with monosomal karyotype compared to other cytogenetic risk groups (41% vs 16%‐33%, respectively), but this did not reach statistical significance P = .103 (Figure 2C).
FIGURE 2.

Association of patient leukemia‐specific characteristics in the HOVON102 subset with CLL‐1 bimodality. A higher proportion of CLL‐1 bimodality (light blue bars) was observed in the MDS‐related AML (prior MDS and/or RAEB), NPM1 wild type, FLT3 wild type, and ELN adverse risk ratio. Proportional bar charts of CLL‐1 expression patterns in regard of (A) AML patients with prior MDS and/or classified as RAEB (MDS‐related AML). (B) NPM1 and (C) FLT3 mutation status, (D) cytogenetics, (E) ELN classification status. MDS‐related AML, NPM1, FLT3 mutation status and ELN classification status were statistically significant with the chi‐square test or Fisher's exact test P <.05. CA rest, cytogenetics Abnormal rest group; CN–XY, cytogenetics normal; Inv(16), inversion 16; MK, monosomal karyotype; t(8,21), translocation 8, 21
The same analysis was also performed on AML samples from the other two sources with available clinical and molecular data (Figure 3). Overall, CLL‐1 bimodality was not associated with any patient characteristic such as sex, age, or disease status (newly diagnosed vs relapsed). A trend of higher representation of NPM1/FLT3 wild type was also observed in the CLL‐1 bimodal group compared to the CLL‐1 unimodal group (Figure 3). Interestingly, the Roswell park subset showed a similar higher incidence of CLL‐1 bimodality and patients with MDS‐related AML (prior MDS) compared to the HOVON 102 and UCSF subsets.
FIGURE 3.

Tile plot of AML patients’ characteristics with CLL‐1 bimodal expression. (A) HOVON 102 subset, (B) Roswell park, (C) USCF. Tiles were clustered in the order of CLL‐1 expression, prior MDS disease, ELN risk classification, NPM1, and FLT3 mutation status. AML patients with prior MDS and/or classified as RAEB were classified as MDS‐related AML. Patient characteristics were not available for other Genentech collection data set
3.3. Potential explanations for CLL‐1 bimodality on CD34+ blasts
Our data suggested that the CLL‐1 bimodal pattern was observed in the more mature blasts (CD34+CD38+), but not in the less mature (CD34+CD38−) population (Figure 4A). When gating on mono/myeloids populations, CLL‐1 expression showed a bright unimodal peak on the histogram (Figure 4B). This observation may suggest how CLL‐1 expression transforms from HSC‐like stage to mature myeloid cells: from dim or no expression (on CD34+CD38− cells) to bimodal (on CD34+CD38+ cells) to unimodal (on mono/myeloids). CLL‐1 bimodality may be due to heterogeneity nature of the AML disease.
FIGURE 4.

CLL‐1 bimodal expression may be due to heterogeneity of the CD34+ blasts in AML patients. Further analysis in phenotyping CLL‐1± on CD34+ blast for bimodal expression samples (both fresh and frozen AML bone marrow, n = 10). (A) LSCs and myeloid progenitor cells were indicated as CD34+CD38− and CD34+CD38+, respectively. CD34 vs CD38 bivariate plots were gated on total CD45dim blasts. CLL‐1 was gated in both CD34+CD38+ and CD34+CD38‐ populations. CLL‐1 showed a bimodality expression pattern in myeloid progenitor cells (CD34+CD38+) while were absent in CD34+CD38− population. (B) Mono/myeloid cells were captured using CD45 vs. SSC‐A density plot. CLL‐1 unimodal expression showed high signal intensity in mature mono/myeloid populations. Therefore, we hypothesized that the CLL‐1 bimodal expression may due to heterogeneity among CD34+ blasts in AML cells. (C) The bivariate plot captured CLL‐1± CD34+ populations. (D) Stem cell compartment (CD34+CD38‐) showed less expression in the CLL‐1+CD34+ population than in the (E) progenitor cells population (CD34+CD38+). Populations expressing more mature myeloid markers, including CD33 (F), HLA‐DR (G), CD15 (H), and CD123 (I), showed higher expression in CLL‐1+CD34+ population when comparing to CLL‐1− CD34+ population. These results suggested CLL‐1+CD34+ contain more mature myeloid cells. * = Mann‐Whitney U‐test P < .05
During the analysis of CLL‐1 bimodality in the flow cytometric data of the HOVON 102, several populations could also be identified based on their immunophenotypic properties. In the CLL‐1‐positive fraction, the maturation of blasts (CD34+CD38+) to monocytes was identified based on their immunophenotypic properties such as CD11b, CD45, and SSC‐A (Figure S8A). In the CLL‐1‐negative fraction, CD34+CD38− candidate stem cells (Figure S8B) and SCC‐AlowCD45dim pre‐B cells (Figure S8C) were identified.
To further investigate the role of CLL‐1 in blasts maturity in these samples, CLL‐1 bimodal patient samples (n = 10) were selected for performing a more extensive immunophenotyping using an 18‐color multiparameter flow cytometry panel with the gating strategies as described in Figure S7. CD34+CLL‐1+ cells showed a trend of having a higher median percentage on mature markers such as CD38, CD33, HLA‐DR, CD15, and CD123 positivity whereas CD34+CLL‐1− cells had a higher percentage of CD38 negativity (Figure 4C‐I & Figure S7). These results demonstrate that CD34+CLL‐1+ cells are prone to be more mature myeloid cells than CD34+CLL‐1− cells, irrespective of the malignant fraction. The heterogeneity in CLL‐1 bimodal expression of the CD34+ blasts may be lost by a higher total blast count; therefore, we investigated the difference in percentages of blasts of WBCs between CLL‐1 bimodal and unimodal groups in the HOVON102 subset (Figure 5). A significantly lower mean level of percentage blasts of WBCs was observed in the RAEB samples (Mann‐Whitney U‐test, P < .01, Figure 5A) when compared to the AML samples (Figure 5B). The CLL‐1 immunophenotypic analysis from the HOVON 102 subset was based on a stem cell tube not consisting of LAIP markers, hence the analysis of the exact proportion of immunophenotypic malignant cells in either CD34+CLL‐1− or CD34+CLL‐1+ fraction of CLL‐1 bimodal group was not possible. Therefore, we investigated the available LAIP+ cells on CD34+ blasts of these patients by comparing the CLL‐1 modality with the percentage of LAIP+ on the CD34+, which was determined with a separate panel in the HOVON 102 study.7 A significantly lower median percentage of LAIP on CD34+ blasts was observed in the group showing bimodal CLL‐1 expression compared to the group showing unimodal CLL‐1 expression (55% vs. 81%, Mann‐Whitney U‐test, P = .006, Figure 5C).
FIGURE 5.

Lower median percentage of total blasts of white blood cells (WBC) in CLL‐1 bimodality was found in the CLL‐1 bimodal RAEB group. Furthermore, a lower median percentage of immunophenotypically aberrant blasts in the CD34+ population was observed in AML patients of the HOVON 102 subset with CLL‐1 bimodality. (A) Lower median percentage of total blasts of white blood cells assessed by flow cytometry was observed in the CLL‐1 bimodal RAEB group. This difference was not found in (B) the AML group only. (C) Violin plot of percentage LAIP on CD34+ blasts of AML patients in the HOVON 102 subset. The highest percentage of LAIP on CD34+ blasts found in the patient was chosen with the extraction of this data. Percentage LAIP originated from a separate panel other than the CLL‐1 containing panel in the re‐analysis of CLL‐1 bimodality,30 ***=<.001, **=<0.01, ns, non‐significant >.05
3.4. Molecular characterization of CLL‐1‐positive and ‐negative subpopulations in bimodal samples
Although we found relatively more LAIP+ cells in the unimodal samples (Figure 5C), we could not exclude the possibility that the CLL‐1‐negative cells were normal. Therefore, we selected three bimodal samples to molecularly characterize the two subpopulations of CLL‐1+ and CLL− cells by cell sorting and NGS. In two out of three samples, molecular aberrancies such as IDH1, IDH2, or DNMT3A could be identified in both fractions in CLL‐1 bimodal patients with similar variant allele frequency (VAF; Table 1 and Table S3). Additional mutations could also be found in the separate CLL‐1+ and CLL‐1− fractions of the CLL‐1 bimodal patients. In AML2, an extra mutation (NRAS G12D, 38%) was present in the CD34+CLL‐1+ fraction, which was present at a low level in the CLL‐1− fraction (NRAS G12D, 2.1%). In AML3, an extra KIT mutation (D816Y, 48%) was present in the CD34+CLL‐1− fraction, which was not present in the CD34+CLL‐1+ fraction. One sample (AML 1) did not have any mutations besides the Inv(16) karyotype. Therefore, we added RNA analysis and could reveal the chromosomal aberration in both the CLL‐1+ and CLL‐1− fraction (Table 1, Figure S9). This sorting experiment shows that in the CLL‐1− fraction, cells harboring leukemic mutations are present, indicative of a malignant phenotype.
TABLE 1.
Patient characteristics of CD34+CLL‐1 bimodal sorting and next generation sequencing+PCR
| AML | Sex | Age | Prior MDS | Karyotype | ELN risk | LAIP (% LAIP /CD34+ blasts) at Dx | % CD34+ blasts/WBC | % blasts/WBC | % CD34+ CLL‐1+/CD34+ blasts | % CD34+ CLL‐1−/CD34+ blasts | Mutations CD34+CLL‐1+ (%VAF) | Mutations CD34+CLL‐1− (%VAF) |
|---|---|---|---|---|---|---|---|---|---|---|---|---|
| 1 | F | 49 | No | Inv(16) | Favorable | CD15 (36%) | 30.39 | 46.69 | 79.56 | 20.44 |
No mutation found* CBFB‐MYH11 PCR product (Figure S9) |
No mutation found* CBFB‐MYH11 PCR product (Figure S9) |
| 2 | M | 46 | No | CA‐Rest | Intermediate | HLA‐DR‐(83%) | 58.86 | 74.67 | 26.26 | 73.74 | IDH1 R132C (51%), NRAS G12D (38%), DNMT3A R882H (50%) | IDH1 R132C (49%), NRAS G12D (2.1%), DNMT3A R882H (49%) |
| 3 | F | 59 | No | t(8,21) | Favorable | CD11b (91%) | 51.21 | 76.72 | 64.43 | 35.57 | IDH2 R140Q (48%), KIT D816H (54%) | IDH2 R140Q (49%), KIT D816H (5%), KIT D816Y (48%) |
Abbreviations: AML, Acute Myeloid Leukemia; CA‐rest, Cytogenetic Aberrant Rest group; CLL‐1, C‐lectin like molecule 1; DNMT3A, DNA methyltransferase 3 alfa; Dx, diagnosis; ELN, European leukemia Network; F, Female; IDH1, isocitrate dehydrogenase 1; IDH2, isocitrate dehydrogenase 2; Inv(16), Inversion 16; LAIP, Leukemia Associated Immunophenotypes; M, Male; t(8, 21), translocation 8, 21; WBC, white blood cells.
No mutation found by Illumina myeloid TruSight panel.
4. DISCUSSION
CLL‐1 is an attractive therapeutic target in AML due to high expression on LSCs and malignant blasts in 92% of the AML patients, while being absent in normal HSCs.3, 4, 5, 11 Approaches targeting CLL‐1 would have the potential to specifically target leukemic cells while sparing normal HSCs. The identification of bimodal CLL‐1 expression on AML blasts could limit the attractiveness of this target if the CLL‐1‐negative populations contain malignant cells. We conducted this study to assess the frequency of bimodal CLL‐1 expression on CD34+ blasts in various AML cohorts and its potential difference between AML subgroups. In our study, we observed a broad range in prevalence of bimodal CLL‐1 expression on CD34+ blasts ranging from 8% to 65%. The differences in prevalence could be explained by the various composition of AML subtypes within these cohorts. We investigated if potential clinical features might be associated with CLL‐1 bimodality in AML patients.
In the largest subgroup (HOVON 102, n = 183), an association of CLL‐1 bimodality with clinical and biological features was performed. Our data suggested that AML patients categorized as MDS‐related AML (prior MDS and/or RAEB), ELN adverse risk, without mutations in NPM1 or FLT3 were more likely to have CLL‐1 bimodality. Although not significant, patients with bimodal CLL‐1 expression were also more likely to have a monosomal karyotype. Because the criteria of ELN adverse risk contain a combination of FLT3 wild type, NPM1 wild type and monosomal karyotype, which are also often present in MDS related AML, the association between MDS related AML and CLL‐1 bimodality may be partly explained by the association with ELN adverse risk. However, as this is the first study that focused specifically on CLL‐1 bimodality in AML, no other studies are available yet to validate our findings.
In a subset of patient samples (BMMCs, n = 10), we further explored CLL‐1 bimodality by additional extensive immunophenotyping of CLL‐1‐positive and ‐negative blasts. We observed that populations such as pre‐B cells, hematopoietic stem cells, and myeloid blasts (malignant status undetermined) were present in patients with bimodal expression of CLL‐1. Our findings of the distinct populations and maturation status within the two CLL‐1 expressing populations of bimodal samples are consistent with the recent literature about CLL‐1 expression in hematopoiesis.3, 5, 8, 37 Bill and colleagues showed that the levels of CLL‐1 increase during differentiation from normal hematopoietic cells.8 The earliest CLL‐1+ can be found in common myeloid progenitor cells (CMP).8 Furthermore, a bimodal pattern of CLL‐1 expression was observed in different cell populations during myeloid hematopoiesis.8 Besides the maturation in monocytes, CLL‐1 has also been observed on dendritic cell subtypes and granulocytes such as basophils.38 Furthermore, in our RAEB samples, the CLL‐1 bimodal group showed lower percentage blasts compared to the CLL‐1 unimodal group. This result may imply that CLL‐1 bimodality and low % blasts are related in the RAEB group, but the same assumption was not able to make in the AML group. Considering the CLL‐1 bimodality expression observed in our AML cohorts, CLL‐1 bimodality could indicate differentiation heterogeneity in the malignant CD34+ blast population or normal hematopoiesis.
Bimodality (both positive and negative subsets) of CLL‐1 expression may be associated with different degrees of myeloid differentiation and thus different capacities to propagate AML. Selective elimination of only CLL‐1‐positive population by CLL‐1 targeting therapy may lead to early relapse if the CLL‐1‐negative population is malignant with relapse initiating capacities. On the contrary, the CLL‐1‐negative population could be HSCs. We investigated the proportion of malignant cells in patients with CLL‐1 bimodal expression vs. CLL‐1 unimodal expression6 by comparing available LAIP+ cells of CD34+ blasts with these two groups. Due to the fact that CLL‐1 was not in the same multiparameter flow cytometric panel as used for the LAIP assessment in the HOVON 102 trial, the exact proportion of LAIPs could not be determined in the CLL‐1‐positive and ‐negative subfractions of the CLL‐1 bimodal patients. Based on available MRD data from the HOVON102 study, CLL‐1 bimodal patients contained less LAIPs on the total CD34+ blast population suggesting that CLL‐1 bimodal patients have relatively less aberrant cells. However, our molecular characterization of CLL‐1+ and CLL‐1− cell populations (n = 3) showed that (pre)‐leukemic mutations or aberrant karyotype were found in both CLL‐1 fractions of bimodal patients. DNMT3A can be pre‐leukemic or otherwise a mutation indicative of clonal hematopoiesis.39, 40 The combinations of DNMT3A with other mutations such as NRAS and KIT next to IDH1/2 mutations indicate a malignant phenotype.41, 42, 43, 44 The finding of (pre‐) leukemic mutations in the CD34+CLL‐1‐ fraction is consistent with a study reported by Bill and colleagues where pre‐leukemic mutations could be found in their long‐term colony initiating cell assay of CD34+ALDHbrCLL‐1− cells45 with targeted NGS.
In conclusion, we reported the observation that AML patients can harbor bimodal CLL‐1 expression, which may potentially limit the effectiveness of CLL‐1‐targeted therapies when the CLL‐1‐negative population contains malignant cells. Our findings should also be validated in additional data sets, preferably having CLL‐1 in a panel that can distinguish LAIP+ cells from all different CLL‐1 expressing populations. Ongoing and future clinical trials of anti‐CLL‐1‐targeted therapies may need to evaluate CLL‐1 expression together with LAIP markers to better assess the potential impact of CLL‐1 bimodality on the efficacy of the therapeutic agents in AML.
AUTHOR CONTRIBUTIONS
Sample generation, experiments: CM, AR, OM, BJvK, ANS, LS, ZK, MGM, BJG, GO, JJWM; Data extraction & analysis: LLN, CM, AD, BVP; Statistical analysis: TP, LLN, CM; Manuscript writing: LLN, CM, ACL, MJN, MGM, BJG, BvK, ANS, ZK, BVP, GO, JJWMJ, JC, TS; Overview of the study: GO, JJWMJ, JC, TS; All authors gave final approval for submission of the manuscript.
Supporting information
Appendix S1
ACKNOWLEDGEMENTS
We thank the HOVON/SAKK group, the MRD team of the Amsterdam UMC for performing the immunophenotyping and assistance with data analysis. We would like to acknowledge Linda G. Lutgen and Tara L. Cronin from the Hematologic Procurement Shared Resource and the Flow and Image Cytometry Shared Resource at Roswell Park Comprehensive Cancer Center both supported by National Cancer Institute (NCI) grant P30CA016056. Orla Maguire is an ISAC Marylou Ingram Scholar.
Ngai LL, Ma CY, Maguire O, et al. Bimodal expression of potential drug target CLL‐1 (CLEC12A) on CD34+ blasts of AML patients. Eur J Haematol. 2021;107:343–353. 10.1111/ejh.13672
Ngai and Ma contributed equally.
Novelty Statements:
• What is the NEW aspect of your work? Data reported here show that CLL‐1 has a bimodal expression on the CD34+ blasts in about 25% of acute myeloid leukemia (AML) patients. Retrospective flow cytometry data analysis was conducted on this CLL‐1 bimodal expression pattern in a multi‐cohort study (total n = 306) to determine its relevance and potential association with AML patient characteristics.
• What is the CENTRAL finding of your work? The immunophenotypic characterization of the negative portion of CLL‐1 bimodal samples was identified as pre‐B cells, immature myeloblasts, and hematopoietic stem cells. In addition, the molecular characterization of sorted CLL‐1 bimodal samples showed that CLL‐1‐negative fractions contain (pre)‐leukemic mutations.
• What is (or could be) the SPECIFIC clinical relevance of your work? AML patients with CLL‐1 bimodality were found in about 25% of AML patients which could have an impact on the clinical activity of an anti‐CLL1 therapy. Multiple clinical efforts are actively investigating CLL‐1 in AML. This manuscript shows why bimodal surface antigen expression needs to be considered as one of the potential factors that could impact the clinical activities of anti‐CLL‐1‐targeted therapies.
DATA AVAILABILITY STATEMENT
Data Available upon request from corresponding author.
REFERENCES
- 1.Hutten TJ, Thordardottir S, Fredrix H, et al. CLEC12A‐mediated antigen uptake and cross‐presentation by human dendritic cell subsets efficiently boost tumor‐reactive T cell responses. J Immunol. 2016;197(7):2715‐2725. [DOI] [PubMed] [Google Scholar]
- 2.Marshall AS, Willment JA, Lin HH, Williams DL, Gordon S, Brown GD. Identification and characterization of a novel human myeloid inhibitory C‐type lectin‐like receptor (MICL) that is predominantly expressed on granulocytes and monocytes. J Biol Chem. 2004;279(15):14792‐14802. [DOI] [PubMed] [Google Scholar]
- 3.van Rhenen A , van Dongen GA , Kelder A, et al. The novel AML stem cell associated antigen CLL‐1 aids in discrimination between normal and leukemic stem cells. Blood. 2007;110(7):2659‐2666. [DOI] [PubMed] [Google Scholar]
- 4.Zeijlemaker W, Kelder A, Oussoren‐Brockhoff YJ, et al. A simple one‐tube assay for immunophenotypical quantification of leukemic stem cells in acute myeloid leukemia. Leukemia. 2016;30(2):439‐446. [DOI] [PubMed] [Google Scholar]
- 5.Bakker AB, van den Oudenrijn S , Bakker AQ, et al. C‐type lectin‐like molecule‐1: a novel myeloid cell surface marker associated with acute myeloid leukemia. Cancer Res. 2004;64(22):8443‐8450. [DOI] [PubMed] [Google Scholar]
- 6.Morsink LM, Walter RB, Ossenkoppele GJ. Prognostic and therapeutic role of CLEC12A in acute myeloid leukemia. Blood Rev. 2019;34:26‐33. [DOI] [PubMed] [Google Scholar]
- 7.Zeijlemaker W, Grob T, Meijer R, et al. CD34(+)CD38(‐) leukemic stem cell frequency to predict outcome in acute myeloid leukemia. Leukemia. 2018;33:1102‐1112. [DOI] [PubMed] [Google Scholar]
- 8.Bill M, van Kooten Niekerk BP , Woll SP, et al. Mapping the CLEC12A expression on myeloid progenitors in normal bone marrow; implications for understanding CLEC12A‐related cancer stem cell biology. J Cell Mol Med. 2018;22(4):2311‐2318. [DOI] [PMC free article] [PubMed] [Google Scholar]
- 9.Valent P, Sadovnik I, Eisenwort G, et al. Immunotherapy‐based targeting and elimination of leukemic stem cells in AML and CML. Int J Mol Sci. 2019;20(17):4233. [DOI] [PMC free article] [PubMed] [Google Scholar]
- 10.Ma H, Padmanabhan IS, Parmar S, Gong Y. Targeting CLL‐1 for acute myeloid leukemia therapy. J Hematol Oncol. 2019;12(1):41. [DOI] [PMC free article] [PubMed] [Google Scholar]
- 11.Wang J, Chen S, Xiao W, et al. CAR‐T cells targeting CLL‐1 as an approach to treat acute myeloid leukemia. J Hematol Oncol. 2018;11(1):7. [DOI] [PMC free article] [PubMed] [Google Scholar]
- 12.Jiang YP, Liu BY, Zheng Q, et al. CLT030, a leukemic stem cell‐targeting CLL1 antibody‐drug conjugate for treatment of acute myeloid leukemia. Blood Adv. 2018;2(14):1738‐1749. [DOI] [PMC free article] [PubMed] [Google Scholar]
- 13.Leong SR, Sukumaran S, Hristopoulos M, et al. An anti‐CD3/anti‐CLL‐1 bispecific antibody for the treatment of acute myeloid leukemia. Blood. 2017;129(5):609‐618. [DOI] [PMC free article] [PubMed] [Google Scholar]
- 14.van Loo PF , Hangalapura BN, Thordardottir S, et al. MCLA‐117, a CLEC12AxCD3 bispecific antibody targeting a leukaemic stem cell antigen, induces T cell‐mediated AML blast lysis. Expert Opin Biol Ther. 2019;19(7):721‐733. [DOI] [PubMed] [Google Scholar]
- 15.Lin TY, Zhu Y, Li Y, et al. Daunorubicin‐containing CLL1‐targeting nanomicelles have anti‐leukemia stem cell activity in acute myeloid leukemia. Nanomedicine. 2019;20:102004. [DOI] [PMC free article] [PubMed] [Google Scholar]
- 16.Tashiro H, Sauer T, Shum T, et al. Treatment of acute myeloid leukemia with T cells expressing chimeric antigen receptors directed to C‐type lectin‐like molecule 1. Mol Ther. 2017;25(9):2202‐2213. [DOI] [PMC free article] [PubMed] [Google Scholar]
- 17.Laborda E, Mazagova M, Shao S, et al. Development of A chimeric antigen receptor targeting C‐type lectin‐like molecule‐1 for human acute myeloid leukemia. Int J Mol Sci. 2017;18(11):2259. [DOI] [PMC free article] [PubMed] [Google Scholar]
- 18.Wiersma VR, de Bruyn M , Shi C, et al. C‐type lectin‐like molecule‐1 (CLL1)‐targeted TRAIL augments the tumoricidal activity of granulocytes and potentiates therapeutic antibody‐dependent cell‐mediated cytotoxicity. MAbs. 2015;7(2):321‐330. [DOI] [PMC free article] [PubMed] [Google Scholar]
- 19.Lu H, Zhou Q, Deshmukh V, et al. Targeting human C‐type lectin‐like molecule‐1 (CLL1) with a bispecific antibody for immunotherapy of acute myeloid leukemia. Angew Chem Int Ed Engl. 2014;53(37):9841‐9845. [DOI] [PMC free article] [PubMed] [Google Scholar]
- 20.Zhao X, Singh S, Pardoux C, et al. Targeting C‐type lectin‐like molecule‐1 for antibody‐mediated immunotherapy in acute myeloid leukemia. Haematologica. 2010;95(1):71‐78. [DOI] [PMC free article] [PubMed] [Google Scholar]
- 21.Larsen HO, Roug AS, Just T, Brown GD, Hokland P. Expression of the hMICL in acute myeloid leukemia‐a highly reliable disease marker at diagnosis and during follow‐up. Cytometry B Clin Cytom. 2012;82(1):3‐8. [DOI] [PubMed] [Google Scholar]
- 22.ClinicalTrials.gov [Internet]. CD123/CLL1 CAR‐T Cells for R/R AML (STPHI_0001). https://ClinicalTrials.gov/show/NCT03631576. Published 2018. Accessed 14 July 2020.
- 23.ClinicalTrials.gov [Internet]. Chimeric Antigen Receptor T‐cells for The Treatment of AML Expressing CLL‐1 Antigen. https://ClinicalTrials.gov/show/NCT04219163. Published 2020. Accessed 14 July 2020.
- 24.ClinicalTrials.gov [Internet]. Multiple CAR‐T Cell therapy targeting AML. https://ClinicalTrials.gov/show/NCT04010877. Published 2019. Accessed 14 July 2020.
- 25.ClinicalTrials.gov [Internet]. MCLA‐117 in acute myelogenous leukemia. https://ClinicalTrials.gov/show/NCT03038230. Published 2017. Accessed 14 July 2020.
- 26.ClinicalTrials.gov [Internet]. Multi‐CAR T cell therapy for acute myeloid leukemia. https://ClinicalTrials.gov/show/NCT03222674. Published 2019. Accessed 14 July 2020.
- 27.ClinicalTrials.gov [Internet]. CLL1‐CD33 cCAR in patients with relapsed and/or refractory, high risk hematologic malignancies. https://ClinicalTrials.gov/show/NCT03795779. Published 2019. Accessed 14 July 2020.
- 28.Arvindam US, van Hauten PMM , Schirm D, et al. A trispecific killer engager molecule against CLEC12A effectively induces NK‐cell mediated killing of AML cells. Leukemia. 2020;35:1586‐1596. [DOI] [PMC free article] [PubMed] [Google Scholar]
- 29.Löwenberg B, Pabst T, Maertens J, et al. Therapeutic value of clofarabine in younger and middle‐aged (18–65 years) adults with newly diagnosed AML. Blood. 2017;129(12):1636‐1645. [DOI] [PubMed] [Google Scholar]
- 30.Cloos J, Harris JR, Janssen J, et al. Comprehensive protocol to sample and process bone marrow for measuring measurable residual disease and leukemic stem cells in acute myeloid leukemia. J Vis Exp. 2018;(133):56386. [DOI] [PMC free article] [PubMed] [Google Scholar]
- 31.Terwijn M, van Putten WL , Kelder A, et al. High prognostic impact of flow cytometric minimal residual disease detection in acute myeloid leukemia: data from the HOVON/SAKK AML 42A study. J Clin Oncol. 2013;31(31):3889‐3897. [DOI] [PubMed] [Google Scholar]
- 32.van der Reijden BA , Jansen JH. Diagnosis and monitoring of CBFB‐MYH11‐positive acute myeloid leukemia by qualitative and quantitative RT‐PCR. Methods Mol Med. 2006;125:163‐175. [DOI] [PubMed] [Google Scholar]
- 33.Zeijlemaker W, Kelder A, Wouters R, et al. Absence of leukaemic CD34+ cells in acute myeloid leukaemia is of high prognostic value: a longstanding controversy deciphered. Br J Haematol. 2015;171(2):227‐238. [DOI] [PubMed] [Google Scholar]
- 34.Terwijn M, Zeijlemaker W, Kelder A, et al. Leukemic stem cell frequency: a strong biomarker for clinical outcome in acute myeloid leukemia. PLoS One. 2014;9(9):e107587. [DOI] [PMC free article] [PubMed] [Google Scholar]
- 35.R Foundation for Statistical Computing . R: A Language and Environment for Statistical Computing [computer program]. Vienna, Austria: R Foundation for Statistical Computing; 2019. [Google Scholar]
- 36.Wickham H. ggplot2: Elegant Graphics for Data Analysis. New York, NY: Springer‐Verlag; 2016. [Google Scholar]
- 37.Westers TM, Terwijn M, Alhan C, et al. Expression of C‐type lectin‐like molecule‐1 (CLL‐1) on stem cells might discriminate de novo acute myeloid leukemia from acute myeloid leukemia originating from myelodysplastic syndromes. Blood. 2008;112(11):2697. [Google Scholar]
- 38.Toft‐Petersen M, Stidsholt Roug A, Plesner T, Ebbesen L, Brown GD, Nederby L. The CLEC12A receptor marks human basophils: potential implications for minimal residual disease detection in acute myeloid leukemia. Cytometry B Clin Cytom. 2018;94(3):520‐526. [DOI] [PubMed] [Google Scholar]
- 39.Jongen‐Lavrencic M, Grob T, Hanekamp D, et al. Molecular minimal residual disease in acute myeloid leukemia. N Engl J Med. 2018;378(13):1189‐1199. [DOI] [PubMed] [Google Scholar]
- 40.Ding L, Ley TJ, Larson DE, et al. Clonal evolution in relapsed acute myeloid leukaemia revealed by whole‐genome sequencing. Nature. 2012;481(7382):506‐510. [DOI] [PMC free article] [PubMed] [Google Scholar]
- 41.Valent P, Kern W, Hoermann G, et al. Clonal hematopoiesis with oncogenic potential (CHOP): separation from CHIP and roads to AML. Int J Mol Sci. 2019;20(3):789. [DOI] [PMC free article] [PubMed] [Google Scholar]
- 42.Jahn N, Terzer T, Sträng E, et al. Genomic heterogeneity in core‐binding factor acute myeloid leukemia and its clinical implication. Blood Adv. 2020;4(24):6342‐6352. [DOI] [PMC free article] [PubMed] [Google Scholar]
- 43.Yang L, Rau R, Goodell MA. DNMT3A in haematological malignancies. Nat Rev Cancer. 2015;15(3):152‐165. [DOI] [PMC free article] [PubMed] [Google Scholar]
- 44.Krönke J, Bullinger L, Teleanu V, et al. Clonal evolution in relapsed NPM1‐mutated acute myeloid leukemia. Blood. 2013;122(1):100‐108. [DOI] [PubMed] [Google Scholar]
- 45.Bill M, Aggerholm A, Kjeldsen E, Roug AS, Hokland P, Nederby L. Revisiting CLEC12A as leukaemic stem cell marker in AML: highlighting the necessity of precision diagnostics in patients eligible for targeted therapy. Br J Haematol. 2019;184(5):769‐781. [DOI] [PubMed] [Google Scholar]
Associated Data
This section collects any data citations, data availability statements, or supplementary materials included in this article.
Supplementary Materials
Appendix S1
Data Availability Statement
Data Available upon request from corresponding author.