

Abstract
Objective
This study applied a synovitis score obtained during routine care from ultrasound (US)–guided biopsies of synovial tissue (ST) in patients with rheumatoid arthritis (RA) and patients with other inflammatory and noninflammatory joint diseases to identify pretreatment synovial biomarkers associated with disease characteristics, and to integrate the findings into a multiparameter nomogram for use in baseline prediction of diagnosis and treatment response in treatment‐naive rheumatoid arthritis (RA) patients.
Methods
The study enrolled a total of 1,015 patients with various autoimmune diseases (545 patients with RA, 167 patients with psoriatic arthritis [PsA], 199 patients with undifferentiated peripheral inflammatory arthritis [UPIA], 18 patients with crystal‐induced arthritis, 26 patients with connective tissue diseases, and 60 patients with osteoarthritis [OA] [as part of the SYNGem cohort]). All patients underwent a US‐guided ST biopsy at baseline, and patients were then stratified according to disease phase. The KSS, along with disease characteristics and clinical outcomes, were incorporated into a nomogram for prediction of achievement of clinical remission in RA patients who were previously naive to treatment. In patients in whom a treat‐to‐target strategy was applied, remission was defined as change in the Disease Activity Score in 28 joints (DAS28) at 6 months after treatment initiation.
Results
The KSS significantly differed among RA patients, as well as PsA patients and UPIA patients, when compared to OA patients. In RA, the KSS directly correlated with the DAS28 and was related to autoantibody positivity in treatment‐naive RA patients. Moreover, at baseline, treatment‐naive RA patients achieving 6‐month remission according to DAS28 had a lower KSS, shorter duration of symptoms (very early RA [VERA]), and lower disease activity than treatment‐naive RA patients not achieving remission according to DAS28. Results of logistic regression analysis identified the following synergistic predictive factors of achievement of DAS28‐based disease remission at 6 months: having a short disease duration (VERA), not having high disease activity, and having a KSS of <5 at baseline. A nomogram integrating these baseline clinical and histologic characteristics in treatment‐naive RA patients yielded an up to 81.7% probability of achieving 6‐month remission according to the DAS28.
Conclusion
The KSS is a reliable tool for synovitis assessment on US‐guided ST biopsy, contingent on the phase of the disease and the autoimmune profile of each patient. This tool could be integrated within a therapeutic response–predictive nomogram for the prediction of treatment response in RA patients who were previously naive to treatment.
INTRODUCTION
Rheumatoid arthritis (RA) is the most prevalent type of autoimmune arthritis, and it affects the synovial tissue (ST), leading to joint destruction. RA is characterized by a high degree of heterogeneity in terms of ST inflammation at disease onset, likely influencing the different treatment response rates among patients (1, 2). Assessment of ST, despite having the potential to guide individual patients’ disease management, is not currently included in RA treatment recommendations (3). However, a recent analysis of the Pathobiology of Early Arthritis Cohort demonstrated the ability to refine early clinical classification criteria using synovial pathobiologic markers (1). In particular, systematic assessment of the cellular and molecular characterization of ST from treatment‐naive early RA patients revealed that discrete pathotypes mirror different ST transcriptomic signatures and prognostic profiles in RA, indicating that such an approach may be useful in deciding whether more aggressive treatment is needed (1, 4).
To date, among the available scoring methods, the Krenn synovitis score (KSS) is a feasible hematoxylin and eosin (H&E)–based staining system that includes assessment of 3 histologic features, which enables discrimination between low‐ and high‐grade synovitis in routine pathologic settings (5). Until now, the KSS has been applied mainly to ST biopsy specimens obtained during surgical procedures in patients with longstanding RA, whereas KSS scores assessed in ST biologic samples obtained from cross‐sectional cohorts are lacking. In this context, minimally invasive ultrasound (US)–guided ST biopsy is a well‐tolerated procedure for basic and translational studies of chronic inflammatory joint diseases, such as RA, that has been successfully applied, providing high‐quality tissue samples regardless of disease stage (4, 6, 7).
The aims of this study were 1) to assess the diagnostic value of the KSS using ST samples obtained from minimally invasive US‐guided biopsies in a large biologic sample data set of RA patients compared to patients with different inflammatory and noninflammatory joint diseases; 2) to identify pretreatment synovial biomarkers associated with specific disease characteristics; and 3) to predict treatment response in RA patients who were previously naive to treatment.
PATIENTS AND METHODS
Selection and management of patients
The study enrolled a total of 1,015 patients undergoing US‐guided ST biopsy at the Fondazione Policlinico Universitario A. Gemelli IRCCS–Università Cattolica del Sacro Cuore, Division of Rheumatology (SYNGem cohort). At study entry, patients were categorized based on clinical diagnosis, as shown in Supplementary Figure 1A (available available on the Arthritis & Rheumatology website at http://onlinelibrary.wiley.com/doi/10.1002/art.41726/abstract). A total of 545 patients who fulfilled the 2010 European Alliance of Associations for Rheumatology (EULAR)/American College of Rheumatology (ACR) classification criteria for RA (8) (240 patients naive to treatment with conventional disease‐modifying antirheumatic drugs [DMARDs], 213 patients resistant to conventional DMARDs, and 92 patients who had achieved sustained clinical remission and who were in remission based on the findings from US assessment of synovitis [7]), 167 patients who fulfilled the classification criteria for psoriatic arthritis (PsA) (103 patients naive to treatment with conventional DMARDs, 48 patients resistant to conventional DMARDs, and 27 who had achieved sustained clinical remission and who were in remission based on the findings from US assessment of synovitis [7, 9]), 199 patients classified as having undifferentiated peripheral inflammatory arthritis (UPIA) (10), 18 patients with crystal‐induced arthritis, 26 patients with connective tissue diseases (CTDs), and 60 patients with osteoarthritis. The clinical and laboratory parameters for the disease categories of enrolled patients are listed in Table 1. All treatment‐naive RA patients were treated according to a treat‐to‐target strategy (11). Briefly, all treatment‐naive RA patients began taking conventional DMARDs, such as methotrexate, at the maximum tolerated dosage (up to 20 mg/week) according to the recommendations for RA management (12) and were followed up every 3 months to record the DAS28‐based disease remission rate after 6 months of follow‐up (13). The study protocol was approved by the Ethics Committee of the Università Cattolica del Sacro Cuore (approval no. 6334/15). All subjects provided signed informed consent.
Table 1.
Demographic and clinical characteristics of the study patients identified from the SYNGem cohort (n = 1,105)*
|
OA (n = 60) |
Crystal‐induced arthritis (n = 18) |
CTD (n = 26) |
UPIA (n = 199) |
RA (n = 545) |
PsA (n = 167) |
|||||
|---|---|---|---|---|---|---|---|---|---|---|
|
Treatment‐naive (n = 240) |
Resistant to conventional DMARDs (n = 213) |
In remission (n = 92) |
Treatment‐naive (n = 103) |
Resistant to conventional DMARDs (n = 48) |
In remission (n = 27) |
|||||
| Female sex | 52 (86.7) | 7 (38.9) | 25 (96.2) | 151 (75.9) | 188 (78.3) | 181 (85.0) | 69 (75.0) | 66 (64.1) | 30 (62.5) | 13 (48.1) |
| Age, mean ± SEM years | 65.43 ± 1.15 | 68.88 ± 3.06 | 54.88 ± 2.64 | 53.24 ± 0.88 | 55.68 ± 1.02 | 56.81 ± 0.90 | 57.83 ± 1.51 | 55.96 ± 1.34 | 56.71 ± 1.53 | 59.18 ± 1.97 |
| Disease duration, mean ± SEM years | – | – | – | 1.82 ± 0.11 | 1.21 ± 0.05 | 6.49 ± 0.34 | 9.47 ± 0.67 | 1.53 ± 0.15 | 3.67 ± 0.44 | 7.85 ± 0.63 |
| RA status | ||||||||||
| VERA | – | – | – | – | 63 (26.3) | – | – | – | – | – |
| Early RA | – | – | – | – | 84 (35.0) | – | – | – | – | – |
| Non–early RA | – | – | – | – | 93 (38.8) | – | – | – | – | – |
| RA‐specific antibodies | 0 (0) | 0 (0) | 0 (0) | 32 (16.1) | 147 (61.3) | 124 (58.2) | 60 (65.2) | 0 (0) | 0 (0) | 0 (0) |
| ACPAs | 0 (0) | 0 (0) | 0 (0) | 27 (13.5) | 122 (50.8) | 111 (52.1) | 56 (60.9) | 0 (0) | 0 (0) | 0 (0) |
| Titer, mean ± SEM IU/ml | – | – | – | 12.00 ± 2.97 | 128.81 ± 19.50 | 125.75 ± 19.38 | 106.1 ± 223.4 | 0.17 ± 0.04 | 0.10 ± 0.00 | 0.10 ± 0.00 |
| IgM‐RF | 0 (0) | 0 (0) | 0 (0) | 10 (5.0) | 106 (44.2) | 87 (40.8) | 41 (44.6) | 0 (0) | 0 (0) | 0 (0) |
| Titer, mean ± SEM IU/ml | – | – | – | 17.31 ± 4.99 | 72.09 ± 8.31 | 79.85 ± 10.34 | 74.5 ± 136.4 | 4.84 ± 2.29 | 1.55 ± 0.80 | 1.60 ± 1.5 |
| IgA‐RF | 0 (0) | 0 (0) | 0 (0) | 5 (2.5) | 91 (42.7) | 74 (34.7) | 34 (37.0) | 0 (0) | 0 (0) | 0 (0) |
| Titer, mean ± SEM IU/ml | – | – | – | 5.14 ± 1.61 | 67.30 ± 9.17 | 51.78 ± 7.51 | 67.5 ± 138.7 | 2.73 ± 1.25 | 1.81 ± 1.34 | 1.50 ± 1.40 |
| DAS28, mean ± SEM | – | – | – | 3.96 ± 0.12 | 5.46 ± 0.08 | 5.47 ± 0.08 | 2.22 ± 0.03 | – | – | – |
| Minimal disease activity | – | – | – | – | – | – | – | – | – | 27 (100.0) |
| MTX dose up to 20 mg/week, mean ± SEM | – | – | – | – | – | 16.81 ± 0.56 | 14.67 ± 0.47 | – | 15.45 ± 0.87 | 14.98 ± 0.86 |
| Anti‐TNF usage | – | – | – | – | – | – | 92 (100.0) | – | – | 27 (100.0) |
Except where indicated otherwise, values are the number (%) of patients. RA = rheumatoid arthritis; PsA = psoriatic arthritis; OA = osteoarthritis; CTD = connective tissue disease; UPIA = undifferentiated peripheral inflammatory arthritis; DMARDs = disease‐modifying antirheumatic drugs; VERA = very early rheumatoid arthritis; ACPAs = anti–cyclic citrullinated protein antibodies; RF = rheumatoid factor; DAS28 = Disease Activity Score in 28 joints; MTX = methotrexate; anti‐TNF = anti–tumor necrosis factor.
US assessment
At baseline, each patient underwent US assessment following the same protocol (13) using gray‐scale and power Doppler sonography (PDS) of the biopsied joint. US assessment was performed by 2 rheumatologists experienced in US (MRG and LP), who were unaware of the clinical and laboratory findings. US was conducted using a commercially available real‐time scanner (MyLabTwice from Esaote). ST hypertrophy was measured (in centimeters), and a semiquantitative scoring method, which consists of a 0–3 scale, was used to grade the severity of synovitis based on power Doppler signals, in which a score of 0 = no power Doppler, 1 = minimal power Doppler, 2 = moderate power Doppler, and 3 = severe power Doppler (10, 14).
ST biopsy performance and KSS assessment
Each patient underwent US‐guided knee ST biopsy following the published protocol (15, 16). Using the US view, the best point of entrance for the biopsy needle was identified on the lateral margin of the suprapatellar recess. Each patient was provided with a face mask and cap, and the procedure was performed under sterile conditions. Skin was disinfected twice with iodine solution, starting from the point of needle entrance up to 25 cm proximally and distally. The skin, subcutaneous tissue, and joint capsule were anesthetized with 10 ml of 2% lidocaine. Next, a 14‐gauge needle (Precisa 1410‐HS Hospital Service Spa) was inserted into the joint. Regions of synovial hypertrophy were identified under gray‐scale guidance to ensure sampling of representative ST. As shown in Supplementary Figure 1A (available on the Arthritis & Rheumatology website at http://onlinelibrary.wiley.com/doi/10.1002/art.41726/abstract), all ST specimens obtained (at least 6–8 fragments) were fixed in 10% neutral buffered formalin, embedded in paraffin, sectioned at 3 μm, and stained with H&E as follows: sections were deparaffinized in xylene and rehydrated in a series of graded ethanol, stained in hematoxylin, and counterstained in eosin/phloxine. Finally, sections were dehydrated, cleared in xylene, and mounted with Bio Mount (Bio‐Optica).
Slides were examined using a light microscope (Leica DM2000) by 2 trained pathologists (MG and FF) who were unaware of the patients’ clinical and immunologic characteristics. Synovitis severity was graded according to 3 ST features (synovial lining cell layer, stromal cell density, and inflammatory infiltrates), each ranked on a scale where 0 = none, 1 = slight, 2 = moderate, and 3 = strong. The analysis was done manually and included assessment of the whole tissue sections (at least 2 sequential sections for each patient) (mean ± SEM number of sections 2.29 ± 0.10 sections), and the highest score obtained from the analysis was recorded. The values of the parameters were summed and interpreted as follows: a score of 0–1 = no synovitis, 2–4 = low‐grade synovitis, and 5–9 = high‐grade synovitis (5) (Supplementary Figures 1B and C, available on the Arthritis & Rheumatology website at http://onlinelibrary.wiley.com/doi/10.1002/art.41726/abstract).
Moreover, the presence or absence of lymphocytes, plasma cells, and mucin was assessed for each ST sample. Briefly, using a high‐magnification field of the whole tissue section, cells were considered to be lymphocytes if they were as small as erythrocytes and consisted almost entirely of nuclei and had only minimal cytoplasm visible on deep staining with hematoxylin. Conversely, cells were defined as plasma cells if they were larger than lymphocytes, were a round‐to‐ovoid shape containing abundant cytoplasm with a pale perinuclear area corresponding to the Golgi apparatus, and had a round, eccentrically placed nucleus with coarse chromatin arranged in a clock face (art wheel) pattern (Supplementary Figures 2A and B, available on the Arthritis & Rheumatology website at http://onlinelibrary.wiley.com/doi/10.1002/art.41726/abstract). The microanatomic organization of ST inflammation was categorized into “aggregate” or “no aggregate” based on the presence of inflammatory cell aggregates within 2 sequential ST sections in the same patient: if no inflammatory cell aggregates were found in the whole tissue section, the synovitis pattern was defined as “no aggregate.”
Finally, 97 ST samples obtained from treatment‐naive RA patients were processed for pathotype assessment using immunohistochemical (IHC) analysis. This is described in the Supplementary Materials and Methods (available on the Arthritis & Rheumatology website at http://onlinelibrary.wiley.com/doi/10.1002/art.41726/abstract).
Statistical analysis
The statistical analysis was performed using SPSS version 20.0 and GraphPad Prism software packages. Categorical and quantitative variables were described using frequencies, percentages, and mean ± SEM. Demographic and clinical features were compared between patients using the nonparametric Mann‐Whitney U test or chi‐square test, as appropriate. Spearman’s rank correlation test was used for assessment of correlation between variables in all analyses.
An exploratory univariate analysis was first conducted to assess adequate event frequency between the outcomes and the candidate prognostic factors. Univariate associations between candidate predictors and outcomes were assessed using multivariable logistic regression analyses. In particular, predictors with univariate associations (P < 0.05) were included in the multivariable model. Finally, a nomogram was built to distinguish between treatment‐naive RA patients with the outcome (i.e., achievement of clinical remission at 6 months following treatment initiation, assessed according to the DAS28) and those without the outcome. The performance of the nomogram was assessed using discrimination and calibration analyses. The discriminative ability of the model was determined by the area under the receiver operating characteristic (ROC) curve, which ranged from 0.5 (no discrimination) to 1 (perfect discrimination). The calibration of the prediction model was performed using a visual calibration plot comparing the predicted and actual probability of remission. In addition, the nomogram was subjected to 1,000 bootstrap resamples for internal validation, to assess their predictive accuracies. The model was developed and validated.
All statistical analyses and generation of graphics were performed using the Regression Modeling Strategies package of R 3.5.3 (The R Foundation). For all analyses, P values less than 0.05 were considered significant, and all tests were 2‐tailed, unless otherwise indicated.
RESULTS
Effect of disease phase on features of synovial inflammation in RA and other chronic inflammatory joint diseases
Table 1 shows the demographic and clinical characteristics of the 1,015 enrolled patients. As shown in Figure 1A, KSS category distribution was contingent on disease category in patients with inflammatory and noninflammatory joint diseases. In particular, treatment‐naive RA patients had the highest rate of high‐grade synovitis (54.6%) compared to OA patients (2.9%; P < 0.0001) (Figure 1B). Moreover, treatment‐naive RA patients had higher KSS scores (mean ± SEM 4.81 ± 0.15) compared to UPIA patients (2.80 ± 0.14; P < 0.001), treatment‐naive PsA patients (3.00 ± 0.17; P < 0.001), CTD patients (2.90 ± 0.50; P < 0.001), patients with crystal‐induced arthritis (3.44 ± 0.42; P = 0.01), and OA patients (1.70 ± 0.15; P < 0.001) (Figure 1C).
Figure 1.

Degree of synovial tissue (ST) inflammation in relation to disease category among patients with inflammatory and noninflammatory joint conditions in the SYNGem cohort. A, Distribution of Krenn synovitis scores (KSS) according to disease category among patients with osteoarthritis (OA) (n = 60), patients who achieved sustained clinical remission (Rem) and ultrasound (US) imaging–based remission (psoriatic arthritis [PsA] n = 27, rheumatoid arthritis [RA] n = 92), patients with crystal‐induced arthritis (n = 18), patients with connective tissue diseases (CTDs) (n = 26), patients with undifferentiated peripheral inflammatory arthritis (UPIA) (n = 199), patients resistant to treatment with conventional disease‐modifying antirheumatic drugs (PsA n = 48, RA n = 47), and treatment‐naive patients (PsA n = 103, RA n = 240). B, Degree of synovitis according to disease category. C, Distribution of mean KSS scores according to disease category. Each circle represents a single patient; values are the mean ± SEM. D, Follicular synovitis based on presence versus absence of inflammatory cell aggregates within 2 sequential ST sections from OA patients and RA patients stratified by disease category. E, Correlation between KSS scores and Disease Activity Scores in 28 joints (DAS28) in RA patients (n = 545) stratified by disease category.
Considering the different disease phases, the KSS was higher in treatment‐naive RA patients (mean ± SEM 4.81 ± 0.15) and in RA patients resistant to conventional DMARDs (4.24 ± 0.15) compared to RA patients who had achieved sustained remission (1.69 ± 0.13; P < 0.0001, by analysis of variance [ANOVA]); similar findings were observed in PsA patients (treatment‐naive PsA patients and PsA patients resistant to conventional DMARDs had scores of 3.00 ± 0.17 and 3.73 ± 0.42 in treatment‐naive PsA patients and PsA patients resistant to conventional DMARDs, respectively, versus 2.04 ± 0.26 in PsA patients who had achieved sustained remission; P = 0.0023, by ANOVA) (Figure 1C). Moreover, considering the 3 subitems composing the KSS, treatment‐naive RA patients had significantly higher KSS scores for synovial hyperplasia (P = 0.0064), stromal cell density (P = 0.0366), and inflammatory infiltrates (P = 0.0235) when compared to the KSS scores for these components in RA patients resistant to conventional DMARDs (Supplementary Figure 3A, available on the Arthritis & Rheumatology website at http://onlinelibrary.wiley.com/doi/10.1002/art.41726/abstract).
In analyzing the semiqualitative composition of the ST infiltrates, ST from treatment‐naive RA patients was more likely to be enriched with plasma cells (65.4%), lymphocytes (95.0%), and mucin (87.1%) than ST from RA patients resistant to conventional DMARDs (56.3% plasma cells [P < 0.0001], 90.1% lymphocytes [P < 0.0001], 79.3% mucin [P < 0.0001]) and RA patients who had achieved sustained remission (26.1% plasma cells [P < 0.0001], 65.2% lymphocytes [P < 0.0001], and 68.5% mucin [P < 0.0001]) (Supplementary Figures 3B–D, available on the Arthritis & Rheumatology website at http://onlinelibrary.wiley.com/doi/10.1002/art.41726/abstract). Moreover, in RA, the microanatomic organization of the ST inflammatory infiltrate was dependent on disease phase, and there was a significant reduction in the synovial inflammatory cell aggregate rate in RA patients who had achieved sustained remission (19.5%) compared to treatment‐naive RA patients (48.8%; P < 0.001) or RA patients resistant to conventional DMARDs (43.7%; P < 0.001) (Figure 1D). Finally, analyzing the whole RA cohort (n = 545), the KSS of the biopsied joint directly correlated with the DAS28 at the time that the ST biopsy was performed (P < 0.001) (Figure 1E). Hence, results from the assessment of ST directly mirror the disease activity status across the whole disease course of RA.
Effect of US features on KSS in RA and other chronic inflammatory joint diseases
Assessment of synovial hypertrophy and findings from PDS of the biopsied joint were recorded for each patient and compared across different disease categories (Figure 2A). As shown in Figure 2B, treatment‐naive RA patients had higher ST thickness than OA patients (P < 0.001). Moreover, ST hyperplasia was contingent on disease phase in both RA patients (mean ± SEM degree of synovial hypertrophy 1.10 ± 0.03 cm, 1.0 ± 0.02 cm, and 0.84 ± 0.02 cm in treatment‐naive RA patients, RA patients resistant to conventional DMARDs, and RA patients in sustained remission, respectively; P < 0.0001 by ANOVA) and PsA patients (mean ± SEM 1.12 ± 0.04 cm, 1.15 ± 0.05 cm, and 0.90 ± 0.06 cm in treatment‐naive PsA patients, PsA patients resistant to conventional DMARDs, and PsA patients in sustained remission, respectively; P = 0.0112 by ANOVA) (Figure 2B).
Figure 2.

Features of US‐assessed synovitis in relation to disease category among patients with RA and other chronic inflammatory joint diseases in the SYNGem cohort. A, Images from power Doppler sonography (PDS) assessment of knee ST from patients in each disease category. B, Distribution of the degree of synovial membrane hypertrophy (SMH), measured as ST thickness on PDS, in the biopsied joints of patients according to disease category. In treatment‐naive RA patients, ST thickness was significantly higher than that in OA patients (mean ± SEM 1.10 ± 0.03 cm versus 0.75 ± 0.04 cm; P < 0.001), but did not differ from that in UPIA patients (1.01 ± 0.02 cm; P = 0.1733). C, Distribution of PD synovial hypertrophy scores in the ST biopsy samples from patients according to disease category. In treatment‐naive RA patients, PD scores were significantly higher than those in UPIA patients (1.71 ± 0.10 versus 1.24 ± 0.07; P < 0.001), CTD patients (1.26 ± 0.19; P = 0.03), and OA patients (0.38 ± 0.07; P < 0.001), but were similar to that in RA patients resistant to treatment (1.58 ± 0.10; P = 0.27) and patients with crystal‐induced arthritis (1.67 ± 0.25; P = 0.88). In B and C, each circle represents a single patient; values are the mean ± SEM. See Figure 1 for other definitions.
When considering the extent of disease activity in the ST samples, treatment‐naive RA patients had a higher power Doppler score in the biopsied joint than that when compared to UPIA patients (P < 0.001), CTD patients (P = 0.03), and OA patients (P <0.001), but the scores were similar to those of RA patients resistant to conventional DMARDs (P = 0.27) and patients with crystal‐induced arthritis (P = 0.88). Additionally, the power Doppler score directly correlated with the KSS in the corresponding joint in the whole study cohort (P < 0.0001), as well as in RA patients (P < 0.0001), PsA patients (P = 0.002), and UPIA patients (P = 0.004) (Supplementary Figures 4A–D, available on the Arthritis & Rheumatology website at http://onlinelibrary.wiley.com/doi/10.1002/art.41726/abstract).
Effect of disease characteristics on KSS and synovial inflammation in treatment‐naive RA patients
In stratifying treatment‐naive RA patients (n = 240) based on demographic characteristics (age and sex), there were no significant differences in terms of KSS distribution (data not shown). However, when considering treatment‐naive RA patients according to the time since the onset of symptoms to the time of ST biopsy, treatment‐naive RA patients whose ST was biopsied within 3 months of joint symptom onset had lower KSS scores (mean ± SEM 4.11 ± 0.26) than RA patients whose ST was analyzed within 3–12 months (4.88 ± 0.26; P = 0.04) or >12 months (5.19 ± 0.23; P = 0.002) since symptom onset (Figures 3A–C). Moreover, treatment‐naive RA patients whose ST was biopsied within 3 months of joint symptom onset had lower scores for synovial hyperplasia, stromal cell density, and inflammatory infiltrates (mean ± SEM 1.37 ± 0.12, 1.49 ± 0.10, and 1.26 ± 0.10, respectively) when compared to RA patients whose ST was biopsied >12 months since the onset of symptoms (mean ± SEM scores 1.79 ± 0.10, 1.81 ± 0.10, and 1.62 ± 0.10, respectively; P = 0.007, P = 0.01, and P = 0.01, respectively) (Figure 3D). However, the microanatomic organization of the synovial inflammatory infiltrates, in terms of the follicular structure, did not differ when comparing RA patients whose ST was biopsied within 3 months of the onset of joint symptoms (44.4%) and RA patients whose ST was biopsied within 3–12 months (47.6%; P = 0.740) or >12 months (52.7%; P = 0.332) since symptom onset (Figure 3E), as well as when comparing the percentages of plasma cells, lymphocytes, and mucin in the ST (Supplementary Figures 5A–C, available on the Arthritis & Rheumatology website at http://onlinelibrary.wiley.com/doi/10.1002/art.41726/abstract). Finally, US features in treatment‐naive RA patients did not differ based on the timeframe from joint symptom onset (Supplementary Figures 6A–B, available on the Arthritis & Rheumatology website at http://onlinelibrary.wiley.com/doi/10.1002/art.41726/abstract).
Figure 3.

ST inflammation in relation to disease characteristics in treatment‐naive RA patients. A, Hematoxylin and eosin staining of ST obtained using minimally invasive US‐guided biopsy of the knees of treatment‐naive RA patients. Each image shows a biopsy sample from an individual patient according to disease duration (time since symptom onset to time of biopsy <3 months [MO], 3–12 months, or >12 months). B, Distribution of mean KSS scores in treatment‐naive RA patients according to disease duration. C, Heatmap showing distribution of KSS scores in treatment‐naive RA patients according to disease duration. Each bar represents a single patient. D, Distribution of mean scores for subcomponents of the KSS (synovial hyperplasia, stromal cell density, and inflammatory infiltrates) in treatment‐naive RA patients according to disease duration. In B and D, each circle represents a single patient; values are the mean ± SEM. E, Follicular synovitis based on presence versus absence of inflammatory cell aggregates in treatment‐naive RA patients according to disease duration. See Figure 1 for other definitions.
To determine whether the semiquantitative evaluation of the degree of synovitis using the KSS is representative of the cellular composition of synovial inflammation, 97 ST samples from treatment‐naive RA patients were analyzed by IHC for the distribution of CD68, CD20, CD3, and CD138 cells (Supplementary Table 1, available on the Arthritis & Rheumatology website at http://onlinelibrary.wiley.com/doi/10.1002/art.41726/abstract), revealing that treatment‐naive RA patients with a lympho‐myeloid pathotype had the highest KSS scores (mean ± SEM 5.67 ± 0.26) compared to treatment‐naive RA patients with a diffuse myeloid pathotype (4.06 ± 1.71; P < 0.0001) and those with a pauci‐immune pathotype (2.30 ± 0.26; P < 0.0001) (Supplementary Figure 7A, available on the Arthritis & Rheumatology website at http://onlinelibrary.wiley.com/doi/10.1002/art.41726/abstract). Moreover, KSS‐based evaluation of the degree of synovitis directly correlated with IHC‐based synovitis assessment in terms of CD68, CD20, CD3, and CD138 IHC scores (Supplementary Figure 7B). Interestingly, ROC curve analysis revealed that a KSS of ≥6 had significant capacity to identify treatment‐naive RA patients who were more likely to have a lympho‐myeloid pathotype (51.0% sensitivity, 82.6% specificity; area under the curve [AUC] 0.79 [95% confidence interval (95% CI) 0.70–0.89] [P < 0.0001]). Conversely, a KSS of ≤2 had greater capacity to identify treatment‐naive RA patients were are more likely to have a pauci‐immune pathotype (50.0% sensitivity, 96.5% specificity; AUC 0.09 [95% CI 0.02–0.17] [P < 0.0001]) (Supplementary Figures 7C and D).
Since autoantibody positivity was found to be related to the composition of ST inflammation in RA (17), the study cohort was stratified based on the presence of anti–cyclic citrullinated protein antibodies (ACPAs) and/or IgM–rheumatoid factor (IgM‐RF) and IgA‐RF at the time that ST biopsy was performed. Treatment‐naive RA patients positive for ACPA and/or IgM/IgA‐RF had higher KSS scores (mean ± SEM 5.05 ± 0.19) than RA patients negative for ACPA and/or IgM/IgA‐RF (4.43 ± 0.22; P = 0.04) (Supplementary Figure 8A, available on the Arthritis & Rheumatology website at http://onlinelibrary.wiley.com/doi/10.1002/art.41726/abstract), and treatment‐naive RA patients negative for ACPA and/or IgM/IgA‐RF had significantly higher KSS scores (4.43 ± 0.22) compared to treatment‐naive PsA patients (2.99 ± 0.17; P < 0.0001). Interestingly, treatment‐naive RA patients positive for IgM/ ACPA and/or IgA‐RF had significantly higher scores for inflammatory infiltrates (mean ± SEM 1.61 ± 0.07) compared to treatment‐naive RA patients negative for ACPA and/or IgM/IgA‐RF (1.35 ± 0.09; P = 0.03), whereas no significant difference in the scores for synovial hyperplasia or stromal cell density were observed between the positive and negative autoantibody groups (Supplementary Figures 8B–D). Moreover, the KSS directly correlated with plasma levels of ACPAs (P = 0.016), IgM‐RF (P = 0.009), and IgA‐RF (P = 0.005) in treatment‐naive RA patients (Supplementary Figures 8E–G), whereas no significant differences were found in KSS scores in RA patients resistant to conventional DMARDs or in RA patients who had achieved sustained remission based on autoantibody positivity (Supplementary Figures 8A–D).
In analyses of the composition of ST inflammatory infiltrates, ST from treatment‐naive RA patients positive for ACPA and/or IgM/IgA‐RF was enriched with plasma cells to a greater extent than ST from treatment‐naive RA patients negative for ACPA and/or IgM/IgA‐RF (72.1% versus 54.8%; P = 0.006) (Figure 4A). Conversely, no significant differences in terms of lymphocytes and mucin presence were found when RA patients were stratified based on presence versus absence of ACPA and/or IgM/IgA‐RF (Figures 4B–C). Therefore, the timing of first medical referral, the autoimmune features, and the baseline disease burden significantly impact the degree of ST inflammation in treatment‐naive RA patients.
Figure 4.

Composition of ST inflammation in relation to disease category and autoantibody status. A–C, Left, Hematoxylin and eosin (H&E) staining of ST obtained using minimally invasive US‐guided biopsy of the knee. Images show ST from treatment‐naive RA patients positive for ACPA and/or IgM/IgA–rheumatoid factor autoantibodies (Abpos), displaying enrichment of plasma cells (A) and infiltration of lymphocytes (B) and mucin (C) (indicated by green arrowheads). Original magnification × 40. Right, Results of H&E staining quantified as the percentage of plasma cells (A), lymphocytes (B), and mucin (C) among patients with PSA in each disease category, RA patients in each disease category stratified by autoantibody status, UPIA patients stratified by autoantibody status, and OA patients. See Figure 1 for other definitions.
Baseline KSS as a predictor of early achievement of DAS28‐based remission in treatment‐naive RA patients
Among the 240 enrolled treatment‐naive RA patients, 217 (90.4%) reached at least 6 months of follow‐up, of whom 86 (39.6%) achieved DAS28‐based remission. A total of 23 patients (9.6%) were lost to follow‐up. The baseline characteristics that were differentially distributed among treatment‐naive RA patients based on achievement of DAS28‐based remission at 6 months were investigated. The comparison revealed that DAS28 scores at baseline were lower in treatment‐naive RA patients achieving DAS28‐based remission at 6 months compared to those who did not achieve DAS28‐based remission at 6 months (mean ± SEM 5.00 ± 0.12 versus 5.83 ± 0.10; P < 0.001), and patients in the remission group were more likely referred to a first medical evaluation within 3 months of symptom onset compared to patients in the no remission group (37.2% versus 19.8%; P = 0.005). In addition, the characteristics of the ST samples identified by US at baseline did not differ in treatment‐naive RA patients with or without achievement of DAS28‐based remission at 6 months (Supplementary Table 2. available on the Arthritis & Rheumatology website at http://onlinelibrary.wiley.com/doi/10.1002/art.41726/abstract). However, treatment‐naive RA patients who achieved DAS28‐based remission at 6 months had lower KSS scores at baseline (mean ± SEM 4.24 ± 0.25) than treatment‐naive RA patients who did not achieve this outcome (5.26 ± 0.18; P < 0.001) (Figure 5A and Supplementary Table 2).
Figure 5.
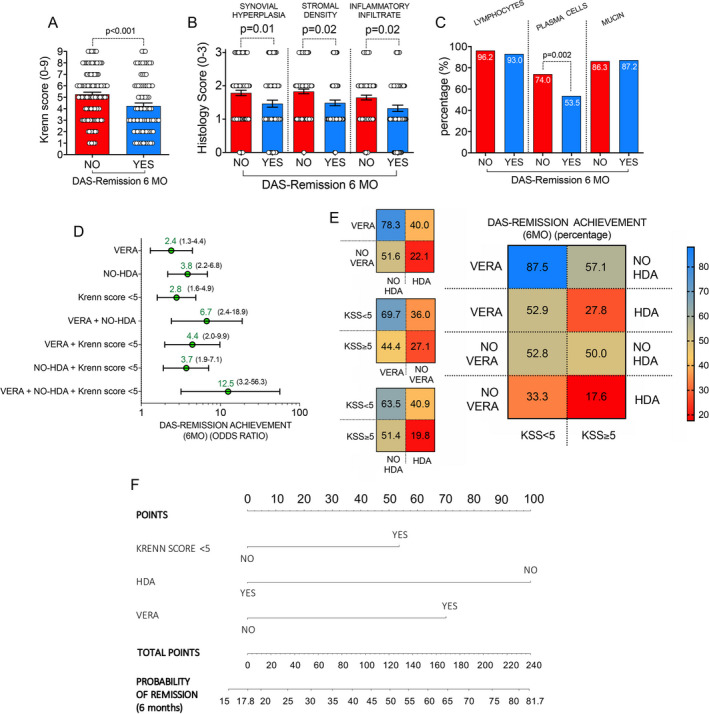
Nomogram for the prediction of early achievement of clinical remission based on the Disease Activity Score in 28 joints (DAS28) in treatment‐naive RA patients. A and B, Distribution of mean KSS scores (A) and mean histology scores for subcomponents of the KSS (B) in treatment‐naive RA patients based on achievement versus lack of achievement of DAS28‐based clinical remission at 6 months (MO). Each circle represents a single patient; values are the mean ± SEM. C, Distribution of lymphocytes, plasma cells, and mucin presence in ST from treatment‐naive RA patients based on presence versus absence of achievement of DAS28‐based clinical remission at 6 months. D and E, Odds of achieving DAS28‐based remission at 6 months (D) and percentage of patients achieving DAS28‐based remission at 6 months (E) among treatment‐naive RA patients according to different baseline characteristics, including presence versus absence of very early RA (VERA), presence versus absence of high disease activity (HDA), and a KSS score categorized as <5 versus ≥5. Values in D are the odds ratio (with 95% confidence interval) for achievement of DAS28‐based remission at 6 months. F, Nomogram for the computation of the probability of achieving DAS28‐based remission at 6 months in treatment‐naive RA patients. See Figure 1 for other definitions.
In considering the 3 components of synovial inflammation assessed in the KSS, scores for synovial hyperplasia, stromal cell density, and inflammatory infiltrates were significantly lower at baseline in treatment‐naive RA patients achieving DAS28‐based remission at 6 months compared to those who did not achieve DAS28‐based remission at 6 months (mean ± SEM scores 1.47 ± 0.11, 1.49 ± 0.09, and 1.33 ± 0.10, respectively, in the remission group versus 1.79 ± 0.08, 1.83 ± 0.07, and 1.65 ± 0.07, respectively, in the no remission group; P = 0.01, P = 0.02, and P = 0.02, respectively) (Figure 5B). In addition, fewer ST samples from treatment‐naive RA patients who achieved DAS28‐based remission at 6 months were enriched with plasma cells at baseline compared to ST samples from RA patients who did not achieve 6‐month DAS28‐based remission (53.5% versus 74.0% of ST samples enriched with plasma cells; P = 0.002) (Figure 5C).
ROC curve analysis revealed that, compared to a KSS of ≥5, a KSS of <5 at baseline was more likely to identify treatment‐naive RA patients who would achieve DAS28‐based remission at 6 months (53.1% with KSS <5 versus 28.9% with KSS ≥5 achieving DAS28‐based remission at 6 months; AUC 0.66 [95% CI 0.57–0.74] [P = 0.001]), with an odds ratio (OR) of 2.8 (95% CI 1.6–4.9) (P < 0.001); similar findings from ROC curve analyses were obtained in treatment‐naive patients with very early RA (VERA) compared to those who did not develop VERA (non‐VERA) (55.2% versus 34.0% achieving DAS28‐based remission at 6 months; OR 2.4 [95% CI 1.3–4.4] [P = 0.01]) and in treatment‐naive RA patients who did not have high disease activity at baseline compared to those who had high disease activity at baseline (58.6% versus 26.9% achieving DAS28‐based remission at 6 months; OR 3.8 [95% CI 2.2–6.8] [P < 0.001]).
Both treatment‐naive VERA patients and treatment‐naive non‐VERA patients with a KSS of <5 at baseline were more likely to achieve DAS28‐based remission at 6 months compared to treatment‐naive VERA patients and treatment‐naive non‐VERA patients with a KSS of ≥5 at baseline (42.2% of VERA patients and 44.4% of non‐VERA patients achieving remission in the KSS <5 group versus 16.7% of VERA patients and 27.1% of non‐VERA patients achieving remission in the KSS ≥5 group; P = 0.011 for VERA patients with KSS <5 versus VERA patients with KSS ≥5, P = 0.01 for non‐VERA patients with KSS <5 versus non‐VERA patients with KSS ≥5) (Figure 5D, Supplementary Figures 9A–D, and Supplementary Figures 10A and B, available on the Arthritis & Rheumatology website at http://onlinelibrary.wiley.com/doi/10.1002/art.41726/abstract). Interestingly, treatment‐naive VERA patients with low‐grade synovitis (KSS <5) and without high disease activity at baseline were more likely to achieve DAS28‐based remission at 6 months than treatment‐naive RA patients not fulfilling all these criteria (87.5% versus 17.6% achieving remission; OR 32.7 [95% CI 6.4–150.5] [P < 0.0001]) (Figure 5E).
Nomogram for the prediction of early achievement of DAS28‐based remission in treatment‐naive RA patients
Based on the variables incorporated into the final regression analysis, a nomogram was constructed including the 3 significant risk factors (having VERA, not having high disease activity at baseline, and having a KSS of <5) to predict the achievement of DAS28‐based remission at 6 months in treatment‐naive RA patients (Figure 5F). The value of each variable was given a score on the points scale axis. A total score was calculated by adding each single‐point score and projecting the value of the “total points” score to the lower “probability” line. The nomogram was validated, and as shown in Supplementary Figure 11 (available on the Arthritis & Rheumatology website at http://onlinelibrary.wiley.com/doi/10.1002/art.41726/abstract), a calibration curve confirmed that the probability of remission predicted by the nomogram was consistent with the actual probabilities.
DISCUSSION
This study is the first to apply semiquantitative assessment of ST inflammation to the largest available data set of ST samples at a single center (n = 1,015) obtained by minimally invasive US‐guided biopsy from cross‐sectional cohorts of patients with inflammatory diseases and patients with noninflammatory diseases who were stratified based on disease phase. The results of this study show that the KSS is a reliable tool to apply in the semiquantitative assessment of synovitis, not only in RA, but also in other different inflammatory and noninflammatory joint disorders. In particular, in treatment‐naive RA patients, the KSS is contingent on patients’ characteristics (i.e., autoantibody positivity), disease activity, and treatment response, and the integration of the KSS, at the time of the first medical evaluation, within a multiparametric nomogram enabled prediction of 6‐month achievement of DAS28‐based remission in up to 80% of treatment‐naive RA patients.
Differential response rates to various therapies in RA may partially be a result of the high heterogeneity of the degree of inflammation of RA target tissue, the synovial membrane (18). In this context, at the ST level, treatment‐naive RA patients may display 3 specific pathotypes in terms of the microanatomic organization of inflammation and the transcriptomic signature, which are directly linked to different clinical phenotypes, disease activity/severity, and response to treatment with conventional DMARDs (4). Moreover, using ST/peripheral blood paired samples, the ST immune response was shown to be associated with differential blood immune signals (19), and interestingly, the elevation of myeloid‐ and lymphoid‐associated ST gene expression strongly correlates with conventional DMARD response in treatment‐naive RA patients at 6 months (4).
The KSS has been previously developed and validated using ST surgery specimens, thereby enabling semiquantitative categorization of patients according to degrees of synovitis in large cohorts, including low‐ and high‐grade synovitis in patients with longstanding RA and OA (5). The KSS may also reflect clinical disease activity in patients with longstanding RA (20). Additionally, synovitis semiquantification using H&E staining enabled the categorization of RA patients into different histologic subtypes (low, mixed, and high inflammation) that can predict ST genomic subtypes associated with disease‐specific features (i.e., systemic inflammation and autoantibody positivity) (2).
Therefore, the semiquantitative assessment of ST inflammation using the KSS was included in the set of items for the analysis of synovial biopsy specimens in clinical practice and translational research from the EULAR Synovitis and Outcome Measures in Rheumatology ST Biopsy Groups (21). However, to date, despite being widely used in clinical and translational research, no studies have widely applied this tool for the semiquantitative assessment of inflammation in ST samples obtained using minimally invasive US‐guided ST biopsies from cross‐sectional cohorts (4, 22). The findings from this study show that KSS scores are differentially distributed among inflammatory and noninflammatory joint disorders and are significantly increased in treatment‐naive RA patients compared to patients with other forms of inflammatory diseases (i.e., PsA) or low‐grade inflammatory joint diseases (i.e., OA) and is contingent on the disease phase mirroring the disease activity (i.e., DAS28) in RA.
Large cohort studies identified a 3‐month window of opportunity as the time with the best therapeutic chance for a patient to achieve complete disease remission and stop bone damage in RA (23, 24, 25, 26); however, no studies have explored the impact of joint symptom duration on ST inflammatory features in treatment‐naive RA patients. In particular, in considering RA classification criteria, RA patients who fulfilled the ACR 1997 criteria for RA (27) had higher KSS scores than RA patients who fulfilled the 2010 ACR/EULAR criteria for RA (28) without any difference in terms of the frequencies of ST pathotypes, regardless of symptom duration (1). Our findings show that treatment‐naive VERA patients (<3 months since symptom onset) have lower KSS scores than treatment‐naive RA patients who were referred to a first medical evaluation >12 months since symptom onset, despite no differences in the microanatomic organization of the inflammatory infiltrate, suggesting that ST inflammation dynamically changes during the course of RA. These findings provide biologic support for early intervention in RA disease management aimed at achieving the highest possible remission rate (24) and suggest that ST analysis within 3 months of symptom onset is very likely the most informative time point to predict the future course of the disease.
In the context of biomarkers for RA patient stratification, ACPA and RF positivity can be used to identify RA patients with the highest likelihood of developing early bone erosions (29, 30), chronic destructive disease (31, 32), and extraarticular manifestations (33, 34). IHC assessment showed that ST from treatment‐naive RA patients positive for ACPAs is more enriched with B lymphocytes and lymphoid aggregates than ST from RA patients negative for ACPAs and is related to higher rate of erosive disease and a worse prognosis (17). In our study, H&E‐based staining of ST revealed that the KSS is higher in patients positive for IgM/IgA‐RF and/or ACPA than treatment‐naive RA patients negative for IgM/IgA‐RF and/or ACPA, which directly correlated with ACPA and IgM/IgA‐RF plasma levels at the time that ST biopsy was performed. In addition, the systematic analysis of disease phase in cross‐sectional RA cohorts showed that this difference is lost when considering RA patients resistant to conventional DMARDs and patients with RA in sustained remission. Moreover, at a treatment‐naive stage, ST from RA patients positive for IgM/IgA‐RF and/or ACPA was found to be more enriched with plasma cells than ST from RA patients negative for IgM/IgA‐RF and/or ACPA, as previously described (35), supporting the reliability of this H&E‐based scoring method.
Precision medicine is an approach to disease treatment that considers individual pathobiologic variability to more accurately predict which treatment strategies will be more successful in specific groups of patients. In this context, RA may be an ideal setting for patient stratification aimed at treatment optimization. In this study, we identified and validated a cutoff value of KSS scores based on which treatment‐naive RA patients with ST with a KSS of <5 at the first medical evaluation are more likely to achieve DAS28‐based remission at 6 months. These findings were confirmed even after patient stratification based on disease duration and activity, with both confirmed as prognostic factors of treatment success (24, 36). Moreover, as is used in cancer and in other chronic inflammatory diseases (37, 38), we developed the first multiparametric nomogram (SYNGem nomogram) that is able to easily predict the probability of early achievement of DAS28‐based remission in treatment‐naive RA patients at a first medical evaluation. Based on the proposed nomogram, treatment‐naive RA patients without high disease activity, at a first medical evaluation within 3 months since the onset of joint symptoms, and with a KSS of <5 have an 81.7% probability of achieving DAS28‐based remission at 6 months compared to treatment‐naive RA patients who did not fulfill any of the abovementioned criteria, whose probability of achieving DAS28‐based remission drops to 17.8%. This easy tool may be useful for stratification of patients with early disease in clinical practice, in particular, in predicting whether treatment‐naive patients with very early RA will require more intensive treatment, with the goal of optimization of disease management.
Despite being the first cross‐sectional study to include ST samples collected using minimally invasive US‐guided biopsy, the limitations of this study include the lack of information about the cell‐specific contribution (i.e., myeloid and lymphoid) within ST inflammation, which could be solved by combining IHC staining (including staining of CD68, CD20, CD3, and CD138 cells) (1, 4). The inclusion of IHC staining of these cells led to a better sensitivity and specificity than KSS scores when treating patients with longstanding RA taking immunosuppressants, representing a more functional synovitis evaluation (6, 39). However, in this study, KSS‐based assessment of synovitis was contingent on the synovial pathotype defined using IHC assessment, directly correlating with the IHC scores of all the cells identified as playing a role in synovial inflammation, including CD68, CD20, CD3, and CD138 cells (1). Therefore, despite the KSS, semiquantitative assessment of the degree of ST inflammation is simple, with high rates of interreader and intrareader agreement, and it is informative for predicting response to first‐line therapy. In patients with more advanced clinical phases of RA, deeper analyses of immunomolecular functions and transcriptomic signatures could be helpful to define therapeutic strategies and interpret their outcomes.
In conclusion, the semiquantitative assessment of the degree of synovitis, using the H&E‐based KSS method, is a reliable tool to apply to biologic samples obtained using a minimally invasive technique in the routine clinical care of RA. Additionally, synovitis assessment of treatment‐naive RA patients at a first medical evaluation may help identify important disease characteristics for prognosis, and such an approach may be included in future multiparametric algorithms aimed at optimizing disease management.
AUTHOR CONTRIBUTIONS
All authors were involved in drafting the article or revising it critically for important intellectual content, and all authors approved the final version to be published. Dr. Alivernini had full access to all of the data in the study and takes responsibility for the integrity of the data and the accuracy of the data analysis.
Study conception and design
Alivernini, Tolusso, Gremese.
Acquisition of data
Alivernini, Gessi, Gigante, Petricca, Perniola, Di Mario, Bui, Fedele, Capacci, Bruno, Peluso, Gremese.
Analysis and interpretation of data
Alivernini, Tolusso, Gessi, Mannocci, La Torre, Federico, Ferraccioli, Gremese.
Supporting information
Fig S1
Fig S2
Fig S3
Fig S4
Fig S5
Fig S6
Fig S7
Fig S8
Fig S9
Fig S10
Fig S11
Table S1‐S2
Supplementary Material
Supplementary Material
ACKNOWLEDGMENT
We thank all patients who agreed to participate in our study.
No potential conflicts of interest relevant to this article were reported.
Contributor Information
Stefano Alivernini, Email: stefano.alivernini@unicatt.it.
Elisa Gremese, Email: elisa.gremese@unicatt.it.
References
- 1.Lliso‐Ribera G, Humby F, Lewis M, Nerviani A, Mauro D, Rivellese F, et al. Synovial tissue signatures enhance clinical classification and prognostic/treatment response algorithms in early inflammatory arthritis and predict requirement for subsequent biological therapy: results from the pathobiology of early arthritis cohort (PEAC). Ann Rheum Dis 2019;78:1642–52. [DOI] [PMC free article] [PubMed] [Google Scholar]
- 2.Orange DE, Agius P, DiCarlo EF, Robine N, Geiger H, Szymonifka J, et al. Identification of three rheumatoid arthritis disease subtypes by machine learning integration of synovial histologic features and RNA sequencing data. Arthritis Rheumatol 2018;70:690–701. [DOI] [PMC free article] [PubMed] [Google Scholar]
- 3.Smolen JS, Landewé R, Bijlsma J, Burmester GR, Dougados M, Kerschbaumer A, et al. EULAR recommendations for the management of rheumatoid arthritis with synthetic and biological disease‐modifying antirheumatic drugs: 2019 update. Ann Rheum Dis 2020;79:685–99. [DOI] [PubMed] [Google Scholar]
- 4.Humby F, Lewis M, Ramamoorthi N, Hackney JA, Barnes MR, Bombardieri M, et al. Synovial cellular and molecular signatures stratify clinical response to csDMARD therapy and predict radiographic progression in early rheumatoid arthritis patients. Ann Rheum Dis 2019;78:761–72. [DOI] [PMC free article] [PubMed] [Google Scholar]
- 5.Krenn V, Morawietz L, Burmester GR, Kinne RW, Mueller‐Ladner U, Muller B, et al. Synovitis score: discrimination between chronic low‐grade and high‐grade synovitis. Histopathology 2006;49:358–64. [DOI] [PubMed] [Google Scholar]
- 6.Alivernini S, Bruno B, Tolusso B, Bui L, Petricca L, Gigante MR, et al. Differential synovial tissue biomarkers among psoriatic arthritis and rheumatoid factor/anti‐citrulline antibody‐negative rheumatoid arthritis. Arthritis Res Therapy 2019;21:116. [DOI] [PMC free article] [PubMed] [Google Scholar]
- 7.Alivernini S, Tolusso B, Petricca L, Bui L, Di Sante G, Peluso G, et al. Synovial features of patients with rheumatoid arthritis and psoriatic arthritis in clinical and ultrasound remission differ under anti‐TNF therapy: a clue to interpret different chances of relapse after clinical remission? Ann Rheum Dis 2017;76:1228–36. [DOI] [PMC free article] [PubMed] [Google Scholar]
- 8.Aletaha D, Neogi T, Silman AJ, Funovits J, Felson DT, Bingham CO III, et al. Rheumatoid arthritis classification criteria: an American College of Rheumatology/European League Against Rheumatism collaborative initiative. Arthritis Rheum 2010;62:2569–81. [DOI] [PubMed] [Google Scholar]
- 9.Taylor W, Gladman D, Helliwell P, Marchesoni A, Mease P, Mielants H, et al. Classification criteria for psoriatic arthritis: development of new criteria from a large international study. Arthritis Rheum 2006;54:2665–73. [DOI] [PubMed] [Google Scholar]
- 10.Alivernini S, Tolusso B, Petricca L, Bui L, Di Mario C, Gigante MR, et al. Synovial predictors of differentiation to definite arthritis in patients with seronegative undifferentiated peripheral inflammatory arthritis: microRNA signature, histological, and ultrasound features. Front Med (Lausanne) 2018;5:186. [DOI] [PMC free article] [PubMed] [Google Scholar]
- 11.Smolen JS, Breedveld FC, Burmester GR, Bykerk V, Dougados M, Emery P, et al. Treating rheumatoid arthritis to target: 2014 update of the recommendations of an international task force. Ann Rheum Dis 2016;75:3–15. [DOI] [PMC free article] [PubMed] [Google Scholar]
- 12.Smolen JS, Landewé RB, Bijlsma JW, Burmester GR, Dougados M, Kerschbaumer A, et al. EULAR recommendations for the management of rheumatoid arthritis with synthetic and biological disease‐modifying anti‐rheumatic drugs: 2019 update. Ann Rheum Dis 2020;79:685–99. [DOI] [PubMed] [Google Scholar]
- 13.Van Gestel AM, Prevoo ML, van 't Hof MA , van Rijswijk MH , van de Putte LB , van Riel PL . Development and validation of the European League Against Rheumatism response criteria for rheumatoid arthritis: comparison with the preliminary American College of Rheumatology and the World Health Organization/International League Against Rheumatism Criteria. Arthritis Rheum 1996;39:34–40. [DOI] [PubMed] [Google Scholar]
- 14.Peluso G, Michelutti A, Bosello S, Gremese E, Tolusso B, Ferraccioli G. Clinical and ultrasonographic remission determines different chances of relapse in early and long standing rheumatoid arthritis. Ann Rheum Dis 2011;70:172–5. [DOI] [PubMed] [Google Scholar]
- 15.Alivernini S, MacDonald L, Elmesmari A, Finlay S, Tolusso B, Gigante MR, et al. Distinct synovial tissue macrophage subsets regulate inflammation and remission in rheumatoid arthritis. Nat Med 2020;26:1295–306. [DOI] [PubMed] [Google Scholar]
- 16.Michelutti A, Gremese E, Morassi F, Petricca L, Arena V, Tolusso B, et al. B‐cell subsets in the joint compartments of seropositive and seronegative rheumatoid arthritis (RA) and no‐RA arthritides express memory markers and ZAP70 and characterize the aggregate pattern irrespectively of the autoantibody status. Mol Med 2011;17:901–9. [DOI] [PMC free article] [PubMed] [Google Scholar]
- 17.Orr C, Najm A, Biniecka M, McGarry T, Ng CT, Young F, et al. Synovial immunophenotype and anti–citrullinated peptide antibodies in rheumatoid arthritis patients: relationship to treatment response and radiologic prognosis. Arthritis Rheumatol 2017;69:2114–23. [DOI] [PubMed] [Google Scholar]
- 18.Pitzalis C, Kelly S, Humby F. New learnings on the pathophysiology of RA from synovial biopsies [review]. Curr Opin Rheumatol 2013;25:334–44. [DOI] [PubMed] [Google Scholar]
- 19.Lewis MJ, Barnes MR, Blighe K, Goldmann K, Rana S, Hackney JA, et al. Molecular portraits of early rheumatoid arthritis identify clinical and treatment response phenotypes. Cell Rep 2019;28:2455–70. [DOI] [PMC free article] [PubMed] [Google Scholar]
- 20.Schmidt T, Najm A, Mussawy H, Burghardt R, Oehler N, Krenn V, et al. General synovitis score and immunologic synovitis score reflect clinical disease activity in patients with advanced stage rheumatoid arthritis. Sci Rep 2019;9:8448. [DOI] [PMC free article] [PubMed] [Google Scholar]
- 21.Najm A, Le Goff B, Orr C, Thurlings R, Cañete JD, Humby F, et al. Standardisation of synovial biopsy analyses in rheumatic diseases: a consensus of the EULAR Synovitis and OMERACT Synovial Tissue Biopsy Groups. Arthritis Res Ther 2018;20:265. [DOI] [PMC free article] [PubMed] [Google Scholar]
- 22.Slansky E, Li J, Haupl T, Morawietz L, Krenn V, Passiler F. Quantitative determination of the diagnostic accuracy of the synovitis score and its components. Histopathology 2010;57:436–43. [DOI] [PubMed] [Google Scholar]
- 23.Bosello S, Fedele AL, Peluso G, Gremese E, Tolusso B, Ferraccioli G. Very early rheumatoid arthritis is the major predictor of major outcomes: clinical ACR remission and radiographic non‐progression. Ann Rheum Dis 2011;70:1292–5. [DOI] [PMC free article] [PubMed] [Google Scholar]
- 24.Gremese E, Salaffi F, Bosello SL, Ciapetti A, Bobbio‐Pallavicini F, Caporali R, et al. Very early rheumatoid arthritis as a predictor of remission: a multicentre real life prospective study. Ann Rheum Dis 2013;72:858–62. [DOI] [PMC free article] [PubMed] [Google Scholar]
- 25.Van der Linden MP, le Cessie S , Raza K, van der Woude D , Knevel R, Huizinga TW, et al. Long‐term impact of delay in assessment of patients with early arthritis. Arthritis Rheum 2010;62:3537–46. [DOI] [PubMed] [Google Scholar]
- 26.Lukas C, Combe B, Ravaud P, Sibilia J, Landewé R, van der Heijde D . Favorable effect of very early disease‐modifying antirheumatic drug treatment on radiographic progression in early inflammatory arthritis: data from the Étude et Suivi des Polyarthrites Indifférenciées Récentes (Study and Followup of Early Undifferentiated Polyarthritis). Arthritis Rheum 2011;63:1804–11. [DOI] [PubMed] [Google Scholar]
- 27.Arnett FC, Edworthy SM, Bloch DA, McShane DJ, Fries JF, Cooper NS, et al. The American Rheumatism Association 1987 revised criteria for the classification of rheumatoid arthritis. Arthritis Rheum 1988;31:315–24. [DOI] [PubMed] [Google Scholar]
- 28.Aletaha D, Neogi T, Silman AJ, Funovits J, Felson DT, Bingham CO III, et al. 2010 rheumatoid arthritis classification criteria: an American College of Rheumatology/European League Against Rheumatism collaborative initiative. Arthritis Rheum 2010;62:2569–81. [DOI] [PubMed] [Google Scholar]
- 29.Machold KP, Stamm TA, Nell VP, Pflugbeil S, Aletaha D, Steiner G, et al. Very recent onset rheumatoid arthritis: clinical and serological patient characteristics associated with radiographic progression over the first years of disease. Rheumatology (Oxford) 2007;46:342–9. [DOI] [PubMed] [Google Scholar]
- 30.Syversen SW, Gaarder PI, Goll GL, Ødegård S, Haavardsholm EA, Mowinckel P, et al. High anti‐cyclic citrullinated peptide levels and an algorithm of four variables predict radiographic progression in patients with rheumatoid arthritis: results from a 10‐year longitudinal study. Ann Rheum Dis 2008;67:212–7. [DOI] [PubMed] [Google Scholar]
- 31.Van der Woude D, Young A, Jayakumar K, Mertens BJ, Toes RE, van der Heijde D , et al. Prevalence of and predictive factors for sustained disease‐modifying antirheumatic drug–free remission in rheumatoid arthritis: results from two large early arthritis cohorts. Arthritis Rheum 2009;60:2262–71. [DOI] [PubMed] [Google Scholar]
- 32.Mjaavatten MD, Uhlig T, Haugen AJ, Nygaard H, Sidenvall G, Helgetveit K, et al. Positive anti‐citrullinated protein antibody status and small joint arthritis are consistent predictors of chronic disease in patients with very early arthritis: results from the NOR‐VEAC cohort. Arthritis Res Therapy 2009;11:R146. [DOI] [PMC free article] [PubMed] [Google Scholar]
- 33.Aubart F, Crestani B, Nicaise‐Roland P, Tubach F, Bollet C, Dawidowicz K, et al. High levels of anti‐cyclic citrullinated peptide autoantibodies are associated with co‐occurrence of pulmonary diseases with rheumatoid arthritis. J Rheumatol 2011;38:979–82. [DOI] [PubMed] [Google Scholar]
- 34.Alivernini S, Fedele AL, Cuoghi I, Tolusso B, Ferraccioli G. Citrullination: the loss of tolerance and development of autoimmunity in rheumatoid arthritis. Reumatismo 2008;60:85–94. [DOI] [PubMed] [Google Scholar]
- 35.Rivellese F, Mauro D, Nerviani A, Pagani S, Fossati‐Jimack L, Messemaker T, et al. Mast cells in early rheumatoid arthritis associate with disease severity and support B cell autoantibody production [review]. Ann Rheum Dis 2018;77:1773–81. [DOI] [PubMed] [Google Scholar]
- 36.Gamboa‐Cárdenas RV, Ugarte‐Gil MF, Loreto M, Sacnun MP, Saurit V, Cardiel MH, et al. Clinical predictors of remission and low disease activity in Latin American early rheumatoid arthritis: data from the GLAFAR cohort. Clin Rheumatol 2019;38:2737–46. [DOI] [PubMed] [Google Scholar]
- 37.Balachandran VP, Gonen M, Smith JJ, De Matteo RP. Nomograms in oncology: more than meets the eye. Lancet Oncol 2015;16:e173–80. [DOI] [PMC free article] [PubMed] [Google Scholar]
- 38.Guizzetti L, Zou G, Khanna R, Dulai PS, Sandborn WJ, Jairath V, et al. Development of clinical prediction models for surgery and complications in Crohn's disease. J Crohns Colitis 2018;12:167–77. [DOI] [PMC free article] [PubMed] [Google Scholar]
- 39.Najm A, Le Goff B, Venet G, Garraud T, Amiaud J, Biha N, et al. IMSYC immunologic synovitis score: a new score for synovial membrane characterization in inflammatory and non‐inflammatory arthritis. Joint Bone Spine 2019;86:77–81. [DOI] [PubMed] [Google Scholar]
Associated Data
This section collects any data citations, data availability statements, or supplementary materials included in this article.
Supplementary Materials
Fig S1
Fig S2
Fig S3
Fig S4
Fig S5
Fig S6
Fig S7
Fig S8
Fig S9
Fig S10
Fig S11
Table S1‐S2
Supplementary Material
Supplementary Material