Abstract
Midkine (MK) is a neurotrophic factor that participates in the embryonic central nervous system (CNS) development and neural stem cell regulation, interacting with sulfated glycosaminoglycans (GAGs). Chondroitin sulfate (CS) is the natural ligand in the CNS. In this work, we describe the interactions between a library of synthetic models of CS‐types and mimics. We did a structural study of this library by NMR and MD (Molecular Dynamics), concluding that the basic shape is controlled by similar geometry of the glycosidic linkages. Their 3D structures are a helix with four residues per turn, almost linear. We have studied the tetrasaccharide‐midkine complexes by ligand observed NMR techniques and concluded that the shape of the ligands does not change upon binding. The ligand orientation into the complex is very variable. It is placed inside the central cavity of MK formed by the two structured beta‐sheets domains linked by an intrinsically disordered region (IDR). Docking analysis confirmed the participation of aromatics residues from MK completed with electrostatic interactions. Finally, we test the biological activity by increasing the MK expression using CS tetrasaccharides and their capacity in enhancing the growth stimulation effect of MK in NIH3T3 cells.
Keywords: carbohydrate-protein complexes, chondroitin sulfate, MD, midkine, STD NMR spectroscopy, transient NMRspectroscopy
The spatial structures of the active complex of midkine and synthetic chondroitin sulfate tetrasaccharides have been solved by NMR spectroscopy and molecular dynamics simulations. The rigid ligand is enclosed by a flexible receptor, with an intrinsically disordered region. The 3D structure of the ligands remains as a helical, almost lineal structure, independently of the aromatic substituents introduced.
Introduction
The neurotrophic and developmental factor Midkine (MK) is a cytokine that, together with Pleiotrophin (PTN), constitutes the neurite growth‐promoting factor family and has been shown to participate in the regulation of many diverse physiological functions.[1] The MK primary role is the regulation of neural stem cells in the embryonic central nervous system (CNS) development. MK also plays essential roles in the pathogenesis of inflammatory and malignant diseases.[2] These effects are associated with the activation of membrane MK receptors: receptor protein tyrosine phosphatase Z1 (PTPζ), low‐density lipoprotein receptor‐related protein, integrins, neuroglycan C, ALK (anaplastic lymphoma receptor tyrosine kinase), and Notch‐2. To exert these functions, the participation of a polysaccharide, a glycosaminoglycan (GAG), is required.
GAGs are a family of linear sulfated polysaccharides that includes heparin and chondroitin sulfate (CS). They regulate a wide variety of biological processes through interactions with a large number of proteins.[3] One of these proteins is MK, considered as relevant molecular target for the treatment of various diseases, and therefore there is a great interest in the discovery of inhibitors.[4] It is known that MK strongly binds to heparin and CS chains and that these molecular recognition events are essential for protein activity. It has also been demonstrated that the interaction between MK and CS is mediated by specific oligosaccharide sequences, with a particular sulfation motif (see Supporting Information for detailed patterns). Heparin regular region IdoA(2OSO3)‐1,4‐GlcN(2NHSO3, 6OSO3) or the CS disulfated disaccharide GlcA‐1,3‐GalNAc(4,6‐di‐OSO3), corresponding to CS−E subtype, are two of the best well‐known interactants.[5] In addition, hybrid chains of CS and DS (dermatan sulfate) have been shown to interact with growth factors.[6]
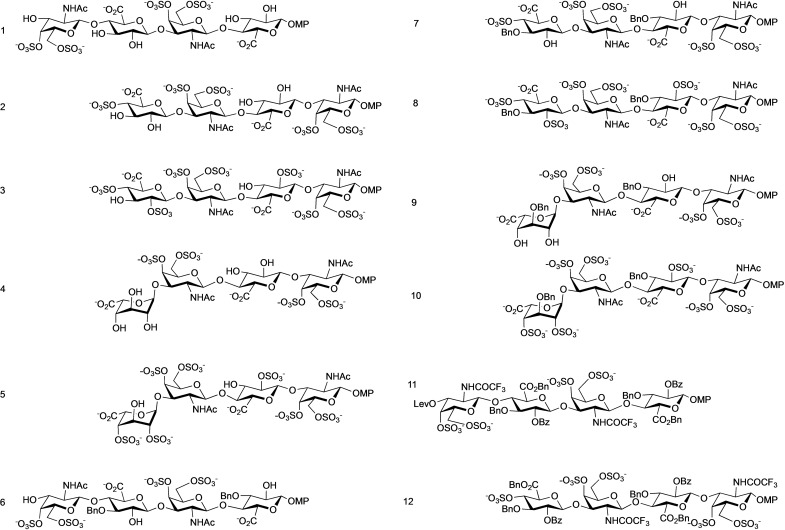
The biosynthesis of the GAG is not‐template driven and involves several enzymes for the construction of the carbohydrate chain and for the further modifications (epimerization and sulfation) of the polymer.[7] Consequently, a large variety of substitution patterns are frequently found in the same GAG chain, even from the same source. Then, pure CS sequences with a well‐defined sulfation pattern are needed to establish the precise structural requirements of the molecular recognition between MK and CS. The synthesis of well‐defined oligosaccharides[3c, 8] is a valuable tool to determine the structural requirements for CS‐protein binding, yielding the precise information for the design and development of new CS mimetics.[9] The preparation of these molecules involves the use of an orthogonal protecting group strategy that allows the selective introduction of sulfate groups at the desired positions to give sulfated protected intermediates. When we previously tested the binding of the partially protected tetrasacharides 6 and 11 to MK (Figure 1),[10] we obtained a higher binding constant than that of the corresponding deprotected compound 1.
Figure 1.
Chemical structures of the CS, hybrid CS/dermatan sulfate (DS) tetrasaccharides, and their mimetics analysed in this work. 1 and 2 correspond to alternative CS−E sequences, 3 to CS−T and 4 and 5 to hybrid DS/CS sequences. 6–10 are mimetics corresponding to 1–5 with two additional benzyl groups, while 11 and 12 do not have free hydroxyls. The drawing has been performed to reflect the relative orientation of the substituents relative to the mean plane of the molecules (notice the relative disposition of the endocyclic oxygens and see the 3D structures in Figure 9). Due to synthetic reasons some of them have an additive sulfate in position 4 of the non‐reducing end terminal. Lev=levulinoyl; MP=4‐methoxyphenyl.
Then, we complete the library by synthesizing the tetrasaccharides 2, 7, and 12 to determine the potential influence of the sequence in the activity by comparing with the complementary 1, 6, and 11 (Figure 1). The synthesis of the rest of the compounds examined in this work has been previously described.[10, 11] We measure the affinity for MK, and as we previously reported, the interaction is proportional to the number of aromatic substituents per molecule.[10, 11]
This work also describes the 3D structure of the tetrasacharides deduced by combined NMR and MD studies and explores the role of the modifications on the structure of the mimetics.[11] From the NMR study of the tetrasacharides, geometrical restraints were obtained: torsional angles from coupling constants and interprotonic distances from NOEs. The MD analysis was used to obtain the theoretical magnitudes previously extracted from the NMR data applying the appropriate averaged along the trajectory.
Next, we study the structure of the tetrasaccharides when forming part of the complex with MK by using transfer NOESY for distance estimation and STD NMR (Saturation Transfer Difference NMR) to analyse the complex geometry. That was interpreted with the aid of Docking calculations performed using Glide and Autodock Vina.
Finally, the activity of some of the tetrasaccharides was investigated by the analysis of the capacity to stimulate the MK expression on U251‐MG glioblastoma cells and to enhance the MK‐mediated stimulation of NIH3T3 cells growth rate.
Results
Synthetic procedures
We have accomplished the preparation of a library of chondroitin sulfate (CS) and CS/dermatan sulfate (CS/DS) tetrasaccharides (Figure 1).[11, 12] Here, we have completed this library with the synthesis of new derivatives 2, 7, and 12 (see Supporting Information). Briefly, suitably protected monosaccharide building blocks (D‐galactosamine and D‐glucuronic acid units) were coupled using the trichloroacetimidate glycosylation method.[13] Once the tetrasaccharide chain was assembled, selective hydrolysis of orthogonal protecting groups allowed us to introduce the sulfate groups at the desired positions. Thus, we obtained sulfated, fully protected tetrasaccharide 12. Further hydrolysis of ester and amide protecting groups followed by N‐acetylation afforded oligosaccharide 7 displaying two benzyl moieties at position 3 of the uronic acid units. Finally, hydrogenolysis of these benzyl groups gave fully deprotected tetrasaccharide 2.
The synthesized tetrasaccharides present different sulfate group distributions, closely related to the CS subtypes E and T. While CS−E is characterized by the presence of sulfate groups at positions 4 and 6 of GalNAc units, CS−T displays sulfates at positions 4 and 6 of GalNAc and position 2 of GlcA.[14] Also, our collection includes tetrasaccharides (4–5, 9–10) containing one IdoA residue instead of GlcA that correspond to hybrid CS/DS sequences.
Binding affinities
We have completed the analysis of the relative binding affinities of our synthetic tetrasaccharides for MK with the calculation of the IC50 values for new compounds 2, 7, and 12 (Table 1 and Supporting Information). For this purpose, we have employed our previously developed fluorescence polarisation competition assay.[11, 12b, 15] Our results indicated that the binding affinities of CS−T like structures were higher than those corresponding to CS−E like sequences (e. g., compare 1, 2 with 3, 5). Also, the obtained IC50 values confirmed that the presence of hydrophobic groups increased the binding affinities of the synthetic tetrasaccharides for midkine. Thus, we found that the binding potency increased from the fully deprotected 2 (IC50=136 μM) to the dibenzylated derivative 7 (IC50=27 μM) and the fully protected compound 12 (IC50=3.8 μM). The same trend was observed when comparing derivatives 1, 6, and 11.
Table 1.
IC50 values for the interaction between MK and synthetic tetrasaccharides.
|
Compound |
IC50 (μM) |
|---|---|
|
1 |
254[a] |
|
2 |
136 |
|
3 |
10.6[b] |
|
4 |
n.d. |
|
5 |
8.0[b] |
|
6 |
31[a] |
|
7 |
27 |
|
8 |
5.3[b] |
|
9 |
n. d. |
|
10 |
2.5[b] |
|
11 |
1.3[a] |
|
12 |
3.8 |
[a] Reported in Ref. [10]; [b] reported in Ref. [11]; n. d. Not determined.
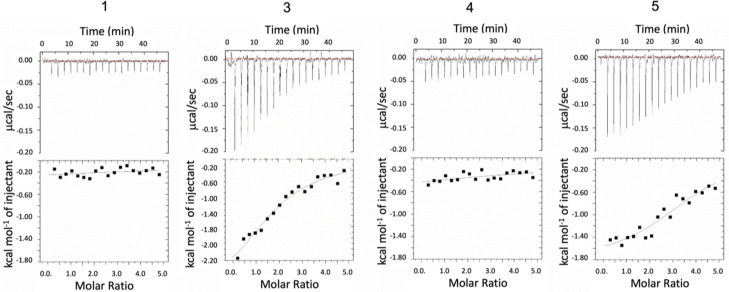
We also measured the interaction with MK using ITC (Isothermal Titration Calorimetry) to verify the interaction (see Figure 2).[16] The data were similar to the previously obtained by FP. Due to the large amount of tetrasaccharide needed for ITC measurements, we decided not to continue with the rest of the tetrasaccharides.
Figure 2.
ITC titrations MK (0.02 mM) with tetrasaccharides 0.5 mM, 1, 3, 4 and 5, with 2 μL increment at 298 K.
3D structure
We have analysed the three‐dimensional structure of the tetrasaccharides 1–12 (Figure 1) by NMR and MD simulations. Experimental geometrical variables were measured from NMR data and then confronted with those theoretically obtained as the time‐averaged along the MD simulations trajectories. Then, in the presence of MK and using transfer NOESY and STD NMR techniques, we obtain the 3D structure of the bound ligand and information about the disposition of the ligand in the complex. The results were completed with docking calculations.
Free tetrasaccharides 3D structure
NMR: J coupling and NOESY derived distances
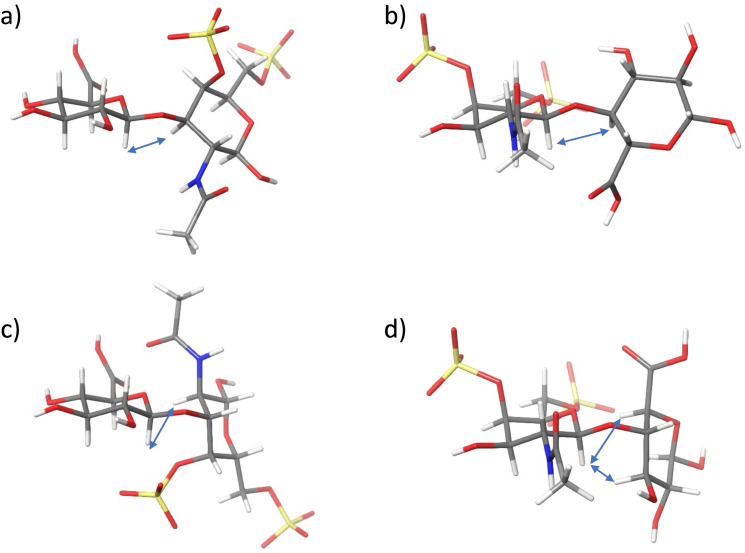
Unsubstituted tetrasaccharides: Most of the structures of the completely deprotected tetrasaccharides 1, 3–5 have been previously studied by NMR.[11] Only 2 was new, and a complete NMR analysis has been performed for the free compound. From the coupling constant and interglycosidic NOE distance analysis (Tables S1, S2, and Figure 3), it can be concluded that 2 has the same three‐dimensional shape as 1, and the rest of the free tetrasaccharides with CS or CS/DS structures previously studied (3‐5). Thus, all the 2 pyranose rings were in a 4C1 chair conformation, connected by glycosidic linkages in a monoconformational syn‐Ψ disposition. This structure can be described as a helical arrangement with a high pitch with four residues per turn, leading to pseudo C2 symmetry, similar to the heparin regular region.
Figure 3.
3D structures of the four main possible conformations a) GlcA β (1‐3) GalN, syn‐Ψ; b) GalN β (1‐4) GlcA, syn‐Ψ; c) GlcA β (1‐3) GalN, anti‐Ψ and d) GalN β (1‐4) GlcA, anti‐Ψ and their exclusive NOEs.
Disubstituted tetrasaccharides: In spite of the introduction of two non‐canonical substituents, the NMR analyses of compounds 6, 7, and 9 are compatible with 3D structures similar to the unsubstituted analogues 1, 2, and 4 at the interglycosidic linkage geometries (see Supporting Information). The study of all the coupling constants was coherent with standard chair conformations 4C1, except for the terminal iduronate on 9, which shows a significant contribution of 2SO. Iduronate residues are characteristics of heparin and dermatan sulfate in contraposition with heparan sulfate and chondroitin sulfate that have glucuronic residues instead. Iduronate rings at internal positions of GAG used to be in a conformational equilibrium between 1C4 and 2SO conformations.[17] In the case of 9, the observation of an NOE between protons 2 and 5 proved the presence of the 2SO conformation. Additionally, the coupling constants are larger for 9 than 4 (Table 2, Figure S3), indicating a greater proportion of 2SO.
Table 2.
3JHH and experimental internal distances for the characterization of the iduronate conformations.
|
3 JHH |
4 |
5 |
9 |
|---|---|---|---|
|
H1‐H2 (Hz) |
4.6 |
|
5.6 |
|
H2‐H3 (Hz) |
7.7 |
2.3 |
9.9 |
|
H3‐H4 (Hz) |
5.7 |
2.3 |
6.0 |
|
H4‐H5 (Hz) |
3.8 |
2.8 |
– |
|
d H2‐H5 (A) |
2.74 |
nd |
2.83 |
The dibenzylated tetrasaccharides 6 and 7 displayed a conformation similar to the analogues without aromatics substituents 1 and 2, with 4C1 conformations for all the rings. The glycosidic linkage NOE pattern should distinguish between syn and anti‐glycosidic arrangements see Figure 3. When experimental distances between the intraring axial protons H1‐H3 and H5 were calculated, a slight distortion from the standard chair was detected (see Table S2).
In the case of 9, the introduction of an iduronate ring at the non‐reducing end complicates the assignment due to broad signals at high field, water signal interference, and overlapping. The best results were obtained at 310 K at 600 MHz. The experimental interglycosidic distances were obtained by quantification the NOE growing rates obtained from selective NOESY experiments (see Table S2). From this analysis, we concluded that all the glycosidic linkages of 9 are in a syn‐Ψ arrangement as for 6 and 7 (see Figure 3).
Completely‐substituted tetrasacharides: Two CS models of fully substituted tetrasaccharides, 11 and 12, were used to study their conformational properties. A priori, the presence of more aromatic substituents, together with the absence of free hydroxyl groups, may affect the three‐dimensional structure of the tetrasaccharides and other properties.
Compound 12 was first successfully assigned at 1.5 mM with 5 % DMSO in phosphate 10 mM and 150 mM NaCl buffer at 600 MHz. We observed evident signal broadening and severe spin diffusion on the NOESY spectra at this concentration, both characteristics of aggregation to larger systems (Figure 4). This was checked by sample dilution to 225 μM, observing a similar NOE behaviour as the dibenzylated tetrasaccharides. This was confirmed by the variable temperature experiments performed (not shown). Unfortunately, the strong overlapping and the low concentration prevented us from accomplishing a quantitative distance analysis of the NOE peaks at this field. We conducted a further study of 12 at 900 MHz at 225 μM in phosphate buffer (10 mM, 150 mM NaCl). In these conditions, the assignment, integration, and distance evaluation of all the cross‐peaks were possible (See Table S2 and Supporting Information). During this process, we realized the hydrolysis of the ester substituents as clearly seen in the 19F‐NMR (see Supporting Information. Figure S6).
Figure 4.
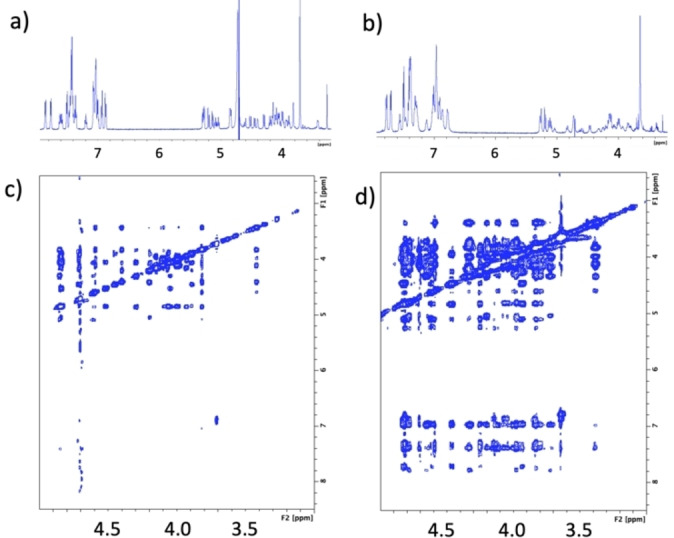
NMR experiments of 12 all recorded in the same buffer in D2O at 298 K at 600 MHz. a) 1H NMR at 225 μM b) at 1.50 mM, c) NOESY at 225 μM, mixing time 600 ms d) NOESY at 1.50 mM, mixing time 400 ms.
The tetrasaccharide 11 exhibits abnormal behaviour. In pure D2O, compound 11 presents signals compatible with a discrete molecule; as soon as we added the measuring buffer (10 mM phosphate and 150 mM NaCl), the signals broaden, making the spectra unmanageable, both at 900 and 600 MHz. In the measuring buffer, the benzylic substituents at position 6 of glucuronic acid were unstable, and two sets of signals can be detected after several days. Therefore, we performed the assignment and NMR study of the free compound in pure D2O at 600 MHz, where hydrolysis was decelerated, and clear and narrow signals were observed.
The analysis of 11 and 12 experimental coupling constants are compatible with all the sugar rings being in 4C1 conformation (Table S1). Also, we measured the H1‐H3‐H5 interprotonic NOE distances, diagnosis of the chair geometry. They are compatible with a 4C1 distorted geometry (Table S2). In both cases, 11 and 12, the interglycosidic NOE peaks indicate a 3D structure similar to the fully deprotected tetrasaccharides. The interglycosidic linkages are in a syn arrangement without pieces of evidence of other conformations. The structures of 11 and 12 are linear and rigid, similar to the rest of the tetrasaccharides with the same sequence, despite the considerable steric hindrance introduced by the aromatic substituents.
We conducted a stability study on 12 using the 19F signals from the CF3 groups for simplicity; see Figure S6. After several weeks, hydrolysis became evident in samples at 1 mM and D2O buffer (10 mM Phosphate and 150 mM NaCl). From the NMR analysis of the hydrolysis product, we could conclude that the new compound results from the hydrolysis of the benzyloxycarbonyl moieties of the glucuronate residues.
MD simulations
We have performed molecular dynamic studies for all the saccharides presented in this work. To verify the MD results, we back‐calculated the interprotonic distances and coupling constants over the trajectory (see details in the experimental part, Table S1 and S2).[18] Theoretical distances for comparing with experimental NOE based ones were calculated as the ensemble <r−6> averaged over the trajectory or a representative part of it. We also apply time‐averaged restraints (tar) methodology in the cases where the standard MD results were incompatible with the experimental observations or when poly‐conformational iduronate residues were present (see Supporting Information).
First, we describe the analysis of the iduronate containing oligosaccharides 4, 5, and 9. At the non‐reducing end, the iduronate residues can be in at least three different conformations 1C4, 4C1, and 2SO (Figure S3). A qualitative description can be done based on the interprotonic coupling constants. This is complemented by observing the exclusive NOE of the 2SO conformation, the H2‐H5 NOE. For 4, a weak H2‐H5 NOE was observed, and the coupling constant values are consistent with a fast equilibrium between 1C4 and 2SO conformations, as internals IdoA in heparin in 60 : 40 proportions.[18] For 5, while the coupling constant analysis was compatible with a single 1C4 chair, the diagnostic NOE was not observed. Finally, 9 is consistent with a mayor 2SO conformation with H2‐H5 NOE and large coupling constants, likely due to the steric stress introduced by the benzyl substituent in position 3. (See Figure S3 and Table 2)
To quantify the equilibrium, we used time‐averaged restrained molecular dynamics and analysed the results collectively[18] As previously described, the MD results for 4 and 5 agreed partially with the experimental coupling data, but not for 9. When we apply the tar‐MD protocol developed by us,[18] using the experimental H2‐H5 distance as a single restrain, we obtain a good agreement for both magnitudes: distances and couplings for all the cases: 4, 5, and 9. The results for 9 were consistent with conformers at the equator of the Cremer‐Pople pseudorotational sphere (ϕ=90°), mainly 2SO (87 %). The goodness of this approach has been tested using the agreement between the experimental and the averaged coupling constants as indicative of the ring conformation, see Table S1.
We examined the sugar ring puckering for the rest of the compounds and the Φ/Ψ maps along the trajectories for two conditions: free MD in explicit water and tar‐MD.
The restrictions consisted of using the experimental intraring distance restraints based on the NOE observed distances between H1‐H3 and H5 to control the ring conformation. While for the fully deprotected 2, the two conditions yielded comparable results, in the cases of 6, 7, 9, 11, not. The free MD is incompatible with the experimental results, but tar‐MD agrees (see Supporting Information). Compound 12 needed to include experimental glycosidic linkages distances calculated from NOE growing curves to fit the experimental results completely.
The global geometry of the backbone of the non‐substituted compounds 1–5 is notably similar despite the variation on sulfation. For example, compare the unsubstituted compounds showed in Figure 5.
Figure 5.
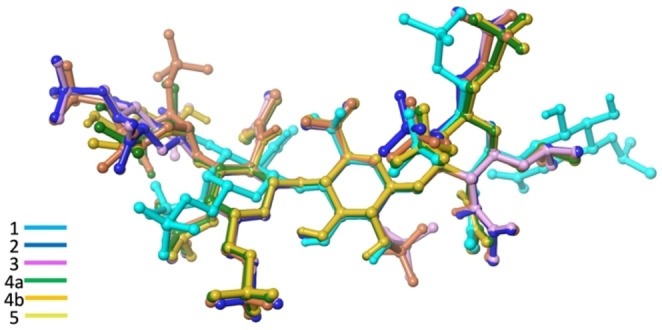
Superimposition of minimized structures randomly taken along MD of 1–5. Compound 4 is in its two main conformations 1C4 (4a) and 2SO (4b).
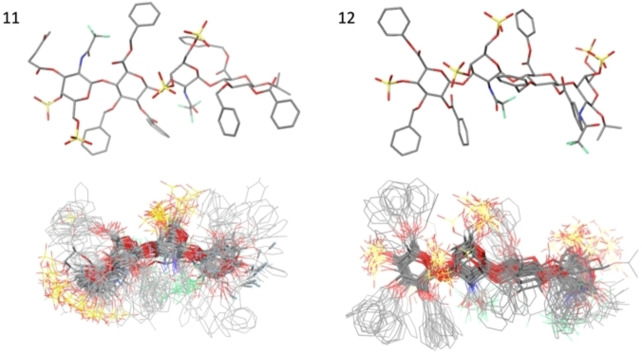
The scarcity of previous studies on protected saccharides in water aimed us to deepen into the 3D structure of 11 and 12. When unrestrained MD of 12 was attempted, we obtained results contrary to the experimental observations, particularly at the ring conformation and at the interglycosidic linkages level. Following the same strategy as applied in the disubstituted compounds, we introduce the H1‐H3‐H5 intraring restraints. This, although minor the disagreement with the experimental data did not solve it. We need to use the quantified 900 MHz NOESY data to extract precise distances and verify that all linkages were in syn disposition. Then we use the calculated distances and introduce as interglycosidic experimental restraints to obtain MD structures compatible with the experimental data (see Figure 6). In conclusion, the 3D structures for these persubstituted tetrasaccharides were, despite the larger steric hindrance, like the rest of the series with less steric clashes; helical quasi‐linear structures with very high pitch, causing the sulfate substituents to be directed towards opposite sides of the molecular axis (see Figure 6 and the Supporting Information)
Figure 6.
Results from tar‐MD for 11 and 12. Single frame structures (top) and superimposition on the central backbone heavy atoms of 20 frames taken regularly along the tar‐MD (bottom).
3D Midkine‐tetrasaccharides complexes structure
We have performed an NMR analysis of the complex based on transient NOESY and transference of saturation, STD NMR, to collect the experimental data of the compounds bound to MK. The NMR studies of 1 and 5 bound to MK have been previously reported but not the rest of unprotected 2–4 or substituted 6–12, which will be reported here.
Transfer NOESY
To assess the interaction between the ligand and the receptor, as the relative sign of the NOE peaks cannot be used to evaluate the formation of complex, we quantified the NOE growing rate for 2 in the buffer in the presence or absence of 20 μM of MK. We compared the growth curves of 2 in the presence and in the absence of MK that clearly shows a difference in correlation times due to the formation of the transient complex (Figure 7).
Figure 7.
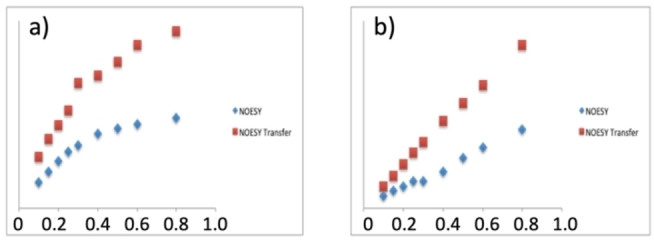
Comparison of the growth curves of NOE peaks in the presence and absence of MK (20 μM) for 2, a) Absolute intensities, b) Ix/Idiagonal.
Then, we quantified NOESY derived experimental distances in the presence of midkine. In all cases, they were similar to the free tetrasaccharides in the absence of midkine, within the experimental uncertainty range. The introduction of aromatics substituents prevents the unflawed observation of isolated anomeric peaks in the NOESY experiments as the benzylic protons appear in the anomeric region. Therefore, the distance analysis of the bounded tetrasaccharides was severely hampered in 6, 7, and 9. The cases of 11 and 12 showed an interesting case of aggregation at low concentration even in the presence of midkine. They were studied at 900 MHz to improve the sensitivity recording NOESY experiments at low concentration for disrupting the aggregation. As an additional benefit, the signals spread due to the highest field, and we were able to assign all the signals (See Figure 8). Then, we record tr‐NOESY for both at 0.20 mM in the presence of MK (1 : 20). Compound 11 hydrolyses faster than 12. Thus, we cannot perform an accurate analysis of the NOESY in the presence of midkine as the peaks from the hydrolysed tetrasaccharides interfere in the spectra. The quantitative analysis of the 11 first NOESY experiments with MK is compatible with a similar 3D structure in the complex as for the free saccharide.
Figure 8.
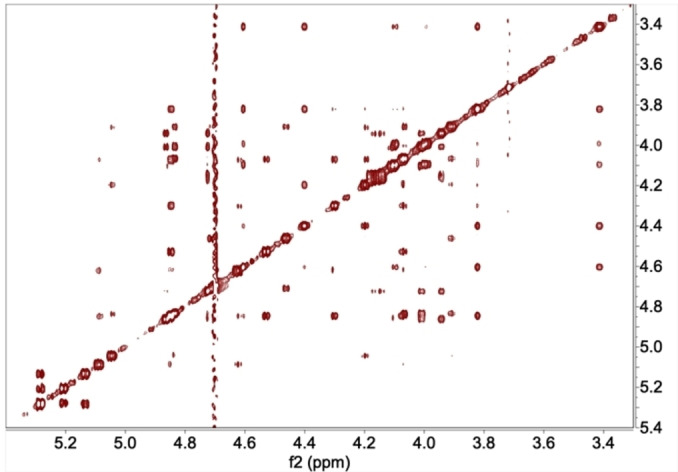
Compound 12, 0.20 mM NMR NOESY experiment at 900 MHz in buffer (10 mM Phosphate, 150 mM NaCl) in the presence of 20 μM of MK.
A qualitative analysis based on the observation of diagnostic interglycosidic NOE peaks indicates that all the studied tetrasaccharides have the same conformation in the bound state as in the free one. The quantitative study of the transfer NOE growing rates yielded inter glycosidic distances compatible with the free analogues (Table S2). In the case of 12, NOE peaks corresponding to a potential anti‐arrangement of the linkage were detected at 900 MHz. When these were quantified, the distance calculated was 4.1 A, compatible with a syn arrangement of the glycosidic linkage.
Then, as the main conclusion from the transfer NOESY experiments, all saccharides bounded have a linear shape consistent with a high pitch helical structure with a syn‐Ψ relative disposition, similar to the structures of the free compounds, as deduced by the interglycosidic NOE contacts in the presence of MK.
STD
Later, we performed a complete STD NMR study (see Figure 9 and Supporting Information). It was accomplished through an array of saturation times from 0.5 s. to 5.0–6.0 s. Data were used to analyse the initial growth rate of the STD (STD0) to avoid the effects of differential relaxation, which are particularly severe due to the presence of aromatics substituents as in these series, see Supporting Information.
Figure 9.
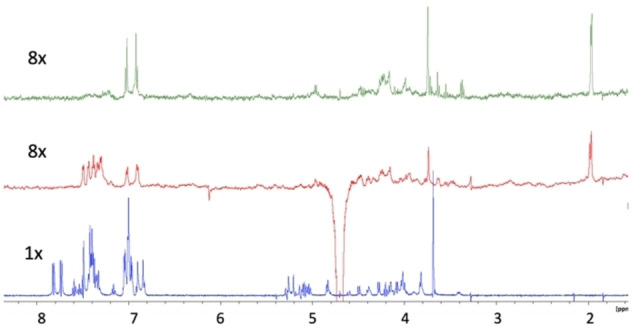
STD NMR spectrum of 2 (green), 7 (red), and 12 (blue), recorded at 600 MHz with saturation time of 4 s and the same experimental conditions. Notice the increase of the aromatic signals STD for 12.
Attempts to fit the experimental results to a single conformer complex applying CORCEMA‐ST (Complete Relaxation and Conformational Exchange Matrix Analysis of Saturation Transfer)[19] were unsuccessful (data are not shown). The magnetization is distributed along the saccharide without a preferential binding orientation, region, or site when complexed by the protein (Table 3 and Figure 10). Qualitatively, the STD NMR results indicate that the carbohydrate is surrounded by MK, and magnetization arises from all directions (left, right, top, and bottom). These results are compatible with ambiguous complexes with a central disposition of the tetrasaccharide in the binding site and the protein folding around. These results resemble the interaction of mannose derivatives with ECD DC‐SIGN we obtained before that it was caused by the existence of multiple binding alternatives on the same site.[20]
Table 3.
STD0 relative values obtained by fitting the values at different saturation time to an exponential equation and then calculating the relative STD assuming the strongest peak as 100 %, recorded at 600 and 900 MHz.
|
|
STD0 rel |
|||||||||||
|---|---|---|---|---|---|---|---|---|---|---|---|---|
|
|
600 MHz |
900 MHz |
||||||||||
|
|
1 |
2 |
3 |
4 |
5 |
6 |
7 |
8 |
9 |
12 |
11 |
12 |
|
H1A |
100 |
73 |
62 |
100 |
100 |
33 |
77 |
68 |
67 |
100 |
|
57 |
|
H2A |
56 |
82 |
|
|
|
30 |
92 |
|
90 |
|
|
31 |
|
H3A |
78 |
73 |
|
53 |
|
30 |
62 |
|
63 |
|
|
72 |
|
H4A |
|
|
50 |
|
67 |
|
|
59 |
|
|
|
|
|
H5A |
|
|
|
|
100 |
48 |
|
|
|
|
|
|
|
H6A |
|
|
|
|
|
|
|
|
|
|
|
|
|
|
|
|
|
|
|
|
|
|
|
|
|
|
|
H1B |
67 |
100 |
|
65 |
|
65 |
85 |
|
100 |
|
7 |
52 |
|
H2B |
28 |
45 |
|
65 |
|
|
|
|
31 |
96 |
39 |
29 |
|
H3B |
|
55 |
58 |
65 |
100 |
|
38 |
36 |
|
|
|
|
|
H4B |
|
55 |
73 |
63 |
83 |
|
115 |
|
88 |
81 |
|
36 |
|
H5B |
|
36 |
27 |
40 |
58 |
|
35 |
|
|
|
40 |
26 |
|
H6B |
|
|
|
|
|
|
|
|
|
|
|
|
|
|
|
|
|
|
|
|
|
|
|
|
|
|
|
H1C |
50 |
|
|
|
|
51 |
|
|
48 |
|
|
100 |
|
H2C |
44 |
100 |
|
68 |
|
32 |
60 |
|
69 |
|
|
28 |
|
H3C |
28 |
99 |
|
103 |
|
|
100 |
|
|
|
|
|
|
H4C |
33 |
|
100 |
|
75 |
|
|
100 |
65 |
|
98 |
28 |
|
H5C |
33 |
45 |
|
53 |
|
|
|
|
|
|
|
|
|
H6C |
|
|
|
|
|
|
|
|
|
|
|
|
|
|
|
|
|
|
|
|
|
|
|
|
|
|
|
H1D |
61 |
45 |
|
50 |
42 |
41 |
73 |
|
44 |
|
|
|
|
H2D |
28 |
45 |
|
40 |
83 |
|
|
|
48 |
94 |
|
21 |
|
H3D |
|
45 |
|
108 |
67 |
|
|
|
75 |
0 |
|
24 |
|
H4D |
|
100 |
62 |
68 |
50 |
40 |
67 |
68 |
|
94 |
|
0 |
|
H5D |
|
45 |
62 |
|
|
|
|
68 |
|
92 |
68 |
21 |
|
H6D |
|
|
|
|
|
|
|
|
|
|
|
|
|
|
|
|
|
|
|
|
|
|
|
|
|
|
|
Ac |
|
91 |
|
88 |
|
60 |
77 |
123 |
77 |
|
|
|
|
Ph(OMP) |
50 |
100 |
|
53 |
75 |
100 |
69 |
59 |
56 |
|
|
21 |
|
CH3(OMP) |
28 |
45 |
|
60 |
42 |
73 |
40 |
55 |
73 |
|
|
23 |
|
Bz‐1 |
|
|
|
|
|
90 |
73 |
|
|
|
59 |
29 |
|
Bz‐2 |
|
|
|
|
|
90 |
73 |
|
|
|
88 |
33 |
|
Bn‐1 |
|
|
|
|
|
|
|
|
|
|
59 |
31 |
|
Bn‐2 |
|
|
|
|
|
|
|
|
|
|
59 |
37 |
|
Bn‐3 |
|
|
|
|
|
|
|
|
|
|
100 |
22 |
|
Bn‐4 |
|
|
|
|
|
|
|
|
|
|
100 |
33 |
Figure 10.
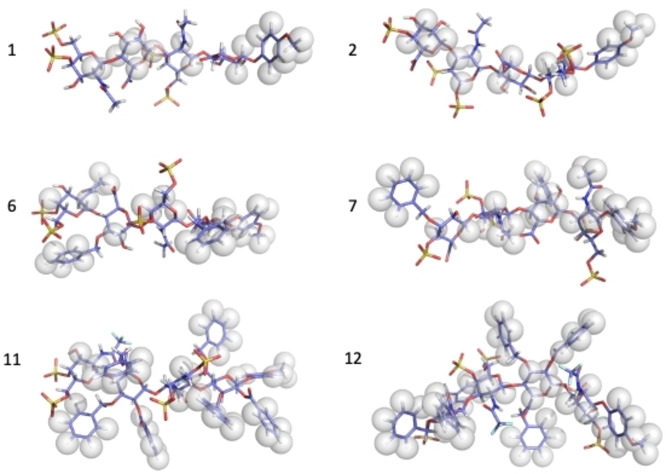
Representation of observed STD at 4 s into 3D structures taken from tar‐MD for 1, 2, 6, 7, 11, and 12. The spheres indicate that the highlighted protons have an STD effect and that this was assigned. Only the protons unambiguously assigned have been included. Due to overlap, not all the protons that have an STD effect have been highlighted.
The spectral overlapping increases with the number of benzylic substituents and, simultaneously, the difficulty of analysing the spectra. There is a particularly severe interference between CH2 benzyl signals, the anomeric ones, or the 2‐H of the galactosamine rings. Thus, although we were able to perform STD experiments, in 11 and 12, we were unable to carry any significant analysis at 600 MHz. The tendency to aggregate when increase the concentration dissuades us from the use of hyphenated methods as HSQC‐STD.
Then, we moved to a larger magnetic field, 900 MHz, to ensure that the species in solution were monomeric by decreasing the concentration. Simultaneously, this allows us a more accurate assignment and integration with better sensitivity and dispersion. We record STD NMR experiments with added protein (1 : 20) at different saturation times (0.5s–5s) for 11 and 12. The resolution was excellent, and the STD quantification was possible (Table 3 and Supporting Information).
When we analyse the STD results by grouping them by series (1, 6, and 11 or 2, 7, and 12), the role of the aromatics in the binding becomes evident (Figure 9). The amount of magnetization transferred to the aromatics increases with the number of rings. A similar analysis can be done for 1, 6, and 11. This can be explained by the interactions of the aromatic residues from the MK and the benzylic substituents of the saccharide. Also, it can be demonstrated that the interposition of the aromatics groups from the saccharide shields the backbone protons from the protein, as it can be seen when the STD series is considered 1, 6, 11, or 2, 7, 12 (see Figures 8 and 9).
When the analysis considers the 3D structure of the tetrasacharides, it becomes evident that the aromatic rings are projected from the central axis of the saccharide towards the exterior in all spatial directions (Figure 10). In such disposition, they will receive a substantial transfer of saturation. Also, from this analysis, it can be deduced that the magnetization received by the tetrasaccharides arises from all the space directions without a preferential side or site on their structures.
Docking
We performed docking studies between the tetrasaccharides 1–12 and midkine structures obtained from the NMR analysis (pdb 2LUT, containing 10 NMR structures).[21] The structures were consistent with two beta‐sheet domains linked by a flexible region that can be considered an intrinsically disorder region (IDR). Consequently, the relative orientations between both domains are variable. As in the previous studies, two NMR structures were extracted from the pdb ensemble: 2 and 8, both with the central cavity preformed.
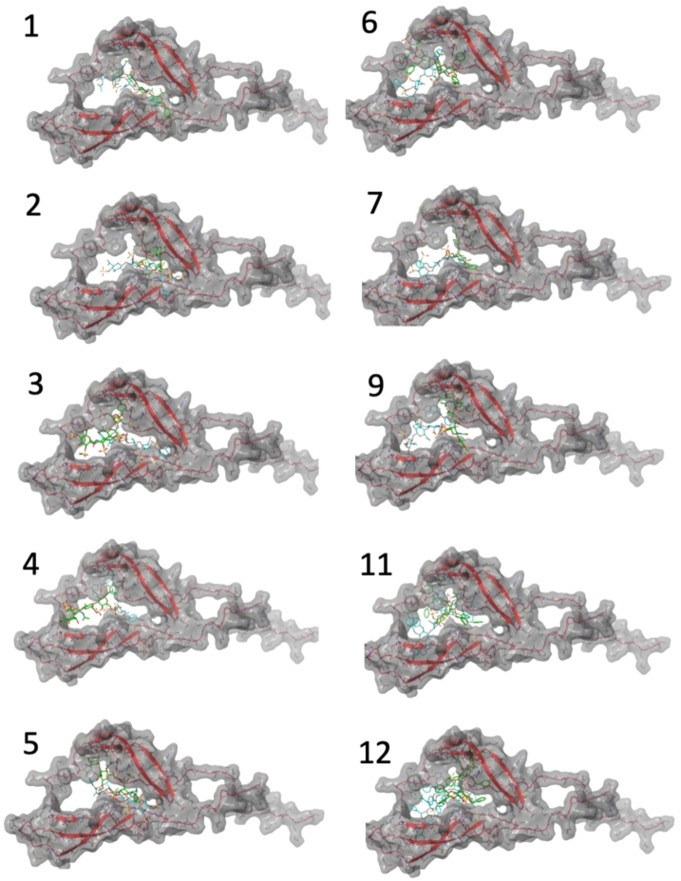
We have used two docking programs: Glide[22] from Maestro (Schrodinger), using single precision mode to broaden the scope of the search, and Autodock Vina.[23] Both yield very similar results. The saccharides in the complexes were placed in the central cavity between the two beta‐sheets domains, with frequent contacts with the disordered central segment (see Figure 11 and Supporting Information). The tetrasaccharides have variable orientations within the same pocket, suggesting fuzzy or disordered complexes. In none of the cases, the results did converge to a single or favoured structure. The final 3D structures of the complexes obtained using Autodock and Glide are shown in Supporting Information. The global results are similar, and no significant differences are found between Autodock Vina or Glide. In Figure 11, both methods are compared using the best‐scored pose.
Figure 11.
Best docking score complexes obtained with Autodock Vina (blue) and Glide (green) for 1–9, 11, and 12.
GAGs have a global negative charge from the sulfates, and these are neutralized by basic residues from the protein. In the cavity, there are 18 K and R from a total of 22 at the whole protein. Both types of amino acids have a larger abundance than the averaged prevalence in proteins. K and R are 18 % and 16 % for the internal cavity and the complete MK, respectively, in contrast with the average in proteins that is 13 %. On the other hand, 6 aromatics residues are directed towards the internal cavity formed in the folded structures. In most cases, they are involved in interactions with aromatic groups from the carbohydrate.
Biological activity
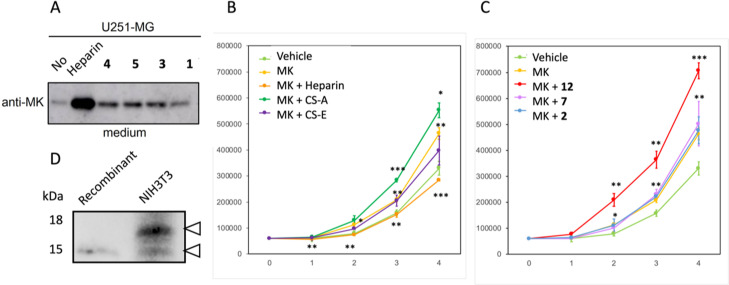
First, we tested the ability of unprotected tetrasaccharides 1, 3, 4, and 5 to stimulate the MK expression on U251‐MG glioblastoma cells by western blot analysis compared to commercial heparin (Figure 12A)). The results indicate that they were able to induce some activity, but not as much as the natural polysaccharide heparin.
Figure 12.
A) MK retention activity of 1, 3, 4, and 5, compared with commercial heparin. B and C) Compound 12 enhances MK‐mediated stimulation of cell growth. NIH3T3 cells were cultured in the absence (vehicle, control condition) or the presence of MK, with or without natural GAGs (heparin, CS−A, CS−E) (B), or compounds 2, 7, or 12 (C). The number of cells was recorded at days 0 to 4. Time points are means ± s.d. from three independent experiments. Statistical significance of differences between control and MK curves (B, C), or between MK and CS−A (B), or MK and compound 12 (C) curves, was indicated on top of each curve. Statistical significance of differences between MK and heparin (B) was indicated below the curve. Significance was analysed by Student's t test (*p<0.05, **p<0.01, ***p<0.001). D) Western blot analysis of recombinant MK (2.5 ng) in comparison with MK in NIH3T3 cell extracts (50 μg). Arrowheads point to MK bands.
MK has proven to stimulate the growth rate of NIH3T3 cells.[24] Thus, we decided to test the capacity of several of the tetrasaccharides in enhancing the growth stimulation effect of MK. As expected, MK stimulated growth in relation to control conditions (Figure 12). As a proof of the positive effect of some GAGs on MK activity, we tested several commercially available GAGs, in particular heparin, CS−A, and CS−E. Among these, CS−A showed a clear enhancement of the MK‐mediated stimulation of growth (Figure 12). We next measured the effect in the proliferation of NIHT3T cells of one series of the tetrasaccharides 2, 7, and 12. We observed increased stimulation of growth in the presence of 12 (Figure 12), which agrees with the best affinity towards MK of 12. Through western blot analysis, we compared recombinant MK with MK in NIH3T3 cell extracts and observed that a significant portion of the protein in cell extracts showed increased size (Figure 12), pointing to the presence of post‐translational modifications.
Discussion
In this paper, we study the binding of synthetic tetrasaccharides to midkine. We estimate their IC50, study their structures free and in the presence of MK by NMR and MD, analyse their complexes by NMR and docking calculations, and finally perform activity assays.
We compiled, completed, and reported the data of the IC50 obtained by fluorescence polarisation for the tetrasaccharides. These are in good agreement with the data obtained with ITC, and they have the advantage of less amount of material needed. The results clearly show a strong influence of the number of aromatic groups in binding, compare the complementary series 1, 6, and 11 with 2, 7, and 12. From 1 or 2 to 6 or 7, there is an order of magnitude increase on binding strength, similar to between 6 or 7 to 11 or 12. Also, there is an apparent dependence of the IC50 on the number of sulfates of the tetrasaccharide: compare 1, 2 with 3, 5, or 6, 7 with 8 and 10.
We solved the 3D structures of the oligosaccharides herein presented using as the source of experimental data NMR and employing force field methods for theoretical analysis. For some of the unsubstituted compounds, the 3D structures were already solved (1, 3–5).[11] In this work, we extended the study to 2 with an alternative sequence than 1. We also defined the 3D structure of 6, 7, and 9 in the disubstituted set and 11 and 12 in the whole substituted series.
An added feature obtained from this study is the role of ring substituents in the IdoA equilibrium in 4, 5, and 9. By analysing the presence of the 2SO exclusive NOE, H2‐H5, combined with the coupling constant analysis, three alternative behaviours can be observed: the standard one in which the IdoA is in fast equilibrium between 1C4 and 2SO, found in 4, the opposite where the H2‐H5 NOE is not detected, compatible with a chair 1C4, in 5, and the determined for 9, where the dominant form is the 2SO (87 %) plus other Cremer‐Pople ϕ=90° conformers. The 9 behaviour can be explained as the bulk substituent introduced in position 3 shifts the equilibrium to a conformation with less 1–3 diaxial interactions.
The global 3D structure of all the tetrasaccharides studied is compatible with the CS models (Figure 9) as an elongated high‐pitched helix, driving the negative charges towards opposite directions of the space, and they can be considered as linear molecules. This is expected in the unsubstituted series, which can be considered CS and DS/CS sequences models. The introduction of two benzyl moieties on 6, 7, and 9, despite its large volume, does not affect the glycosidic linkage geometry that remains essentially the same as in the unsubstituted series. When experimental distances between the intra‐ring axial protons H1‐H3 and H5 were analysed, a slight distortion can be detected, but always within the 4C1 pucker. Then, the steric congestion caused by the introduction of the two substituents is alleviated by projecting the aromatic moieties far from the central core of the tetrasaccharide that distorts the chair geometry. A similar situation was found in 11 and 12. The interglycosidic NOE peaks indicate a 3D structure similar to the fully deprotected tetrasaccharides, where the interglycosidic linkages are in syn arrangement. Thus, the backbone geometry is not altered to alleviate steric interactions. The 3D structure is still compatible with a linear rigid high pitch helical structure. However, the strain introduced by the aromatic substituents makes the benzyl groups attached to 11 GlcA carboxylate being unstable in solution and, after some days, are hydrolysed.
Thus, it can be affirmed that the different substitution patterns and sequences analysed do not affect the backbone geometry for the free compounds, as can be seen in the superimposition of minimized structures for the whole series (see Figure 5). Therefore, the relative disposition of substituents at both sides of the glycosidic linkages is at the origin of the local conformational preferences. Thus, the electrostatic repulsion is probably the source of the GAG rigidity, and it is enough to keep the global helical arrangement despite the steric crowding. This supports the critical role of electrostatic energy in the conformational properties of the GAG.
The MD study for all the tetrasaccharides using AMBER with Glycam parameters was evaluated by comparing the experimental values for distances and couplings with the predicted ones. It was satisfactory for the unsubstituted compounds but needed to include an experimental distance restrain to account for the iduronate conformational equilibrium.[18] Some disagreement with the experimental values was found in the free MD simulations of the dibenzylated compounds 6, 7, and 9 related with the ring conformations or the glycosidic linkages NOE pattern. These discrepancies disappeared when we use tar‐MD with the experimental internal distances H1‐H3‐H5 within the rings as restraints. In the case of 9 also, the IdoA equilibrium was adequately simulated. We also observed that the performance of the 6, 7, and 9 glycosidic linkages was also improved with the restriction. For 11 and 12, also an agreement was found, but in this case, the interglycosidic restraints were needed to reproduce the experimental data, coupling, and distances.
Then we subject the library to NMR methods to study molecular complexes (transfer NOE and STD NMR) in the presence of MK. First, we performed NOESY experiments in the presence of MK. By doing this, we can conclude: first, all the tetrasaccharides are capable of bound to MK; second, the enclosed structure is indistinguishable from the free compounds but the correlation time changes in the presence of MK (see Figure 7).
We did STD NMR to explore the contacts between the saccharide and the protein. The transference of magnetization is distributed along the ligand molecule without a preferential region of the tetrasaccharide but with particular emphasis in the aromatic moieties (Figure 10).
In general, the amount of magnetization transfer is proportional to the number of aromatic moieties on the ligand (see Figure 10), compare 1, 6, and 11, or 2, 7, and 12; or 4 and 9. This correlates with the IC50 values that are almost one order of magnitude stronger when it passes from one aromatic at the anomeric position (1 and 2) to three (6 and 7) or seven (11 and 12). Also, the strength of the interaction is proportional to the number of sulfate groups; compare values for 4 and 5. This strongly suggests stabilizing aromatic‐aromatic interactions between the aromatic amino acids of MK and the ligand aromatic moieties. MK has many aromatic amino acids in the internal part of the cavity formed by the two structured domains and the hinge region.
Using two alternative docking programs, Glide and Autodock Vina, we obtain multiple structures that, as an ensemble, can be compatible with saturation arising from all the directions (top, down, left, right). These results are consistent with the ligand inserted into the central cavity formed by the two structured domains and enclosed by the hinged loop, with the aromatic rings extending apart from the core. When we examined the docking structures, we found that they were compatible with the STD results as the direction, sense, and plane of interaction vary within all the assemblies for the same ligand.
The capacity to induce MK production was tested in cell cultures of U251‐MG glioblastoma cells by 1, 3, 4, and 5. They showed induction of MK production but not as significant as the polysaccharide heparin.
As a growth factor, MK participates in different aspects of growth in a variety of cell types. This includes the stimulation of the proliferation rate of NIH3T3 cells.[24] As indicated, MK association with GAGs is a crucial determinant of biological activity. It associates with various GAGs, including heparin, CS, and DS molecules,[25] many of which have been shown to promote cell growth.[26] We have shown here that, according to best affinity towards MK, tetrasaccharide 12 significantly increased MK‐mediated stimulation of NIH3T3 cell growth, even more than CS−A, which argues in favour of the potential therapeutic interest of this kind of compounds. Intriguingly, an important portion of the MK protein in cell extracts displayed increased molecular size in relation to recombinant protein, which might indicate the existence of post‐translational modifications. If these modifications are glycosylations and if they depend on GAG association would be an interesting aspect to address in future research.
Conclusion
The analysed tetrasaccharides representing the pattern of CS−E, 1, and 2, and CS−T, 3, and hybrid sequences DS/CS, 4 and 5, with similar sulfation patterns, were able to bind MK in the micromolar range. The introduction of two aromatic moieties in the molecule increases the binding up to one order of magnitude; see 6, 7, and 8. And finally, the presence of four more aromatics rings improves the IC50 again (11 and 12).
By NMR combined with MD studies, we have proved that the global backbone 3D geometry is the same, independently of the number of aromatics substituents introduced in the molecules. The ring geometry is slightly distorted to accommodate the large volume of these substituents in GlcA instead of changing the conformation as for the IdoA. The MD performance was excellent using the GLYCAM parameters for the unsubstituted compounds, moderate for the partially substituted ones, and poor for the fully substituted ones. The introduction of aromatic substituents has been performed adapting standard AMBER force field parameters. The inclusions of tar‐restraints for intraring interprotonic distances enhance the behaviour with a good agreement also in the glycosidic linkages, but in the case of 12, only when additional restraints for interglycosidic distances were applied the agreement was achieved.
Protocols for the analysis of the complexes based on ligand‐observed methods were applied, and two main conclusions were obtained. First, the structures of the carbohydrates into the complexes were the same as in the free state and did not change upon binding. Second, complexes are fuzzy with multiple solutions covering changes on the relative orientation of the tetrasaccharide into the MK pocket. All potential rotations: top‐down, left‐right, and orientations within the pocket can be justified. In the cases of the mimetics with aromatic substituents, aromatic‐aromatic interactions were also found. These increase the affinity, and according to the analysis on proliferation confirmed, they also increase the activity.
In the most frequent type of carbohydrate‐protein complex, the ligand varies its conformation to adapt to a rigid binding pocket, and a single structure can justify the properties of the complex.[27] In this case, we access the opposite case using carbohydrates substituted with aromatic moieties binding to a receptor with IDP characteristics. The protein is the molecule that changes the most of its 3D structure to form the complex.
Experimental Section
Synthesis: (see the Supporting Information)
Fluorescence polarization assays: In order to calculate IC50 values, fluorescence polarisation competition experiments were performed following our previously reported protocol.[10, 11, 12b, 15] Briefly, we recorded the fluorescence polarisation from wells containing 20 μL of MK (from Peprotech) and 10 μL of probe solution (a fluorescein labelled heparin‐like hexasaccharide) in the presence of 10 μL of tetrasaccharide solutions with different concentrations. 384‐well microplates from Corning were used in these assays. After shaking in the dark for 5 min, the fluorescence polarization was measured using a TRIAD multimode microplate reader (from Dynex), with excitation and emission wavelengths of 485 and 535 nm, respectively. The average polarisation values of three replicates were plotted against the logarithm of tetrasaccharide concentration. The resulting curve was fitted to the equation for a one‐site competition: y=A2+(A1‐A2)/[1+10 (x‐logIC50)] where A1 and A2 are the maximal and minimal values of polarisation, respectively, and IC50 is the tetrasaccharide concentration that results in 50 % inhibition. At least two independent experiments were carried out for each IC50 calculation.
Isothermal calorimetry: ITC was carried out using an iTC200 system (Malvern). All reagents were dialyzed against the assay buffer (50 mM Tris‐HCl, pH 7.4, containing 100 mM NaCl) overnight. Chick midkine (0.02 mM) was titrated in 2‐μL increments against 0.05 mM of titrant at 25 °C. The data were analysed using MicroCal iTC‐ORIGIN analysis software (Malvern).
NMR spectroscopy: NMR experiments were recorded in 600, 700, and 900 MHz Bruker Avance III instruments operating at 600, 700, and 900 MHz, equipped with a cryoprobe (600, QCI Cryo 5 m (1H/19F 15N/13C) for 1H, 15N, 13C, and 19F; 700 MHz QCI Cryo 5 mm for 1H, 13C, 15N, 31P, and 900 TCI Cryo 5 mm (1H/13C/15N) all of them with 2H decoupling). We have assigned the 1H and 13C spectra using the standard methodology based on 1H and 13C NMR methods at natural abundance. First, we used pure D2O to have a first view of the best possible spectra (not commented in this work), and then in the buffer used for the interaction with midkine to have more accurate data in the media where the interactions would be measured. Logically, upon salt addition, the signals become broader, increasing the probability of signal overlapping. This method should yield more accurate data as the potential effects of the media on the saccharide conformation are already accounted.
NMR experiments were recorded using the manufacturer pulse sequences. 1D, 1D‐TOCSY[28] or 1D‐NOESY,[29] 2D COSY with double quantum filter with pulsed field gradient for coherence selection, TOCSY, with using dipsi2 sequence in the mixing period; NOESY was implemented in phase sensitive mode with two 180° pulses flanked with gradients in the mixing time.[30] Both, TOCSY and NOESY were acquired with a z‐filter to suppress interferences of zero quantum coherence.[30] NOESY experiments were preferentially acquired using non‐uniform sampling at 100 % to minimize periodic interferences from the environment due to thermal instability. HSQC were generally acquired using echo/antiecho‐TPPI acquisition with increase of sensitivity, Chirp 180° pulses in 13C, and gradients during back inept.
Coupling constants were calculated from the splitting of the signals in monodimensional 1D, 1D‐TOCSY[28] or 1D‐NOESY,[29] or bidimensional 2D COSY,[31] TOCSY,[29] HSQC,[32] or 3S HSQC.[33] In the case of overlap, we used a line shape analysis as implemented in MestreNova. Interprotonic distances were calculated from NOE data using the ISPA approach using the initial growth rates of the dipolar rate constant by fitting the growing curve of the NOE versus the mixing time to a mono exponential equation employing mixing times from 0.15–0.2 s to 0.8‐1.2 s according to the known procedure[34] recently reviewed by others and us using the PANIC approach when possible.[18, 35]
STD NMR experiments have been performed using home‐written sequences with solvent suppression using watergate or excitation sculpting sequences. In order to avoid the influence of the proton relaxation rates, we use STD0 calculated from the evolution of the STD with the saturation time (tsat), fitted to the equation STD‐AF(t)=a(1‐exp(‐bt)), where the parameter a represents the asymptotic maximum of the STD build‐up curve (STDmax), b is a rate constant related to the relaxation properties of a given proton that measures the speed of the STD build‐up (ksat), and t is the saturation time (tsat). Thus, the STD0 values were obtained as the product of the ab coefficients.[36]
Molecular dynamics: MD was performed using explicit water methodology with AMBER 12–18. GLYCAM06j‐1 Force Field[37] parameters adapted to include non‐carbohydrate substituents were also applied. The procedure has been described, tested, and optimized by us with a library of heparin trisaccharides.[38] The parameters for the substituents that were not included in GLYCAM06j‐1 were taken from AMBER standard libraries, and charges were optimized using RESP procedure.[39] Due to the presence of iduronate residues in some tetrasaccharides, we used time‐averaged restrained molecular dynamics and analysed them collectively.[18] In these cases, the slow conformational equilibria of the iduronate rings, that can exist in 1C4, 2SO, or 4C1 conformations, complicate the analysis.
In all cases, the starting geometries were generated from the available data and modified accordingly. The topologies were built employing the residues and charges published by Woods for GAGs.[41] In the case of IdoA containing tetrasaccharides, two independent starting geometries were built, one with the IdoA residue in the chair 1C4 conformation and one with the IdoA in the 2SO skew boat geometry. Each of these models was immersed in a cube of pre‐equilibrated TIP3P water molecules.
To equilibrate the system, we have followed a protocol consisting of 10 steps.[40] Firstly, only the water molecules and ions were minimized. Then the system is heated to 300 K by a 3 ps MD simulation, allowing only water molecules and ions to move. Next, the whole system is minimized by four consecutive steps imposing positional restraints on the solute, with a force constant decreasing step by step from 20 to 5 kcal/mol. Finally, a non‐restraint minimization (100 steps) is carried out.
The production dynamics simulations (500 ns) were accomplished at a constant temperature of 300 K (by applying the Berendsen coupling algorithm[41] for the temperature scaling) and constant pressure (1 bar). The Particle Mesh Ewald Method[42] (to introduce long‐range electrostatic effects) and periodic boundary conditions were also turned on. The SHAKE algorithm for hydrogen atoms, which allows using a 2.0 fs time step, was also employed. Finally, a 9 Å cut‐off was applied for the Lennard‐Jones interactions.
MD simulations for 11 and 12 have been performed with the Pmemd module of Amber. The trajectory coordinates were saved each 0.5 ps. The data processing of the trajectories was done with the ptraj module of Amber, except for the Cremer‐Pople puckering coordinates, which were calculated using a script from the Woods group.
The time‐averaged restrained molecular dynamics[43] were run following the above‐commented protocol. In the production step, the time‐averaged constraint was imposed as applying an r −6 averaging. The equilibrium distance range was set to r exp−0.1 Å≤r exp ≤r exp+0.1 Å. Trajectories were run at 300 K, with a decay constant of 800 ps and a time step of 1 fs. The force constants r k2 and r k3 used in each case go from 25 to 60 kcal mol−1 A−2. Convergence within the equilibrium distance range was obtained in all cases. The analysis of the 200 ns tar‐MD trajectories has been carried out with the ptraj module of AMBER.[44]
Docking: Docking has been performed using Induced Fit Docking (IDF) as implemented in Glide[45] module of Maestro suite.[46] The complexes structures were constructed using the module AutodockTools 1.5.6 from Autodock Vina.[24] The models 2 and 8 from the NMR ensemble for midkine‐A deposited in the Protein Data Bank (pdb code: 2LUT) were used as models of the protein[47] and minimized structures taken from the tar‐MD of the tetrasaccharides were used for the carbohydrate structures. The initial models were calculated using a centered box, including the complete protein with a grid of 1 Å. The docking was performed considering the complete set of interactions of all the residues within 12 Å or the residues described previously as potential interacting with the ligand for midkine‐B. The clusters, numbered according the 2LUT sequence, were: Cluster 1: K82‐R84‐K105; Cluster2: Q89‐K90‐L92; Cluster3: R38‐R47; Cluster4: K48‐K50‐R52; Hinge: K58‐K59. Both approximations give similar results.
A 30 Å sided cubic grid from the centroid of the ligand was generated. The ten lowest energy conformers of each ligand were submitted to flexible SP docking using Glide. The sampling of ring conformations was turned off. The penalization of the non‐planar conformations for amide type torsions and the sampling of nitrogen inversions were turned on. A distance dependent dielectric constant of 4 was used, and post‐docking minimization was performed.
Biological activity: U251‐MG, a human glioblastoma cell line was obtained from American Type Culture Collection and maintained in Dulbecco's modified Eagle medium (DMEM) supplemented with 10 % of fetal calf serum (FCS). The cells were washed with DMEM and incubated with heparin (Sigma Aldrich) and the synthetic tetrasaccharides at 10 μg/ml. After 18 h, the media were collected and subjected to SDS‐PAGE and western blotting.
The samples were separated on a 5 to 20 % gradient gel (WAKO), and proteins were transferred on nitrocellulose membrane (GE Healthcare). The membrane was blocked with 5 % of non‐fat dry milk in TBS−T and incubated with anti‐MK antibody at 1: 1000 dilution overnight. The Horseradish peroxidase (HRP)‐conjugated anti‐goat IgG was obtained from Jackson ImmunoResearch and used at 1 : 3000 dilution. Chemiluminescent signals were obtained with ECL Plus Substrate (Pierce), and images were acquired with an AI680 image analyser (GE Healthcare).
NIH3T3 cells were cultured in Dulbecco's modified Eagle's medium (DMEM) (Sigma‐Aldrich) supplemented with 10 % fetal bovine serum (Sigma‐Aldrich) and 10 ml/l of an antibiotic solution with Penicillin (100 U/ml) and Streptomycin (10 mg/ml) (Sigma‐Aldrich). MK protein (20 μg/ml, from Peprotech) and the different compounds (2 mM) were combined 1 : 1 before adding them to cells to get final concentrations of 100 ng/ml and 10 μM, respectively. 60,000 cells were plated on 30 mm culture dishes at day 0, and cells were counted at days 1 to 4 in a Neubauer chamber on an inverted microscope (Leika). Cell extracts were prepared in 50 mM Tris‐HCl pH 7.5, 150 mM NaCl, 1 % Triton‐X100, 2.5 mM Mg2Cl, complete protease inhibitor cocktail (Roche) buffer. Recombinant protein (2.5 ng) or whole extract (50 μg) were separated in an SDS gel and transferred to a PVDF membrane (GE Healthcare) to be blotted with MK goat polyclonal antibody (1 : 500, Santa Cruz Biotechnology sc‐1398) and secondary horseradish peroxidase (HRP)‐ conjugated rabbit anti‐goat Ig antibody (1 : 10,000, Sigma‐Aldrich). The membrane was processed with a chemiluminescence ECL system (BioRad) and monitored in a ChemidDoc XRS apparatus (BioRad).
Conflict of interest
The authors declare no conflict of interest.
Supporting information
As a service to our authors and readers, this journal provides supporting information supplied by the authors. Such materials are peer reviewed and may be re‐organized for online delivery, but are not copy‐edited or typeset. Technical support issues arising from supporting information (other than missing files) should be addressed to the authors.
Supporting Information
Acknowledgements
Financial support was provided by the Spanish Ministry of Economy and Competitiveness and the Spanish Ministry of Science and Innovation (Grants: PGC2018‐099497‐B−I00, RTI2018‐099592‐B−C21, CTQ2015‐70134‐P, and GlycoBioChem (Spanish Network of Excellence in Chemical Glycobiology) cofounded by FEDER EU, the Andalusian Government (Grant: FQM‐1303) and action COST CA18103. M−J.G. and S.G. thanks for contracts to MINECO and AG respectively. We acknowledge the NMR services at the Centro di Ricerca di Risonanze Magnetiche (CERM; Florence), Biointeractomics Platform (BIP‐cicCartuja; Seville), and Centro de Investigación, Tecnología e Investigación (CITIUS; Seville) for access. Experimental work was partially supported by Instruct‐ERIC CERM Centre (PID: 3772); and at CITIUS (Bruker‐US prices). We thank Dr. J. Rojo for careful reading of the manuscript and Massimo Lucci and Dr. F. Cantini for their help in the measurement at CERM.
M. J. García-Jiménez, S. Gil-Caballero, S. Maza, F. Corzana, F. Juárez-Vicente, J. R. Miles, K. Sakamoto, K. Kadomatsu, M. García-Domínguez, J. L. de Paz, P. M. Nieto, Chem. Eur. J. 2021, 27, 12395.
Contributor Information
Dr. José L. de Paz, Email: jlpaz@iiq.csic.es.
Dr. Pedro M. Nieto, Email: pedro.nieto@iiq.csic.es.
References
- 1.
- 1a.Muramatsu T., Br. J. Pharmacol. 2014, 171, 814–826; [DOI] [PMC free article] [PubMed] [Google Scholar]
- 1b.Winkler C., Yao S., Br. J. Pharmacol. 2014, 171, 905–912; [DOI] [PMC free article] [PubMed] [Google Scholar]
- 1c.Kadomatsu K., Kishida S., Tsubota S., J. Biochem. 2013, 153, 511–521. [DOI] [PubMed] [Google Scholar]
- 2.Filippou P. S., Karagiannis G. S., Constantinidou A., Oncogene 2020, 39, 2040–2054. [DOI] [PubMed] [Google Scholar]
- 3.
- 3a.Capila I., Linhardt R. J., Angew. Chem. Int. Ed. 2002, 41, 391–412; [DOI] [PubMed] [Google Scholar]
- 3b.Esko J. D., Selleck S. B., Annu. Rev. Biochem. 2002, 71, 435–471; [DOI] [PubMed] [Google Scholar]
- 3c.Gama C. I., Hsieh-Wilson L. C., Curr. Opin. Chem. Biol. 2005, 9, 609–619. [DOI] [PubMed] [Google Scholar]
- 4.Muramatsu T., Curr. Pharm. Des. 2011, 17, 410–423. [DOI] [PMC free article] [PubMed] [Google Scholar]
- 5.
- 5a.Gama C. I., Tully S. E., Sotogaku N., Clark P. M., Rawat M., Vaidehi N., W. A.Goddard, 3rd, Nishi A., Hsieh-Wilson L. C., Nat. Chem. Biol. 2006, 2, 467–473; [DOI] [PubMed] [Google Scholar]
- 5b.Sugahara K., Mikami T., Curr. Opin. Struct. Biol. 2007, 17, 536–545. [DOI] [PubMed] [Google Scholar]
- 6.
- 6a.Bao X., Nishimura S., Mikami T., Yamada S., Itoh N., Sugahara K., J. Biol. Chem. 2004, 279, 9765–9776; [DOI] [PubMed] [Google Scholar]
- 6b.Deepa S. S., Umehara Y., Higashiyama S., Itoh N., Sugahara K., J. Biol. Chem. 2002, 277, 43707–43716; [DOI] [PubMed] [Google Scholar]
- 6c.Nandini C. D., Mikami T., Ohta M., Itoh N., Akiyama-Nambu F., Sugahara K., J. Biol. Chem. 2004, 279, 50799–50809. [DOI] [PubMed] [Google Scholar]
- 7.Varki A., Cummings R. D., Esko J. D., Stanley P., Hart G. W., Aebi M., Darvill A. G., Kinoshita T., Packer N. H., Prestegard J. H., Schnaar R. L., Seeberger P. H., Essentials of glycobiology, third edition, 2017, Cold Spring Harbor (NY): Cold Spring Harbor Laboratory Press; 2015–2017. [PubMed] [Google Scholar]
- 8.
- 8a.Guberman M., Seeberger P. H., J. Am. Chem. Soc. 2019, 141, 5581–5592; [DOI] [PMC free article] [PubMed] [Google Scholar]
- 8b.Mende M., Bednarek C., Wawryszyn M., Sauter P., Biskup M. B., Schepers U., Brase S., Chem. Rev. 2016, 116, 8193–8255; [DOI] [PubMed] [Google Scholar]
- 8c.Sakamoto K., Ozaki T., Ko Y. C., Tsai C. F., Gong Y., Morozumi M., Ishikawa Y., Uchimura K., Nadanaka S., Kitagawa H., Zulueta M. M. L., Bandaru A., Tamura J. I., Hung S. C., Kadomatsu K., Nat. Chem. Biol. 2019, 15, 699–709. [DOI] [PubMed] [Google Scholar]
- 9.
- 9a.Griffin M. E., Hsieh-Wilson L. C., Curr. Opin. Chem. Biol. 2013, 17, 1014–1022; [DOI] [PMC free article] [PubMed] [Google Scholar]
- 9b.Jacquinet J. C., Lopin-Bon C., Vibert A., Chem. Eur. J. 2009, 15, 9579–9595; [DOI] [PubMed] [Google Scholar]
- 9c.Liu P., Chen L., Toh J. K. C., Ang Y. L., Jee J. E., Lim J., Lee S. S., Lee S. G., Chem. Sci. 2015, 6, 450–456; [DOI] [PMC free article] [PubMed] [Google Scholar]
- 9d.Vibert A., Lopin-Bon C., Jacquinet J. C., Chem. Eur. J. 2009, 15, 9561–9578; [DOI] [PubMed] [Google Scholar]
- 9e.Bedini E., Parrilli M., Carbohydr. Res. 2012, 356, 75–85; [DOI] [PubMed] [Google Scholar]
- 9f.Gandhi N. S., Mancera R. L., Drug Discovery Today 2010, 15, 1058–1069. [DOI] [PubMed] [Google Scholar]
- 10.de Paz J. L., Nieto P. M., Org. Biomol. Chem. 2016, 14, 3506–3509. [DOI] [PubMed] [Google Scholar]
- 11.Solera C., Macchione G., Maza S., Kayser M. M., Corzana F., de Paz J. L., Nieto P. M., Chem. Eur. J. 2016, 22, 2356–2369. [DOI] [PubMed] [Google Scholar]
- 12.
- 12a.Macchione G., Maza S., Mar Kayser M., de Paz J. L., Nieto P. M., Eur. J. Org. Chem. 2014, 2014, 3868–3884; [Google Scholar]
- 12b.Maza S., Mar Kayser M., Macchione G., Lopez-Prados J., Angulo J., de Paz J. L., Nieto P. M., Org. Biomol. Chem. 2013, 11, 3510–3525. [DOI] [PubMed] [Google Scholar]
- 13.Zhu X., Schmidt R. R., Angew. Chem. Int. Ed. 2009, 48, 1900–1934; [DOI] [PubMed] [Google Scholar]; Angew. Chem. 2009, 121, 1932–1967. [Google Scholar]
- 14.Mizumoto S., Yamada S., Sugahara K., Curr. Opin. Struct. Biol. 2015, 34, 35–42. [DOI] [PubMed] [Google Scholar]
- 15.Maza S., Gandia-Aguado N., de Paz J. L., Nieto P. M., Bioorg. Med. Chem. 2018, 26, 1076–1085. [DOI] [PubMed] [Google Scholar]
- 16.Martin S. F., Clements J. H., Annu. Rev. Biochem. 2013, 82, 267–293. [DOI] [PubMed] [Google Scholar]
- 17.Ferro D. R., Provasoli A., Ragazzi M., Casu B., Torri G., Bossennec V., Perly B., Sinay P., Petitou M., Choay J., Carbohydr. Res. 1990, 195, 157–167. [DOI] [PubMed] [Google Scholar]
- 18.Munoz-Garcia J. C., Corzana F., de Paz J. L., Angulo J., Nieto P. M., Glycobiology 2013, 23, 1220–1229. [DOI] [PubMed] [Google Scholar]
- 19.Krishna N. R., Jayalakshmi V., Top. Curr. Chem. 2008, 273, 15–54. [DOI] [PubMed] [Google Scholar]
- 20.Angulo J., Diaz I., Reina J. J., Tabarani G., Fieschi F., Rojo J., Nieto P. M., ChemBioChem. 2008, 9, 2225–2227. [DOI] [PubMed] [Google Scholar]
- 21.Lim J., Yao S., Graf M., Winkler C., Yang D., Biochem. J. 2013, 451, 407–415. [DOI] [PubMed] [Google Scholar]
- 22.Friesner R. A., Banks J. L., Murphy R. B., Halgren T. A., Klicic J. J., Mainz D. T., Repasky M. P., Knoll E. H., Shelley M., Perry J. K., Shaw D. E., Francis P., Shenkin P. S., J. Med. Chem. 2004, 47, 1739–1749. [DOI] [PubMed] [Google Scholar]
- 23.Trott O., Olson A. J., J. Comput. Chem. 2010, 31, 455–461. [DOI] [PMC free article] [PubMed] [Google Scholar]
- 24.
- 24a.Kadomatsu K., Hagihara M., Akhter S., Fan Q. W., Muramatsu H., Muramatsu T., Br. J. Cancer 1997, 75, 354–359; [DOI] [PMC free article] [PubMed] [Google Scholar]
- 24b.Muramatsu H., Muramatsu T., Biochem. Biophys. Res. Commun. 1991, 177, 652–658. [DOI] [PubMed] [Google Scholar]
- 25.
- 25a.Milner P. G., Li Y. S., Hoffman R. M., Kodner C. M., Siegel N. R., Deuel T. F., Biochem. Biophys. Res. Commun. 1989, 165, 1096–1103; [DOI] [PubMed] [Google Scholar]
- 25b.Mizumoto S., Fongmoon D., Sugahara K., Glycoconjugate J. 2013, 30, 619–632. [DOI] [PubMed] [Google Scholar]
- 26.Swarup V. P., Hsiao T. W., Zhang J., Prestwich G. D., Kuberan B., Hlady V., J. Am. Chem. Soc. 2013, 135, 13488–13494. [DOI] [PMC free article] [PubMed] [Google Scholar]
- 27.Ardá A., Jiménez-Barbero J., Chem. Commun. 2018, 54, 4761–4769. [DOI] [PubMed] [Google Scholar]
- 28.Kover K. E., Uhrin D., Hruby V. J., J. Magn. Reson. 1998, 130, 162–168. [DOI] [PubMed] [Google Scholar]
- 29.Stott K., Keeler J., Van Q. N., Shaka A. J., J. Magn. Reson. 1997, 125, 302–324. [Google Scholar]
- 30.Thrippleton M. J., Keeler J., Angew. Chem. Int. Ed. 2003, 42, 3938–3941; [DOI] [PubMed] [Google Scholar]; Angew. Chem. 2003, 115, 4068–4071. [Google Scholar]
- 31.Shaw A. A., Salaun C., Dauphin J.-F., Ancian B., J. Magn. Reson. Ser. A 1996, 120, 110–115. [Google Scholar]
- 32.Kover K. E., Hruby V. J., Uhrin D., J. Magn. Reson. 1997, 129, 125–129. [DOI] [PubMed] [Google Scholar]
- 33.Sauri J., Parella T., Espinosa J. F., Org. Biomol. Chem. 2013, 11, 4473–4478. [DOI] [PubMed] [Google Scholar]
- 34.Macura S., Farmer B. T., Brown L. R., J. Magn. Reson. 1986, 70, 493–499. [Google Scholar]
- 35.Hu H., Krishnamurthy K., J. Magn. Reson. 2006, 182, 173–177. [DOI] [PubMed] [Google Scholar]
- 36.Mayer M., Meyer B., J. Am. Chem. Soc. 2001, 123, 6108–6117. [DOI] [PubMed] [Google Scholar]
- 37.Singh A., Tessier M. B., Pederson K., Wang X., Venot A. P., Boons G. J., Prestegard J. H., Woods R. J., Can. J. Chem. 2016, 94, 927–935. [DOI] [PMC free article] [PubMed] [Google Scholar]
- 38.Munoz-Garcia J. C., Lopez-Prados J., Angulo J., Diaz-Contreras I., Reichardt N., de Paz J. L., Martin-Lomas M., Nieto P. M., Chem. Eur. J. 2012, 18, 16319–16331. [DOI] [PubMed] [Google Scholar]
- 39.Bayly C. I., Cieplak P., Cornell W. D., Kollman P. A., J. Phys. Chem. 1993, 97, 10269–10280. [Google Scholar]
- 40.Munoz-Garcia J. C., Chabrol E., Vives R. R., Thomas A., de Paz J. L., Rojo J., Imberty A., Fieschi F., Nieto P. M., Angulo J., J. Am. Chem. Soc. 2015, 137, 4100–4110. [DOI] [PubMed] [Google Scholar]
- 41.Berendsen H. J. C., Postma J. P. M., van Gunsteren W. F., DiNola A., Haak J. R., J. Chem. Phys. 1984, 81, 3684–3690. [Google Scholar]
- 42.Darden T., York D., Pedersen L., J. Chem. Phys. 1993, 98, 10089–10092. [Google Scholar]
- 43.Torda A. E., Scheek R. M., Vangunsteren W. F., J. Mol. Biol. 1990, 214, 223–235. [DOI] [PubMed] [Google Scholar]
- 44.Case D. A., Cheatham T. E. III, Darden T., Gohlke H., Luo R., Merz K. M. Jr., Onufriev A., Simmerling C., Wang B., Woods R. J., J. Comput. Chem. 2005, 26, 1668–1688. [DOI] [PMC free article] [PubMed] [Google Scholar]
- 45.Sherman W., Day T., Jacobson M. P., Friesner R. A., Farid R., J. Med. Chem. 2006, 49, 534–553. [DOI] [PubMed] [Google Scholar]
- 46.G. Schrödinger Release 2015–4: Maestro 10.4, Macromodel 11.0 Schrödinger, LLC, New York, NY, 2015.
- 47.Kirchmair J., Markt P., Distinto S., Schuster D., Spitzer G. M., Liedl K. R., Langer T., Wolber G., J. Med. Chem. 2008, 51, 7021–7040. [DOI] [PubMed] [Google Scholar]
Associated Data
This section collects any data citations, data availability statements, or supplementary materials included in this article.
Supplementary Materials
As a service to our authors and readers, this journal provides supporting information supplied by the authors. Such materials are peer reviewed and may be re‐organized for online delivery, but are not copy‐edited or typeset. Technical support issues arising from supporting information (other than missing files) should be addressed to the authors.
Supporting Information


