

Abstract
The COVID-19 crisis is dramatically affecting the world economy and, particularly, the tourism sector. In the context of extreme uncertainty, the use of probabilistic forecasting models is especially suitable. We use Monte Carlo simulations to evaluate the outcomes of four possible tourism demand recovery scenarios in the Balearic Islands, which are further used to measure the risks and vulnerability of Balearic economy to the COVID-19 crisis. Our results show that fear of contagion and loss of income in tourism emitting countries will result in a maximum 89% drop in arrivals in the Balearic Islands in 2020.Given that most tourism-related occupations are not highly skilled and are characterized by lower salaries, there are greater risks of loss of welfare, especially for women, who are a major share of the tourism labour force.The model shows important differences among minimum, average and maximum estimates for tourism sector production in 2021, reflecting considerable uncertainty regarding the speed of the sector's recovery. The results serve as a basis to prepare a range of policies to reduce destination vulnerability under different crisis outcomes.
Keywords: COVID-19, Vulnerability, Uncertainty, Risk, Monte Carlo, Tourism demand
1. Introduction
Over the 21 Century, tourism has been exposed to several health crises resulting from disease outbreaks, including the SARS, Ebola and MERS epidemics. Though these diseases did not have significant impacts on global tourism (Gössling, Scott, & Hall, 2020), they had impacts at the regional and country levels. For example, SARS was responsible for a 28% loss of tourist arrivals to Taiwan while Ebola was responsible for 41% and 70% losses of tourist arrivals to Guinea and Sierra Leone, respectively (WTTC, 2019). Moreover, disease crises have the second longest average recovery time of 19.4 months following that of civil unrest with an average recovery time of 22.2 months (WTTC, 2019).
On 30 January 2020 the World Health Organisation declared the COVID-19 outbreak a Public Health Emergency of International Concern (PHEIC). It was the sixth notice since this mechanism was included in International Health Regulations in 2005 (Chang, 2020). However, in the beginning of the COVID-19 crisis, most of the world seemed to be convinced that the problem would stay concentrated in China. As noted in the Global Risk Report (WEF, 2020), pandemics were considered to be quite unlikely (Ramelli & Wagner, 2020).
However, theCOVID-19 crisis is taking an unprecedented scale. It is dramatically affecting the world economy and, particularly, the tourism sector (Uğur & Akbıyık, 2020). There are reasons to argue that the tourism sector has certain characteristics that increase its vulnerability to health crises in general and to the health crisis provoked by COVID-19. For example, in tourism, the non-essential nature of most services, limited capacities to supply them remotely and the need for physical proximity render the industry especially vulnerable to supply and demand shocks produced by the COVID-19 crisis. On the other hand, the industry's seasonality, and unskilled labour force have important implications for tourism destinations vulnerability. According to the latest issue of the World Tourism Barometer (UNWTO, 2021), international tourist arrivals saw a decline of 74% in 2020, over the previous year, with arrivals in June down 93%. Asia and the Pacific suffered the largest declines, reporting the drops of 84%. Middle East and Africa both recorded a 75% drop in arrivals, while in Europe arrivals declined by 70%. This severe reduction of displacement towards tourist destinations, necessitate estimations of the potential impacts that this pandemic could have on the tourism economies.
Many institutions have developed scenarios for how coronavirus crisis may affect economies and industries and for how the situation may develop in 2020 and 2021 (see “Expected GDP decline” in Appendix 02). However, the diverse government and business responses to it, make it virtually impossible to produce accurate forecasts (Deloitte, 2020). In tourism, the challenge of forecasting is larger because tourism is a complex system. Zenker and Kock (2020) emphasize that in such systems, a small variation in an explanatory variable can lead to a significantly different outcome of the predicted variable and encourage using scenario-forecasting models to predict complex scenarios. The differences in the estimates of the key risk variables given by different institutions make it impossible to use deterministic forecasting models, which are useful when the conditions of a future situation are assumed rigid. Differently, for a non-deterministic model, which is sometimes called probabilistic or stochastic, the conditions of a future situation are simulated to some probabilistic behaviour of the future outcome (Fong, Li, Dey, González Crespo, & Herrera-Viedma, 2020). Consequently, such models allow making use of different estimates of risk variables. All that make probabilistic models especially suitable to analyse uncertainty.
In this paper we assess the vulnerability of the Balearic Islands economy to the COVID-19 crisis using Monte Carlo (MC) method. Monte Carlo (MC) simulations is a popular probabilistic approach for modelling complex conditions by simulating multiple random paths of the underlying risk factors. MC has shown to be particularly suitable for modelling epidemics, including COVID-19, because the data about the epidemic collected in the early stage are bound to change (Fong et al., 2020). MC uses random number generation to generate random samples of input trials to explore the behaviour of a complex situation. For example, in the case of tourist arrivals two factors are taking on special importance – the income loss and the fear of travelling. To perform our MC simulations of future tourist arrivals, we propose to use a random number generator based on available estimates of expected GDP decline provided by different national and international institutions, and empirical estimates from the existing literature related to income elasticity, the expected fall in tourist demand related to fears due to external shocks and duration of such impacts over time.
The focus of this paper is to develop an accurate methodology to analyse complex scenarios in situations of extreme uncertainty, such as the one presented by the unprecedented COVID-19. This method would allow us to evaluate the effect of different risk factors on the vulnerability of the tourism industry to a pandemic. The specific objectives of this research are as follows. The first objective is to contribute to the understanding of tourism's exposure and vulnerability to the economic crisis provoked by COVID-19. The second objective is to apply Monte Carlo simulation to evaluate the outcomes of four possible scenarios of tourist demand recovery in the Balearic Islands in 2020 and 2021.Specifically, we evaluate how the expected loss of income, fear of travelling and lockdown of borders will affect international arrivals at the Balearic Islands. It should be noted that the objective is not to elaborate the most accurate scenario, but to show the outcomes of different scenarios. The third objective is to estimate the vulnerability of the Balearic Islands to the fall in tourist arrivals provoked by the COVID-19 crisis. Applying the expected fall in arrivals predicted by the Monte Carlo simulations to the Input-Output Tables at the local level (Caporin, 2008; Frechtling & Horváth, 1999; Johnson & Moore, 1993; Sastre, Rey-Maquieira, & Arbulu, 2017), we will show the outcomes of four scenarios for tourism demand recovery on macroeconomic indicators such as production and employment.
This paper is structured as follows. Section 2 discusses tourism's exposure and vulnerability to a health crisis and the nature of supply and demand shocks. Section 3 describes Monte Carlo simulation and four possible tourist arrivals recovery scenarios that will be estimated using this methodology. Section 4 estimates the vulnerability of the Balearic Islands to the drop in arrivals due to the COVID-19 crisis using Input-Output Tables, and Section 5 concludes.
2. Tourism and pandemics
2.1. Risk management in tourism
The tourism industry is acknowledged to be highly sensitive to crises and disasters (Ritchie, 2004). In their theoretical review on tourism risk, Williams and Baláž (2015) argue that the industry is especially vulnerable to exogenous hazards, such as natural and sociopolitical disasters, and they outline that important risks exist at all industry levels, from the firm level to the destination level and the nation-wide level. Risk management hence has a crucial role in tourism competitiveness (Liu, Cheng, & OuYang, 2019).
Although this area started to receive attention from researchers more than two decades ago (Faulkner, 2001), recent literature reviews on risk management show that this knowledge area still has important research potential. For example, Williams & Baláž (2015, p.282), in their review of the theoretical foundations and definitions of risk and uncertainty in tourism, find that there is “theoretical fragmentation of the understanding of risk and uncertainty, resembling a patchwork of disconnected ideas across scales and disciplines”. Ritchie and Jiang (2019), in their review of research on tourism risk, crisis and disaster management identify three general gaps: “(1) a lack of conceptual and theoretical foundations, (2) lack of empirical testing of models/theory, and (3) unbalanced research theme coverage.” Particularly, the latter refers to the lack of research on the factors affecting vulnerability and resilience in tourism. The understanding of vulnerability factors is essential to create appropriate risk reduction and mitigation measures (Ritchie, 2004) and efficient resilience policies (Calgaro, Lloyd, & Dominey-Howes, 2014), which in turn is a necessary condition to make a tourism destination sustainable (Espiner, & Orchiston, C.& Higham, J., 2017; Fountain & Cradock-Henry, 2020; Melián-Alzola, Fernández-Monroy, & Hidalgo-Peñate, 2020).
Similar to the non-tourism literature (Noy & Yonson, 2018), the concept of tourism disaster risk and vulnerability are closely related (Liu et al., 2019). Vulnerability refers to “the conditions determined by physical, social, economic and environmental factors or processes which increase the susceptibility of an individual, a community, assets or systems to the impacts of hazards” (UNDRR, 2020). More vulnerability will lead to a greater risk for the economy, given the same exposure to the hazard (Noy & Yonson, 2018). Exposure refers to the degree to which an exposure unit (people, infrastructure, production capacities, etc.) encounters shocks (UNDRR, 2020). In turn, hazard is “a process, phenomenon or human activity that may cause loss of life, injury or other health impacts, property damage, social and economic disruption or environmental degradation” (UNDRR, 2020). In tourism, the concepts of hazard, exposure and vulnerability have been addressed for a wide range of natural and man-made disasters, but not specifically for pandemics (Baker & Coulter, 2007; Becken, Mahon, Rennie, & Shakeela, 2014; Brown, Rovins, Feldmann-Jensen, Orchiston, & Johnston, 2017; Jamaliah & Powell, 2019; Miller & Engemann, 2008; Sio-Chong & So, 2020; Student, Lamers, & Amelung, 2020; Tsai & Lin Liu, 2017).
2.2. Tourism vulnerability to pandemics
One of the key differences is that while health hazards do not destroy infrastructure, they affect flows. Damages to flows include production losses due to business interruptions, supply chain disruptions, macroeconomic feedback, and long-term adverse consequences for economic growth (Hallegatte, 2014). Damages to flows start with the beginning of an epidemic and continue to be incurred until full recovery is achieved. What makes tourism especially exposed and vulnerable to a health crisis? The tourism industry's high exposure to viruses is related to the nature of tourism activities. First, many tourism workers require proximity to tourists to provide their services (Sönmez, Apostolopoulos, Lemke, & Hsieh, 2020). For example, an INAIL (2020) report on COVID-19 infection risk evaluates risks to canteen workers and waiters as moderately high. Second, tourism is centred on movement and social interaction which implies a higher risk of contagion (Neuburger & Egger, 2020). This is further aggravated by the highly labour-intensive nature of the tourism industry.
Tourism seems to be especially vulnerable to a health crisis since the policies that look forward to counteracting virus propagation (mobility restrictions and social distancing) affect most tourism related services, producing supply shocks. There are two key factors to assess job loss because of social distancing. The first factor is how many activities of each occupation can be performed remotely. To measure it, del Rio-Chanona, Mealy, Pichler, Lafond, & Farmer, 2020 created a Remote Labour Index (RLI) for each occupation by calculating the proportion of activities that can be performed from home. The second factor concerns which industries are considered essential. A health crisis also produces demand shocks which are preferably linked to a fear of being infected.
Fig. 1 shows the supply and demand shocks for different occupations. For supply shocks, level 0.0 means that there is no negative supply shock, and that work can be done from home or the occupation belongs to an industry deemed essential by the government. Level 1.0 refers to occupations that are not essential and cannot be performed remotely. Demand data are drawn from del Rio-Chanona, Mealy, Pichler, Lafond, & Farmer, 2020, which is based on estimates made by the Congressional Budget Office (CBO). In Quadrant III at the bottom left are examples of occupations most at risk, as they are the most vulnerable to both supply and demand shocks. By contrast, Quadrant II lists occupations for which supply, and demand shocks have been lower and that therefore show less risk of job loss.
Fig. 1.

Occupation-level supply and demand shocks.
Source: Authors' elaboration based on del Rio-Chanona, Mealy, Pichler, Lafond, & Farmer, 2020.
A high concentration of tourism related occupations in the Quadrant III show very significant risks for this industry of being negatively affected by the COVID-19 crisis due to both supply and demand shocks. Furthermore, the graph shows another characteristic that adds another risk to activities related to tourism: seasonality. As can be observed, occupations marked with a red arrow indicate a high degree of seasonality in the tourism industry. When the period of confinement to prevent virus spread is relatively close to the high season of tourist activity, there is an increased risk of unemployment becoming long-term, as the low season may coincide with the end of the confinement period. In cases of hysteresis, such risks become permanent rather than transitory.
Moreover, some characteristics of tourism labour render this sector more vulnerable. Gössling et al. (2020) notes that workers in the accommodation and food services sector have the lowest annual earnings of workers of all sectors. This implies that such occupations have higher risks of welfare loss. Fana, Tolan, Torrejón, Urzi Brancati, and Fernández-Macías (2020) show that young, female, temporary contract and low skilled workers (all of whom are typical for the tourism sector) are especially vulnerable when working in occupations of non-essential sectors. Moreover, tourism is also characterized by “fickle” workers with low productivity, long periods of unemployment and a low probability of staying in a job for more than two years. Gregory, Menzio, and Wiczer (2020) argue that in an economy characterized by such industries, the probability of a recession following an L-shaped pattern increases.
In the case of island tourism economies there are additional features which are highly relevant for understanding tourism vulnerability to a health crisis. Briguglio, Cordina, Farrugia, and Vella (2009) relate the economic vulnerability of countries to their economic openness to trade, export concentrations, and dependence on strategic imports. This perspective implies that small economies are particularly vulnerable to external shocks, as their size limits their abilities to diversify exports. This is the case for many small island economies, a majority of which are characterized by the dominance of tourism sector over other industries (Demir, Gozgor, & Paramati, 2020; Dodds & Graci, 2012).
Furthermore, insularity renders air transport a crucial element to the tourism supply chain. Amidst a health crisis, this creates a serious problem for tourism demand due to the high probability of contagion on airplanes. Moreover, travellers may fear getting stuck on the island if restrictions on air mobility apply.
At the same time, the small islands have several unique strengths that can help them compensate their vulnerability to some extent. First, their insularity can help them control the entry of persons and thus virus propagation. Second, the size of small island states also makes it easier for them to develop a coherent brand and thus signal that they offer a niche product (Scheyvens & Momsen, 2008). These two factors imply that an island can more effectively control the spread of the virus, become a virus-free destination faster than mainland destinations and be the first to receive tourists using so called “safe corridors”.
3. Monte Carlo simulation in the situations of extreme uncertainty
3.1. Methodology
Currently, risk analysis typically involves applying Bayesian statistical procedures to study the uncertainty of model predictions. Despite the growing popularity of the Bayesian approach in academic fields such as marketing and management, it still receives little attention in the tourism literature (Assaf, Tsionas, & Oh, 2018; Zyphur & Oswald, 2013).
The difference between the Bayesian approach and traditional sampling-theory is that in the Bayesian paradigm, the data are fixed (known), and statistical uncertainty comes from the stochastic nature of the parameters, whereas in traditional sampling-theory we assume that the coefficients are fixed but unknown (Assaf et al., 2018). Therefore, with the Bayesian paradigm, we can calculate posterior distributions of the parameters, given the data, using Bayes' theorem.
The Bayesian view argues that the use of scientific knowledge, expert judgement and past experience is useful in assessing probability distributions and that these can later be combined to reach an updated information state (Dakins, Toll, Small, & Brand, 1996). One Bayesian procedure frequently used in risk analysis is the Monte Carlo (MC) method, which allows one to simulate various mathematical scenarios (Pritsker, 1997; Sun & Hong, 2010). MC simulations are an extremely powerful tool for understanding and quantifying the potential effects of uncertainty and can be applied to a wide range of risk models (Kwak & Ingall, 2007; Miller & Engemann, 2008). Therefore, the use of MC simulations is appropriate for the analysis of tourism markets affected by supply and demand shocks due to COVID-19as explained above.
The purpose of traditional Monte Carlo methods is to formulate simulations on the value of a given parameter “π” for which F(π) is the invariant distribution. Monte Carlo simulation, by using a series of “K” random draws (), can be used to construct simulation-based estimates of the invariant distribution, called , which is useful for inference as a proxy for F(π) (Burda & Bélisle, 2019; Dakins et al., 1996).Furthermore, note that is an unbiased and consistent estimator of F(π) (Pritsker, 1997).
For the purposes of this paper, we consider a deterministic model (input-output model) that is represented by y = η(x) where “x” is a vector of input variables and “y” is the model output. Furthermore, η(.) is a complex model such that the way that the model responds to changes in its inputs is complex as well. Therefore, the Balearic economy model is based on an input-output model coefficient matrix defined by the intersection of housing sector rows and industry supply and service supply columns set as “design parameters” for a Balearic economic system.
An input-output model represents all flows of goods and services among intermediate and final sectors expressed in a disaggregated form and related to a given period. This implies the collection of a great volume of information (Bonfiglio & Chelli, 2008). Therefore, this model is suitable to understand the impact of the reduction of tourist arrivals in the Balearic economy.
We apply a ‘baseline’ (x0) for x to measure how the estimated output y = η(x) might differ from the baseline output y0 = η(x0). For the purposes of this research, the baseline model was developed to capture existing tourism flows in the Balearic Islands without external disruptions.
Under the COVID-19 scenario, once social distance policies are implemented, there is an important change in tourist arrivals that reduces total tourism expenditures at the destination. Therefore, to predict the correct value of that model output, it is important to update the parameters that contribute most to the uncertainty of the solution and particularly to tourist arrivals flows.
Once the structure of a deterministic input-output model is set, the second stage of the process involves the data generating process (DGP) for those variables that could have a significant change due to COVID-19. Therefore, the model includes certain variables (risk variables) that can have different possible values represented by a probability distribution function per variable (Kwak & Ingall, 2007). To implement the MC analysis, an appropriate likelihood function for the observations must be formulated based on an understanding of the data gathering process.
The main objective of the MC simulation is to try to imitate the behaviour of real variables to analyse or predict how they will evolve over time. A key point in this task is the data generating process (DGP) which is a generation of random numbers with computer software. These numbers are not considered purely random since they are created by a formula based on past data with some given probability distributions; however, as the process is repeated several times, the outcome is very similar to the random variables. This reason is why they are called pseudo-random numbers.
With the simulation of pseudo-random variables (DGP), we can model possible outcomes by substituting the possible range of values (a probability distribution) for any factor with inherent uncertainty. Therefore, by calculating the results repeatedly (each time using a different set of random values of the probability functions) we can calculate the impact of risks or uncertainties on the output variables. This reason is why this method is useful for quantitative risk analysis, where numerical values are assigned to risks.
Because of the randomness of the tourist arrival and the cruise ship passenger's processes (Zakhary, Atiya, El-Shishiny, & Gayar, 2011), one realization (a punctual estimation) is not sufficient. It is important to generate many possible paths over time in an MC simulation, and then take the mean of these paths to forecast. These simulations show not only what can happen, but also how likely this outcome is. The aim of this paper is to model all these processes as faithfully as possible in the Balearic economy.
To investigate the nature of uncertainty in the model, the MC method simulates several draws (100,000) by randomly choosing each time the variable from its probability distribution to obtain empirical probability distributions for direct impacts on: (1) tourist arrivals, (3) cruise ship passengers (3) Gross Value Added (GVA) and (4) employment calculated through iterations of the model.
The selection of input probability distributions for MC analysis can be based on estimates from the literature, experimental studies, or data depending on the amount and quality of information available (Dakins et al., 1996; Sastre et al., 2017). In practice, the final selection of input probability distributions involves a subjective assessment by the researchers. Thus, we propose that the tourism arrivals and the number of cruise ship passengers to the Balearic Islands will be affected by the fear of travelling (fear effect), drop in income (income effect) and social distance policy scenarios. The “fear effect” is defined by two variables: the expected fall in tourist demand related to external shocks and duration of external shocks on tourism demand. The “income effect” is defined by the expected GDP decline in main inbound markets and income elasticity of tourism demand in these markets.
To perform simulations, we use a random number generator based on the estimates of expected GDP decline provided by different national and international institutions, and empirical estimates from the existing literature related to income elasticity, the expected fall in tourist demand (tourists and cruise ship passengers) related to fears due to external shocks and their impact over time (see Appendix 02 for more details). The intrinsic characteristics of historical DGP data are traditionally used in Monte Carlo analysis (Barry, 1996; Miller & Engemann, 2008). Thus, to perform the analysis, we simulate 100,000 draws of exogenous shock for the selected variables in each of the four alternatives explained in the section 3.2. Fig. 2 presents a diagram of the methodology described above.
Fig. 2.

Diagram of the methodology.
From an analysis of empirical evidence available from international academic journals and reports, we set the DGP for each risk variable that would impact the output variables (GVA and employment).
It should be mentioned, that traditionally, input-output models were criticised for the deterministic nature of their technical coefficients. However, the use of MC simulation in the context of input-output models helps overcome this limitation. Specifically, MC simulation allows integrating various sources of uncertainty to a unique Input-Output framework and assessing the effect of shocks on the endogenous (output) variables (Rey, West, & Janikas, 2004; Sastre et al., 2017).
3.2. Scenarios for tourist arrivals
Many institutions have developed scenarios to try to reflect the unprecedented uncertainties of the COVID-19 crisis (BankofSpain, 2020; IMF, 2020; UNWTO, 2020). Uncertainty is defined based on the duration and intensity of the health crisis. Possible rebounds and their intensity are unknown. There is also enormous uncertainty concerning the discovery of effective treatments, among which vaccines play an essential role. All of this translates into the unpredictability of the duration and intensity of measures used to try to control the spread of the virus. Therefore, the economic consequences of measures designed to contain the virus based on social distancing require different scenarios that reflect this uncertainty.
We use a similar approach to the one proposed by del Rio-Chanona, Mealy, Pichler, Lafond, & Farmer, 2020 to define the four scenarios and then estimate the resulting reduction in tourist arrivals to the Balearic Islands. Occupations linked to the tourist industry cannot be performed from home in most cases. In addition, tourism has been considered a non-essential activity in Spain. Therefore, to prevent the spread of COVID-19 through social distance, the government prohibits tourist activity. While this situation persists, we consider a supply shock of close to a 100% fall in production to be dominant. In the event that the government allows for the development of tourist activity without limitations, restrictions on the production of the tourist activity are determined by the demand shock. In this case, the fall in demand for tourism is mainly attributable to the fall in income due to economic recession and to fears of travelling due to possible virus contraction. For intermediate situations in which there are certain restrictions on the development of tourist activity we consider whether the drop in demand due to the factors described above is greater than the supply shock attributable to government-imposed limitations. Thus, for example, if limitations placed on hotels represent 30% and the drop in demand is 50%, we consider economic restriction to be determined by the drop in demand.
The Monte Carlo simulations will be applied to four possible scenarios of tourist demand recovery in the Balearic Islands to forecast the year 2020 and 2021. As explained above, the objective is not to elaborate the most accurate scenario, but to demonstrate the use of Monte Carlo simulation to evaluate the outcomes of different scenarios.
Scenario A. The tourism industry develops normally until March 15th, 2020.The destination is closed from March 15th to October 1st, 2020 (Q4). In Q4 the destination opens for tourism but demand shock (due to social distance measures imposed in countries of origin, a fear of travelling, falling incomes and Q4 being the low season) dominates possible supply restrictions. We do not consider the case of a full lockdown in Q4 of 2020 and in 2021. In this case, the supply shocks would be determining the drop in tourist activity. For 2021, the fall in tourist arrivals will be still determined by the demand shock due to the fall in incomes of sending countries, a residual fear of travel, and the fact that Q1 and Q4 are low seasons.
Scenario B. This scenario is the same as scenario A, but domestic tourism to the Balearic Islands (affected by the demand shock explained above) opens in Q3 of 2020 (high season).
Scenario C. This scenario is the same as scenario A, but domestic and German tourism to the Balearic Islands (affected by the demand shock explained above) opens in Q3 of 2020.
Scenario D. This scenario is the same as scenario A, but domestic, German and British tourism to the Balearic Islands (affected by the demand shock explained above) opens in Q3 of 2020.
3.3. Cruise passengers forecast
To carry out a broader analysis of tourism in the region, the case of cruise ship passengers was also considered. Unlike tourists, cruise ship passengers do not stay overnight; therefore, they are not considered tourists in the official tourist arrival statistics. Moreover, their tourist expenditure structure is different due to the length of their stay.
To consider the impact of COVID-19 on these visitors, we differentiate between transit cruise passengers and cruise passengers who have a base port in the region. This is important because cruise passengers with a base port in the Balearic Islands have already been incorporated into the tourist statistics that we used before.
A detailed estimate of the effect of the reduction of cruise passengers to the Balearic Islands is presented in Appendix 03, along with its corresponding expenditure within each sector of the economy.
4. Measuring the economic risks and vulnerability of the Balearic Islands
4.1. Balearic Islands and tourism
The Balearic Islands are in the Mediterranean of the northeast coast of Spain. They have 1428 km of coastline, a total surface area of 4.984 km2 and 1,149 millions of inhabitants. The region comprises four main islands, Mallorca, Menorca, Ibiza, and Formentera. Mallorca is the largest, with 78% of the population, Ibiza is the second largest with 13%, Minorca is the third 8% largest and the smallest is Formentera with 1%. The regulated tourist accommodation capacity for the entire archipelago is 443 thousand tourist beds, with a ratio of 1 tourist bed for every 2.6 inhabitants. This ratio in the smaller islands is between 1.5 in Formentera and 1.9 in Ibiza (see Table 1 ).
Table 1.
Balearic islands - population & tourist beds by Island.
| Population | Tourist beds | Population /Tourist beds | |
|---|---|---|---|
| Mallorca | 896.038 | 303.566 | 3,0 |
| Menorca | 93.397 | 52.466 | 1,8 |
| Eivissa | 147.914 | 78.891 | 1,9 |
| Formentera | 12.111 | 8.096 | 1,5 |
| Balearic Islands | 1.149.460 | 443.019 | 2,6 |
The distribution of GDP by sector shows productive specialization in the service sector, which represents approximately 85% of the total and where the characteristic activities of tourism are 35% of the GDP (see Fig. 3 ).
Fig. 3.

Balearic Islands - GDP by sector.
The Balearic Islands are a major tourist destination worldwide. In 2019, the destination received 17.05 million tourists (14.08 international and 2.87 million domestic tourists). Most tourist arrive by plane (85%). The main countries of origin for international tourism are Germany (4.5 million), the United Kingdom (3.7 million), France (0.76 million) and Italy (0.72 million). On the other hand, domestic tourism with 2.9 million represents 16.8% of the total (see Fig. 4 ).
Fig. 4.
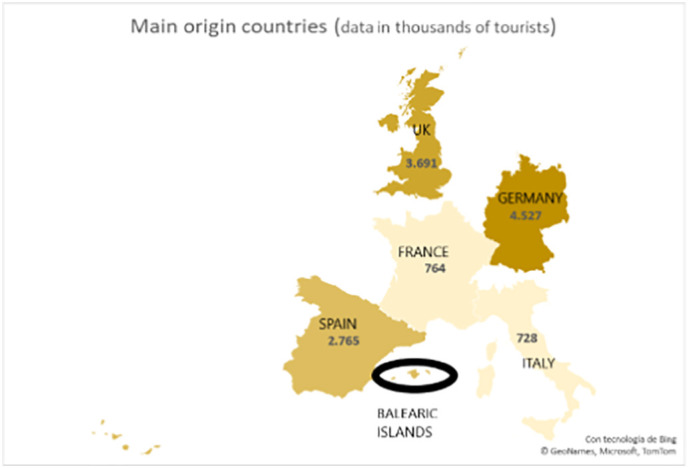
Main origin countries.
The main reason for visiting the islands is leisure/vacations (92%)(Fig. 5 ). The main form of accommodation are hotels (69%)(Fig. 6 ), renting houses or apartments (13%) and stays in the houses of friends or relatives (12%). The Balearic Islands have been considered in the literature as an example of mass tourism since the 1960s (Aguilo & Juaneda, 2000).
Fig. 5.

Balearic Islands - Main reason for the trip.
Fig. 6.

Balearic Islands - type of accommodation.
Since 2000, there has been an international methodology supported by the WTO, the OECD and Eurostat, called the Tourism Satellite Account: Methodological References –TSAMR (UN, Eurostat, & UNWTO, 2010).
The Balearic archipelago is one of the most important destinations for cruise tourism in the western Mediterranean. The four main ports (Palma, Alcudia, Menorca and Ibiza) received a total of 1.08 million cruise passengers in 2019, which is equivalent to a 71.5% growth compared to the total passengers received in 2010. Moreover, 22.7% of the total cruise passengers have the port of Palma as their base port, and the rest (77.3%) are transit passengers for the total number of ports.
Regarding the base cruise passengers, 20% of them stay at a hotel before or after the cruise; in this case, the expenditures made have already been considered as tourist expenditure and is included in the section. On the other hand, cruise passengers in transit have an average expenditure of € 72, while the base cruise passengers, who do not stay at a hotel, have an average expenditure of € 4 (APB (Autoridad Portuaria de Baleares), 2018).
4.2. Monte Carlo simulation results
In this section, we assess direct effects of income loss, social distance and fear of travelling on tourist arrivals. The design of the simulations and their execution generated a series of probability distributions for risk variables and tourist arrivals for the four alternatives described in section 3.2. Fig. 7 thus shows the tourist arrival forecast for each alternative and Fig. 8 shows the cruise ship passengers forecast.
Fig. 7.

Tourist arrival forecasts.
Fig. 8.

Cruise ship passenger forecast.
As one can observe, in each of the four alternatives, social distance policies (lock-down) in European countries will generate a considerable drop in tourist arrivals to the Balearic Islands. Thus, for the baseline scenario, we can expect a drop in the number of tourist arrivals equivalent to 89% of 2019 levels. This value can fluctuate between maximums of 85% and 94%. On the other hand, for scenarios B, C and D, expected falls in tourist arrivals would reach 83%, 75% and 68%, respectively.
It is important to note that the forecasts for 2021 show similar results between scenarios due to our assumption that there will be no lockdowns and that all tourists will be able to travel to the Balearic Islands. The differences observed between maximum, medium and minimum estimates are due to uncertainty in the speed of income recovery and to the residual effect of fear. A histogram of tourist arrivals for each scenario is presented in Appendix 01 and a summary of these series is presented in Table 2 .
Table 2.
Tourist arrival forecast series summary.
| BASELINE SCENARIO |
SCENARIO B |
SCENARIO C |
SCENARIO D |
|||||||
|---|---|---|---|---|---|---|---|---|---|---|
| 2019 | 2020 | 2021 | 2020 | 2021 | 2020 | 2021 | 2020 | 2021 | ||
| TOURIST ARRIVALS (THOUSAND) | MIN | 17,056 | 966 | 6808 | 1663 | 7512 | 1981 | 7866 | 2370 | 7201 |
| MEAN | 17,056 | 1904 | 13,303 | 2963 | 13,814 | 4182 | 13,805 | 5405 | 13,806 | |
| MAX | 17,056 | 2630 | 16,265 | 3837 | 16,242 | 5703 | 16,234 | 7575 | 16,320 | |
The recovery from the impacts of COVID-19 on tourist arrivals, in the best case scenario, is expected to take at least two years to reach the arrival levels of 2019. Furthermore, in the case of cruise ship passengers, the drop has been even higher (see Table 3 ); a histogram of cruise ship passenger forecasts is presented in Appendix 01.
Table 3.
Cruise ship passengers forecast series summary.
| TOTAL PASSENGERS |
TRANSIT |
BASE |
||||||
|---|---|---|---|---|---|---|---|---|
| 2019 | 2020 | 2021 | 2020 | 2021 | 2020 | 2021 | ||
| CRUISE SHIP PASSENGERS (THOUSAND) | MIN | 1.084 | 52 | 9 | 28 | 0 | 24 | 0 |
| MEAN | 1.084 | 52 | 111 | 28 | 81 | 24 | 30 | |
| MAX | 1.084 | 52 | 191 | 28 | 143 | 24 | 54 | |
Therefore, economic impacts of the decline of the tourism sector of the Balearic Islands are expected generate a significant drop in production and employment (See Table 4 ). This estimation and its corresponding analysis are described in the following section.
Table 4.
Expected economic impacts 2020 (medium estimate in thousands of Euros and in %; maximum and minimum estimate % range in parenthesis).
| 2020 | Agriculture | Industry | Construction | Non-touristic services | Accommodation | Restaurants | Transport and annexes | Rental services | Travel agencies, TOO | Sports, recreation and financial services | TOTAL ECONOMIC IMPACT |
|---|---|---|---|---|---|---|---|---|---|---|---|
| Scenario A GVA Reduction | −81.235 | −775.316 | −172.890 | −2.400.290 | −2.625.332 | −1.260.832 | −872.970 | −375.017 | −91.924 | −1.194.415 | −9.850.223 |
| −57,59% (−61,16-54,84) |
−32,99% -(35,03-31,41) | −8,47% (−9,00 -8,07) |
−14,37% (−15,26–13,69 |
−89,53%-(95,07 -85,24) | −76,44% -(81,18 -72,78) | −45,72% -(48,55 -43,53) | −88,71% (−94,20 -84,46) | −29,61% -(31,45 -28,19) | −75,86% -(80,56 -72,23) | −32,79% -(34,82–31,22) | |
| Scenario B GVA Reduction | −75.554 | −721.099 | −160.800 | −2.232.440 | −2.441.745 | −1.172.663 | −811.924 | −348.793 | −85.496 | −1.110.891 | −9.161.404 |
| −53,57% (−58,51-50,25) |
−30,68%-(33,51 -28,78) | −7,88% (−8,61-7,39%) |
−13,36%-(14,59 -12,53) | −83,27% (−90,95 -78,11) |
−71,10% -(77,66 -66,69) | −42,53% -(46,45 -39,89) | −82,50% (−90,12 -77,39) | −27,54% -(30,08 -25,83) | −70,55% (−77,06 -66,18) |
−30,50% (−33,31-28,61) |
|
| Scenario C GVA Reduction | −69.023 | −658.768 | −146.901 | −2.039.471 | −2.230.684 | −1.071.300 | −741.743 | −318.643 | −78.105 | −1.014.867 | −8.369.506 |
| −48,94% (−57,30–43,16) |
−28,03% (−32,82 -24,72) |
−7,20% (−8,43 -6,35) |
−12,21% (−14,29-10,76) |
−76,07% (−89,07-67,08) |
−64,95% (−76,05 57,28) |
−38,85% (−45,49 -34,26) |
−75,37% (−88,25 -66,47) |
−25,16% (−29,46-22,19) |
−64,46% (−75,47 -56,84) |
−27,86% (−32,62 -24,57) |
|
| Scenario D GVA Reduction | −62.465 | −596.172 | −132.942 | −1.845.681 | −2.018.725 | −969.505 | −671.263 | −288.366 | −70.684 | −918.435 | −7.574.239 |
| −44,29% (−55,82 -36,04) |
−25,36% (−31,97 -20,64) |
−6,51% (−8,21 -5,30) |
−11,05% (−13,92 -8,99) |
−68,84% (−86,77 -56,02) |
−58,78% (−74,09 -47,84) |
−35,16% (−44,32 -28,61) |
−68,21% (−85,98 -55,51) |
−22,77% (−28,70 -18,53) |
−58,33% (−73,52 -47,47) |
−25,21% (−31,78 -20,52) |
4.3. Measuring economic risks: Input-output model
The Balearic Islands economy is highly dependent on the services sector, which represents 84.91% of its total Gross Domestic Product (INE, 2020), and characteristic tourism activities represent 34.49% of Balearic GDP, demonstrating the importance of the tourism sector to the Balearic economy and society. Its accommodation sector, the most important of tourist activities, currently manages 2847 establishments (including hotels, apartments, rural tourism accommodations and camping facilities) with 205,300 rooms and 441,284 beds.
To measure the economic impact of the reduction of tourists according to the above sections, data on expected volumes of tourists from the Monte Carlo simulation are applied to the four scenarios and to measure impacts on tourist consumption. For this test we use the Input Output Framework of the Balearic Islands 2014 – MOIB 2014 (IBESTAT, 2020) where the consumption of non-residents and their distribution by product and activity are taken as a vector of demand. In this case, the expenses of non-residents in 2019 (INE, 2020) are distributed in the same proportion as that in 2014 (MIOB 2014).
The MIOB 2014 divides the Balearic economy into 70 products, allowing a very high level of disaggregation to calculate the impacts of tourism consumption with a very high level of disaggregation. We have grouped these products into 10categories.According to the “Tourism Satellite Account: Recommended Methodological Framework 2008” (UN, Eurostat, & UNWTO, 2010), six of the ten categories are tourist: (1) accommodation; (2) restaurants; (3) transport and annex services; (4) rental services; (5) travel agencies and TOO; and (6) sports, recreation and financial services. The other four categories of other activities were mainly affected by tourist consumption.
Calculating the economic impact of tourism through the Input-Output Framework (MIO) involves the explicit modelling of intersectoral relationships that take place within the economic system of this model, and the economic impact of an exogenous increase in demand is estimated with the following model:
| (1) |
where X is effective production, (I-A)−1 is the inverse matrix of Leontief and D is demand (in this case, tourist consumption), which allows us to analyse how a reduction in tourist spending is transmitted to the different sectors of the Balearic economy. Induced effects are however not included to avoid overestimating impacts (Sun, 2007). The results are detailed in.
and Table 5 .
Table 5.
Expected Economic Impacts 2021 (medium estimate in thousands of Euros and in %; maximum and minimum estimate % range in parenthesis).
| 2021 | Agriculture | Industry | Construction | Non touristic services | Accommodation | Restaurants | Transport and annexes | Rental services | Travel agencies,TTOO | Sports, recreational and financial services | Total impact of tourists arrivals fall | Total impact OF cruise ship passengers FALL | Total economic impact |
|---|---|---|---|---|---|---|---|---|---|---|---|---|---|
|
Scenario A GVA Reduction |
−20.124 | −192.068 | −42.830 | −594.620 | −650.369 | −312.344 | −216.259 | −92.902 | −22.772 | −295.890 | −2.440.178 | −145.457 | −2.585.635 |
| −14,27% (−38,95 -3,01) |
−8,17% (−22,31 -1,72) |
−2,10% (−5,73-0,44) |
−3,56% (−9,72 -0,75) |
−22,18% (−60,55-4,68) |
−18,94% (−51,70-3,99) |
−11,33% (−30,93 -2,39) |
−21,98% (−60,00-4,64) |
−7,34% (−20,03-1,55) |
−18,79% (−51,31 -3,96) |
−8,12% (−22,18 -1,71) |
−0,48% (−0,54–0.44%) |
−8,60% (−22,72–2.15) |
|
| Scenario B GVA Reduction | −17.386 | −165.932 | −37.002 | −513.707 | −561.870 | −269.842 | −186.832 | −80.261 | −19.673 | −255.627 | −17.386 | −145.457 | −2.253.589 |
| −12,33% (−36,28-3,09) |
−7,06% (−20,78 − 1,77) |
-1,81% (−5,34 -0,46) |
−3,07% (−9,05 -0,77) |
−19,16% (−56,40 -4,81) |
−16,36% (−48,15 -4,11) |
−9,79% (−28,80 -2,46) |
−1 8,99% (55,88 -4,77) | −6,34% (18,65 -1,59) | −16,24% (−47,79 -4,08) |
−12,33% (−36,28-3,09) |
−0,48% (−0,54–0.44%) |
−7,50% (−36,82–3,53) |
|
| Scenario C GVA Reduction | −17.434 | −166.392 | −37.104 | −515.129 | −563.426 | −270.589 | −187.349 | −80.483 | −19.728 | −256.335 | −17.434 | −145.457 | −2.259.425 |
| −12,36% (−34,93 -3,13) |
−7,08% (−20,01 − 1,79) |
-1,82% (−5,14 -0,46) |
−3,08% (−8,71 -0,78) |
−19,21% (−54,30 -4,86) |
−16,41% (−46,36 -4,15) |
−9,81% (−27,73 -2,48) |
−19,04% (−53,80 -4,81) |
−6,36% (−17,96 -1,61) |
−16,28% (−46,01 -4,12) |
−12,36% (−34,93 -3,13) |
−0,48% (−0,54–0.44%) |
−7,52% (−35,47 -3,57) |
|
| Scenario D GVA Reduction | −17.424 | −166.297 | −37.083 | −514.838 | −563.107 | −270.436 | −187.243 | −80.437 | −19.717 | −256.190 | −17.424 | −145.457 | −2.258.228 |
| −12,35% (−37,46 -2,80) |
−7,08% (−21,45- 1,60) |
−1,82% (−5,51 -0,41) |
−3,08% (−9,34 -0,70) |
−19,20% (−58,23 -4,35) |
−16,40% (−49,72 -3,72) |
−9,81% (−29,74 -2,22) |
−19,03% (−57,70 -4,31) |
−6,35% (−19,26 -1,44) |
−16,27% (−49,34 -3,69) |
−12,35% (−37,46 -2,80) |
−0,48% (−0,54–0.44%) |
−7,51% (−38,00–3.24) |
For 2020, the reduction in average regional GVA, related to the fall in tourist arrivals, ranges from−32.8% for the most pessimistic scenario to −25.2 for the most optimistic scenario with fluctuating margins of −34.8 to −20.5%.
The tourism sectors most affected include tourism accommodation (−89.5% to −68.4%); rental services (−88.7% to −68.2%); restaurants (−76.4% to −58.8%); and sports, recreation and financial services (−75.9% to −58.3%). Non-tourism activities are also affected, including agriculture (−57.6% to 44.3%) and industry (−33% to −7.1%).
For 2021, the reduction in average regional GVA varies from −8.6% for the most pessimistic scenario to −7.52 for the most optimistic scenario with wide fluctuation margins attributable to uncertainties of −22.66% to −2.25% (including the impact of cruise ship passengers fall).
4.4. Backward testing
Given that the proposed model does not correspond to a traditional random sampling statistical analysis, but rather to a model based on Bayesian fundamentals, the goodness of fit indicators is not similar. In this way, to verify the effectiveness of the model, a backtesting analysis was performed for 2020, given that data on the economic impact of the pandemic on the economy of the Balearic Islands are currently available.
A backtesting analysis is a tool usually used in finance to test a certain strategy and determine what would have happened if we had acted in a certain way in the past. In this way, we can compare our predictions with historical data. Thus, this technique helps us to evaluate and quantify the efficiency of the technique.
We can assess a forecasting method by examining its inputs or outputs. While this might seem obvious, Armstrong (2001) explains that this topic has long been the subject of debate given that some scholars claim that testing outputs is the only useful approach to evaluating methodological proposals (assess uncertainty), while others claim that testing inputs is the only worthwhile way to test methods because we can learn how to improve a given model. Given that this research focuses on uncertainty, it seems reasonable to test the output.
To make a comparison regarding the output variable, we used the GVA estimate of the model and compared it with the real data published by the Bank of Spain regarding the effective fall of this indicator in the Balearic Islands during 2020. The results are presented in Table 6 .
Table 6.
Backtesting results.
| Backtesting 2020 | Model forecast | Real impact | Deviation |
|---|---|---|---|
| Scenario A - GVA Reduction | -32,79% | −27,00% | −5,79% |
| Scenario B - GVA Reduction | −30,50% | −27,00% | −3,50% |
| Scenario C - GVA Reduction | −27,86% | −27,00% | −0,86% |
| Scenario D - GVA Reduction | −25,21% | −27,00% | 1,79% |
| MEAN | −29,09% | −27,00% | −2,09% |
| STANDARD ERROR | 3,28% | 0,00% | 3,28% |
The average drop in the GVA for the four scenarios is −29%, while the real drop in 2020 was −27%. In this way, we can affirm that the backtesting analysis supports the precision of the estimation regarding the drop in the output of the Balearic Island economy in the context of extraordinary volatility that took place in this period.
4.5. Measuring vulnerability
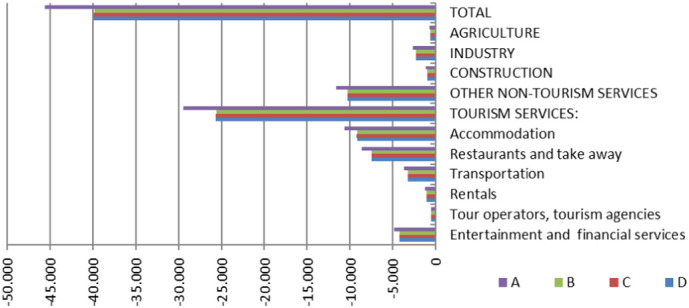
In 2020 the resulting decline in jobs induced by a decline in tourism arrivals will be dramatic, and this will continue into 2021. Fig. 4 shows the medium estimate for the loss of employment in 2020 due to the loss of tourism arrivals for different scenarios. For worst-case scenario A, the total loss of employment can reach 174,814 jobs, meaning that 35% of jobs are vulnerable to the crisis. In the tourism sector, 115,572 jobs would be lost, representing 76% of all people employed in this industry. Specifically, 42,742 jobs would disappear in accommodation (90% of jobs dedicated to this activity), and 34,044 jobs would disappear in restaurants and take-away services (76% of jobs dedicated to this activity).
The opening of borders to domestic Spanish tourists (scenario B) would recover approximately 12 thousand jobs for the economy, the arrival of Germans (scenario C) would recover 13,790 more jobs and the arrival of British tourists (scenario D) would recover 13,850 additional jobs. However, even in the most optimistic scenario, 135,176 jobs in the Balearic economy will still be lost, representing approximately 27% of jobs occupied before the COVID-19 crisis (Fig. 9).
Fig. 9.

Medium estimate for employment loss in 2020 for scenarios A, B, C, and D (number of employees).
In 2021, the maximum, medium and minimum estimates of possible employment effects of the decrease in tourist arrivals will vary due to uncertainty in the speed of income recovery and to the residual effect of fear (Fig. 10). In the worst-case scenario, up to 119 thousand jobs could still be lost, representing 24% of all employed before the crisis.
Fig. 10.

Number of jobs lost in the Balearic economy in 2021.
Fig. 11 presents medium estimates for analysed activities and shows that in the tourism sector, depending on the scenario, between 25 and 29 thousand jobs will be lost, resulting in 17–20% fewer people employed in this sector. Specifically, there will be 9–10 thousand fewer jobs in the accommodation sector (19–22% loss of jobs dedicated to this activity) and approximately 7–8 thousand fewer jobs in restaurants and take-away services (loss of 16–19%).
Fig. 11.
Medium estimate for the loss of employment in 2021 for scenarios A, B, C, and D (number of employees).
The loss of employment is an important source of vulnerability for the Balearic Islands. Table 7 shows tourism-related jobs among occupations with the highest weights in the Balearic Islands. Most of the mentioned jobs for both men and women are not highly skilled jobs (Capó, Font, & A.& Rosselló Nadal, J., 2007). As noted above, such occupations are characterized by lower salaries and hence higher risks of welfare loss. Moreover, of the 20 occupations with the highest weights for women, tourism-related occupations make up almost 60% of jobs while for the men this figure is approximately 33%. This suggests that women are especially vulnerable to the crisis.
Table 7.
Tourism related occupations of the top 20 occupations with highest weights in the Balearic economy.
| Women | % | Men | % | Total | % | ||||
|---|---|---|---|---|---|---|---|---|---|
| Salaried waiters | 45,624 | 19% | 44,574 | 15% | 90,198 | 17% | |||
| Cleaning staff for offices, hotels and other similar establishments | 36,294 | 15% | 7866 | 3% | 44,160 | 8% | |||
| Sellers in stores and warehouses | 27,733 | 12% | 8976 | 3% | 36,709 | 7% | |||
| Kitchen helpers | 9114 | 4% | 13,250 | 5% | 22,364 | 4% | |||
| Recreational and entertainment activity monitors | 8579 | 4% | 4902 | 2% | 13,481 | 3% | |||
| Salaried chefs | 5380 | 2% | 12,441 | 4% | 17,821 | 3% | |||
| Travel agency employees | 4338 | 2% | 2857 | 1% | 7195 | 1% | |||
| Hotel receptionists | 3190 | 1% | 3190 | 1% | |||||
| Ground stewardesses | 2187 | 1% | 2187 | 0% | |||||
| Bathers-lifeguards | 3126 | 1% | 3126 | 1% | |||||
| 142,439 | 59% | 97,992 | 33% | 237,305 | 45% | ||||
Source: Own elaboration from Employment Office of the Balearic Islands data (SOIB, 2019).
4.6. Management implications
The important differences between the minimum, average and maximum estimates for 2021 show considerable uncertainty regarding the speed of income recovery, the fear effect and its duration in tourism emitting markets. Policymakers will have to work in very different situations to develop protection measures. Thus far, the most welcomed measure was the possibility of short-term work programmes or ERTEs, by their Spanish abbreviation. ERTEs are “a flexibility mechanism that allows those companies that have a temporary drop in their production to reduce working hours or temporarily suspend the contract instead of resorting to layoffs” (Felgueroso & Jansen, 2020, p.4). Due to the high seasonality of tourism in the Balearic Islands, this measure is likely to be extended after the summer of 2021 (peak season) and hence will probably become the main resilience measure in the short term.
Furthermore, if the worst predictions become true tourism sector may suffer a long-term structural change (Gossling et al.,2020) implying the need for the economic transformation in tourism dependent communities. There is no experience in this area yet. Bec et al. (2016) point out a lack of theoretical and empirical research on community resilience to long-term changes driven by tourism decline. Balearic island destination managers will need to focus their efforts on understanding the vulnerability and resilience of the tourism sector and evaluate the potential for the reallocation of resources to companies and subsectors with better opportunities (de la Fuente, 2021).
If the maximum estimates for 2021 are true and the tourism demand returns close to the pre-crisis numbers, this may present another type of challenge for destination managers. They will have to focus on the measures to foster economic recovery, avoiding the solutions that might reduce the previous commitment for sustainability. (Zenker & Kock, 2020). This is also important from the standpoint of the world's sustainability, since some experts consider the actual volume growth model for tourism as one of the causes of infectious diseases and particularly of the COVID-19 pandemic (Baker, 2015; Gössling et al., 2020).
Our results also have one special implication for the understanding of the role of domestic tourism in relieving the tourism industry crisis (UNWTO, 2020b) in the Balearic Islands. Although domestic travellers are unlikely to fill the void of international tourists in this destination (Arbulú, Razumova, Rey-Maquieira, & Sastre, 2021), domestic tourism can still be considered an important driver of destination resilience. Finally, there is an implication referring to the operation of so-called “safe corridors” simulated by scenarios C and D. The development of “safe corridors” depends on the development of disease control measures in the destination and in the origin markets, such as immunity passports and provision of up-to-date information on new contagions and on the effect of new virus variants (ECDC: Stockholm, 2021; The New York Times, 2021). In this respect, insularity can be especially beneficial for the success of measures impeding the entrance of infected tourists to the destination.
5. Conclusions
Tourism sector has been drastically affected by the COVID-19 crisis. Social distancing policies designed to prevent virus transmission imply a particularly negative supply shock for the tourism industry. In addition, the fear of infection significantly affects all elements of the tourism product value chain, drastically reducing its demand. Therefore, many occupations linked to tourism show significant risks of being negatively affected by the COVID-19 crisis due to both supply and demand shocks. Moreover, the uncertainty regarding the duration of the containment measures, the possibility of future rebounds, advances in the treatments and vaccines makes it particularly difficult to forecast the effects of the pandemic on the economies and industries.
The present research intends to fill in two existing gaps in the risk management studies identified by Ritchie and Jiang (2019). First, the use of the Monte Carlo model contributes to the empirical testing of models and theory. To the authors' knowledge, using Monte Carlo modelling to predict tourism arrivals in pandemics has not yet been done, with the exception of the work of Arbulú et al. (2021). Second, it reduces to some extent the imbalances in risk management research theme coverage by focusing on vulnerability factors in tourism sector for a specific and understudied type of hazard, namely, a pandemic.
The present research shows how different risk factors related to the COVID-19 crisis can be analysed to evaluate the vulnerability of the tourism industry to the present pandemic. Specifically, using available estimates, we evaluate how the expected loss of income, fear of travelling and the possibility of locked borders to the international tourists will affect production and employment at the Balearic Islands. According to our simulations, the drop in tourism arrivals is expected to generate a considerable drop in production and employment in this destination in 2020, and the negative effects of the COVID-19 crisis will continue into 2021.Given that most tourism-related occupations are not highly skilled and are characterized by lower salaries, there are greater risks of loss of welfare for this region, especially for women, who are a major share of the tourism labour force.
This paper contributes to the development of scenario-forecasting models to predict complex scenarios in situations of extreme uncertainty such as the one presented by the unprecedented COVID-19 crisis (Zenker & Kock, 2020). The important novelty of this research is the application of a Monte Carlo simulation model to assess the expected impact of COVID-19 on tourism. Simulation models are especially useful for analysing situations of high uncertainty. However, to the authors' knowledge, they have been sparsely used for forecasting the effects of pandemics, in general, and tourism, in particular. This methodology allowed us to simulate different estimates of risk variables and obtaining empirical distributions of the outcome variables (employment and GVA). This methodology can be readily replicable for evaluating other scenarios in other destinations in the similar circumstances.
The limitations of this research are mostly related to the unprecedented character of the present crisis. The COVID-19 virus is slightly less lethal but more contagious than its closest relative SARS. This implies that its fear effect could be more pronounced and last longer among tourists and cruise ship passengers. Furthermore, there is no previous research and no estimates on how vaccination campaigns affect fear and travel restrictions. No micro data are yet available to evaluate with more precision the effect that the restrictions will produce on tourism subsectors. Consequently, understanding fear and income effects of the COVID-19 crisis are promising lines for future research. A recent literature review on COVID-19 in tourism reveals the lack of research in this area (Sharma, Thomas, & Paul, 2021). It is worth analysing whether there are differences in fear and income effects among different age groups and nationalities. Moreover, it is worth taking into account the cultural background of countries of origin and studying how cultural patterns and different types of restrictions at the origin (quarantine and PCR tests on returning home) and at the destination (travel bans, social distancing) affect tourism arrivals. Finally, in our study different restrictive measures (such as travel bans and social distancing) are grouped together because there are no studies yet that introduce them independently in the Monte Carlo model. When such studies become available, it will be possible to obtain more exact estimates of the effects of future pandemics using Monte Carlo simulations.
Further research is also needed to understand the factors of the resilience of destinations to health crises. One of the important areas would be to analyse the role of protective measures such as short-term work programmes and the role of domestic tourism. Given the uncertainty regarding the duration of the COVID-19 shock on tourism, it is necessary to formulate adequate policies depending on the temporary or permanent changes that it will bring. Finally, further research should answer how European policies should be improved to avoid coordination problems between countries and regions during the application of measures controlling the spread of highly contagious diseases.
Credit authorship statement
All persons who meet authorship criteria are listed as authors, and all authors certify that they have participated sufficiently in the work to take public responsibility for the content, including participation in the concept, design, analysis, writing, or revision of the manuscript. Furthermore, each author certifies that this material or similar material has not been and will not be submitted to or published in any other publication before its appearance in this journal.
The following table indicates the specific contributions made by each author:
| TERM | DEFINITION | ITALO ARBULÚ | MARIA RAZUMOVA | JAVIER REY-MAQUIEIRA | FRACESC SASTRE |
| Conceptualization | Ideas; formulation or evolution of overarching research goals and aims | X | X | X | X |
| Methodology | Development or design of methodology; creation of models | X | X | ||
| Software | Programming, software development; designing computer programs; implementation of the computer code and supporting algorithms; testing of existing code components | X | |||
| Validation | Verification, whether as a part of the activity or separate, of the overall replication/ reproducibility of results/experiments and other research outputs | X | X | X | X |
| Formal analysis | Application of statistical, mathematical, computational, or other formal techniques to analyse or synthesize study data | X | X | X | X |
| Resources | Provision of study materials, reagents, materials, patients, laboratory samples, animals, instrumentation, computing resources, or other analysis tools | X | X | ||
| Writing - Original Draft | Preparation, creation and/or presentation of the published work, specifically writing the initial draft (including substantive translation) | X | X | X | X |
| Writing - Review & Editing | Preparation, creation and/or presentation of the published work by those from the original research group, specifically critical review, commentary or revision – including pre-or postpublication stages | X | X | X | |
| Supervision | Oversight and leadership responsibility for the research activity planning and execution, including mentorship external to the core team | X |
Biographies

Italo Arbulú is a Lecturer at University of the Balearic Islands and Part- time Professor at Universidad del Pacífico. His research focus on tourism competitiveness, risk analysis and sustainable tourism. Mail: italoraul.arbulu@uib.es; arbulu_ira@up.edu.pe

Maria Razumova's research focuses on sustainable tourism economics related to environmental innovations, environmental regulations, and corporate social responsibility programs in tourism firms. Mail: mrazumova@etb-baleares.es

Javier Rey-Maquieira's research focus on tourism competitiveness, environmental innovations and environmental management and corporate social responsibility (CSR). Mail: javier.rey@uib.es

Francesc Sastre's research focus on tourism competitiveness, tourism demand modelling and economic impacts of tourism. Mail: fsastre@uib.es
Appendix A. Tourist arrival probability distribution
BASELINE SCENARIO.
ALTERNATIVE B.
ALTERNATIVE C.
ALTERNATIVE D.
CRUISE SHIP – TOTAL PASSENGERS 2021.
CRUISE SHIP – BASE PASSENGERS 2021.
CRUISE SHIP – TRANSIT PASSENGERS 2021.
Appendix B. Empirical studies used for the estimation of input probability distributions for MC analysis
| Empirical estimates related to: | |
|---|---|
| Expected GDP decline | BankofSpain (2020). Reference macroeconomic scenarios for the Spanish economy after Covid-19. .Economic bulletin/Banco de España [Artículos], n. 2. |
| BBVA. (2020). Spain Economic Outlook. First quarter 2020. BBVA Research. | |
| Dynan, K. (2020). The Economic Outlook:Pandemic and Recession . Harvard University and Peterson Institute for International Economics. | |
| IMF (2020). World Economic Outlook. Chapter 1. The great lockdown. | |
| Naisbitt, B., Boshoff, J., Holland, D., Hurst, I., Kara, A., Liadze, I., & Whyte, K. (2020). THE WORLD ECONOMY: Global outlook overview. National Institute Economic Review, 252, F44-F88. | |
| PWC. (2020a). Overview of the impact of Covid-19 on Spanish power sector. | |
| PWC. (2020b). UK Economic Update. | |
| Scotiabank. (2020). Global Economics Forecast tables. | |
| Income elasticity | Aslan, A., Kaplan, M.,& Kula, F. (2008). International tourism demand for Turkey: A dynamic panel data approach. |
| Álvarez-Diaz, M., González-Gómez, M., &Otero-Giráldez, M. S. (2015). Research note: Estimating price and income demand elasticities for Spain separately by the major source markets. Tourism Economics, 21(5), 1103–1110. | |
| Brida, J. G., & Risso, W. A. (2009). A dynamic panel data study of the German demand for tourism in South Tyrol. Tourism and Hospitality Research, 9(4), 305–313. | |
| Choyakh, H. (2008). A model of tourism demand for Tunisia: inclusion of the tourism investment variable. . Tourism Economics, 14(4), 819–838. | |
| Cortés-Jiménez, I., & Blake, A. (2011). Tourism demand modelling by purpose of visit and nationality. Journal of Travel Research, 50(4), 408–416. | |
| Maloney, W. F., & Montes Rojas, G. V. (2005). How elastic are sea, sand and sun? Dynamic panel estimates of the demand for tourism. . Applied Economics Letters, 12(5), 277–280. | |
| Peng, B., Song, H., Crouch, G. I., &Witt, S. F. (2015). A meta-analysis of international tourism demand elasticities. . Journal of Travel Research, 54(5), 611–633. | |
| Seetaram, N., Song, H., &Page, S. J. (2014). Air passenger duty and outbound tourism demand from the United Kingdom. . Journal of Travel Research, 53(4), 476–487. | |
| Song, H., Kim, J. H., &Yang, S. (2010). Confidence intervals for tourism demand elasticity. Annals of Tourism Research, 37(2), 377–396. | |
| Fall in tourist demand related to fears and its duration over time | Blake, A., Sinclair, M. T., &Sugiyarto, G. (2003). Quantifying the impact of foot and mouth disease on tourism and the UK economy. . Tourism Economics, 9(4), 449–465. |
| Kuo, H. I., Chen, C. C., Tseng, W. C., Ju, L. F., &Huang, B. W. (2008). Assessing impacts of SARS and Avian Flu on international tourism demand to Asia. Tourism Management, 29(5), 917–928. | |
| McAleer, M., Huang, B. W., Kuo, H. I., Chen, C. C., &Chang, C. L. (2010). An econometric analysis of SARS and Avian Flu on international tourist arrivals to Asia. Environmental Modelling & Software, 25(1), 100–106. | |
| Mao, C. K., Ding, C. G., &Lee, H. Y. (2010). Post-SARS tourist arrival recovery patterns: An analysis based on a catastrophe theory. Tourism Management, 31(6), 855–861. | |
| Qiu, W., Chu, C., Mao, A., &Wu, J. (2018). The impacts on health, society, and economy of SARS and H7N9 outbreaks in China: a case comparison study. Journal of environmental and public health. | |
| Rassy, D., & Smith, R. D. (2013). The economic impact of H1N1 on Mexico's tourist and pork sectors. Health economics, 22(7), 824–834. | |
| Rosselló, J., Santana-Gallego, M., &Awan, W. (2017). Infectious disease risk and international tourism demand. . Health policy and planning, 32(4), 538–548. | |
| Rosselló, J., Becken, S., & Santana-Gallego, M. (2020). The effects of natural disasters on international tourism: A global analysis. Tourism management, 79. | |
| Wilder-Smith, A. (2006). The severe acute respiratory syndrome: impact on travel and tourism. . Travel medicine and infectious disease, 4(2), 53–60. | |
| Zeng, B., Carter, R. W., &De Lacy, T. (2005). Short-term perturbations and tourism effects: The case of SARS in China. Current Issues in Tourism, 8(4), 306–322. |
Appendix C. Impact of cruise ship passengers fall
| IMPACT OF CRUISE SHIP PASSENGERS FALL |
2020 |
Agriculture |
Industry |
Construction |
Non-touristic services |
Accommodation |
Restaurants |
Transport and annexes |
Rental services |
Travel agencies, TTOO |
Sports, recreational and financial services |
TOTAL |
|---|---|---|---|---|---|---|---|---|---|---|---|---|
| GVA reduction |
−492 |
−7.898 |
−11.495 |
−73.392 |
0 |
−9.090 |
−41.871 |
−1.794 |
−8.039 |
507 |
−154.361 |
|
| % GVA | −0,35% | −0,34% | −0,56% | −0,44% | 0,00% | −0,55% | −2,19% | −0,42% | −2,59% | 0,03% | −0,51% | |
| IMPACT OF CRUISE SHIP PASSENGERS FALL | 2021 | Agriculture | Industry | Construction | Non-touristic services | Accommodation | Restaurants | Transport and annexes | Rental services | Travel agencies, TTOO | Sports, recreational and financial services | TOTAL |
| GVA reduction | −463 | −7.442 | −10.832 | −69.158 | 0 | −8.565 | −39.455 | −1.690 | −7.576 | 478 | −145.457 | |
| % GVA mean | −0,33% | −0,32% | −0,53% | −0,41% | 0,00% | −0,52% | −2,07% | −0,40% | −2,44% | 0,03% | −0,48% | |
| % GVA min | −0,36% | −0,35% | −0,59% | −0,46% | 0,00% | −0,57% | −2,28% | −0,44% | −2,70% | 0,03% | −0,54% | |
| % GVA mix | −0,30% | −0,29% | −0,49% | −0,38% | 0,00% | −0,48% | −1,90% | −0,37% | −2,24% | 0,03% | −0,44% |
References
- Aguilo E., Juaneda C. Tourist expenditure for mass tourism markets. Annals of Tourism Research. 2000;27(3):624–637. [Google Scholar]
- APB (Autoridad Portuaria de Baleares) 2018. Estudio sobre el impacto económico de la actividad de los puertos que gestiona la autoridad portuaria de baleares. [Google Scholar]
- Arbulú I., Razumova M., Rey-Maquieira J., Sastre F. Can domestic tourism relieve the COVID-19 tourist industry crisis? The case of Spain. Journal of Destination Marketing & Management. 2021;20:100568. [Google Scholar]
- Armstrong J.S. Springer; Boston, MA: 2001. Evaluating forecasting methods. (In principles of forecasting (pp. 443–472)). [Google Scholar]
- Assaf A.G., Tsionas M., Oh H. The time has come: Toward Bayesian SEM estimation in tourismresearch. Tourism Management. 2018;64:98–109. [Google Scholar]
- Baker D.M. 2015. Tourism and the health effects of infectious diseases: Are there potential risks for tourists?International journal of safety and security in tourism and hospitality, 1(12) [Google Scholar]
- Baker K., Coulter A. Terrorism and tourism: The vulnerability of beach vendors’ livelihoodsin Bali. Journal of Sustainable Tourism. 2007;15(3):249–266. [Google Scholar]
- BankofSpain . 2020. Reference macroeconomic scenarios for the Spanish economy after Covid-19. .Economic bulletin/Banco de España [Artículos], n. 2. [Google Scholar]
- Barry T. Recommendations on the testing and use of pseudo-random number generators used in Monte Carlo analysis for risk assessment. Risk Analysis. 1996;16(1):93–105. [Google Scholar]
- Becken S., Mahon R., Rennie H.G., Shakeela A. The tourism disaster vulnerability framework: An application to tourism in small island destinations. Natural Hazards. 2014;71(1):955–972. [Google Scholar]
- Bonfiglio A., Chelli F. Assessing the behaviour of non-survey methods for constructing regionalinput–output tables through a Monte Carlo simulation. Economic Systems Research. 2008;20(3):243–258. [Google Scholar]
- Briguglio L., Cordina G., Farrugia N., Vella S. Economic vulnerability and resilience: Concepts and measurements. Oxford Development Studies. 2009;37(3):229–247. [Google Scholar]
- Brown N.A., Rovins J.E., Feldmann-Jensen S., Orchiston C., Johnston D. Exploring disaster resilience within the hotel sector: A systematic review of literature. International Journal of Disaster Risk Reduction. 2017;22:362–370. doi: 10.1016/j.ijdrr.2017.02.005. [DOI] [PMC free article] [PubMed] [Google Scholar]
- Burda M., Bélisle L. Copula multivariate GARCH model with constrained Hamiltonian Monte Carlo. Dependence Modeling. 2019;7(1):133–149. [Google Scholar]
- Calgaro E., Lloyd K., Dominey-Howes D. From vulnerability to transformation: A framework for assessing the vulnerability and resilience of tourism destinations. Journal of Sustainable Tourism. 2014;22(3):341–360. doi: 10.1080/09669582.2013.826229. [DOI] [Google Scholar]
- Capó J., Font R., A.& Rosselló Nadal, J. Dutch disease in tourism economies: Evidence from the Balearics and the Canary Islands. Journal of Sustainable Tourism. 2007;15(6):615–627. doi: 10.2167/jost698.0. [DOI] [Google Scholar]
- Chang A.E. 2020. WHO’s response to the COVID-19 pandemic: Assessment and recommendations. [Google Scholar]
- Dakins M.E., Toll J.E., Small M.J., Brand K.P., Dakins M.E., Toll J.E.…Brand K.P. Risk-based environmental remediation: Bayesian Monte Carlo analysis and the expected value of sample information. Risk Analysis. 1996;16(1):67–79. doi: 10.1111/j.1539-6924.1996.tb01437.x. [DOI] [PubMed] [Google Scholar]
- del Rio-Chanona R.M., Mealy P., Pichler A., Lafond F., Farmer D. Supply and demand shocks in the COVID-19 pandemic: An industry and occupation perspective. Oxford Review of Economic Policy. 2020;36(1):94–137. arXiv:2004.06759 [Google Scholar]
- Deloitte . 2020. Forecasting in times of extreme uncertainty.https://www2.deloitte.com/content/dam/Deloitte/global/Documents/About-Deloitte/COVID-19/gx-deloitte-sap-covid-19-offer-forecasting-in-times-of-extreme-uncertainty.pdf Retrieved from. [Google Scholar]
- Demir E., Gozgor G., Paramati S.R. To what extend economic uncertainty effects tourism investments? Evidence from OECD and non-OECD economies. Tourism Management Perspectives. 2020;36:100758. [Google Scholar]
- Dodds R., Graci S. Routledge; 2012. Sustainable tourism in island destinations. [Google Scholar]
- European Centre for Disease Prevention and Control. Risk related to spread of new SARS-CoV-2 variants of concern in the EU/EEA, first update – 21 January 2021 ECDC: Stockholm. 2021 [Google Scholar]
- Espiner S., Orchiston, C.& Higham, J. Resilienceand sustainability: A complementary relationship? Towards a practical conceptual modelfor the sustainability–resilience nexus in tourism. Journal of Sustainable Tourism. 2017 doi: 10.1080/09669582.2017.1281929. [DOI] [Google Scholar]
- Fana M., Tolan S., Torrejón S., Urzi Brancati C., Fernández-Macías E. Seville: Joint Research Centre (Seville site); 2020. The COVID confinement measures and EU labour markets (No. JRC120578) [Google Scholar]
- Faulkner B. Towards a framework for tourism disaster management. Tourism Management. 2001;22:135–147. [Google Scholar]
- Felgueroso F., Jansen M. FEDEA; 2020. Una valoración de los ERTE para hacer frente a la crisis del COVID-19 en base a la evidencia empírica y desde una perspectiva comparada (No. 2020-06) [Google Scholar]
- Fong S.J., Li G., Dey N., González Crespo R., Herrera-Viedma E. Composite Monte Carlo decision making under high uncertainty of novel coronavirus epidemic using hybridized deep learning and fuzzy rule induction. Applied Soft Computing. 2020;93:106282. doi: 10.1016/j.asoc.2020.106282. [DOI] [PMC free article] [PubMed] [Google Scholar]
- Fountain J., Cradock-Henry N. Recovery, risk and resilience: Post-disaster tourism experiences in Kaikōura, New Zealand. Tourism Management Perspectives. 2020;35:100695. [Google Scholar]
- Frechtling D.C., Horváth E. Estimating the multiplier effects of tourism expenditures on a local economy through a regional input-output model. Journal of Travel Research, vol. 1999;37(4):324–332. [Google Scholar]
- de la Fuente A. 2021. The economic consequences of Covid in Spain and how to deal with them. (Applied Economic Analysis) [Google Scholar]
- Gössling S., Scott D., Hall C.M. Pandemics, tourism and global change: A rapid assessment of COVID-19. Journal of Sustainable Tourism. 2020:1–20. [Google Scholar]
- Gregory V., Menzio G., Wiczer D.G. National Bureau of Economic Research (No. w27105); 2020. Pandemic recession: L or V-shaped? [Google Scholar]
- Hallegatte S. Economic Resilience: Definition and Measurement, No. 6852. World Bank Policy Research Working Paper. 2014 [Google Scholar]
- IBESTAT . 2020. Marco Input-Output de las Illes Balears (2014) [Google Scholar]
- IMF . 2020. World Economic Outlook. Chapter 1. The great lockdown. [Google Scholar]
- INAIL . 2020. Documento tecnico sulla possibile rimodulazione delle misure di contenimento del contagio da SARS-CoV-2 nei luoghi di lavoro e strategie di prevenzione. [Google Scholar]
- INE EGATUR. 2020:2019. [Google Scholar]
- Jamaliah M., Powell R. Integrated vulnerability assessment of ecotourism to climate change in Dana biosphere reserve, Jordan. Current Issues in Tourism. 2019;22(14):1705–1722. doi: 10.1080/13683500.2017.1401982. [DOI] [Google Scholar]
- Johnson R., Moore E. Tourism impact estimation. Annals of Tourism Research vol. 1993;20(2):279–288. [Google Scholar]
- Kwak Y.H., Ingall L. Exploring Monte Carlo simulation applications for project management. Risk Management. 2007;9(1):44–57. [Google Scholar]
- Liu Y., Cheng P., OuYang Z. Disaster risk, risk management, and tourism competitiveness: A cross-nation analysis. International Journal of Tourism Research. 2019;21:855–867. doi: 10.1002/jtr.2310. [DOI] [Google Scholar]
- Melián-Alzola L., Fernández-Monroy M., Hidalgo-Peñate M. Hotels in contexts of uncertainty: Measuring organisational resilience. Tourism Management Perspectives. 2020;36:100747. doi: 10.1016/j.tmp.2020.100747. [DOI] [PMC free article] [PubMed] [Google Scholar]
- Miller H.E., Engemann K.J. A Monte Carlo simulation model of supply chain risk due to natural disasters. International Journal of Technology, Policy and Management. 2008;8(4):460–480. [Google Scholar]
- Neuburger L., Egger R. Travel risk perception and travelbehaviour during the COVID-19 pandemic 2020: A case study of the DACH region. Current Issues in Tourism. 2020 doi: 10.1080/13683500.2020.1803807. [DOI] [Google Scholar]
- Noy I., Yonson R. Economic vulnerability and resilience to NaturalHazards: A survey of concepts and measurements. Sustainability. 2018;10:2850. doi: 10.3390/su10082850. [DOI] [Google Scholar]
- Pritsker M. Evaluation value at risk methodologies: Accuracy versus computational time. Journal of Financial Services Research. 1997;12:2–3. [Google Scholar]
- Ramelli E., Wagner A. Centre for Economic Policy Research; 2020. What the stocks market tell us about the consequences of COVID-19. In R. Baldwin, & B. Weder di Mauro, mitigating the COVID economic crisis: Act fast and do whatever it takes. [Google Scholar]
- Rey S.J., West G.R., Janikas M.V. Uncertainty in integrated regional models. Economic Systems Research. 2004;16(3):259–277. [Google Scholar]
- Ritchie B. Chaos, crises and disasters: A strategic approach to crisis managementin the tourism industry. Tourism Management. 2004;25:669–683. [Google Scholar]
- Ritchie B.W., Jiang Y. A review of research on tourism risk, crisis and disaster management: Launching the annals of tourism research curated collection on tourism risk, crisis and disaster management. Annals of Tourism Research. 2019;79 [Google Scholar]
- Sastre F., Rey-Maquieira J., Arbulu I. The euro crisis, fiscal devaluation, and impacts on the tourism sector in the Spanish economy. Tourism Economics. 2017;23(4):816–833. [Google Scholar]
- Scheyvens R., Momsen J. Tourism in small island states: From vulnerability to strengths. Journal of Sustainable Tourism. 2008;16(5):491–510. [Google Scholar]
- Sharma G.D., Thomas A., Paul J. Reviving tourism industry post-COVID-19: A resilience-based framework. Tourism Management Perspectives. 2021;37:100786. doi: 10.1016/j.tmp.2020.100786. [DOI] [PMC free article] [PubMed] [Google Scholar]
- Sio-Chong U., So Y.C. The impacts of financial and non-financial crises on tourism: Evidence from Macao and Hong Kong. Tourism Management Perspectives. 2020;33:100628. [Google Scholar]
- SOIB Observatori del Treball de les Illes Balears. Informe sobre el mercado de trabajo en Illes Balears - Año. 2019;2018 [Google Scholar]
- Sönmez S., Apostolopoulos Y., Lemke M.K., Hsieh Y.C.J. Understanding the effects of COVID-19 on the health and safety of immigrant hospitality workers in the United States. Tourism Management Perspectives. 2020;35:100717. doi: 10.1016/j.tmp.2020.100717. [DOI] [PMC free article] [PubMed] [Google Scholar]
- Student J., Lamers M., Amelung B. A dynamic vulnerabilityapproach for tourism destinations. Journal of Sustainable Tourism. 2020;28(3):475–496. doi: 10.1080/09669582.2019.1682593. [DOI] [Google Scholar]
- Sun L., Hong L. Asymptotic representations for importance sampling estimator of value-at-risk and conditional value-at-risk. Operations Research Letters. 2010;38(4):246–251. [Google Scholar]
- Sun Y.Y. Adjusting input–output models for capacity utilization in service industries. Tourism Management. 2007;28:1507–1517. [Google Scholar]
- The New York Times.The U.S. risks a new surge as variants spread and restrictions are relaxed, Fauci said, C H., Lin Liu S.C. Slopeland disaster risk management in tourism. Current Issues in Tourism. 2017;20(7):759–786. doi: 10.1080/13683500.2016.1165187. https://www.nytimes.com/2021/03/07/world/covid-variant-us-cases.htmlTsai. [DOI] [Google Scholar]
- Tsai C.H., Lin Liu S.C. Slopeland disaster risk management in tourism. Current Issues in Tourism. 2017;20(7):759–786. doi: 10.1080/13683500.2016.1165187. https://www.nytimes.com/2021/03/07/world/covid-variant-us-cases.htmlTsai. [DOI] [Google Scholar]
- Uğur N.G., Akbıyık A. Impacts of COVID-19 on global tourism industry: A cross-regional comparison. Tourism Management Perspectives. 2020;36:100744. doi: 10.1016/j.tmp.2020.100744. [DOI] [PMC free article] [PubMed] [Google Scholar]
- UN, Eurostat, & UNWTO Tourism Satellite Account: Recommended methodological framework 2008. Studies in Methods, series F, no. 2010:80. [Google Scholar]
- UNDRR Terminology on Disaster Risk Reduction. 2020. http://undrr.org/terminology Retrieved from.
- UNWTO . 2020. Impact assesment of the COVID-19 outbreak on international tourism. [Google Scholar]
- UNWTO . Understanding Domestic Tourism and Seizing its Opportunities. UNWTO; Madrid: 2020. UNWTO briefing note – Tourism and COVID-19, issue 3. [DOI] [Google Scholar]
- UNWTO . Volume 19, 1. 2021. World Tourism Barometer and Statistical Annex. January 2021. Retrieved from. [DOI] [Google Scholar]
- WEF The Global Risk Report. 2020:2020. https://www.weforum.org/reports/the-global-risks-report-2020 Retrieved from: [Google Scholar]
- Williams A., Baláž V. Tourism risk and uncertainty: Theoretical reflections. Journal of Travel Research. 2015;54(3):271–287. [Google Scholar]
- WTTC . 2019. Crisis readiness - October 2019. (Global Rescue and World Travel & Tourism Council) [Google Scholar]
- Zakhary A., Atiya A.F., El-Shishiny H., Gayar N.E. Forecasting hotel arrivals and occupancy using Monte Carlo simulation. Journal of Revenue and Pricing Management. 2011;10(4):344–366. [Google Scholar]
- Zenker S., Kock F. The coronavirus pandemic – A critical discussion of a tourism research agenda. Tourism Management. 2020;81:104164. doi: 10.1016/j.tourman.2020.104164. [DOI] [PMC free article] [PubMed] [Google Scholar]
- Zyphur M.J., Oswald F.L. Bayesian probability and statistics in managementresearch: A new horizon. Journal of Management. 2013;39(1):5e13. [Google Scholar]