

Abstract
The world needs to get out of the COVID-19 pandemic smoothly through a thorough socio-economic recovery. The first and the foremost step forward in this direction is the health recovery of the people infected. Our empirical study addresses this neglected point in the recent research on COVID-19 and specifically aims at exploring the impact of the environment on health recovery from COVID-19. The sample data are taken during the lockdown period in Wuhan, i.e., from 23rd January 2020 to 8th April 2020. The recently developed econometric technique of Quantile-on-Quantile regression, proposed by Shin and Zhu (2016) is employed to capture the asymmetric association between environmental factors (TEMP, HUM, PM2.5, PM10, CO, SO2, NO2, and O3) and the number of recovered patients from COVID-19. We observe significant heterogeneity in the association among variables across various quantiles. The findings suggest that TEMP, PM2.5, PM10, CO, NO2, and O3 are negatively related to the COVID-19 recovery, while HUM and SO2 show a positive association at most quantiles. The study recommends that maintaining a safe and comfortable environment for the patients may increase the chances of recovery from COVID-19. The success story of Wuhan, the initial epicenter of the novel coronavirus in China, can serve as an important case study for other countries to bring the outbreak under control. The current study could be conducive for the policymakers of those countries where the COVID-19 pandemic is still unrestrained.
Keywords: COVID-19 recovery, Wuhan, Environment, Pollution, Quantile-on-quantile regression
Introduction
The recent outbreak of COVID-19 disease throughout the world has created unprecedented uncertainty in each and every sector of the economy, politics, and public health (Ali et al., 2021; Bashir et al., 2020; Fareed & Iqbal, 2020; Iqbal et al., 2020a, 2020b; Irfan et al., 2021; Latif et al., 2020; Yan et al., 2021). The total number of infections has reached 182 million, while 3.95 million patients are dead, and 2.92 billion have been vaccinated as of June 29, 2021 (WHO). The situation varies greatly across the countries as some have seen the peak (Europe), while others are still at the early stages (South American and South Asia). As COVID-19 pandemic is slowing down in many countries of the world recently, the efforts to develop a vaccine or cure are also entering a crucial stage. The socio-economic disorder brought to the world by this disease can only be dealt with a step-wise approach. While there is a fierce debate about creating a balance between public health and economic recovery in case of any policy formulation including lockdowns, we believe that the health/medical recovery of the COVID-19 patients must be considered the most critical step forward in this long process. There is no price/alternative of even a single human life, and there would be no economy without a healthy public.
The city of Wuhan, where it all started, has ended the 76 days lockdown, and life is returning to normal, while other countries are still struggling. The case of Wuhan is a major concern for the rest of the countries and can be used to learn more about the COVID-19 pandemic. Figure 1 demonstrates the current scenario of the COVID-19 situation in China. Until a reliable cure is discovered or a vaccine developed, there is no sign of herd immunity as the WHO reports no evidence of patients' immunity after recovery from this disease. A study and retest on five medical personnel in Wuhan who were infected and already recovered from COVID-19 showed that they were infected again (Lan et al., 2020). Comparable findings have been stated in other related studies also (Xing et al., 2020). As vaccines may take as long as 12–15 months in development, the need of the hour points toward the other forms of prevention. For example, a better understanding of COVID-19 interaction with the environment and beyond can be helpful to prevent the harmful effects of environmental pollution from aggravating the situation. Figure 2 shows the time trend of daily new recovered patients from COVID-19 during the lockdown in Wuhan.
Fig. 1.

Map showing the latest epidemic situation in China
Fig. 2.
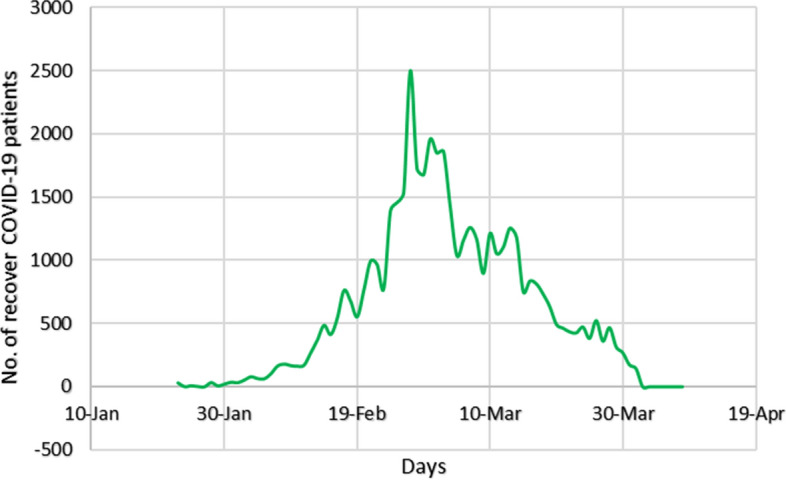
Daily new recovered patients from COVID-19 during the lockdown in Wuhan
An enormous amount of research is being conducted on the interaction of the COVID-19 outbreak and other factors related to health care, public policy, social distancing measures, lockdown, and atmosphere, etc. Some of these research articles studied the interaction of environment indicators (air quality index, humidity, and temperature) and COV-19 infections and mortality, specifically for Wuhan city (Iqbal et al., 2020a, 2020b; Ma et al., 2020). In most of these studies, daily new COVID-19 infections are used, and little attention has been given to the recovered cases until now. Table 1 describes the detailed list of the literature review on the association between climate factors and daily COVID-19 infections.
Table 1.
A summary of a recent literature review (Environment & COVID-19)
| Author(s) | Variables | Sample/Region | Methodology | Findings |
|---|---|---|---|---|
| COVID-19 and weather | ||||
| Briz-Redón and Serrano-Aroca, (2020) |
Temperature COVID-19 daily data Number of travelers Age Number of firms Population density |
Spain | Spatio-temporal modeling | Insignificant relationship between temperature and COVID-19 transmission |
| Prata et al., (2020) |
Temperature COVID-19 daily cases |
Brazil |
Polynomial (cubic) regression model Generalized additive method |
Insignificant relationship between temperature and COVID-19 transmission |
| Zhu and Xie, (2020a) |
Temperature COVID-19 daily cases |
China |
Linear regression model Generalized additive method |
Negative relationship between temperature and COVID-19 (When temp ranges 16.8 °C-27.4 °C) |
| Jahangiri et al., (2020) |
Ambient temperature COVID-19 transmission cases Population size |
Iran |
Sensitivity and specificity analyses Receiver operating characteristics (ROC) |
Negative relationship between ambient temperature and COVID-19 |
| Shi et al., (2020) |
Temperature COVID-19 daily cases |
China |
Random-effects meta-analysis Locally weighted regression Distributed lag nonlinear models Smoothing scatterplot |
Positive relationship between COVID-19 and temperature (< 3 °C) Negative relationship between COVID-19 and temperature (8 °C-10 °C) |
| Shahzad et al., (2020) |
Temperature COVID-19 daily new cases |
Chinese top 10 provinces affected by COVID-19 | Quantile-on-Quantile (QQ) regression | Heterogeneous relationship between temperature and COVID-19 and vice versa |
| Iqbal et al., (2020a, 2020b) |
Temperature COVID-19 daily new cases Exchange rate (USD/CNY) |
Wuhan, China | Partial and multiple wavelet coherence techniques | Insignificant association between temperature and COVID-19 cases |
| Fareed et al., (2020) |
Humidity COVID-19 daily new death Air quality index |
Wuhan, China | Partial and multiple wavelet coherence techniques |
Humidity negatively related to COVID-19 deaths Air quality index positively related to COVID-19 deaths |
| Tosepu et al., (2020) |
Temperature Humidity COVID-19 cases |
Jakarta, Indonesia | Spearman rank correlation test | Only temperature is significantly correlated with COVID-19 cases |
| Bashir et al., (2020a, 2020b, 2020c) |
Temperature Rainfall Humidity Wind speed Air quality COVID-19 daily cases |
New York, USA | Kendall and Spearman rank correlation tests | Only temperature and air quality significantly correlated with COVID-19 cases |
| Şahin, (2020) |
Temperature Humidity Dew points Wind speed Population COVID-19 cases |
Nine cities of Turkey | Spearman's correlation coefficients | Only population, wind speed, and temperature are significantly correlated with COVID-19 cases |
| Pirouz et al., (2020) |
Temperature Wind speed Humidity Population density COVID-19 cases |
Italy |
Multivariate linear regression Trend analysis |
Weather indicators affect the trend of daily COVID-19 cases |
| Shahzad et al. (2020) |
Temperature Air quality |
Regions of Spain | Correlation and regression analysis | Temperature and airquality significantly related to COVID-19 |
| Air quality factors and COVID-19 | ||||
| Ogen, (2020) |
No2 COVID-19 deaths |
France, Germany, Spain, Italy | Spatial analysis | Long-term exposure increases COVID-19 fatalities |
| Zhu, Xie, Huang, and Cao, (2020) |
PM2.5 PM10 CO O3 SO2 NO2 |
China |
Generalized additive model Spearman correlation coefficients |
PM2.5, PM10, CO, O3, NO2 are positively related to COVID-19 cases SO2 is negatively related to COVID-19 cases |
| Dantas et al., (2020) |
PM10 CO O3 NO2 COVID-19 partial lockdown |
Rio de Janeiro, Brazil |
Standard methods by using R studio software |
CO reduced during the lockdown NO2 reduced during the lockdown PM10 decreases less during the lockdown O3 increased due to decrease in NO2 |
| Tobías, (2020) |
PM10 SO2 O3 NO2 BC COVID-19 cases |
Barcelona, Spain |
Data plotting by using google earth engine |
NO2 and black carbon reduced by 50% during the lockdown O3 increased by 50% in the lockdown period PM10 decreased in a lower amount in lockdown |
| Muhammad et al., (2020) |
Air pollution before and after COVID-19 COVID-19 cases |
China, France, Italy, Spain | Comparison by graphs |
Air pollution decreased by 30% during the lockdown Mobility decreased by 90% |
| Otmani et al., (2020) |
PM10 SO2 NO2 COVID-19 cases |
Sale, Morocco | HYSPLIT model | PM10, SO2, and NO2 are reduced by 50% during the lockdown |
| Zoran, Savastru, Savastru, and Tautan, (2020) |
PM10 PM2.5 Air quality index Temperature Humidity Wind speed Air pressure Planetary Boundary layer-PBL height COVID-19 daily new cases |
Melan, Italy | Correlation analysis |
PM and air quality index are positively related to daily new COVID-19 cases Dry air supports COVID-19 transmission Warm season has no role to reduce COVID-19 cases |
| Bashir, et al. (2020) |
PM10 PM2.5 NO2 CO Pb SO2 |
California | Kendall and Spearman correlation coefficient | PM10, PM2.5 NO2, CO, Pb, and SO2 are significantly related to COVID-19 |
| Habib et al., (2020) |
CO2 Oil price |
World level data | Wavelet analysis | COVID-19 has indirect impact on reduction in CO2 |
Recovered cases are equally important for studying as they reveal the process of desired outcomes after a huge number of infections. As Wuhan has completed its cycle of susceptible, exposed, infected, and recovered (SEIR), it is hugely beneficial to know the interaction of recovered cases with the climate indicators there (Zhang et al., 2020). Figure 3 illustrates the time trend of different climatological indicators during the lockdown period in Wuhan. So, we attempt to check the nonlinear association between climate indicators and recovered cases in Wuhan city using quantile-on-quantile (QQ) regression-based analysis. The outcome of this study can be beneficial for the rest of the world to expedite recovery by better understanding the environmental interaction with this disease where the COVID-19 pandemic is still spreading havoc. The quantile-on-quantile (QQ) based regression approach is especially useful where the relationship between the variables of interest is expected to be nonlinear or asymmetric. It has recently been used in the COVID-19-related studies in Wuhan (Habib et al., 2021; Sarwar et al., 2021; Shahzad et al., 2020).
Fig. 3.

Daily time trend of metrological factors during the lockdown period in Wuhan
A group of medical science researchers experimented on the difference between the dead and the recovered patients from COVID-19 in Wuhan. They found that patients with preexisting medical conditions, older in age, having a large count of white blood cells, low count of lymphocytes, acute lung disease, and acute cardiac injury were abundant in the dead group (Deng et al., 2020). Many of these diseases may worsen after exposure to bad environmental conditions (Kampa & Castanas, 2008).
Exposure to air pollution can have a devastating impact on pneumonia patients also, and this disease is the second largest to have shortened the human lives on earth (Jary et al., 2015). Millions of people die each year because of health complications arising from exposure to air pollution. Children are more vulnerable as pneumonia and air pollution seem to be correlated for their age group (Jary et al., 2017). Air pollution is a major source of complicating respiratory issues in humans. Since patients with preexisting lung infections are more vulnerable to being infected with COVID-19, it seems very important to provide them and others with a cleaner atmosphere for a smooth recovery. Interestingly, decreased economic and transportation activities after lockdowns have resulted in a significant reduction in carbon emission and gained the attention of scholars and policymakers.1
Despite an expected critical role of air pollution in COVID-19-related recoveries, to the best of our knowledge, no one has looked at the relationship between these two factors (environmental indicators and COVID-19 recoveries). This research is the first step toward a more profound understanding about the impact of all contributing factors of air quality index (PM10, PM2.5, NO2, CO, and SO2) and weather (humidity and temperature) on the COVID-19-related recoveries in the Wuhan city of China.
Data and research methodology
Data
In order to examine the asymmetric effect of the air quality index and weather-related factors on COVID-19 recovered cases, the present study has selected the lockdown period from 23rd January 2020 to 8th April 2020 in Wuhan, China, as the research sample. Daily air quality data were manually gathered from the web platform (https://www.aqistudy.cn). These six factors include (1) particulate matter (diameters ≤ 10 µm) (PM10), (2) particulate matter (diameters ≤ 2.5 µm) (PM2.5), (3) nitrogen dioxide (NO2), (4) carbon monoxide (CO), (5) sulfur dioxide (SO2), and (6) ozone (O3). The variables such as humidity and temperature are measured by averaging the hourly observations collected from another online web platform (https://www.wunderground.com). Daily data on COVID-19 recovered cases were manually gathered from the Chinese National Health Commission's official website. (CNHC, http://www.nhc.gov.cn/).
Research methodology
In this portion, we briefly elucidate the dynamic characteristics of the Quantile-on-Quantile (QQ) regression approach recently developed by Sim and Zhou, (2015) and its model description to determine the nonlinear nexus between environmental factors and COVID-19 recovered patients. The QQ approach is a generalized version of the basic quantile regression method. This recently developed QQ approach lets us explore how one variable affects the other variable in conditional quantiles distributions. This technique theoretically considers the mixture of nonparametric method and basic quantile regression. Firstly, the traditional quantile regression approach was developed by (Koenker & Bassett, 1978) to investigate how quantiles of independent variables affect the conditional means in quantiles of the response variable. Secondly, quantile regression is the extended form of the ‘classical linear regression method’ (CLRM).
Thirdly, Stone (1977) and Cleveland (1979) proposed a linear regression approach to determine the local effect of a certain quantile of the predictor variable on the fitted values of the predictand variables. In contrast to the OLS approach, the quantile regression identifies the impact of explanatory variables on dependent variable at the top, medium, and lower quantiles’ distributions, thus aiding us to evaluate the inclusive association between the variables at different time frames. This approach is added to develop the final methodology of QQ regression.
Moreover, the local linear regression approach deals well with the “curse of dimensionality,” which is not tackled by nonparametric estimations. The main motivation behind using the local linear regression model is to fit linear regression estimation around the nearest region of each data point in the given sample by assigning more weights to the nearer data points. Thus, the amalgamation of these two methods enables us to assess the association between quantiles of explanatory and predicted variables and delivers deeper information than conventional methods such as quantile regression or ordinary least squares.
The current research agenda aims to apply the QQ regression model to capture (a) the quantiles’ influence of climatological factors (PM2.5, TEMP, O3, PM10, SO2, NO2, and CO) on the quantiles of COVID-19 recovered cases. For this purpose, the following nonparametric quantile regression models are proposed.
| 1 |
where denotes the daily coronavirus recovered patients, while shows the climatological factors (, , , , , , , and ). φ is the φth quantile of uncertain distributions of , and is the residual term with zero φ-quantile. is an unknown function because we do not have prior evidence about the relationship between and .
The quantile regression helps to evaluate the impact of across different quantiles of . This versatile regression approach significantly captures the functional dependency relationship between and . Flexibility is the main benefit of this method because no prior information is available about the functional dependency between and . Nevertheless, the quantile regression approach overlooks the nature of dependency between the variables which is the constraint of this method. In this way, quantile regression approach neglects the behavior of positive and negative shocks of that could also influence the association between and . For example, the association between and might be different in different periods of economic cycles. Hence, Sim and Zhou (2015) provide a comprehensive QQ approach that can capture the dependency association between and . Then, in order to find the linkage between φth quantile of and τth quantile of , the local linear regressions are estimated for Eq. (1) in the neighborhood of . The regression function can be extended due to the unknown function of with the help of first-order Taylor expansion around a quantile of as under;
| 2 |
where denotes the partial derivative of for climatological factors in Eq. (2), unfolding its marginal effect. In the linear regression framework, yet it delivers a similar explanation to the slope of the coefficients. In addition, according to Sim and Zhou (2015), can be renamed as . Consequently, we can reformulate the Eqs. (2) as under;
| 3 |
By subtracting Eq. (3) from Eq. (1), we can get Eq. (4).
| 4 |
In described Eq. (4), the (*) demonstrates the quantile distribution of . In Eq. (4), the basic quantile function conditionally replicates the true connection between quantile of and τth quantile of due to dual index of & in and τ, respectively. Depending on the relationship between φth quantile of and τth quantile of , these parameters may generate different results. Hence, Eq. (4) identifies the quantile dependence framework between and through conditional distribution. Finally, we use local linear regression to estimate the slope of coefficients of meteorological components, which are represented b0and b1in Eq. (5). Moreover, and are the estimated values of and , respectively, in Eq. (2).
| 5 |
where denotes the ‘quantile loss function’, and K is the ‘Gaussian kernel function’. In this nonparametric QQR technique, bandwidth (h) selection is very important because the smoothness of slope of coefficients depends on it. In this study, following Sim and Zhou (2015), we used bandwidth (h = 0.05) to obtained optimal parameters in the QQ regression approach.
Results and discussion
The results of descriptive statistics and unit root tests have been displayed in Table 2. We employ two unit root tests such as Zivot and Andrews, (2002) and Dickey and Fuller, (1979). The mean value of daily new COVID-19 recovered patients is 601.532 in Wuhan which is very high, indicating the success story against the COVID-19. The average temperature is 11.34 °C, which shows that Wuhan was a little colder during the epidemic. The average humidity is 70.60% which was moderate. The daily (average) concentrations of PM10, NO2, CO, PM2.5, O3, and SO2 were 70.60 µg/m3, 38.24 µg/m3, 8.11 µg/m3, 16.53 µg/m3, 0.903 µg/m3, and 51.70 µg/m3, respectively. The Jarque–Berra (JB) test shows the normality of the data distribution. The JB findings are statistically significant for all the variables except CO. Therefore, the non-normality of the variables shows asymmetric behavior which confirms that the QQR approach is an appropriate approach to estimation here. The findings of ZA and ADF unit root tests illustrate that all series are significant at the first difference-1(1) and suggest that we can proceed further for QQR estimations.
Table 2.
Summary statistics and unit root tests
| Variables | N | Mean | Std. Dev | Min | Max | J-B stats | ADF-1(1) | ZA-1(1) | Break day |
|---|---|---|---|---|---|---|---|---|---|
| COVID-19 | 77 | 601.532 | 592.213 | 0 | 2498 | 12.56*** | − 10.771*** | − 6.639*** | 28feb2020 |
| TEMP | 77 | 11.341 | 4.808 | 2.731 | 20.579 | 162.8*** | − 8.736*** | − 6.053*** | 28mar2020 |
| HUM | 77 | 70.605 | 11.188 | 44.083 | 89.583 | 6.901* | − 9.205*** | − 7.196*** | 28mar2020 |
| PM2.5 | 77 | 16.534 | 17.648 | 2.731 | 80.688 | 8.984*** | − 11.245*** | − 7.711*** | 06feb2020 |
| PM10 | 77 | 70.605 | 11.188 | 44.083 | 89.583 | 7.07** | − 11.013*** | − 11.095*** | 06feb2020 |
| NO2 | 77 | 38.247 | 17.549 | 8 | 97 | 40.6*** | − 8.514*** | − 7.894*** | 02mar2020 |
| SO2 | 77 | 51.701 | 22.298 | 12 | 103 | 15.35*** | − 9.521*** | − 8.117*** | 19feb2020 |
| CO | 77 | 8.117 | 2.748 | 5 | 17 | 1.908 | − 11.581*** | − 8.885*** | 05feb2020 |
| O3 | 77 | 0.903 | 0.195 | 0.5 | 1.4 | 6.89* | − 11.422*** | − 8.802*** | 28mar2020 |
*, **, *** show the significance level at 1%, 5%, and 10%, respectivley
Figure 4 displays the findings of the correlation examination of our main variables of attention. The colored vertical bar on the right side shows the scale, while the colored boxes inside the huge square show the magnitude and strength of the association. All variables show a negative association with COVID-19 recoveries, represented mainly by different shades of blue color except CO, which show moderate positive association.
Fig. 4.
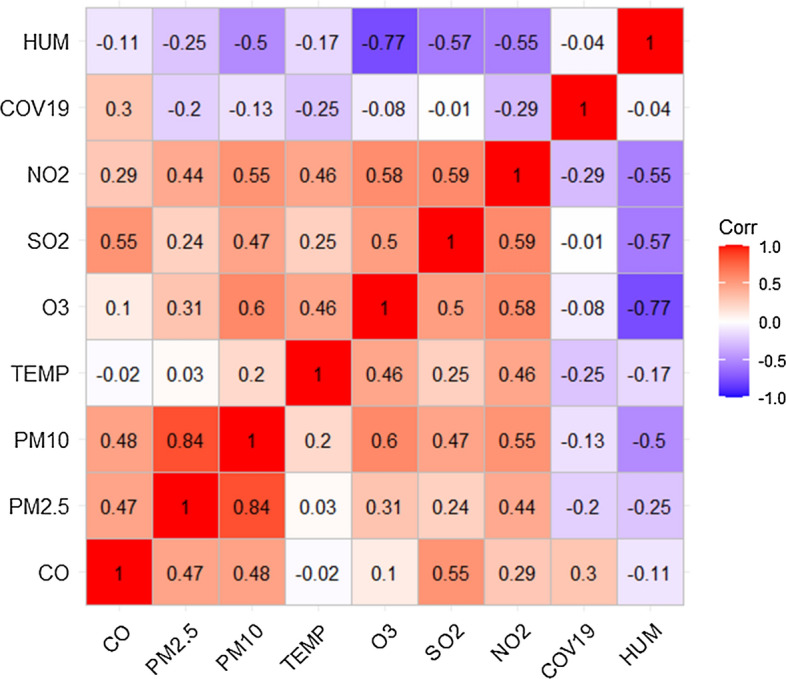
Correlation plot between variables
Figure 5a-h presents the findings from QQR analysis. The coefficient’s slop is estimated, indicating the impact of quantiles of HUM, PM2.5, TEMP, PM10, CO, O3, NO2, and SO2 on quantiles of COVID-19 recovered patients. We have observed significant heterogeneity between climate factors and COVID-19 recovered cases.
Fig. 5.
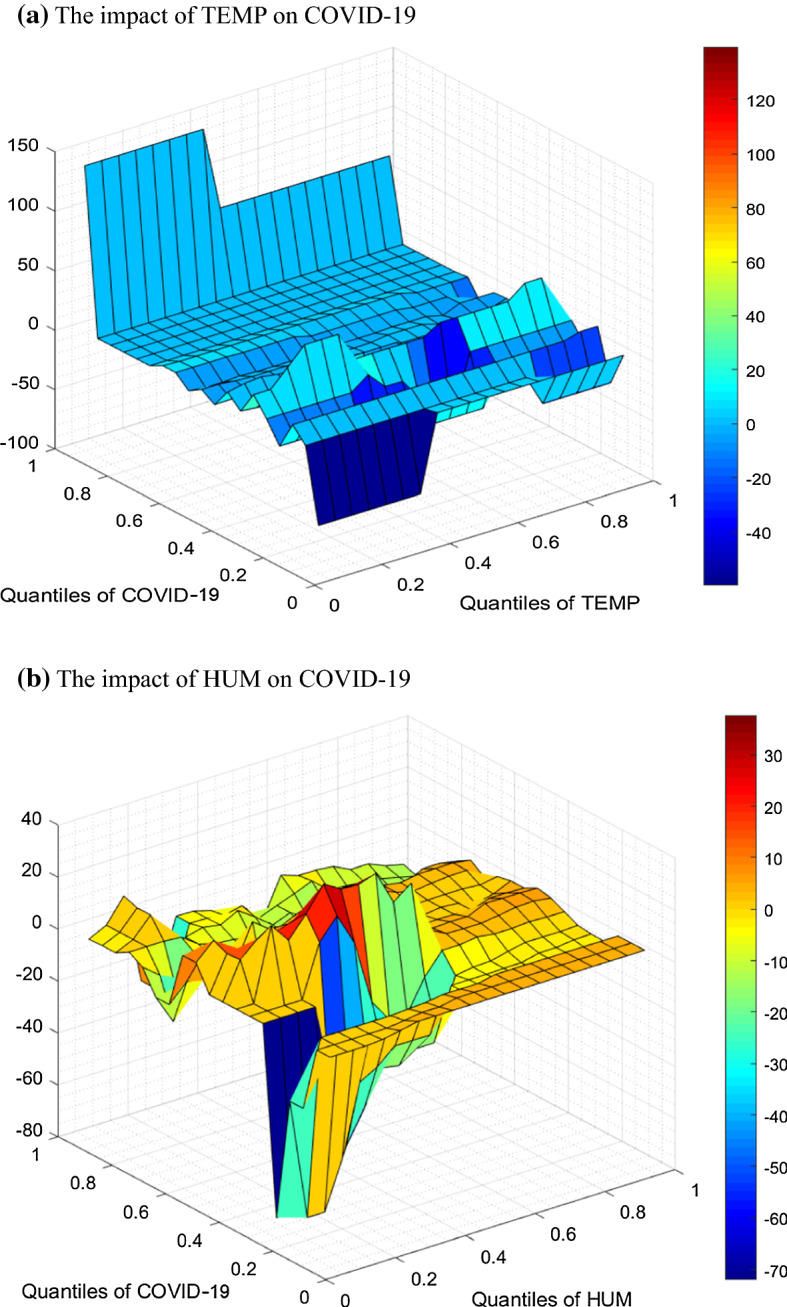
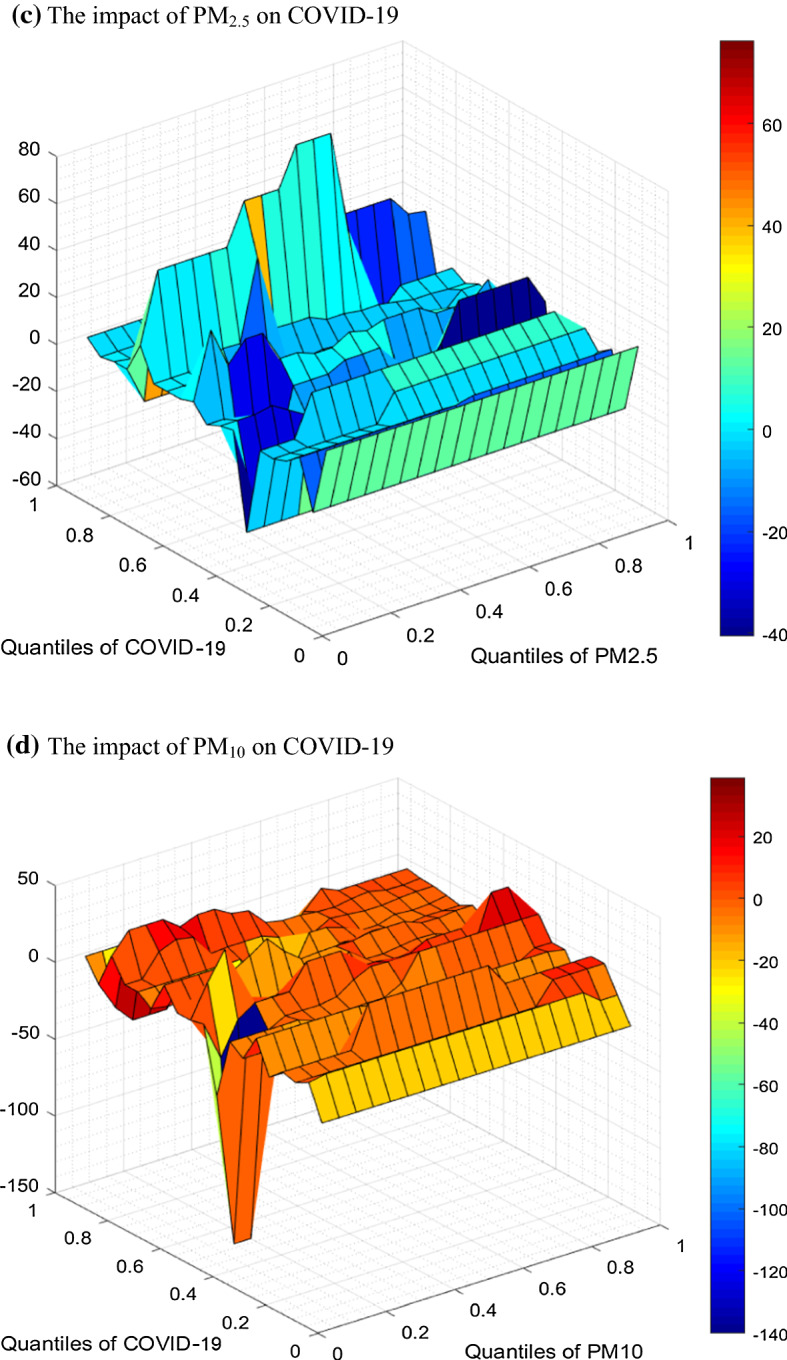
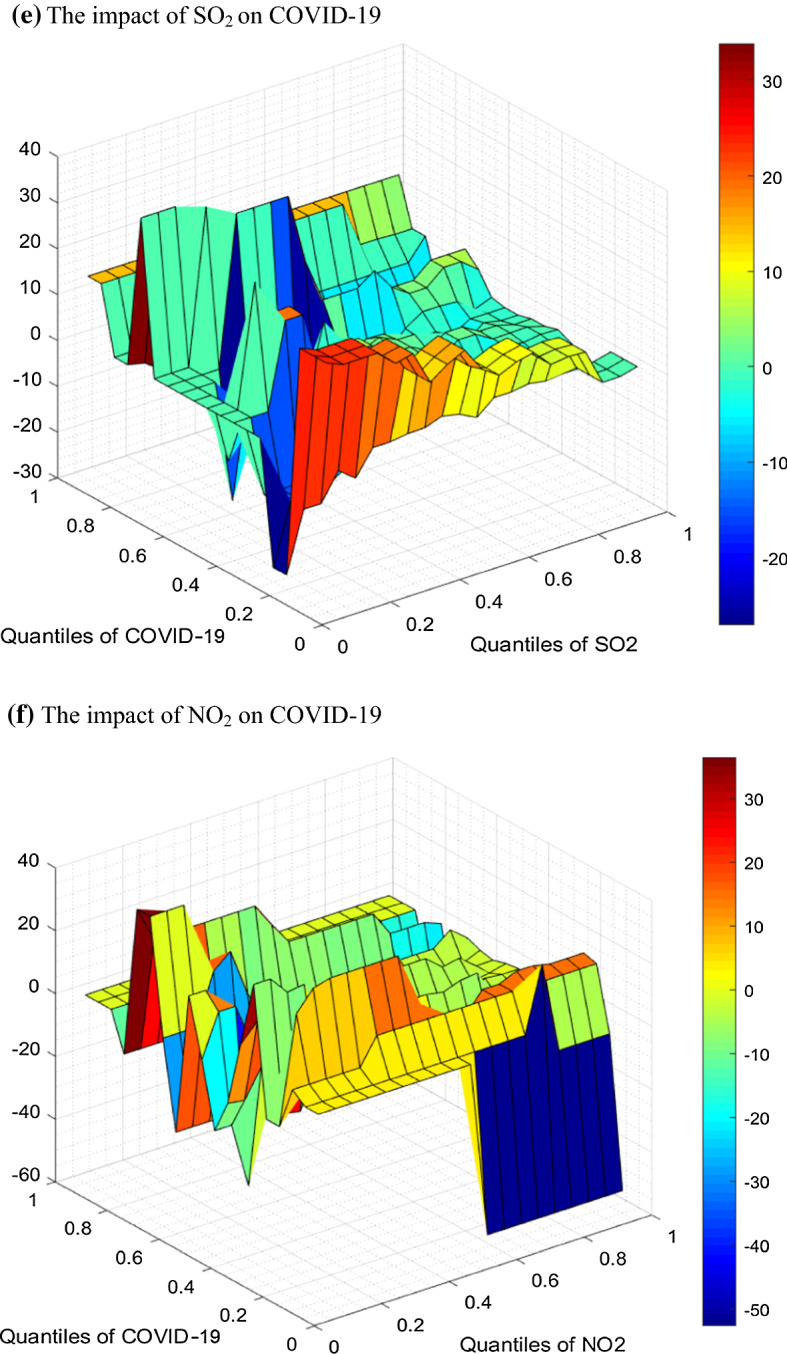
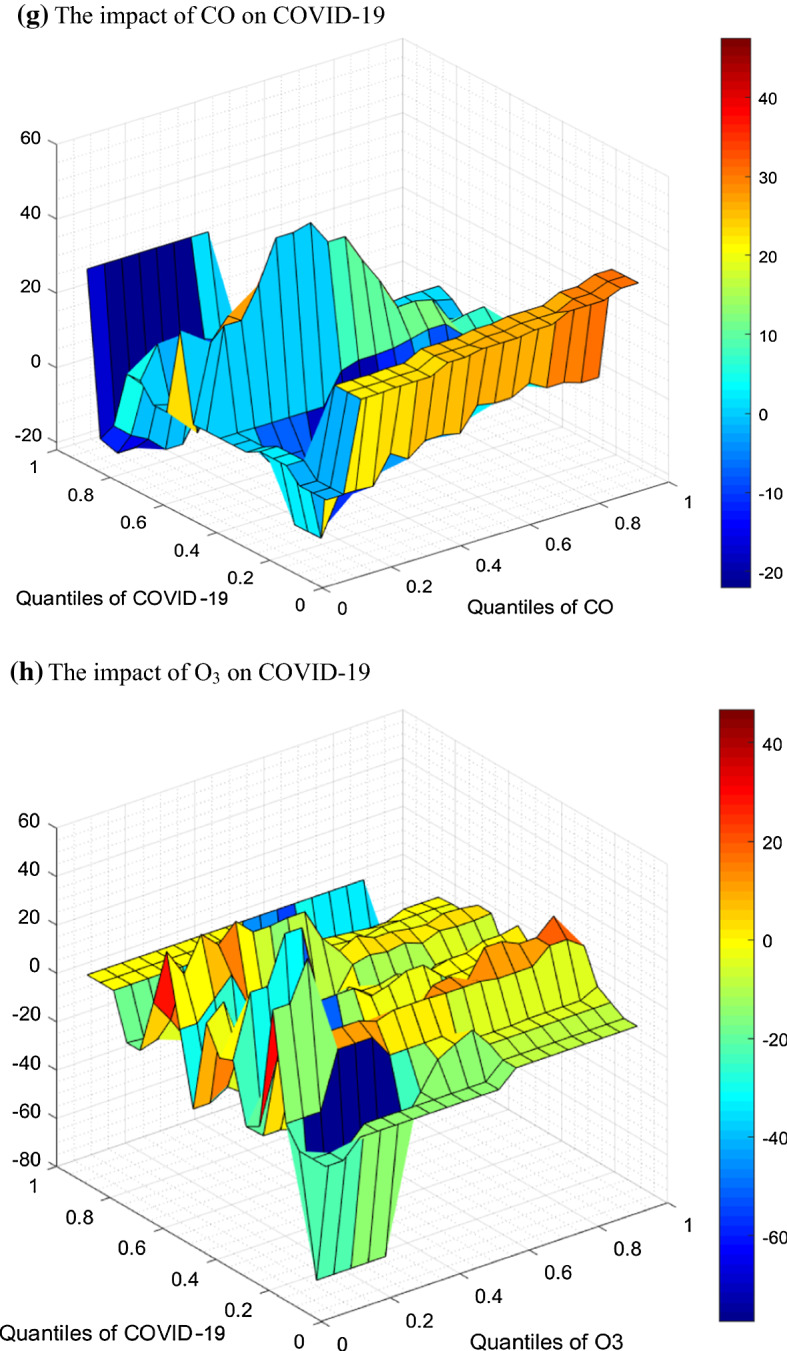
Quantile-on-Quantile regression estimates slop of the coefficients, a The impact of TEMP on COVID-19. b The impact of HUM on COVID-19 c) The impact of PM2.5 on COVID-19 d The impact of PM10 on COVID-19 e The impact of SO2 on COVID-19 f The impact of NO2 on COVID-19 g The impact of CO on COVID-19 h The impact of O3 on COVID-19
Figure 5a shows the QQ result of the relationship between TEMP and COVID-19 recoveries, which is almost dominantly negative, implying that change in temperature may not have a substantial impact on COVID-19 recovery. Lower quartiles of temperature and COVID-19 recoveries are strongly and negatively related, while interestingly the upper quartiles of COVID-19 recoveries are weakly negatively related to lower quartiles of temperature. The overall scenario suggests a weak positive to a negative relationship between TEMP and COVID-19 recoveries in Wuhan. The mixed result is in line with the previous research related to the role of temperature in COVID-19 infections in Wuhan (Iqbal et al., 2020a, 2020b; Jahangiri et al., 2020; Shi et al., 2020).
Figure 5b displays the effect of HUM on COVID-19 recoveries which is negative with a prominent, blue-colored, and downward spike at lower quartiles of humidity and lower-middle quartiles of COVID-19 recoveries. The middle quartiles of humidity and COVID-19 recoveries are representing neutral to positive association mostly. The upper quartiles of both the variables are flat, suggesting an insignificant relationship. Earlier studies demonstrate an inverse relationship between an increase in HUM and daily additional COVID-19 infections (Qi et al., 2020). The QQR results of this study show that an increase in HUM does play a significant role in increasing COVID-19 recoveries, consistent with the findings of the earlier studies.
Figure 5c displays the findings from the QQ regression of COVID-19 recoveries on PM2.5, revealing a negative association between these two variables. Dark, light, and sky-blue colors scattered throughout the graph show that an increase in pollution (PM2.5) caused a slow-down in COVID-19 recoveries. The upper quartiles of COVID-19 recoveries show a mild negative association with almost all the quartiles of PM2.5, while a strong negative association represented by the dark red color is observable in the 50–70th quartiles of COVID-19 recoveries with 10–30th and 70–95th quartiles of PM2.5, respectively. The previous research observed a direct linkage between PM2.5 and COVID-19 daily new confirmed cases (Zhu et al., 2020). However, we have taken daily new recovered cases, which are negatively related to PM2.5. Hence, we can say that the overall scenario of this portion of the results is similar to the previous research.
The impact of another environmental pollutant, PM10, on the COVID-19 recoveries is given dominantly by the red-colored graph in Fig. 5d. Almost all quartiles of PM10 positively influence all the quartiles of COVID-19 recoveries except the 20th quartile of PM10 on the 50th quartile of COVID-19 recoveries, which is blue in color representing a strong negative association. This result shows that the level of PM10 in the air is positively linked with COVID-19 recoveries. Although it is counter-intuitive, but similar results have been reported in other related studies recently, with the COVID-19 daily new cases (Zhu et al., 2020). The inclusive findings signify the asymmetric relationship between COVID-19 recoveries and PM10 through different quantiles’ patterns.
As evident from Fig. 5e, the association between SO2 and COVID-19 recoveries is dominantly mixed in nature, as shown by the blue, light green, red, light blue and light-yellow colors scattered throughout the graph, in different quartiles-combinations. The 20–40th quartiles of SO2 affect the 50th and 70–80th quartiles of COVID-19 recoveries positively but weakly. Lower to middle quartiles of SO2 affect lower (up to 20th) quartiles of COVID-19 recoveries strongly positively. The upper quartiles of SO2 indicate a weak relationship (positive and negative) with middle and upper quartiles of COVID-19 recoveries. Overall, this graph shows a mixed and non-deterministic relationship between SO2 and COVID-19 recoveries. These results are also consistent with the recent literature (Pansini & Fornacca, 2020; Zhu & Xie, 2020b).
Figure 5f shows the coefficients resulting from the QQ regression between NO2 and COVID-19 recoveries. It is notably a negative association represented by the scattered bluish colors throughout the graph with very few red spots. The upper quartiles (60–100th) of NO2 illustrate a very strong and inverse influence on the lower quartiles of COVID-19 recoveries represented by a dark blue colored downward spike. These findings support the results of yet another recent study (Ogen, 2020).
From Fig. 5g, the impact of CO on COVID-19 recoveries is also negative, predominantly like other pollution factors, with only a few exceptions. Almost all the quartiles of CO affect the lower quartiles (up to 20th) of COVID-19 recoveries positively. The lower and lower-middle quartiles of CO indicate a strong inverse relationship with the upper (90th) quartile of COVID-19 recoveries. The findings are parallel to the outcomes of a recent study (Zhu et al., 2020). The lower to middle quartiles of CO affect 50–60th quartiles of COVID-19 recoveries negatively, while 60–100th quartiles of CO affect the same, i.e., 50–60th quartiles of COVID-19 recoveries positively. The heterogeneous relationship confirms the nonlinear/asymmetric association between CO and COVID-19 recovered patients.
Overall, O3 has a weak and negative association with COVID-19 recoveries, with a few areas of strong positive and strong negative relationships in Fig. 5h. The quartiles 10–30th of O3 show a strong negative association with lower, i.e., up to 20th quartiles of COVID-19 recoveries represented by the dark blue color. The results support the previous research (Zhu et al., 2020). Some red areas can be found at the intersection of lower and upper quartiles of O3, with the middle quartiles of COVID-19 recoveries showing a positive association.
Conclusion
The most critical step forward in the process of socio-economic recovery from the current COVID-19 pandemic must prioritize the public health. This paper examined the impact of temperature, humidity, and different components of air quality index on COVID-19 recoveries in the Wuhan city, using quantile-on-quantile (QQ) regression. This method helps to extract nonlinear associations between different quartiles of the independent and dependent variables. Humidity played a positive role in COVID-19 recoveries, while temperature seemed to remain insignificant in this regard. These results are consistent with recent literature on the interaction between weather and COVID-19 in many parts of the world (Iqbal et al., 2020a, 2020b; Shahzad et al., 2020). Bad air quality affected COVID-19 recoveries negatively as indicated by the majority of the factors of air quality index, including CO, PM2.5, O3, NO2, and PM10. Our findings are obtained from only one city’s data and may not apply to those cities where weather conditions and environmental issues are significantly different than Wuhan.
Furthermore, the World Health Organization has stated that the pandemic will not be over soon. Therefore, our purpose is to guide the policymakers on early evidence and show how climate indicators are asymmetrically linked with COVID-19 recoveries. Future studies could look into the reverse impact of COVID-19 recoveries on the environment or lockdown proxies as control variables.
Funding
Yong Yan and Zeeshan Fareed acknowledge this research funded by the Humanities and Social Sciences Research, Chinese Ministry of Education (17YJCZH209).
Declarations
Conflict of interest
The authors declare that they have no conflict of interest.
Footnotes
Publisher's Note
Springer Nature remains neutral with regard to jurisdictional claims in published maps and institutional affiliations.
Contributor Information
Zhai Shuai, Email: zsronny@zjhu.edu.cn.
Najaf Iqbal, Email: najaf_iqbal@live.com.
Rai Imtiaz Hussain, Email: rai.hussain@uo.edu.pk.
Farrukh Shahzad, Email: farrukh.hailian@gmail.com.
Yong Yan, Email: yanyong992@zjhu.edu.cn.
Zeeshan Fareed, Email: zeeshanfareed@hotmail.com, Email: zeeshanfareed@zjhu.edu.cn.
Bilal, Email: bilal@hbue.edu.cn.
References
- Ali, H., Yilmaz, G., Fareed, Z., Shahzad, F., Ahmad, M. J. A. Q., Atmosphere, & Health. (2021). Impact of novel coronavirus (COVID-19) on daily routines and air environment: Evidence from Turkey. 14(3), 381–387. [DOI] [PMC free article] [PubMed]
- Arain H, Han L, Sharif A, Meo MS. Investigating the effect of inbound tourism on FDI: The importance of quantile estimations. Tourism Economics. 2019 doi: 10.1177/1354816619859695. [DOI] [Google Scholar]
- Bashir, M. F., Ma, B., Komal, B., Bashir, M. A., Tan, D., & Bashir, M. (2020a). Correlation between climate indicators and COVID-19 pandemic in New York, USA. Science of The Total Environment, 728, 138835. [DOI] [PMC free article] [PubMed]
- Bashir MF, Benjiang M, Shahzad LJAQ, Atmosphere, & Health. A brief review of socio-economic and environmental impact of Covid-19. Air Quality, Atmosphere & Health. 2020;13(12):1403–1409. doi: 10.1007/s11869-020-00894-8. [DOI] [PMC free article] [PubMed] [Google Scholar]
- Bashir MF, Jiang B, Komal B, Bashir MA, Farooq TH, Iqbal N, Bashir MJE, r. Correlation between environmental pollution indicators and COVID-19 pandemic: a brief study in Californian context. Environmental Research. 2020;187:109652. doi: 10.1016/j.envres.2020.109652. [DOI] [PMC free article] [PubMed] [Google Scholar]
- Briz-Redón Á, Serrano-Aroca Á. A spatio-temporal analysis for exploring the effect of temperature on COVID-19 early evolution in Spain. Science of the Total Environment. 2020;728:138811. doi: 10.1016/j.scitotenv.2020.138811. [DOI] [PMC free article] [PubMed] [Google Scholar]
- Cleveland WS. Robust locally weighted regression and smoothing scatterplots. Journal of the American Statistical Association. 1979;74(368):829–836. doi: 10.1080/01621459.1979.10481038. [DOI] [Google Scholar]
- Dantas G, Siciliano B, França BB, da Silva CM, Arbilla G. The impact of COVID-19 partial lockdown on the air quality of the city of Rio de Janeiro. Brazil. Science of the Total Environment. 2020;729:139085. doi: 10.1016/j.scitotenv.2020.139085. [DOI] [PMC free article] [PubMed] [Google Scholar]
- Deng Y, Liu W, Liu K, Fang Y-Y, Shang J, Wang K, et al. Clinical characteristics of fatal and recovered cases of coronavirus disease 2019 (COVID-19) in Wuhan, China: a retrospective study. Chinese Medical Journal. 2020;133:1261. doi: 10.1097/CM9.0000000000000824. [DOI] [PMC free article] [PubMed] [Google Scholar]
- Dickey DA, Fuller WA. Distribution of the estimators for autoregressive time series with a unit root. Journal of the American Statistical Association. 1979;74(366a):427–431. doi: 10.1080/01621459.1979.10482531. [DOI] [Google Scholar]
- Fareed, Z., Iqbal, N., Shahzad, F., Shah, S. G. M., Zulfiqar, B., Shahzad, K., Shahzad, U. (2020). Co-variance nexus between COVID-19 mortality, humidity, and air quality index in Wuhan, China: New insights from partial and multiple wavelet coherence. Air Quality, Atmosphere Health. 10.1007/s11869-020-00847-1 [DOI] [PMC free article] [PubMed]
- Fareed, Z., & Iqbal, N. (2020). COVID-19 and Insurance market returns in emerging and developed markets: A comparative study based on Wavelet methods. Preprint at https://www.researchsquare.com/article/rs-93926/v1.
- Habib Y, Xia E, Fareed Z, Hashmi SH. Time–frequency co-movement between COVID-19, crude oil prices, and atmospheric CO2 emissions. Fresh Global Insights from Partial and Multiple Coherence Approach. Environment, Development and Sustainability. 2020;1:1–21. doi: 10.1007/s10668-020-01031-2. [DOI] [PMC free article] [PubMed] [Google Scholar]
- Habib, Y., Xia, E., Hashmi, S. H., & Fareed, Z. (2021). Non-linear spatial linkage between COVID-19 pandemic and mobility in ten countries: A lesson for future wave. Journal of Infection and Public Health. 10.1016/j.jiph.2021.08.008. [DOI] [PMC free article] [PubMed]
- Iqbal N, Fareed Z, Guangcai W, Shahzad F. Asymmetric nexus between COVID-19 outbreak in the world and cryptocurrency market. International Review of Financial Analysis. 2020 doi: 10.1016/j.irfa.2020.101613. [DOI] [PMC free article] [PubMed] [Google Scholar]
- Iqbal N, Fareed Z, Shahzad F, He X, Shahzad U, Lina M. Nexus between COVID-19, temperature and exchange rate in Wuhan City: New findings from Partial and Multiple Wavelet Coherence. Science of the Total Environment. 2020;729:138916. doi: 10.1016/j.scitotenv.2020.138916. [DOI] [PMC free article] [PubMed] [Google Scholar]
- Irfan, M., Ahmad, M., Fareed, Z., Iqbal, N., Sharif, A., & Wu, H. (2021). On the indirect environmental outcomes of COVID-19: Short-term revival with futuristic long-term implications. International Journal of Environmental Health Research, 1–11. [DOI] [PubMed]
- Jahangiri M, Jahangiri M, Najafgholipour M. The sensitivity and specificity analyses of ambient temperature and population size on the transmission rate of the novel coronavirus (COVID-19) in different provinces of Iran. Science of the Total Environment. 2020;728:138872. doi: 10.1016/j.scitotenv.2020.138872. [DOI] [PMC free article] [PubMed] [Google Scholar]
- Jary H, Mallewa J, Nyirenda M, Faragher B, Heyderman R, Peterson I, et al. Study protocol: The effects of air pollution exposure and chronic respiratory disease on pneumonia risk in urban Malawian adults-the acute infection of the respiratory tract study (the air study) BMC Pulmonary Medicine. 2015;15:96. doi: 10.1186/s12890-015-0090-3. [DOI] [PMC free article] [PubMed] [Google Scholar]
- Jary HR, Aston S, Ho A, Giorgi E, Kalata N, Nyirenda M, et al. Household air pollution, chronic respiratory disease and pneumonia in Malawian adults: a case-control study. Wellcome open research 2017; 2. [DOI] [PMC free article] [PubMed]
- Kampa M, Castanas E. Human health effects of air pollution. Environmental Pollution. 2008;151(2):362–367. doi: 10.1016/j.envpol.2007.06.012. [DOI] [PubMed] [Google Scholar]
- Koenker R, Bassett G. Regression Quantiles. Econometrica. 1978;46(1):33. doi: 10.2307/1913643. [DOI] [Google Scholar]
- Lan L, Xu D, Ye G, Xia C, Wang S, Li Y, et al. Positive RT-PCR test results in patients recovered from COVID-19. JAMA. 2020;323:1502–1503. doi: 10.1001/jama.2020.2783. [DOI] [PMC free article] [PubMed] [Google Scholar]
- Latif, F., Bashir, M. F., Komal, B., & Tan, D. (2020). Role of electronic media in mitigating the psychological impacts of novel coronavirus (COVID-19). Psychiatry research, 289, 113041. [DOI] [PMC free article] [PubMed]
- Ma Y, Zhao Y, Liu J, He X, Wang B, Fu S, et al. Effects of temperature variation and humidity on the death of COVID-19 in Wuhan. China. Science of the Total Environment. 2020;724:138226. doi: 10.1016/j.scitotenv.2020.138226. [DOI] [PMC free article] [PubMed] [Google Scholar]
- Muhammad S, Long X, Salman M. COVID-19 pandemic and environmental pollution: A blessing in disguise? Science of the Total Environment. 2020;728:138820. doi: 10.1016/j.scitotenv.2020.138820. [DOI] [PMC free article] [PubMed] [Google Scholar]
- Ogen Y. Assessing nitrogen dioxide (NO2) levels as a contributing factor to coronavirus (COVID-19) fatality. Science of the Total Environment. 2020;726:138605. doi: 10.1016/j.scitotenv.2020.138605. [DOI] [PMC free article] [PubMed] [Google Scholar]
- Otmani A, Benchrif A, Tahri M, Bounakhla M, El Bouch M, Krombi M. Impact of Covid-19 lockdown on PM10, SO2 and NO2 concentrations in Salé City (Morocco) Science of the Total Environment. 2020;735:139541. doi: 10.1016/j.scitotenv.2020.139541. [DOI] [PMC free article] [PubMed] [Google Scholar]
- Pansini, R., & Fornacca, D. (2020). COVID-19 higher induced mortality in Chinese regions with lower air quality. medRxiv. [DOI] [PMC free article] [PubMed]
- Pirouz B, Shaffiee Haghshenas S, Pirouz B, Shaffiee Haghshenas S, Piro P. Development of an assessment method for investigating the impact of climate and urban parameters in confirmed cases of covid-19: A new challenge in sustainable development. International Journal of Environmental Research and Public Health. 2020;17(8):2801. doi: 10.3390/ijerph17082801. [DOI] [PMC free article] [PubMed] [Google Scholar]
- Prata DN, Rodrigues W, Bermejo PH. Temperature significantly changes COVID-19 transmission in (sub) tropical cities of Brazil. Science of the Total Environment. 2020;729:138862. doi: 10.1016/j.scitotenv.2020.138862. [DOI] [PMC free article] [PubMed] [Google Scholar]
- Qi H, Xiao S, Shi R, Ward MP, Chen Y, Tu W, Zhang Z. COVID-19 transmission in Mainland China is associated with temperature and humidity: A time-series analysis. Science of the Total Environment. 2020;728:138778. doi: 10.1016/j.scitotenv.2020.138778. [DOI] [PMC free article] [PubMed] [Google Scholar]
- Şahin M. Impact of weather on COVID-19 pandemic in Turkey. Science of the Total Environment. 2020;728:138810. doi: 10.1016/j.scitotenv.2020.138810. [DOI] [PMC free article] [PubMed] [Google Scholar]
- Sarwar, S., Shahzad, K., Fareed, Z., & Shahzad, U. (2021). A study on the effects of meteorological and climatic factors on the COVID-19 spread in Canada during 2020. Journal of Environmental Health Science and Engineering, 1–9. [DOI] [PMC free article] [PubMed]
- Shahzad F, Shahzad U, Fareed Z, Iqbal N, Hashmi SH, Ahmad F. Asymmetric nexus between temperature and COVID-19 in the top ten affected provinces of China: A current application of quantile-on-quantile approach. Science of the Total Environment. 2020;736:139115. doi: 10.1016/j.scitotenv.2020.139115. [DOI] [PMC free article] [PubMed] [Google Scholar]
- Shahzad, K., Shahzad, U., Iqbal, N., Shahzad, F., & Fareed, Z. (2020). Effects of climatological parameters on the outbreak spread of COVID-19 in highly affected regions of Spain. Environmental Science and Pollution Research, 27(31), 39657–39666. [DOI] [PMC free article] [PubMed]
- Shi, P., Dong, Y., Yan, H., Zhao, C., Li, X., Liu, W., & Xi, S. (2020). Impact of temperature on the dynamics of the COVID-19 outbreak in China. Science of the Total Environment,728 [DOI] [PMC free article] [PubMed]
- Sim N, Zhou H. Oil prices, US stock return, and the dependence between their quantiles. Journal of Banking and Finance. 2015;55:1–8. doi: 10.1016/j.jbankfin.2015.01.013. [DOI] [Google Scholar]
- Stone CJ. Consistent nonparametric regression. The Annals of Statistics. 1977;5:595–620. doi: 10.1214/aos/1176343886. [DOI] [Google Scholar]
- Tobías A. Evaluation of the lockdowns for the SARS-CoV-2 epidemic in Italy and Spain after one month follow up. Science of the Total Environment. 2020;725:138539. doi: 10.1016/j.scitotenv.2020.138539. [DOI] [PMC free article] [PubMed] [Google Scholar]
- Tosepu R, Gunawan J, Effendy DS, Ahmad LOAI, Lestari H, Bahar H, Asfian P. Correlation between weather and Covid-19 pandemic in Jakarta. Indonesia. Science of the Total Environment. 2020 doi: 10.1016/j.scitotenv.2020.138436. [DOI] [PMC free article] [PubMed] [Google Scholar]
- Xing Y, Mo P, Xiao Y, Zhao O, Zhang Y, Wang F. Post-discharge surveillance and positive virus detection in two medical staff recovered from coronavirus disease 2019 (COVID-19), China, January to February 2020. Eurosurveillance. 2020;25:2000191. doi: 10.2807/1560-7917.ES.2020.25.10.2000191. [DOI] [PMC free article] [PubMed] [Google Scholar]
- Yan, Y., Shah, M. I., Sharma, G. D., Chopra, R., Fareed, Z., & Shahzad, U. (2021). Can tourism sustain itself through the pandemic: nexus between tourism, COVID-19 cases and air quality spread in the ‘Pineapple State’Hawaii. Current Issues in Tourism, 1–20.
- Zhang Y, Yu X, Sun H, Tick GR, Wei W, Jin B. (2020) COVID-19 infection and recovery in various countries: Modeling the dynamics and evaluating the non-pharmaceutical mitigation scenarios. arXiv preprint arXiv:2003.13901.
- Zhu Y, Xie J. Association between ambient temperature and COVID-19 infection in 122 cities from China. Science of the Total Environment. 2020;724:138201. doi: 10.1016/j.scitotenv.2020.138201. [DOI] [PMC free article] [PubMed] [Google Scholar]
- Zhu Y, Xie J. Association between ambient temperature and COVID-19 infection in 122 cities from China. Science of the Total Environment. 2020 doi: 10.1016/j.scitotenv.2020.138201. [DOI] [PMC free article] [PubMed] [Google Scholar]
- Zhu Y, Xie J, Huang F, Cao L. Association between short-term exposure to air pollution and COVID-19 infection: Evidence from China. Science of the Total Environment. 2020 doi: 10.1016/j.scitotenv.2020.138704. [DOI] [PMC free article] [PubMed] [Google Scholar]
- Zivot E, Andrews DWK. Further evidence on the great crash, the oil-price shock, and the unit-root hypothesis. Journal of Business & Economic Statistics. 2002;20(1):25–44. doi: 10.1198/073500102753410372. [DOI] [Google Scholar]
- Zoran, M. A., Savastru, R. S., Savastru, D. M., & Tautan, M. N. (2020). Assessing the relationship between surface levels of PM2. 5 and PM10 particulate matter impact on COVID-19 in Milan, Italy. Science of The Total Environment, 139825. [DOI] [PMC free article] [PubMed]