

Abstract
As molecular electronic components, proteins are distinguished by a remarkably long electronic decay length (~10 nm) together with high contact resistance and extreme sensitivity to the chemical details of the contact. As a consequence, the conductance of even a large bioelectronic assembly is largely controlled by the conductance of the contacts. Streptavidin is a versatile linker-protein that can tether together biotinylated electrodes and biotinylated proteins, but with an ambiguity about the contact geometry that arises from its four possible binding sites for biotin. Here, we use engineered streptavidin tetramers, selected to contain a defined ratio of active monomers to ‘dead’ monomers so as to define the biotin binding sites. We find a strong dependence of conductance on the separation of the biotin molecules, consistent with a short-range tunneling interaction within the streptavidin, and in contrast to the long-range transport observed inside larger proteins. Hexaglutamate tails label the active monomers and the additional negative charge enhances conductance significantly. This effect is quantitatively accounted for by an electronic resonance in the protein conductance.
Graphical Abstract
INTRODUCTION
Proteins connected to electrodes via well-defined chemical contacts are remarkably good electrical conductors.1 Their contact resistance is high, probably owing to the tunnel barrier presented by an outer shell of hydrated residues, but once carriers are injected, the long decay length (on the order of 10 nm) gives rise to improved conductance relative to conventional molecular wires, for lengths in excess of 5 nm.2, 3 In DNA, thermally-activated hopping4 leads to nearly-distance independent transport when the distance between the readily-oxidized guanines exceeds three nucleotides.5 Hopping transport via readily oxidized amino acids has been observed in peptides6 although the transport mechanism in proteins lacking stacked chains of aromatic residues has yet to be established. The presence of a conduction resonance at an energy well-removed from the oxidation potential of the electroactive amino acids suggests that redox reactions do not play a role.7 In this paper we focus only on one aspect which is the role of the multivalent protein streptavidin as a connector in a bioelectronic circuit.
The specific self-assembly of proteins allows quite complex circuits to be built. For example, because polymerase Φ29 interacts with metals unpredictably owing to seven surface cysteines, streptavidin bridges were used to connect doubly-biotinylated Φ29 to biotinylated electrodes, allowing enzyme fluctuations to be recorded electrically.8 Streptavidin is a tetrameric protein with an extremely high affinity for the vitamin biotin9 and it is an important component of nano-scale protein assemblies.10 The chemical nature of the electrical contact has a strong effect on the conductance of streptavidin. Streptavidin molecules connected to electrodes via surface thiols (by means of lysine modification) have a significantly lower conductance than molecules attached to electrodes by means of the non-covalent biotin-streptavidin interaction, despite an eight-atom saturated chain linker between the biotin and the electrode.1 However, the distribution of measured conductances for streptavidin molecules (and complexes connected via streptavidin) has multiple peaks, indicative of multiple modes of connection, made possible by the tetravalent nature of streptavidin. This ambiguity in connection geometries is not easily resolved. Breaking the protein into subunits can produce a dimeric streptavidin, but only at the cost of a large decrease in biotin binding strength11 because the interaction is driven by cooperative interactions between the subunits and the hydration shell of the tetramer.12 Fairhead et al. have introduced an ingenious method for synthesizing tetramers of defined valence with no diminution in biotin binding affinity.13 They engineered monomers (SAe) with wild-type sequences, but labeled with hexaglutamate tails at the C terminus. They also engineered dead units (D) (containing the mutations N32A, S27D and S45A) that did not bind biotin. They then refolded mixtures of SAe and D monomers, and used ion-exchange chromatography to select molecules with the desired ratio of SAe to D units. These combinations are shown schematically in Figure 1d. The SAe2D2 molecule labeled 1,3 (blue ‘live’ monomers in Fig. 1) carries a slightly higher charge density than the other divalent combinations (1,2 and 1,4)13 and can therefore be separated from them. We have measured conductance distributions for these modified streptavidins and used them to connect doubly-biotinylated Φ29 to electrodes. In addition to clarifying the role of streptavidin contacts, these experiments demonstrate how a multi-protein complex has a conductance little different than the conductance of the units used to make the contacts, so multiple proteins can be daisy-chained with little loss of conductance. They also show how engineering the interfacial charge can modulate protein conductance.
Figure 1:
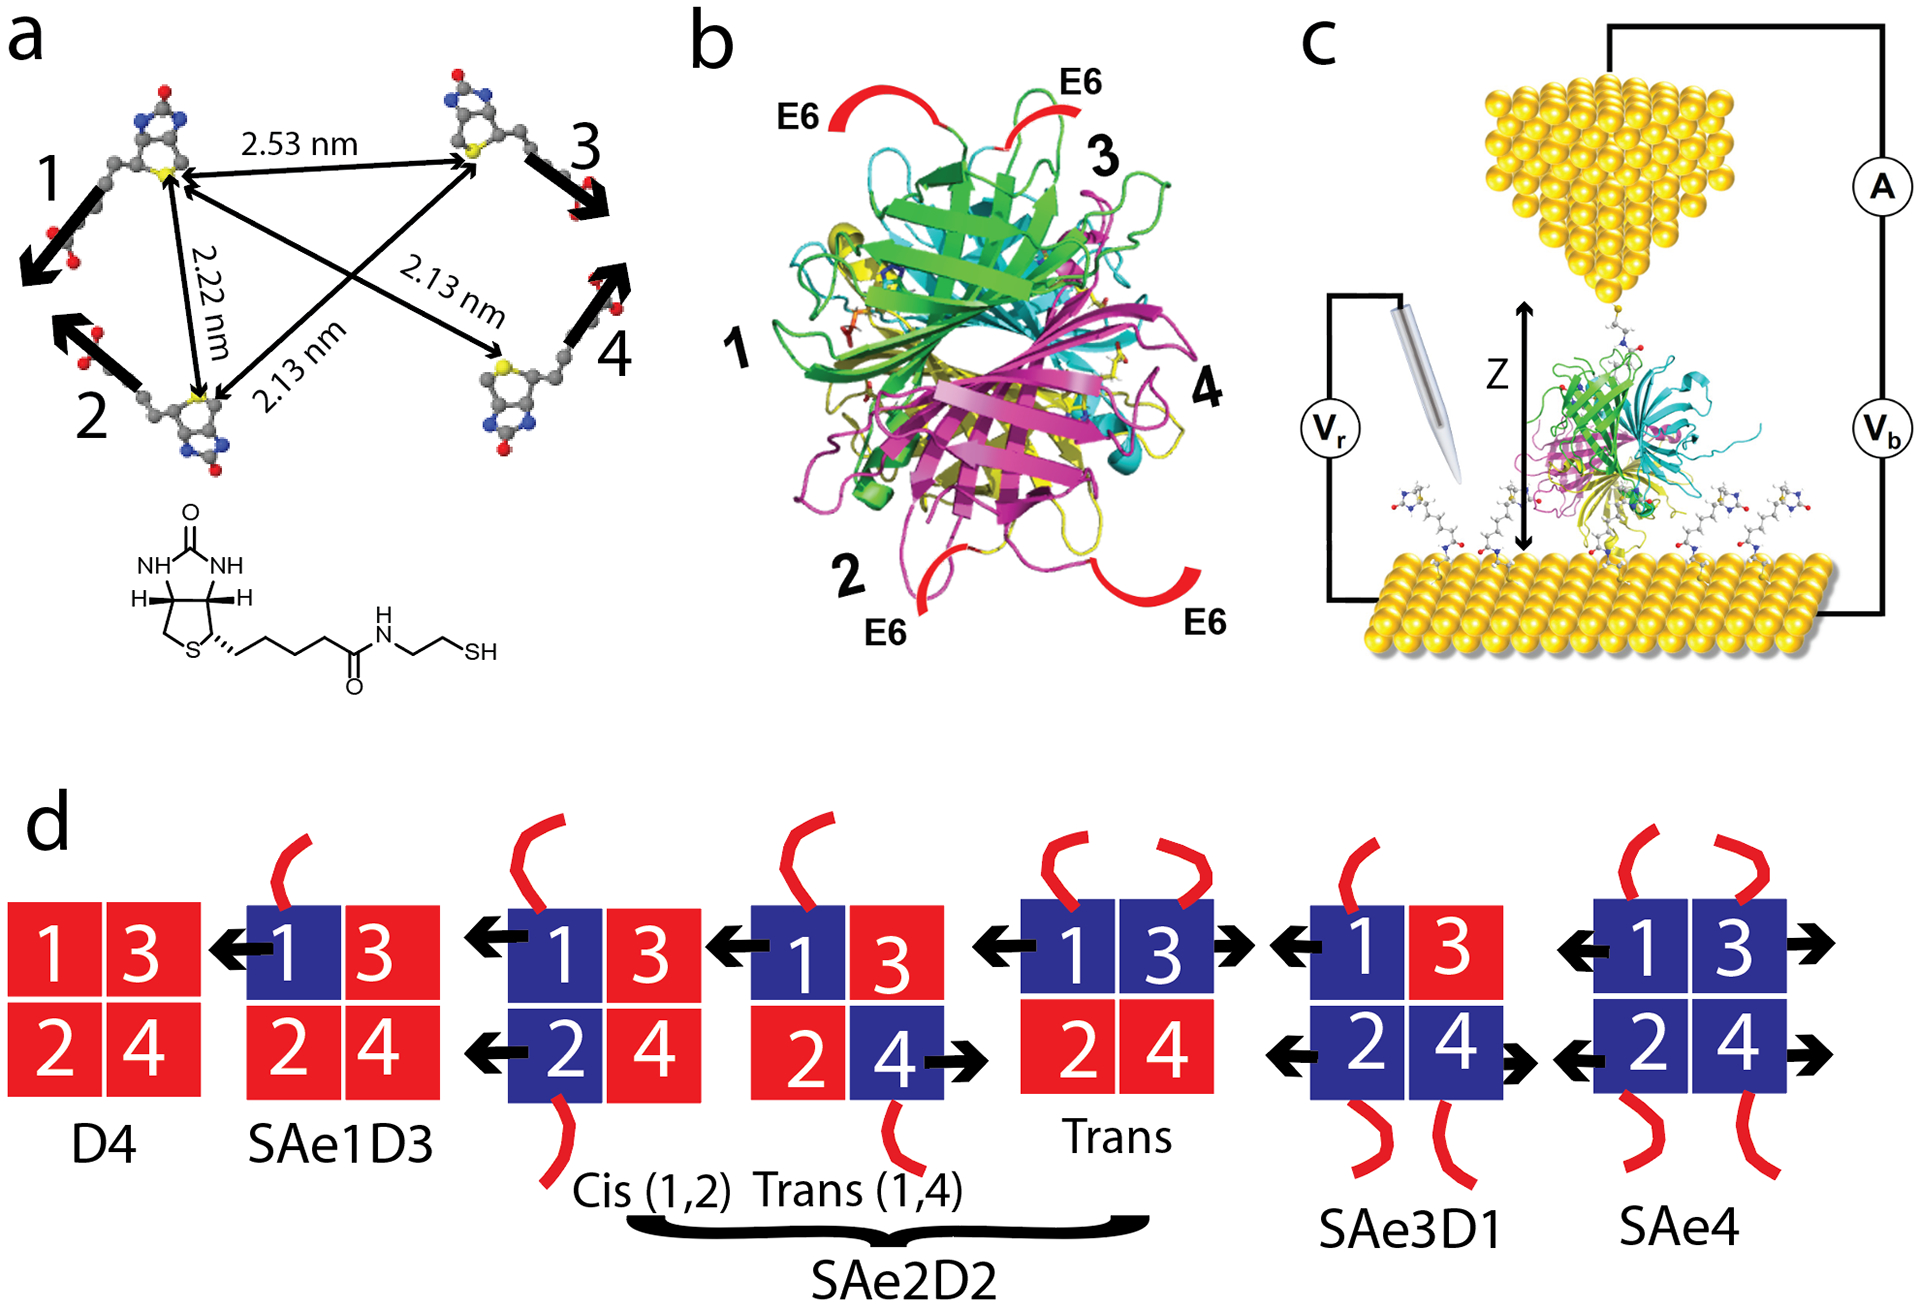
Streptavidin with a controlled ratio of live and dead units. (a) locations of the four biotins bound in the WT tetramer. Thick arrows mark the directions of the biotin connections (from RSC PDB 1STP - note that in this 2D projection, the lengths of the thin arrows marked with dimensions do not reflect true distances). The thio-biotin used in the present work is shown below. (b) Structure showing the subunits in different colors – the approximate locations of the hexaglutamate tails in the SAe4 molecule are shown by the red lines labeled E6. (c) Schematic of the electrochemical STM. Vb is the tip-substrate bias, Vr is the reference bias. (d) Compositions of the reconstituted tetramers. Red = dead monomers, blue = live monomers, arrows = biotin tails, red lines = E6 tails.
RESULTS AND DISCUSSION
Modified Streptavidin Tetramers
Figure 1a shows the arrangement of the four bound biotins in a tetravalent streptavidin tetramer (RSC PDB 1STP). Labeled distances are measured between the sulfur atoms of the four biotins. The thick arrows show the directions of the tails of the biotin ligands used to form the crystal (the thiolated biotin used as an electrical connecter in the present work is shown inset below).
Figure 1b shows the backbone structure of the tetramer in the same orientation as the ligands in 1a. Hexaglutamate tails (E6) are shown schematically on the four C termini (note that the crystal structure is truncated at residue 133, so residues 134–159 are missing here). The four monomers are labeled 1–4 to correspond to the four ligands in 1a (this presentation is rotated about the 1–4 axis relative to the presentation in the Fairhead paper13). The hexaglutamate tail exits the protein approximately normal to the biotin binding tails, and schematic representations of the arrangements of the reconstituted tetramers are shown in Figure 1d, where the black arrows represent the biotin tails and the red lines the hexaglutamate tags. Each of these tetramers is separable on an ion exchange column, with the exception of the 1,2 (Cis) and 1,4 (Trans) SAe2D2 tetramers which were prepared as a mixture.
Conductance Measurements
We used electrochemical scanning tunneling microscopy (STM – Figure 1c) to record the conductances of this series of streptavidin tetramers. The gap (Z in Figure 1c) was set to a fixed set point conductance (4 pA at 0.2 V, corresponding to a distance Z0 of approximately 2.5 nm14 though recent unpublished studies indicate that the setpoint gap me be larger when electrodes are coated with protein), and the probe then retracted by a fixed number of nm, waiting for a jump in current signaling that a protein has been caught between probe and substrate, and then recording up to 60 current-vs.-voltage curves in the minute for which the gap remained stable without servo control.1 For streptavidin alone, measurements were made at the set-point gap, Z0. There were essentially no contacts recorded at Z0+1 nm. For complexes bridged with polymerases, gaps were set to Z0+2 nm. We used Pd substrates and polyethylene-coated Pd probes, both of which were functionalized with the thiolated biotin molecule as inset under Figure 1a. The potential of the substrate was set to 0 V with respect to a salt-bridged Ag/AgCl reference electrode. Current-voltage curves were linear and reproducible on changing sweep direction (some examples are given in Figure S1). The slope of each curve yields a conductance for a particular molecule in a given contact geometry, and conductance histograms are compiled for many molecules of a given composition in Figure 2. Data for the SAe/D combinations are shown in panels a-e, and data for the WT streptavidin are shown in panel f.
Figure 2:
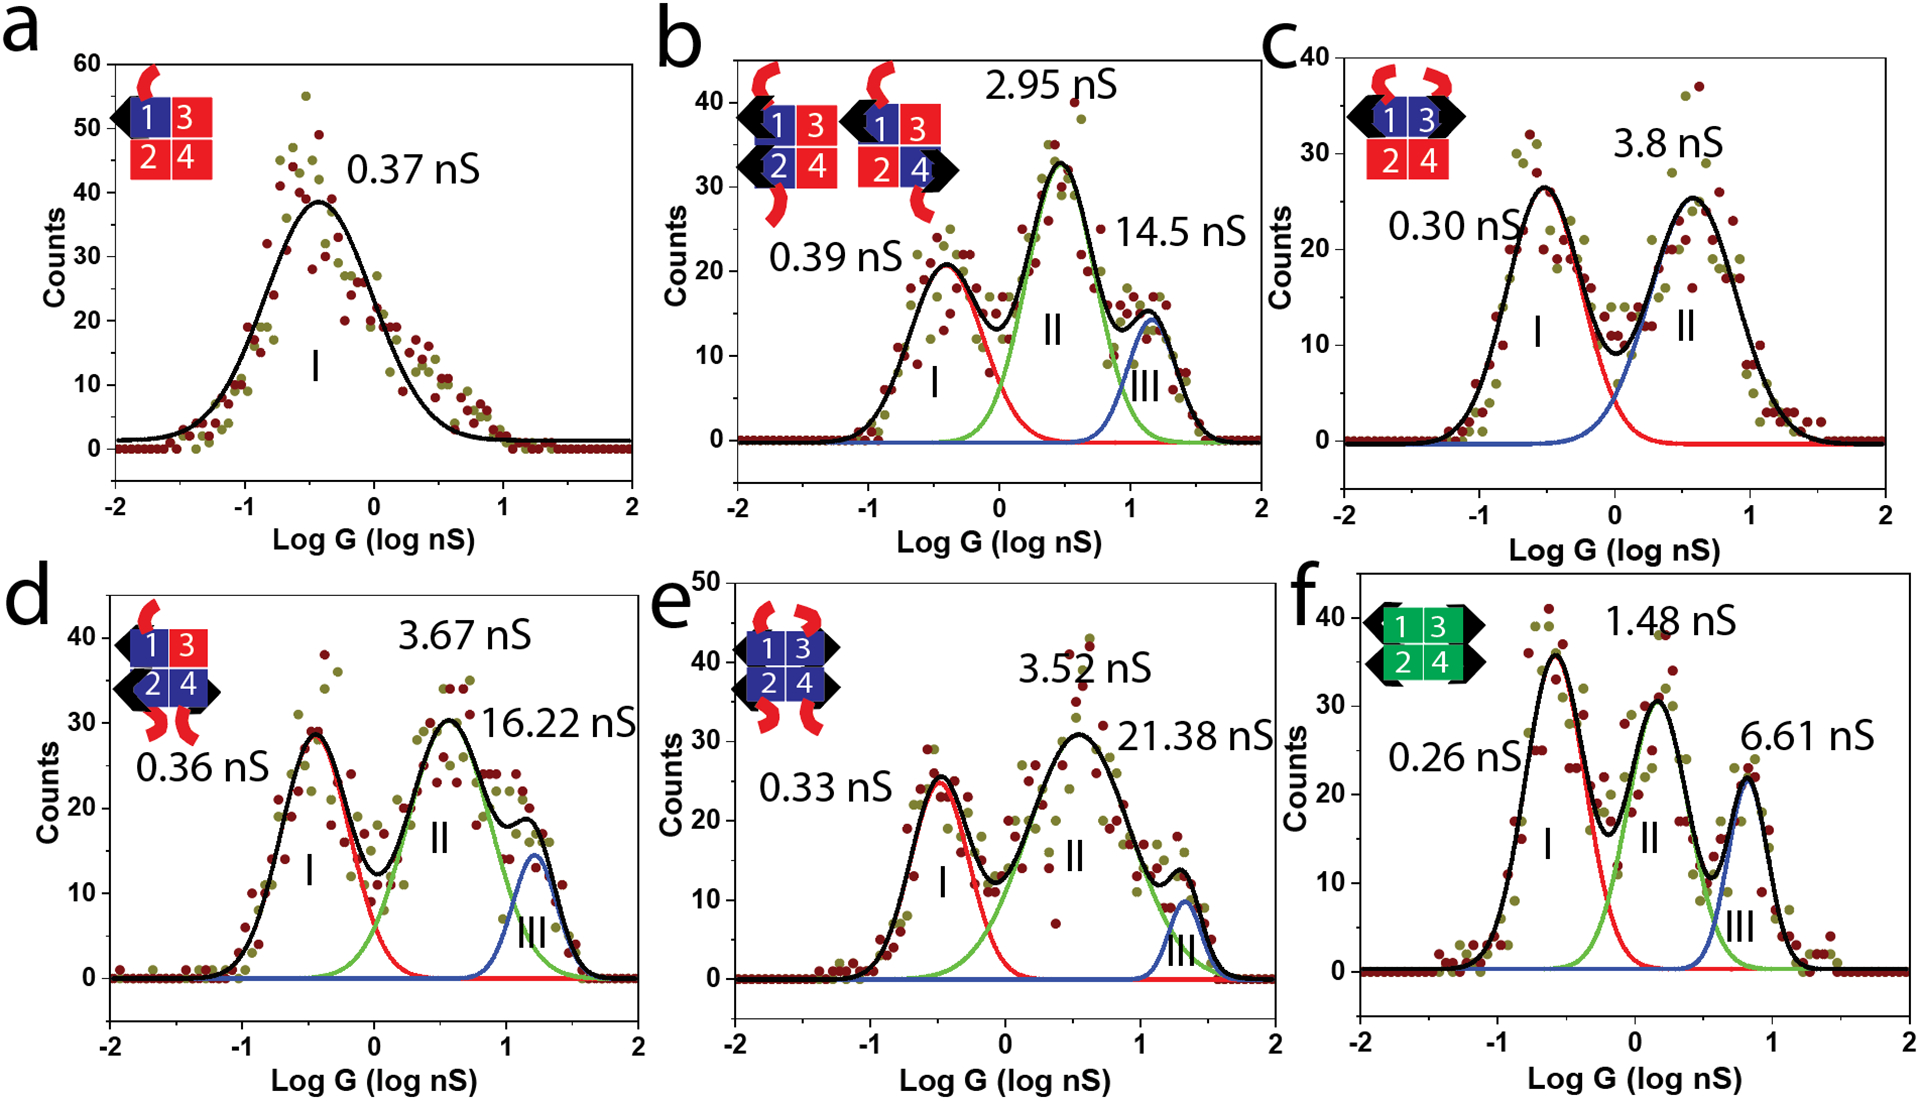
Measured distributions of conductance for (a) SAe1D1 (b) SAe2D2 1,2 and 1,4 mixture (c) SAe2D2 1,3 (d) SAe3D1 (e) SAe4 and (f) wild type streptavidin. Gray spots are from sweeping positive to negative, brown spots are from sweeping negative to positive. Colored curves are Gaussian fits to log of conductance. Black curves show the sum of the Gaussians.
The SAe1D3 distribution (a) shows one peak at about 0.3 nS, similar to results for other proteins connected by one specific chemical bond to one electrode and by a non-specific interaction to the second electrode1 so we conclude that the peaks labeled I in the remaining panels (b-f) result from singly chemically-connected molecules. The distribution for the SAe2D2 molecule in the 1,3 trans configuration (c) has two peaks, so the additional peak labeled II arises from doubly-connected molecules. The 1,2 and 1,4 mixture of SAe2D2 molecules has an additional peak (III). Since the distance between the biotin ligands is smaller for the 1,4 connection, we tentatively assign peak III to a 1,4 bridge and peak II to a 1,2 bridge. The SAe3D1 molecule has a distribution (d) that is similar to the 1,2 and 1,4 mixture suggesting that peak II is a 1,2 connection and peak III is a 1,4 connection. The distribution for the SAe4 (e) is again similar to that for the 1,2 and 1,4 mixtures and the SAe3D1 mutant. In this case, the 1,2 and 3,4 connections and the 1,4 and 3,2 connections have equivalent geometries, so the bonding possibilities give rise to a distribution that mirrors that for the 1,4 and 1,2 mixture (b).
There is an additional possibility which is that the molecules with 3 or 4 valencies could form additional contacts with the biotin-functionalized substrate, leading to additional peaks in the distribution, but these are not observed, presumably because of the steric constraints imposed by binding of the biotins to the metal electrodes.
One striking feature of the distributions is the large value of the highest conduction peak for the mutant streptavidins (b, d, e) compared to the highest peak (III) for the WT (with the exception of the SAe2D2 1,3 trans connection that lacks peak III). This is surprising because the only difference between SAe4 and the WT is the presence of the hexaglutamate chains. These chains are remote from the biotin binding sites and therefore might not be expected to influence conductance. However, we showed earlier that protein conductance is strongly dependent on electron energy as controlled by altering the surface potential (either by using different metals for the electrodes or operating under electrochemical potential control).7 Briefly, the potential change an electron experiences (on the NHE scale) in transiting from the interior of the metal to the molecule is, in the simplest model (described in ref7) just given by the rest potential expressed on the NHE scale. We have shown that the peak conductance of streptavidin occurs when this potential is about 300mV.7 Thus modifications of surface charge (i.e., rest potential) will lead to modifications of conductance. In order to test this mechanism, we measured the rest potential of Pd electrodes functionalized with thio-biotin and a monolayer of the various streptavidin molecules. The results are summarized in Table 1.
Table 1:
Rest potential and peak conductance values for the streptavidin molecules. Error bars in the conductance maxima are standard deviation (SD) in the fitted value of the Gaussian peaks for three repeats of the experiments. Error bars in rest potential values are SD of three repeated measurements. NHE is Normal Hydrogen Electrode.
| Molecule | Rest Potential (mV vs. NHE) | Conductance Peak I (nS) | Conductance Peak II (nS) | Conductance Peak III (nS) |
|---|---|---|---|---|
| SAe4 | 330.2 ± 1.9 | 0.33 ± 0.02 | 3.52 ± 0.16 | 21.38 ± 1.48 |
| SAe3D1 | 351.7 ± 1.7 | 0.36 ± 0.01 | 3.67 ± 0.17 | 16.22 ± 1.12 |
| SAe2D2 1,3 | 398.9 ± 0.7 | 0.30 ± 0.01 | 3.80 ± 0.09 | NA |
| SAe2D2 1,2 1,4 | 383.4 ± 0.9 | 0.39 ± 0.02 | 2.95 ± 0.07 | 14.45 ± 0.67 |
| SAe1D3 | 410.0 ± 0.4 | 0.37 ± 0.01 | NA | NA |
| WT | 458.3 ± 1.6 | 0.26 ± 0.01 | 1.48 ± 0.03 | 6.61 ± 0.19 |
These conductances are plotted vs. measured rest potential for the various molecules in Figure 3. The curves are the Lorentzian fits to the measured conductances for WT streptavidin as a function of surface potential for peaks II and III.7 Clearly the measured change in surface potential, and the corresponding shift in electron injection energy relative to the resonance peak, accounts for the effects of the hexaglutamate tails with no adjustable parameters. This shows how electrode metals far from the intrinsic resonance can be modified to increase overall conductance by introducing surface charges on the attached proteins.
Figure 3:
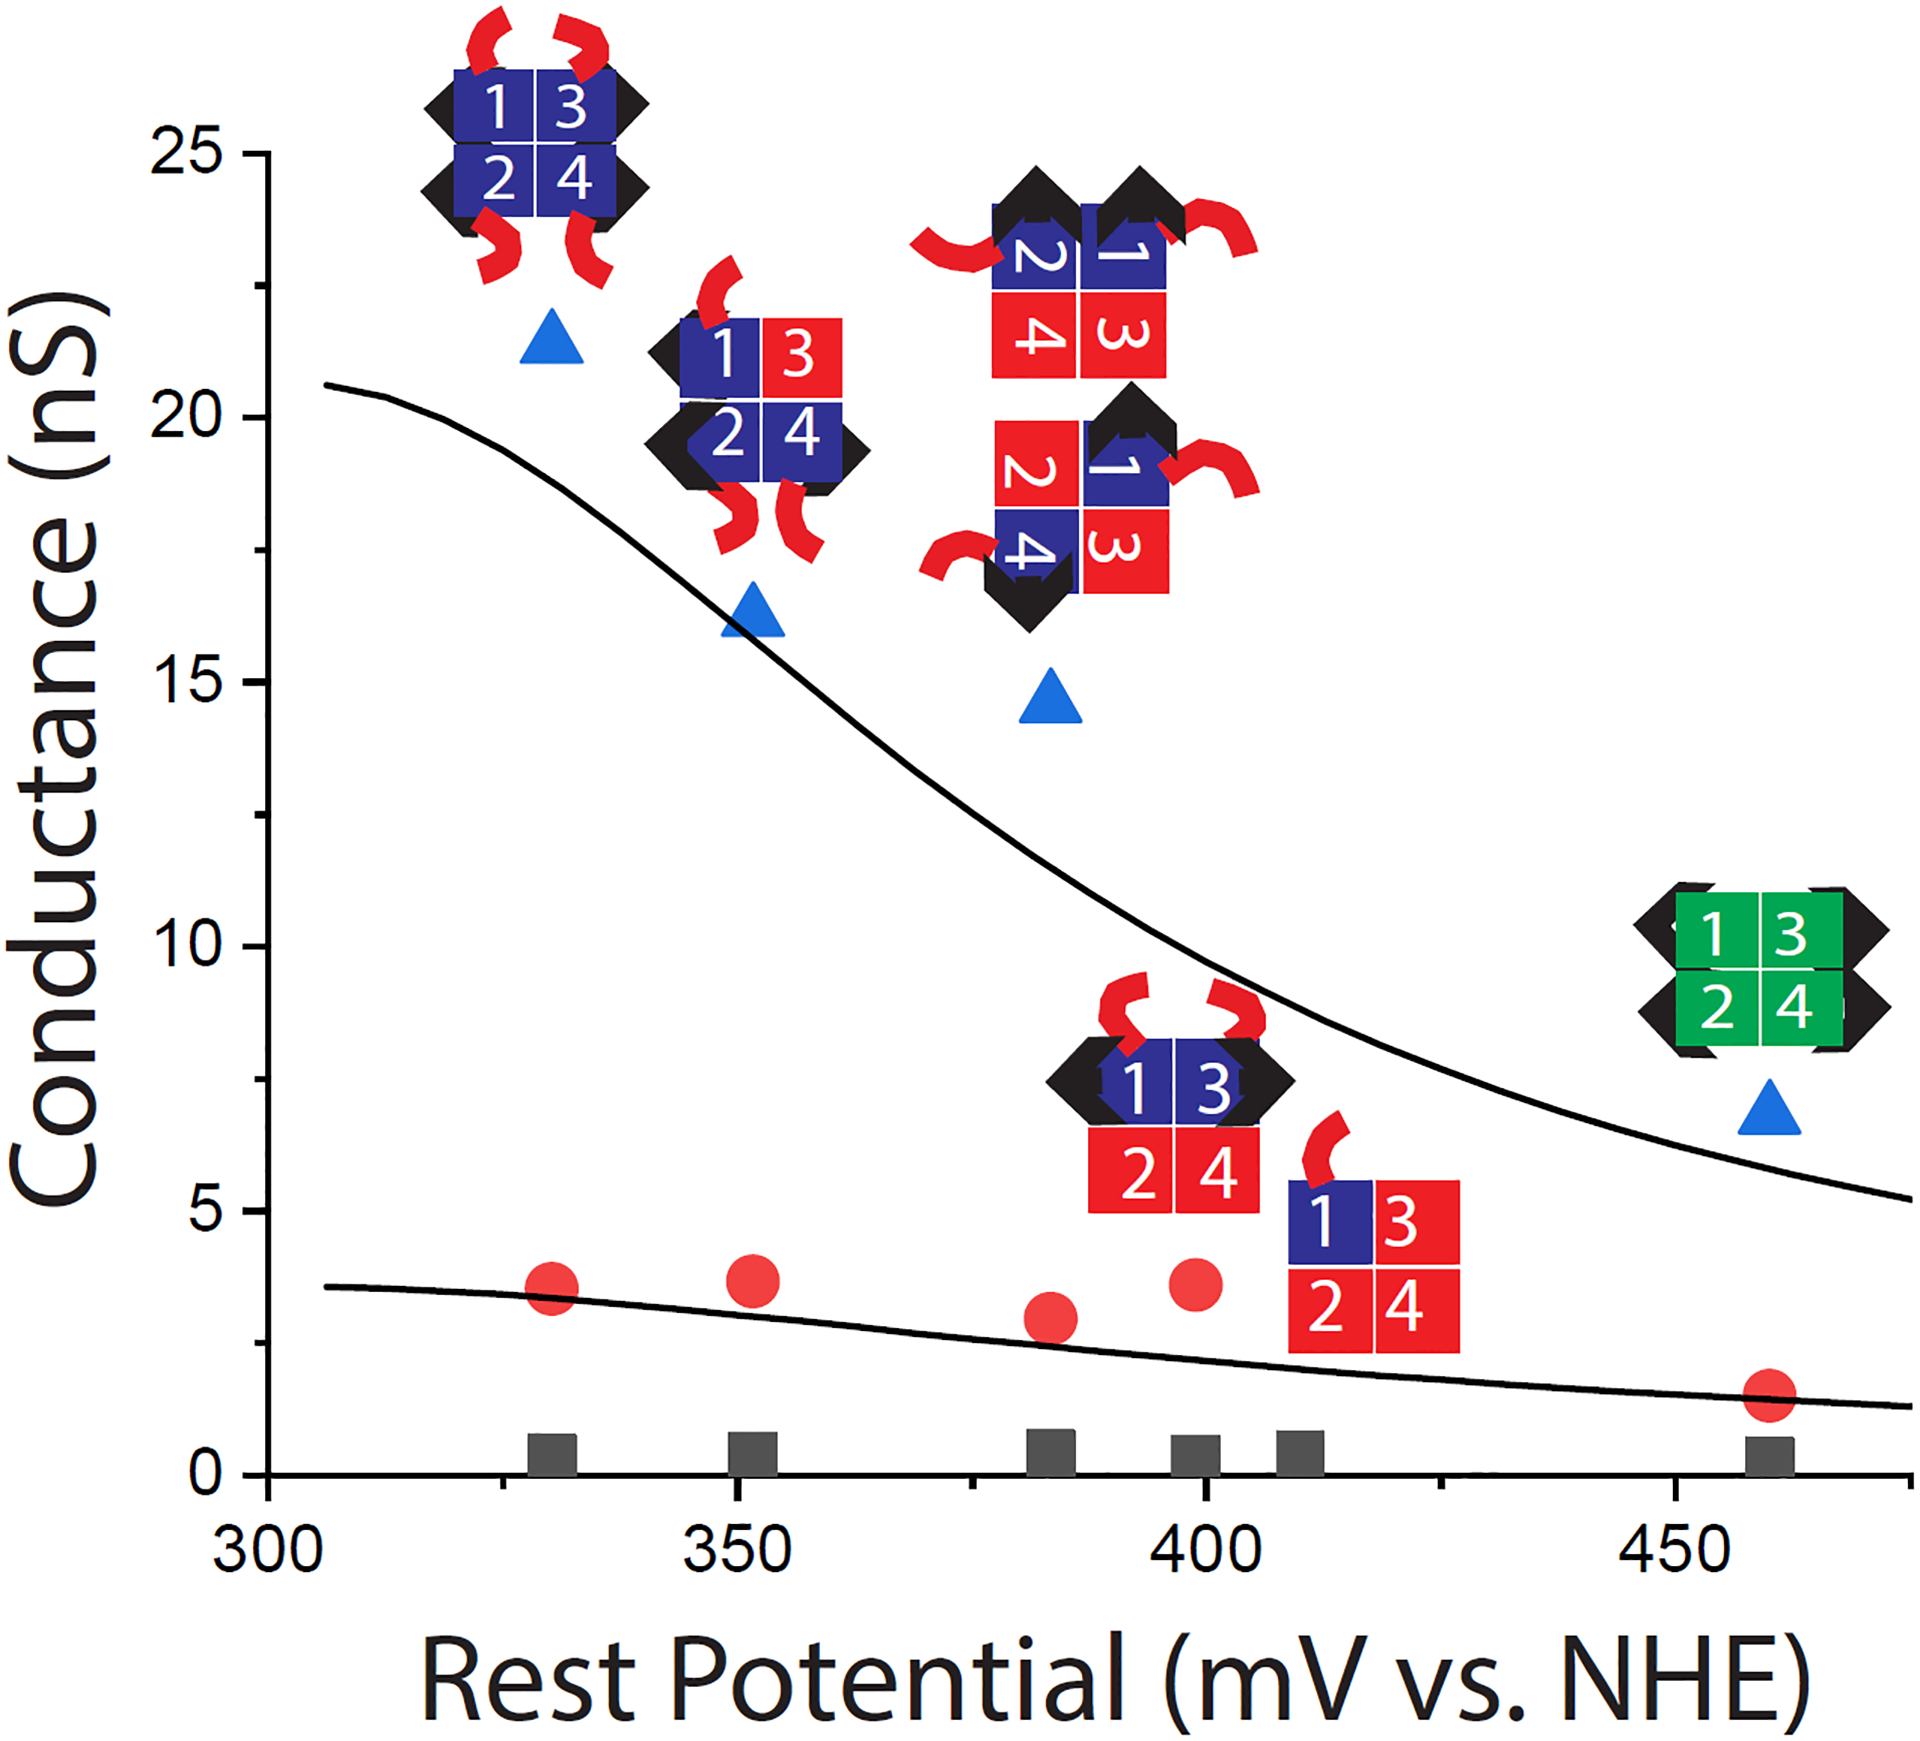
Conductance of the various tetramer compositions as a function of measured surface potential for – blue triangles, Peak III, red dots, Peak II and black squares, Peak 1. The lines are the Lorentzian curves fitted to data for WT streptavidin taken as a function of potential as reported in ref. 7. The conductance of the mutants (data points) fits these curves with no adjustable parameters when plotted vs. their measured rest potentials on the same reference scale.
Streptavidin as a bioelectronic connector
An important goal of this work is better understanding the role of streptavidin as a molecular wire and programable connector in bioelectronic circuits (our particular focus being the incorporation of a DNA polymerase into a bioelectronic circuit).8 The circuit is shown schematically in Figure 4a where wild type streptavidin (green) connects a doubly-biotinylated Φ29 polymerase to biotinylated electrodes. The conductance distribution measured at a ~4.5 nm gap is shown below, and it replicates our earlier published results, with three conductance peaks (0.22, 1.45 and 6.03 nS). Essentially no conductance is observed at all at this gap when the electrodes are coated with streptavidin but no biotinylated polymerase is present. Furthermore, the distributions are sensitive to the addition of dNTPs (deoxynucleotide triphosphates) to polymerases with primed templates, and large-amplitude telegraph noise is observed when the polymerase is activated (Figures S2 and S3) showing that the current path is through the polymerase. Based on the distributions shown in Figure 2, the 0.22 nS peak I in for the WT connectors (Figure 4a) corresponds to one specific contact via a bound biotin and a second, non-specific contact to some other point on the complex. Presumably, the high conductance peak (6.03 nS) reflects the formation of complexes connected by specific biotin-streptavidin binding at each of the electrodes. The origin of the middle peak (1.45 nS) is not clear, but one possibility is that it reflects a second type of bonding geometry for the tetravalent WT streptavidin. Panel b shows the distribution measured with the SAe2D2 1,3 molecule. Three peaks are also observed with this molecule with only one doubly-bonded geometry available, which therefore eliminates the possibility that the middle peak comes from some alternate streptavidin binding. It must be a feature associated with the presence of the polymerase in the gap. Comparing the distributions in Figure 2f (WT SA alone in the setpoint gap, Z0 of ~2.5 nm) and Figure 4a (WT SA bridged by Φ29 in a gap of Z0+2nm) shows that the conductance peaks are not changed dramatically in the two cases, emphasizing the point that the conductance of a complex is dictated largely by the limiting conductance of the contacts. The SAe2D2 1,3 molecule alone (Figure 2c) has about half the conductance of the WT (Figure 2f) for the largest peak. Correspondingly, the peak conductance in the distribution for Φ29 contacted by SAe2D2 1,3 (Figure 4b) is about half that of the polymerase contacted by WT streptavidins. The same effect is observed for Φ29 contacted by SAe4 (Figure 4c) where the highest conductance (peak III) is about double that of the complex connected by WT streptavidin, reflecting the increased conductance of the SAe4 alone (Figure 2e). The fact that the additional biotin binding sites in the WT and SAe4 do not lead to additional features in the conductance distributions when compared to the distribution for the SAe2D2 1,3 (Figure 4b) suggests that steric constraints in binding the bridging Φ29 limit the number of likely binding geometries.
Figure 4:
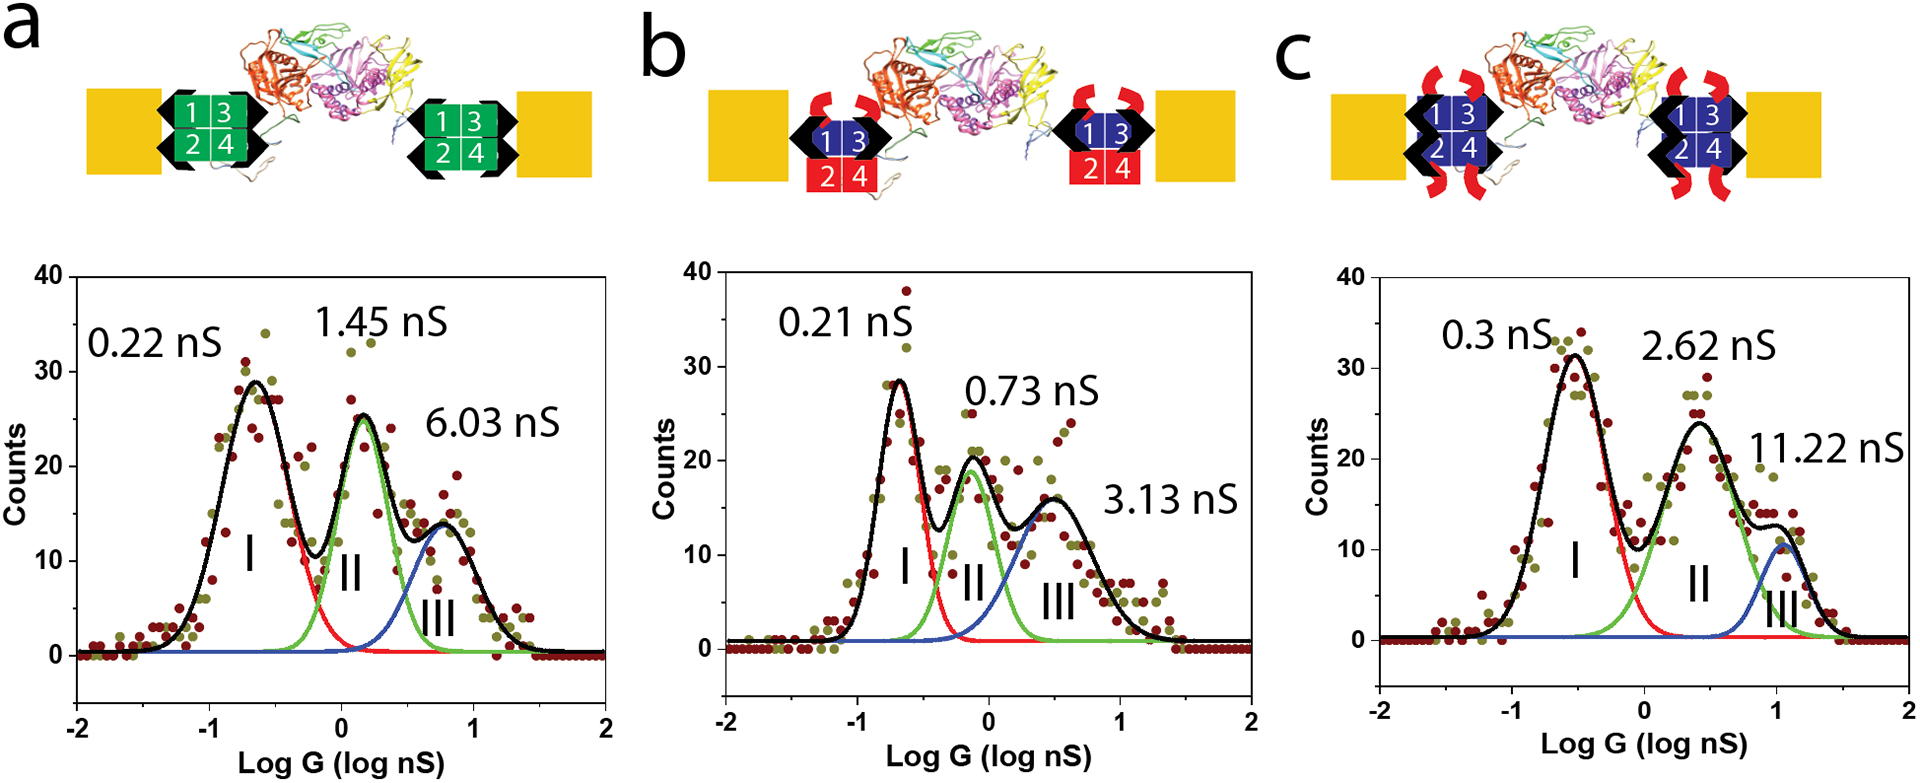
Conductance distributions measured for streptavidin functionalized electrodes bridged by a doubly-biotinylated Φ29 polymerase with (a) WT streptavidin (b) the SAe2D2 1,3 tetramer and (c) the SAe4 tetramer. The cartoon representations are a guide to the gap composition only. The actual structures are likely more compact.
The fact that contact conductance dominates the overall conductance in these much larger assemblies is likely a consequence of the very slow decay of conductance with distance in the interior of the proteins measured to date, coupled with the large charge injection barrier presented by the hydrated protein exterior.2, 3 Whatever the charge transfer process that underlies these very long decay lengths, it cannot apply in the region of the contacts, because of the sensitivity to local chemical geometry. If the difference between the conductance of the 1,4 and 1,3 contacts is a consequence of the different distances separating the ligands in the two cases (Figure 1a), it implies that the electronic decay length within the streptavidin is small. Specifically, the conductance changes from 14.5 nS to 3.8 nS as the interaction distance is increased from 2.13 to 2.53 nm. Assuming a dependence of the form G = G0 exp(−βz) leads to β = 3.4 nm−1, or a decay length of 0.3 nm. This much smaller length accords with known tunneling distances in proteins15 and is also characteristic of the measured decay in small hydrated peptides.3 Strepavidin’s small size and its solvent accessible ligand binding pockets12 may prevent the development of the states responsible for long-range conductance in larger proteins.
CONCLUSIONS
These results show how small changes in the contact chemistry dominate the overall conductance of even large inter-connected complexes and indicate that the electronic interaction length in the contact region is small (ca. 0.3 nm). While some of the binding modes of streptavidin have been identified (for example, the SAe2D2 1,3 offers only one possible bridging geometry) other features, such as the middle peak in the Φ29 distributions, remain unaccounted for. These results also demonstrate how modification of the electrode surface potential via charged residues on the protein contacts strongly modulates overall conductance, an effect quantitatively accounted for by the observed electronic resonance in conductance. This may be an important result for practical devices made using CMOS processes, where gold cannot be used. Metals with a much more positive surface potential will yield lower signals with given connection chemistry, but this loss might be readily offset by incorporating negatively charged residues in the contact region.
EXPERIMENTAL SECTION
Expression and Purification of Defined Valent Streptavidin Tetramers
Expression plasmids for hexaglutamate tagged Streptavidin (SAe) and Dead Streptavidin (D) were purchased through Addgene (plasmid #46367 & plasmid #20859). Plasmids were transformed into BL21 (DE3) pLysS for bacterial expression in E. Coli. Both expression and inclusion body purification were carried out following the detailed protocol from Howarth and Ting.16 Briefly, each variant was grown in 1L of LB medium at 37°C until an A600 of 0.8 was reached. Cultures were induced with 100 μg/mL isopropyl-β-D-thiogalactopyranoside at 37°C for 4 hrs. Cells were harvested via centrifugation and lysed through the use of a mixture of B-PER (Pierce), lysozyme (10 mg/mL), and DNaseI (10 μg/mL). Inclusion bodies were pelleted and washed thoroughly with inclusion wash buffer (100 mM NaCl, 50 mM Tris pH 8.0, 0.5% Triton X-100) before resuspension in 6 M guanidinium hydrochloride (pH 1.5). Concentrations of solubilized SAe and D streptavidin were estimated via A280 and combined in a 1:1 ratio. A mixed resuspension of SAe/D streptavidin was rapidly refolded in 250 mL of PBS dropwise from a 50 mL Burette with a controlled flow rate of ~1 drop/min. Following overnight stirring, the refolded protein was salted out using ammonium sulfate to remove unfolded proteins, contaminants, and to concentrate the refolded product. Purification of refolded SAe/D tetramers was first carried out via an initial 5 mL iminobiotin-sepharose gravity column. Proteins were loaded onto the resin using a 50 mM sodium borate, 300 mM NaCl, pH11.0 binding buffer, followed by elution with 20 mM KH2PO4, pH 2.2 buffer. Separation of the different SAe/D tetramer populations was accomplished using a 5 mL HiTrap Q column (GE) with 20 mM Tris buffers and salt gradient of 0.1M – 0.5 M. All purification steps were adapted from Fairhead et al.13 The stability of these proteins in the low salt buffer used for conductance measurements was checked using circular dichroism measurements over the ~1 h duration of the experimental measurement.
Production of Biotinylated Φ29 Polymerase
The open reading frame of Φ29 Polymerase was cloned into the pET-15b expression vector for bacterial expression. Site specific biotinylation was achieved via addition of Avi-Tag in the N-terminus, just after a 6XHis-tag, and incorporation of p-azido-L-phenylalanine (pAZF) through an amber stop codon. A Φ29 polymerase containing an amber codon at position W274 was used for the incorporation of pAZF as outlined by Chin et al.17 Briefly, the W274 amber codon Φ29 in pET-15b was co-transformed with the pEVOL-pAzF plasmid (Addgene plasmid #31186) into BL21 (DE3) competent cells and expressed. Purification of the expressed Φ29 Polymerase was accomplished via a 5 mL HisTrap column (GE), followed by secondary purification with a 5 mL HiTrap SP column (GE). The first biotinylation event was carried out through copper-free click reaction between pAZF in the mutant Φ29 Polymerase and biotin-PEG4-DBCO (Click Chemistry Tools). Singly biotinylated Φ29 Polymerase was separated from non-biotinylated protein using a monomeric avidin agarose resin (Pierce). Next, biotinylated Φ29 Polymerase was dually biotinylated using commercially available BirA ligase (Avidity) that specifically biotinylated the Avi-Tag. Biotinylation efficiency was checked following streptavidin reaction via molecular weight shift on SDS-PAGE.
STM Conductance Measurements
200 nm of Pd were deposited onto a 10 nm Cr adhesion layer on four inch p-type Si wafers using an e-beam evaporator (Lesker PVD 75), and functionalized as previously described.1, 8 High density polyethylene-coated Pd probes were prepared as described previously.1, 18 Probes were selected for leakage current < 1pA in the working buffer. This current is at the noise floor of the transconductance amplifier. Conductance measurements were made in 1 mM phosphate buffer, pH 7.4, using a PicoSPM (Agilent) following the procedure described elsewhere.1 Briefly, once the gap is set at a bias of −200mV and servo control disabled, the bias is held constant until the current exceeds a threshold indicating that a protein is trapped, at which point the voltage sweep is started automatically by a Labview program. An example of a raw data trace taken over 120s is given in Figure S5. The mechanical stability of the junction is tested by returning the probe to the original set-point position without servo control and measuring the current. With adequate stabilization of the microscope, the current is within 20% of the initial set point (see Figure S2 of ref.1). Samples and solutions were prepared as described earlier for biotin-streptavidin1 and the biotin-streptavidin-polymerase Ф29 system, using a doubly-biotinylated engineered polymerase.8 The preparation of all solutions, and characterization of substrate surfaces is also described in these earlier publications. An example of control data obtained at the ~4.5 nm gap with both electrodes functionalized with streptavidin, but minus polymerase is given in Figure S6. Protein coverage of the electrode surface is complete enough to passivate macroscopic electrodes as shown in Figure S11 of ref.8. FTIR spectra taken from functionalized Pd substrates are given in Figure S4. All conductance measurements were repeated three times on independent samples using newly fabricated STM probes and quoted values for conductance peak values are given by the mean of the three data sets with the quoted errors representing the standard deviation.
For the electrochemical measurements, a salt-bridged reference electrode was constructed as described previously1 using 3M KCl for the rest potential measurements (210 mV on the NHE scale) and 10 mM KCl for the conductance measurements (360 mV on the NHE scale). Rest potentials were measured with a Fluke 177 meter (input impedance > 107Ω) and potentials were stable to within ±5 mV over a period of hours. Sample to sample variation was ±5%.
Supplementary Material
ACKNOWLEDGMENTS
This work was supported by grant 1R01HG011079 from the National Human Genome Research Institute, a sponsored research agreement from Recognition AnalytiX Corp, grant W911NF2010320 from the US Army and the Edward and Nadine Carson Endowment.
Footnotes
SUPPORTING INFORMATION: Examples of current vs. voltage curves, conductance distributions for primed Φ29 polymerase before and after activation by nucleotide triphosphates, current vs. time trace showing current fluctuations induced by polymerase activity, FTIR spectra demonstrating biotinylation of the electrode surface. The Supporting Information is available free of charge on the ACS Publications website.
SL is a cofounder of a company with interests in this the subject matter of the present paper. SL, BZ and ER are named as co-inventors on patent applications.
References
- 1.Zhang B; Song W; Pang P; Lai H; Chen Q; Zhang P; Lindsay S, The Role of Contacts in Long-Range Protein Conductance. Proc Natl Acad Sci U S A 2019, 116, 5886–5891. [DOI] [PMC free article] [PubMed] [Google Scholar]
- 2.Zhang B; Lindsay S, Electronic Decay Length in a Protein Molecule. Nano letters 2019, 19, 4017–4022. [DOI] [PMC free article] [PubMed] [Google Scholar]
- 3.Lindsay S, Ubiquitous Electron Transport in non-Electron Transfer Proteins. Life 2020, 10, 72. [DOI] [PMC free article] [PubMed] [Google Scholar]
- 4.Giese B; Spichty M, Long distance charge transport through DNA: quantification and extension of the hopping model. Chemphyschem 2000, 1 (4), 195–8. [DOI] [PubMed] [Google Scholar]
- 5.Giese B; Amaudrut J; Kohler AK; Spormann M; Wessely S, Direct observation of hole transfer through DNA by hopping between adenine bases and by tunnelling. Nature 2001, 412 (6844), 318–20. [DOI] [PubMed] [Google Scholar]
- 6.Aubert C; Vos MH; Mathis P; Eker AP; Brettel K, Intraprotein radical transfer during photoactivation of DNA photolyase. Nature 2000, 405 (6786), 586–90. [DOI] [PubMed] [Google Scholar]
- 7.Zhang B; Song W; Brown J; Nemanich R; Lindsay S, Electronic Conductance Resonance in Non-Redox-Active Proteins. Journal of the American Chemical Society 2020, 142 (13), 6432–6438. [DOI] [PMC free article] [PubMed] [Google Scholar]
- 8.Zhang B; Deng H; Mukherjee S; Song W; Wang X; Lindsay S, Engineering an Enzyme for Direct Electrical Monitoring of Activity. ACS Nano 2020, 14, 1630–1638. [DOI] [PMC free article] [PubMed] [Google Scholar]
- 9.Green NM, Avidin and streptavidin. Methods Enzymol 1990, 184, 51–67. [DOI] [PubMed] [Google Scholar]
- 10.Sinclair JC; Davies KM; Venien-Bryan C; Noble ME, Generation of protein lattices by fusing proteins with matching rotational symmetry. Nat Nanotechnol 2011, 6 (9), 558–62. [DOI] [PubMed] [Google Scholar]
- 11.Sano T; Vajda S; Smith CL; Cantor CR, Engineering subunit association of multisubunit proteins: a dimeric streptavidin. Proc Natl Acad Sci U S A 1997, 94 (12), 6153–8. [DOI] [PMC free article] [PubMed] [Google Scholar]
- 12.Liu F; Zhang JZH; Mei Y, The origin of the cooperativity in the streptavidin-biotin system: A computational investigation through molecular dynamics simulations. Scientific Reports 2016, 6 (1), 27190. [DOI] [PMC free article] [PubMed] [Google Scholar]
- 13.Fairhead M; Krndija D; Lowe ED; Howarth M, Plug-and-play pairing via defined divalent streptavidins. J Mol Biol 2014, 426 (1), 199–214. [DOI] [PMC free article] [PubMed] [Google Scholar]
- 14.Chang S; He J; Zhang P; Gyarfas B; Lindsay S, Gap distance and interactions in a molecular tunnel junction. Journal of the American Chemical Society 2011, 133 (36), 14267–9. [DOI] [PMC free article] [PubMed] [Google Scholar]
- 15.Gray HB; Winkler JR, Electron tunneling through proteins. Quarterly Reviews of Biophysics 2003, 36 (3), 341–372. [DOI] [PubMed] [Google Scholar]
- 16.Howarth M; Ting AY, Imaging proteins in live mammalian cells with biotin ligase and monovalent streptavidin. Nat Protoc 2008, 3 (3), 534–45. [DOI] [PMC free article] [PubMed] [Google Scholar]
- 17.Chin JW; Santoro SW; Martin AB; King DS; Wang L; Schultz PG, Addition of p-azido-L-phenylalanine to the genetic code of Escherichia coli. Journal of the American Chemical Society 2002, 124 (31), 9026–7. [DOI] [PubMed] [Google Scholar]
- 18.Tuchband M; He J; Huang S; Lindsay S, Insulated gold scanning tunneling microscopy probes for recognition tunneling in an aqueous environment. Rev Sci Instrum 2012, 83 (1), 015102. [DOI] [PMC free article] [PubMed] [Google Scholar]
Associated Data
This section collects any data citations, data availability statements, or supplementary materials included in this article.