

Abstract
Superoxide Dismutase SODs are defense associated proteins that detoxify ROS and primarily serve as scavengers. They have been described in numerous plant species, but their in-depth characterization in Brassica rapa has not been reported. Therefore, the present investigation on genome wide study of SOD gene family was conducted to identify BrSOD genes, their domain-based organization, gene structure analysis, phylogenetic analysis, intron-exon structure of genes and expression analysis. The sequence characterization of Super oxide dismutase gene family in Brassica rapa, their syntenic associateship of conserved motifs and phylogenetic correlationship, prediction of cis-elements and determing the expression analysis in distinct tissues namely plant callus, root, stem, leaf, flower, and silique under abiotic conditions have been analysed using different software’s. The study on SOD gene family identified 17 BrSOD genes which were grouped into eight BrCu-ZnSODs and nine BrFe-MnSODs domain-based organization. Furthermore, the conserved character of BrSODs were confirmed by intron-exon organisation, motif arrangements and domain architectural investigations. Expression analysis using RNA Sequence data of different developmental stages proclaimed that genes were manifested in all six tissues with an exception of BrCu-ZnSOD3, which was not manifested in roots; however, whose transcript was detected in all other tested tissues. The study has genome wide insight into the occurrence and functional specifications of BrSOD gene family in Brassica rapa that can be potentially utilized in breeding program for resilience to climate change and abiotic stresses tolerance Brassica variety.
Keyword: Genome-wide analysis, Brassica rapa, Superoxide dismutase, Gene family, In-silico analysis, Reactive oxygen species
1. Introduction
The reactive oxygen species (ROS) are natural by-products of the normal oxygen metabolism and are produced in both unstressed and stressed cells (Behera et al., 2020). The protein oxidation, membrane damage, DNA lesions and irretrievable metabolic malfunction and apotopsis can appear as a consequence of unrestricted ROS like superoxide anions, hydroxyl radicals, hydrogen peroxide, and singlet oxygen. The plants have well established defence systems against these reactive O2 species (ROS), involving both restraining the formation of ROS as well as its expulsion. Among the various antioxidants within a cell, the super oxide dismutase’s (SODs) are censorious antioxidant enzymes that defend organisms from ROS. SODs account for the primary defence against ROS by catalysing the dismutation of the superoxide O2− to O2 and H2O2, thereby playing a significant role in the growth and development during stress or adverse conditions. Moreover, H2O2 is a scathing component of stress response regulation in various crop plants species such as rice (Sohag et al., 2020), wheat (Habib et al., 2020) maize (Terzi et al., 2014), basil (Gohari et al., 2020), and rapeseed (Hasanuzzaman et al., 2017).
Plants have various SOD isozymes according to several research reports, which are grouped as copper/zinc (Cu/Zn-) SOD, manganese (Mn-) SOD, or iron (Fe-) SOD, identified on the basis of metal cofactor, protein folds, and subcellular localization (Moucheshi et al., 2021). These SODs are found in various cell compartments and these SODs are found in various cell compartments (Alscher et al., 2002, Molina et al., 2013, Alscher et al., 2002, Filiz et al., 2014, Feng et al., 2015). Cu/Zn-SODs are confined in the chloroplasts, cytoplasm, peroxisomes, or extracellular space; however, Fe-SODs are mostly found in peroxisomes, chloroplasts, and mitochondria. Mn-SODs, on the other hand, are mostly found not only in the mitochondria but also in various forms of peroxisomes (Wang et al., 2016a). Superoxide dismutases (SODs) are key antioxidant enzymes that can detoxify the superoxide radicals generated by various stresses. (Ji et al., 2021). Recent reports have revealed that under various environmental stress conditions, SODs can cushion plants against biotic and abiotic stresses such as drought, cold, heat, salinity, ethylene and abscisic acid (Pilon et al., 2011, Asensio et al., 2012, Feng et al., 2015). Drought causes stomatal closure, decreased CO2 entry, and a reduction in photosynthetic rate, besides causes disproportion in light harvest and transformed photochemistry in chloroplasts, which results in ROS overproduction (Hasanuzzaman et al., 2019, Hasanuzzaman et al., 2020). Furthermore, SODs control cellular processes such as mitosis, cell elongation and senescence, which are important for plant growth and development, besides protecting components of cell from desecration. SODs have been explored and identified in roots, leaves, fruits, and seeds in plants (Giannopolitis and Ries, 1977, Tepperman and Dunsmuir, 1990), where they provide basic defence to cells contrary to oxidative stress.
The SOD multigene family were studied extensively in a number of plant species including Arabidopsis thaliana (Kliebenstein et al.,1998), Lotus japonicus (Rubio et al., 2007), Gossypium hirsutum (Kim et al., 2008), Nelumbo nucifera (Dong et al., 2011), Haberlea rhodopensis (Apostolova et al., 2012), Dimocarpus longan (Lin and Lai, 2013), Musa acuminata (Feng et al., 2015), Sorghum bicolor (Filiz and Tombuloğlu, 2015), G. raimondii and G. arboreum (Wang et al., 2016b), Solanum lycopersicum (Feng et al., 2016), Gossypium hirsutum (Wang et al., 2017), Triticum aestivum (Tyagi et al., 2017, Jiang et al., 2019), Vitis vinifera (Hu et al., 2019), Larix kaempferi (Han et al., 2019), Oryza sativa (Sandeep et al., 2019), however SOD gene family have not been extensively characterized in Brassica rapa. The present investigation was therefore carried out with an objective to undertake thorough genome-wide analysis of SOD gene family in Brassica rapa. During the course of this investigation an attempt was made to elucidate the diverse physiochemical properties, protein structure and cis-regulatory elements of SOD genes. The significance, functioning, and evolutionary relationships of the SODs gene family, as well as their plant developmental expression patterns in distinct Brassica rapa tissues, were investigated. A set of analogical approaches were employed to identify and characterise the identified genes in Brassica rapa based on structural heterogeneity of SOD genes and their wide occurrence across the genome.
2. Materials and methods
Hidden Markov Model (HMM) concept was utilized to identify the SOD genes and to ascertain their chromosomal distribution as represented by profile HMMs. These models have also been used in a variety of other computational biology applications, such as gene discovery and the development of genetic linkage maps and physical maps. HMM is a mathematical model for describing the evolution of observable event that are determined by internal, non-observable influences. The perceived event is called “symbol” and the unseen factor that underpins the observation is a “state”. As a result, HMM consists of two stochastic processes: a hidden state process that is invisible and a transparent symbol process that is visible. The hidden states configure a Markov Chain, and the observed symbol's probability distribution is determined by the underlying state. The hidden states form a Markov Chain and the probability distribution of the observed symbol depends on the underlying state.
The five key components of a hidden Markov model are as follows:
Q = the set of states = {q1, q2… qn}
V = the output alphabet = {v1, v2,.., vn }
π(i) = probability of being in state qi at time t = 0| i.e initial state
A = transition probabilities = {aij}
Where, aij = Pr [entering state qj at time t + 1| in state qi at time t].
It's worth noting that the likelihood of moving from state I to state j is independent of preceding states. This is known as the Markov property.
B = output probabilities = {bj(k)}
Where bj(k) = Pr[Producing vk at time t | in state qj at time t]
Profile Hidden Markov Models, Paired Hidden Markov Models, and context sensitive HMMs are three types of HMM variants that are utilized for various sequence analysis. Profile HMMs are HMMs that are constructed using multiple sequence alignment of proteins or DNA sequences. The frequent patterns, motifs, and other statistical features in the alignment are efficiently represented by these HMMs. Profile HMMs have a left-to-right structure that is completely linear and devoid of cycles. To describe position precise symbol frequencies, symbol insertions, and symbol deletions, a profile HMM uses three types of hidden states: match statesMk, insert states Ik, and delete states Dk.
2.1. Identification of Brassica SOD gene family
In-silico procedural bioinformatics pipelines were used in the identification process of Brassica SOD genes as reported and followed in other crops where genomes have been sequenced, annotated and available in public database domains. Libraries consisting of large number of profile HMMs for studied sequence families have been compiled for numerous protein families including the PROSITE and Pfam databases. A given profile HMM depicts a biological sequence family, and it is used to explore a sequence database for more homologues from the same family. In a similar fashion, database of pre-built profile HMMs is used under query sequence search engine for identifying matching profiles e.g. we can discover and characterise a new protein sequence with any of the known protein domains by querying it against Pfam or PROSITE. Following the analogy, the Cu-ZnSOD (pfam 00080) and Fe-MnSODs (pfam 00081 & pfam 02777) HMM profiles were acquired from the pfam database (ftp: /ftp. sanger. ac. uk/pub/databases/ Pfam) and searched against the Brassica rapa protein model sequences at the e-value 0.00001[18]. Following identification, a BLAST search against the Brassica rapa sequences retrieved from http://www.plants.ensembl.org/Brassica was used to find the poistioning of the Brassica SOD genes on the chromosome. The chromosomal mapping of BrCu-ZnSOD and BrFe-MnSODs genes and their distribution across Brassica rapa genome was performed using MapInspect tool (Hu et al., 2016).
2.2. Sub-cellular localization, conserved motif and gene structure analysis
Pipelines for diverse genome analysis were used to obtain information about the sub-celluar localization of SOD genes that were identified in Brassica rapa. These include the TargetP1.1 (www.cbs.dtu.dtk/services/TargetP/); CELLOv.2.5 (http://cello.life.nctu.edu.tw/); ChloroP1.1 (http://www.cbs.dtu.dk/services/); and Wolf P Sort (http://wolfpsort.hgc.jp) were used for general subcellular localization prediction of BrCu-ZnSOD and BrFe-MnSOD genes. The conserved domains and motifs were detected using Multiple Expectation Maximization for Motif Elicitation (MEME) program (http://meme-suite.org/index.html). The number of motifs was kept at ten, while as the minimum widths were kept to 20 and maximum motif widths at 150, respectively for data analysis (Bailey et al, 2009).
Summing the hydropathy values of each amino acid residue resulted in the grand average of hydropath city index (GRAVY value) for a protein (Kyte and Dolittle, 1982) and dividing by the extent length of the sequence or the no. of residues present in the sequence as derived and described on www.bioinformatics.org/protein_gravy.html. The exon and intron structures of BrCu-ZnSOD and BrFe-MnSOD genes were analyzed through online software Gene Structure Display Server (http://gsds.cbi.pku.edu.cn/) [Guo et al., 2007, Hu et al., 2015]
2.3. Phylogenetic analysis
In order to investigate evulutionary relationship between SOD genes in Brassica rapa, Brassica napus, Brassica oleraceae, Triticum aestivum, Oryza sativum and Arabidopsis thaliana, SODs were searched to conduct phylogenetic studies and their full length coding sequences of the genes were downloaded from http://plants.ensembl.org. These multiple sequence alignments were harnessed for ensuing molecular biology analyses. The maximum likelihood approach of the MEGA-X software was used to create phylogenetic trees employing Poisson model and bootstrap analysis with 1000 replicates using SOD protein sequences (https://www.megasoftware.net) [(Tamura et al., 2011, Filiz et al., 2014), while following default settings for other parameters. Molecular graphical programme of PyMol was used for visualization and development of structure of BrCu-ZnSOD and BrFe-MnSOD proteins.
2.4. Cis-regulatory element analysis
CREs (cis-regulatory elements) regulate transcription by acting near or within a gene. Enhancers and promoters are the two groups of CREs which have been well characterized and studied. Both of these sequence elements are structural regions of DNA which function as transcriptional regulators. The cis-elements in promoter of each BrCu-ZnSOD and BrFe-MnSOD were scanned using PlantCARE server (Postel et al., 2002). The 1500 bp upstream sequence from the translation start site was retrieved using a typical process that includes aligning genomic sequences with coding sequences in most of the genes; however, due to the lack of complete genomic data, less than 1500 bp were retrieved in certain cases. The PlantCARE database was then used to forecast regulatory elements. (https://plantcare/html/).
2.5. Analysis of protein interaction
The apparent physical protein-protein interaction of BrCu-ZnSOD with BrFe-MnSOD was estimated utilizing STRING v9.0 tool (http://string-db.org/) [Franceschini et al., 2013]. These protein–protein interactions are assumed to have arrived independently of the gene context methods as used by STRING with the aim to identify potential interacting proteins.
2.6. Expression profile of BrSODs in different tissues
The expression level of all SOD genes viz BrCu-ZnSOD and BrFe-MnSOD genes were assessed using High-throughput RNA sequence data of Brassica rapa from different developmental tissues at various stages (roots, stems, leaves, spikes, and grain) using Expression Atlas – EMBL-EB. The expression values were calculated using 3′s RSEM (RNA-Seq by Expectation Maximization) method in FPKM (Fragments per kilobase of transcript per million fragments mapped) utilizing software Trinity V2.0. The heat maps were made using Hierarchical Clustering Explorer 3.5 Hierarchical (http://www.cs.umd.edu/hcil.hce), which analysed the expression levels of specific genes at different phases of tissue development. The differentially expressed genes were chosen for further analysis based on the Heat maps obtained.
3. Results
3.1. SOD genes, their paralog identification and genome wide distribution in Brassica rapa
Based on domain composition, a total of 17 BrSOD genes were identified that further clustered into 8 BrCu-ZnSOD and 9 BrFe-MnSOD genes. Chromosomal distribution of SOD genes revealed that the maximum of 3 genes of BrCu-ZnSODs were located on chromosome A10 and one gene each located on A04, A06, A07, A08 and A10. Similarly, three genes of BrFe-MnSODs were located on chromosome A01 and the rest of the genes were located on A03, A04, A05, A06, A09 and A10. In O. sativa, genes coding for SODs were scattered on all 6 chromosomes, whereas in A. thaliana, they were only disributed on 5 chromosomes. [23].
In the present, investigation five groups of homologous genes were identified in both the classified categories of SOD genes i.e. BrCu-ZnSODs and BrFe-MnSOD between BrCu-ZnSOD4 (Chromosome-A08) and BrCu-ZnSOD6 (Chromosome-A09), BrCu-ZnSOD3 (chromosome-A07), &BrCu-ZnSOD1 (chromosome-A04), BrCu-ZnSOD7 (chromosome-A09) & BrCu-ZnSOD2 (chromosome-A06), BrFe-MnSOD6 (chromosome-A05) & BrFe-MnSOD3 (chromosome-A01) and BrFe-MnSOD7 (chromosome-A06) & BrFe-MnSOD2 (chromosome-A01) identified as paralogs of SOD genes as depicted (Fig. 1.). One (GrMSD1 and GrMSD2) and two (AtMSD1 and AtMSD2, and AtFSD1 and AtFSD2) segmental duplication events have been found in G. raimondii and A. thaliana, based on gene duplication investigations[17].
Fig. 1.

Chromosomal locations of seventeen BrCu-ZnSOD & BrFe-MnSOD genes are specified on crown of the chromosomes and chromosome duplication occurred between chromosomes, same colour of stars present on the chromosome represent duplication of chromosomes in Brassica rapa.
3.2. SOD gene structure and their sub-cellular localization in B. rapa
The gene structure analysis indicated that protein length varied from 152 to 504, whereas, molecular weight (kD) ranged from 15.17 (BrCu-ZnSOD7) to 54.73 (BrCu-ZnSOD6), respectively. The variation was more pronounced among BrCu-ZnSOD’s as compared to the BrFe-MnSOD’s (Table 1). In the statistical mean, the isoelectric point, or pH at which a given molecule bears no net electrical charge or is electrically neutral, ranged from 4.41 (BrFe-MnSOD4) to 9.51 (BrFe-MnSOD4) (BrFe-MnSOD3), whereas, gravy value ranged from −0.046 (BrFe-MnSOD9) to −0.602 (BrFe-MnSOD4), respectively. Increasing positive score indicates a greater hydrophobicity. The sub-cellular localization analysis have revealed that BrCu-ZnSOD5, BrCu-ZnSOD7, BrFe-MnSOD8 and BrFe-MnSOD9 are predicted cytoplasmic, whereas, BrCu-ZnSOD3, BrFe-MnSOD3, BrFe-MnSOD4 and BrFe-MnSOD6 as mitochondrial proteins, respectively. Furthermore, chloroplastic proteins were prognosticated by BrCu-ZnSOD1, BrCu-ZnSOD3, BrCu-ZnSOD4, BrFe-MnSOD1, BrFe-MnSOD2, BrFe-MnSOD5 and BrFe-MnSOD7 genes (Supp-S1). None of the applications predicted the localization of BrCu-ZnSOD2 and BrCu-ZnSOD6 genes.
Table 1.
Characterization and physio-chemical properties of SOD proteins in Brassica rapa.
| Gene Name | Chromosome location | ORF Length | Protein Length | Molecular Weight (kD) | Isoelectric Point (pI) | Gravy value |
|---|---|---|---|---|---|---|
| BrCu-ZnSOD5 | A09 | 660 | 219 | 23.59 | 5.81 | −0.102 |
| BrCu-ZnSOD8 | A10 | 489 | 162 | 16.68 | 7.20 | −0.301 |
| BrCu-ZnSOD3 | A07 | 612 | 203 | 21.66 | 8.35 | −0.074 |
| BrCu-ZnSOD7 | A09 | 459 | 152 | 15.17 | 6.04 | −0.171 |
| BrCu-ZnSOD1 | A04 | 624 | 207 | 21.36 | 7.02 | −0.068 |
| BrCu-ZnSOD4 | A08 | 951 | 316 | 33.63 | 6.70 | −0.114 |
| BrCu-ZnSOD6 | A09 | 1515 | 504 | 54.73 | 5.10 | −0.431 |
| BrCu-ZnSOD2 | A06 | 1131 | 376 | 40.84 | 9.07 | −0.172 |
| BrFe-MnSOD6 | A05 | 696 | 231 | 25.41 | 8.68 | −0.314 |
| BrFe-MnSOD8 | A09 | 684 | 227 | 25.44 | 6.69 | −0.428 |
| BrFe-MnSOD3 | A01 | 696 | 231 | 25.49 | 9.51 | −0.284 |
| BrFe-MnSOD1 | A01 | 639 | 212 | 23.84 | 6.38 | −0.370 |
| BrFe-MnSOD7 | A06 | 792 | 263 | 30.14 | 7.92 | −0.506 |
| BrFe-MnSOD2 | A01 | 792 | 263 | 30.16 | 7.90 | −0.435 |
| BrFe-MnSOD4 | A03 | 813 | 270 | 30.90 | 4.41 | −0.602 |
| BrFe-MnSOD5 | A04 | 666 | 221 | 24.96 | 4.36 | −0.478 |
| BrFe-MnSOD9 | A10 | 651 | 216 | 23.55 | 4.90 | −0.046 |
3.3. CDS configuration of SOD genes in Brassica rapa
The CDS sequences has been oriented with the analogous genomic DNA sequences, for the prediction of intron/exon configuration of SOD genes using Gene Structure Display Server (GSDS2.0). The present investigation revealed that the number of introns for Cu-ZnSOD ranged from 2 as observed in (BrCu-ZnSOD) to 8 in case of (BrCu-ZnSOD2 and BrCu-ZnSOD6), respectively (Fig. 2). Six introns were observed both in case ofBrCu-ZnSOD7 and BrCu-ZnSOD8. Among BrFe-MnSOD class of genes, the highest numbers of introns i.e., seven were observed in BrFe-MnSOD2 and BrFe-MnSOD7. Similar pattern of intron organization of six were exhibited by BrFe-MnSOD3, BrFe-MnSOD5, BrFe-MnSOD6 and BrFe-MnSOD8. The rest of the SODs in both BrCu-ZnSOD and BrFe-MnSODs genes in B. rapa exhibited diverse intron organization patterns. Intron number and location among the Cu/Zn SOD genes have been found to be significantly conserved in plants.
Fig. 2.

Intron/exon configurations of SODgenes in Brassica rapa.
Yellow boxes and thin lines, respectively, demarcate exons and introns. UTRs are represented with blue boxes. 0 = intron phase 0; 1 = intron phase 1; 2 = intron phase 2.
3.4. Conserved motifs of SOD genes in Brassica rapa
The combined block diagram of 10 conserved motifs among the identified SOD genes in Brassica rapa as revealed by MEME analysis (Fig. 3a). The number of the motifs ranged two to four in BrCu-ZnSODs with motif 1 & motif 6 as more pronounced as compared to two to seven motifs observed in case of BrFe-MnSODs with motif 2, 4, 5 and 8 as more commonly seen. Among the BrCu-ZnSOD, motif 8 was exclusively present in BrCu-ZnSOD3. Pfam analysis have indicated that the motifs 1,3,6 and 10 are related to Cu-SOD domain architect, whereas motifs 2, 4, 5, 7 and 8 are associated with Fe-SOD domain. Motif-9 was the only one among all motifs concomitant to heavy metal associated (HMA) domain.
Fig. 3.

(a) Block diagram of ten conserved protein motifs representing motif arrangements and motif sequences in SODs of Brassica rapa. (b) Motif Sequences. Red coloured stars indicate copper metal bind sites in motif 1, 2, 4, 6 &10 and blue coloured stars in motif 1 and 10.
Copper binding sites in Motif 1 (H30, H32), Motif 2 (H13), Motif 4 (H28), Motif 6 (H24), and Motif 10 (H13) were shown to be conserved in majority of the corresponding BrCu-ZnSOD proteins (Fig. 3A), as well as in most of the respective TaSOD proteins. (Fig. 3B). Moreover, Cysteine residues Motif 1 (C40) and Motif 10 (C16), which are entangled in di-sulphide bond and shell formation circling metal ions in BrFe-MnSODs, were also shown to be preserved, respectively. The domain architecture analysis revealed that the BrCu-ZnSOD1, BrCu-ZnSOD3, BrCu-ZnSOD5, BrCu-ZnSOD7 and BrCu-ZnSOD8 have one pfam domain of SOD-Cu, while BrCu-ZnSOD and BrCu-ZnSOD revealed two domains of SOD-Cu and HMA. BrCu-ZnSOD was the only one having two domains of SOD-Cu and Ribosomal 18P (Supp-S2). In the BrFe-MnSOD group, BrFe-MnSOD1, BrFe-MnSOD2, BrFe-MnSOD3, BrFe-MnSOD4, BrFe-MnSOD6, BrFe-MnSOD7 and BrFe-MnSOD8 two pfam domains of SOD-Fe-C and SOD-Fe-N, whilst, BrFe-MnSOD9 have two different domains of SOD-Fe-C and Gar-1. BrFe-MnSOD5 was only in the group having single domain of SOD-Fe-C.
3.5. Phylogenetic analysis of SOD proteins in Brassica rapa
The phylogenetic analysis was carried out between Brassica rapa and other species including Brassica rapa, Brassica napus, Brassica oleraceae, Triticum aestivum, Oryza sativum and Arabdopsis thaliana using the maximum likelihood approach of MegaX. Investigations revealed that from 100 SOD protein sequences, two major groups were unambiguously retrieved with BrCu-ZnSODs and BrFe-MnSODs (Fig. 4) except one SOD i.e. CDY70727 that didn’t clustered with any of the either cluster group. All the BrCuSODs of Brassica rapa have been clustered in BrCu-ZnSODs group and similarly all BrFe-Mn-SOD in the BrFe-MnSOD group (Supp-S3). Notably seven genes having two domains of HMA (heavy-metal-associated) and CuSOD were assembled into the Cu-ZnSODs. Gene ontology annotations revealed that AT1G12520.1 (A. thaliana) had superoxide dismutase copper chaperone activity (Supp-S4). The numerous subgroups of both BrCu-ZnSODs and BrFe-MnSODs, which were generally split into monocot and dicot species, showed good bootstrap support. A similar and corroborative research of phylogenetic analysis of 41 SOD protein sequences from 23 higher plant species, including seven grass species, identified two major groupings of BrCu-ZnSODs and Br Fe-MnSODs [16] and further supported by evolutionary relationship carried out by Feng et al. (2016) in tomato.
Fig. 4.

Phylogenetic relationship of SODs among three species Brassica rapa, Brassica napus, Brassica oleraceae, Arabidopsis thaliana, Triticum sativum, and Oryza sativa. Genes of BrCu-ZnSODs and BrFe-MnSODs of Brassica rapa are marked with different colors.
3.6. Protein structure analysis
The protein structures of BrCu-ZnSODs and BrFe-MnSOD were detected using PyMoL software (3D-model) (Fig. 5) that revealed Cu/Zn-SOD mostly consists of beta sheet with two small alpha helices whereas BrFe-MnSOD contains mainly alpha helices. The secondary and tertiary structure analyses of these SODs exhibited marked structural differences between BrCu-ZnSOD and BrFe-MnSOD proteins. The BrCu-ZnSOD proteins comprised were found to consist of 8 anti-parallel β-strands arranged in the Greek key (GK) motif as reported earlier (Richardson, 1977). In the most of BrCu-ZnSOD proteins, variable and electrostatic loops were also shown to be conserved. Only 5% of the substance of the -helical structure is found in the loop region. Moreover two GK connections, Greek Key loop-1 and Greek Key loop-2, with conserved leucine residues are liganded between β3/4 and β6/7, respectively. The Cupper and Zinc sites are positioned in the effective site channel of outside the β-barrel (Perry et al., 2010). Investigations revealed that BrFe-MnSODs consists of 6 α-helices and 3 anti-parallel β-sheets in contrast to the structural configuration of BrCu-ZnSODs. Furthermore, BrFe-MnSODs have two long anti-parallel helices apportioned by a short -helix in the N-terminal half, and three anti-parallel -sheets surrounded by two -helices on each side in the C-terminal half. A β-barrel structure made up of 8-sheets along with 3-loops connected by a disulfide Bridge famed the three-dimensional structure. The α-helical structure accounts for 5 per cent only, exclusive to loop region. Notably, only 5% of the loop region is made of by the α-helical structure.
Fig. 5.


a&b: Predicted 3D model structure and binding sites of BrCu-ZnSOD and BrFe-MnSODin Brassica rapa.
3.7. Functional annotation of cis regulatory elements
PlantCARE was used to identify and determine sequences of 1500 bp upstream areas from the translation intiation site of each of BrCu-ZnSOD and BrFe-MnSOD in order to better understand gene function and regulation mechanisms. The candidate cis regulatory elements in the promoters of Brassica rapa were identified and chronologically classified into Broad four categories. (1) Growth and development, (2) Light responsive, (3) Stress responsive, (4) Hormonal responsive (Table 2). The cis-regulatory motifs GARE-motif, P Box, TGA element, GA-motif and HD-Zip 1 involved in regulatory mechanisms controls growth and development, which were prognosticated in the most of the genes. Furthermore, eight different forms of hormone-responsive cis-elements have been identified, and every BrSOD promoter sequence had at least one form of cis-element implicated in plant hormone viz., Zein metabolism regulation responsive element (O2-site), gene conversion responsive element (MYB recognition site), DNA synthesis responsive element (Myb-binding site), root meristem gene expression responsive element (telo-box), DNA replication responsive element (CCGTCC motif), endosperm expression responsive element (GCN4_motif), abscisic acid-responsive element (ABRE). Among them, the most numerous were the light-responsive elements. Light-responsive elements were found in 2–8 different types of BrSOD proteins, revealing that BrSODs might be differentially controlled by light.
Table 2.
Cis-regulatory elements predicted in promoter region of SOD.
| Gene | Growth and development | Hormone responsive | Light responsive | Stress responsive |
|---|---|---|---|---|
| BrCu-ZnSOD1 | GARE-motif | Myb-binding site, ABRE | AE-box, Box 4 | ERE, DRE core |
| BrCu-ZnSOD2 | GARE-motif, P-box |
MYB recognition site, Myb-binding site, TGACG-motif |
Box 4, I-box, LTR |
ARE, AT-rich sequence, ERE, W box TCA-element |
| BrCu-ZnSOD3 |
– |
TGACG-motif, ABRE |
Box 4, CAG-motif, GATA-motif, G-box, I-box, MRE, TCT-motif |
ARE, ERE, STRE, TC-rich repeats, WUN-motif, as-1, STRE |
| BrCu-ZnSOD4 | GARE-motif, HD-Zip 1, TGA-element |
GCN4_motif, Myb-binding site, TGACG-motif, ABRE |
Box 4, G-box, , ATCT-motif |
ARE, DRE1, ERE, MBS, W box, TCA-element, , DRE core, as-1 |
| BrCu-ZnSOD5 | HD-Zip 1, GA-motif |
MYB recognition site | Box 4, GATA-motif, GC-motif, I-box |
ARE, WUN-motif, TCA-element |
| BrCu-ZnSOD6 | TGA-element | O2-site, TGACG-motif |
Box 4, GT1-motif, I-box, LTR, TCT-motif, AT1-motif |
ARE, ERE, WUN-motif, TCA-element, as-1 |
| BrCu-ZnSOD7 | P-box, TGA-element, GA-motif |
MYB recognition site, TGACG-motif | Box 4, GATA-motif, G-box, GC-motif, GT1-motif, I-box, TCCC-motif, TCT-motif |
ARE, STRE, TCA, TC-rich repeats, as-1 |
| BrCu-ZnSOD8 | GARE-motif | Myb-binding site, TGACG-motif, ABRE |
Box 4, G-box, GT1-motif, LTR, TCT-motif, ATCT-motif |
ARE, DRE1, TC-rich repeats, as-1, STRE |
| BrFe-MnSOD1 | – | CCGTCC motif, Myb-binding site, TGACG-motif, ABRE |
AE-box, GATA-motif, G-box, GT1-motif, LTR, TCT-motif | ARE, ERE, MBS, WUN-motif, DRE core, as-1 |
| BrFe-MnSOD2 |
GARE-motif, P-box |
Myb-binding site, TGACG-motif, ABRE |
AE-box, Box 4, G-box, GT1-motif |
ARE, MBS RE, STRE, TCA, as-1 |
| BrFe-MnSOD3 | TGA-element | MYB recognition site, Myb-binding site, TGACG-motif, ABRE | G-box, GT1-motif, LAMP-element LTR, Sp1, TCCC-motif, TCT-motif |
ARE, MBS, TCA, WRE3, as-1, DRE core |
| BrFe-MnSOD4 |
GARE-motif |
CCGTCC motif, Myb-binding site, TGACG-motif ABRE |
Box 4, GATA-motif, G-box, GT1-motif, TCCC-motif, ATC-motif |
MBS, TCA, WRE3 , DRE core, as-1 |
| BrFe-MnSOD5 | P-box, TGA-element |
Myb-binding site, telo-box, TGACG-motif |
Box II GT1-motif, MRE, TCT-motif, ATCT-motif |
ARE, ERE, MBS, TC-rich repeats, WRE3, DRE core, as-1 |
| BrFe-MnSOD6 | GARE-motif | ABRE, MYB recognition site, Myb-binding site, TGACG-motif |
Box II, G-box, GT1-motif, LAMP-element, MRE, Sp1 |
ARE, MBS, STRE, TC-rich repeats, WRE3, TCA-element, DRE core, as-1 |
| BrFe-MnSOD7 | GARE-motif | Myb-binding site, TGACG-motif ABRE |
G-box, GT1-motif, TCT-motif |
ARE, box S, STRE, TC-rich repeats, W box, TCA-element, DRE core, as-1 |
| BrFe-MnSOD8 | TGA-element | CCGTCC motif, GCN4_motif, MYB recognition site, TGACG-motif, ABRE |
AE-box, Box 4, G-box LTR, MRE, TCT-motif |
ARE, ERE, MBS. TCA-element |
| BrFe-MnSOD9 | P-box, TGA element, GA-motif |
Myb-binding site, O2-site, ABRE |
AE-box, Box 4, TCCC-motif, TCT-motif |
ARE, STRE, TCA-element, as-1 |
In the promoters of both BrCu-ZnSOD and BrFe-MnSOD genes, stress-responsive elements sensitive to biotic (fungal elicitor) and abiotic stimuli such as anaerobic induction, cold and dehydration, defence and other stresses (heat stress, low temperature, drought, and wound) were predicted (i.e. ARE, ABRE, ERE, STRE, TC-rich repeats, WUN-motif, DRE1, MBS, W box, RE, STRE, TCA, WRE3, box S, as-1, DRE core). TCA elements were present in most of the BrSOD genes and functions as endogenous signal mediating plant defence response against pathogens. Similarly MBS and WUN-motif were also detected in most of the BrSOD genes in respond to drought and wound stress.
3.8. Interaction analysis
To elucidate the co-regulatory network among BrSODs, a protein-protein interaction structure analysis was performed by using STRING server, which revealed that each BrCu-ZnSOD putatively interacts directly or indirectly with all BrCu-ZnSOD proteins and vice contrariwise (Fig. 6). The wide sub-cellular localization of BrCu-ZnSOD and BrFe-MnSOD proteins invariably revealed their reciprocity through co-expression and co-regulation. Predominately, proteins located in the centre of the network have a more complex interaction relationship than the proteins located at the periphery.
Fig. 6.
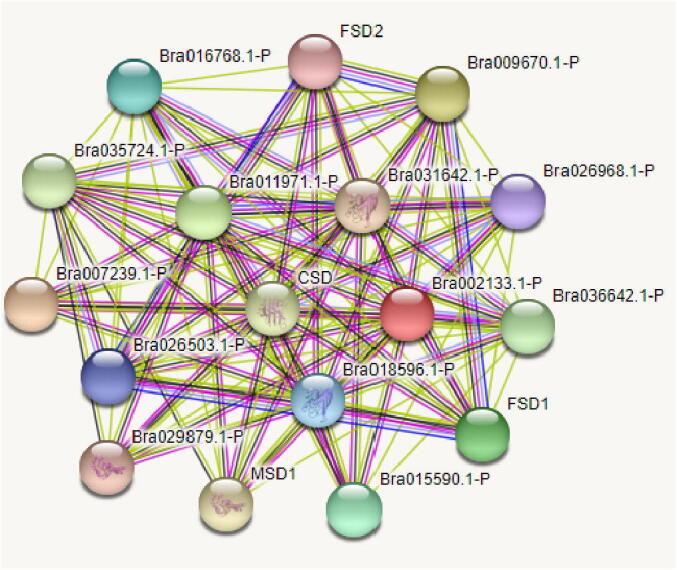
Interaction analysis of SOD proteins in B. rapa.
3.9. Expression analysis of BrSODs in Brassica rapa
There has been evidence of a substantial association between gene expression and function. Plant growth, development, and stress responses are all governed by the SOD gene family. Based on the data available, the expression profile in different tissues namely plant callus, root, stem, leaf, flower, and silique were determined. In the 16 candidate genes studied, 15 BrSODs showed observable expression levels in one or more of the six tissues. The BrCu-ZnSOD3 didn’t show expression in roots, however whose transcript was detected in all other tested tissues, whileas the majority of BrSODs were practically expressed in all six tissues (Fig. 7). Our findings are in line with those of Feng et al.(2015) in Musa acuminate, who found that 11 of the 12 MaSODs are expressed in all three tissues studied (leaf, pseudo stem, and root), with only one (MaSOD2B) being expressed exclusively in leaves and roots. SODs have an significant role to play in the life cycle of plants, as evidenced by the changes in expression at distinct developmental stages (Sandeep et al., 2019).
Fig. 7.

Relative expression profiles BrSODs at various developmental stages of Brassica rapa. The heat map's tint system is based on a log 2 intensity value.
Expression analysis across different stages across all the 16 genes were split up into four groups. The first group showed expressed significantly in practically all of the tissues examined and included BrCu-CuSOD1, BrCu-ZnSOD7 and BrFe-MnSOD3 (High). The second group was expressed at a slightly lower level in comparison with the group first and they included BrCu-ZnSOD2, BrCu-ZnSOD4 and BrFe-MnSOD6 (Medium). The third group, including BrCu-ZnSOD5, BrCu-ZnSOD6, BrCu-ZnSOD8, BrFe-MnSOD2, BrFe-MnSOD4 and BrFe-MnSOD7 had expressed very low in almost all of the tissues except BrCu-ZnSOD5 which had high expression in plant callus. The fourth group, which contained BrCu-ZnSOD3 and BrFe-MnSOD9, had expressed higher in magnitude than the third and second groups but revealed very low expression levels comparison to the group first (very low).
The expression analysis across different stages, BrCu-ZnSOD1, BrCu-ZnSOD3, BrFe-MnSOD2, BrFe-MnSOD4 and BrFe-MnSOD7 genes showed maximum expression in leaves. The maximum gene expressions for plant callus and root formation stage were observed by genes BrCu-ZnSOD2, BrCu-ZnSOD4, BrCu-ZnSOD5&BrFe-MnSOD1. Similarly of these, the expression levels of BrCu-ZnSOD6, BrCu-ZnSOD7 and BrFe-MnSOD1 were the highest in the flowers; BrCu-ZnSOD2 and BrFe-MnSOD3 profusely showed expression levels in the roots in contrast with all other tissues (Supp-S4). Expression analysis of SODs in ten diverse tissues (root, leaf, bud, flower, 1-cm fruit, 2-cm fruit, 3-cm fruit, MG, B, and B10) have also been analysed during growth and development in tomato by Feng et al. (2016) using RNA-seq atlas and its findings revealed that five S1SOD genes had similar expression in all tissues, two had distinct tissue specific expression and one demonstrated high expression in all ten tissues consistently.
4. Discussion
Superoxide dismutase (SODs) are key constituents in a series of antioxidant enzyme gene families, which plays an specific and significant role in plant growth and development. Stress manifests in plants in diverse forms including heat, cold and other biotic stresses (drought, water stress). All of these stresses cause plants to produce a considerable amount of reactive oxygen species (ROS) (Gupta et al., 2019). This ROS accumulation leads to oxidative stress which adversely affects the functionality and physical properties of biological macromolecules, biofilms and in worst circumstances leads to cell death (Gupta et al., 2019). These ROS are restrained and scavenged by superoxide dismutase (SODs) which is the first line of defence of in plants (Alscher et al., 2002, Han et al., 2020). ROS can be produced in a number of compartments like chloroplasts, mitochondria, peroxisomes, and the plasma membrane in plant cells (Dmitrieva et al., 2020). Advancement of next generation sequencing technologies have evolved and considerably a significant level of efforts have been gone to elucidating multiple functions of SOD genes and their precise identification in the biological system of plants. The core pathway for discovering SOD genes is based on the availability of whole genome sequence analysis, which aids in characterisation of SOD genes across the genome. In many species of plants, the SOD gene family has a model distribution including Arabidopsis (Kliebenstein et al., 1998), Longan (Lin and Lai, 2013), Poplar (Molina et al., 2013), banana (Feng et al., 2015) and others. A total of 29 SODs have been identified and characterized in Brassica juncea including 12 CUSODs (CSDs), 7 MnSODS (MSDs), and 10 Fe-SODs (FSDs) by using genome wide analysis method, while as 18 CuSODs, 4 MnSODs and 6 FeSODs were reported in Brassica rapa (Verma et al., 2019). In the present investigation, 17 SOD genes were discovered in the Brassica rapa following genome wide analysis and characterization processes. These include 8 BrCu-ZnSODs and 9 BrFe-MnSODs genes based on domain organization. Variable number of SOD genes have also been reported earlier in different crops like 7 SOD’s in case of A. thaliana (Kliebenstein et al., 1998), 8 in sorghum (Filiz and Tombuloğlu, 2015), 18 in G. hirsutum (Wang et al., 2017), 10 in tea plant (Zhou et al., 2019) 7 in Barley (Zhang et al., 2021) whereas 23 SOD’s were identified and reported in T. aestivum in an another investigation (Tyagi et al., 2017). Similarly in Barley, seven SOD genes were identified which included four Cu/Zn-SODs, two Fe-SODs and one Mn-SOD and all the SODs genes were distributed in 2, 4 and 7 chromosomes, respectively. (Zhang et al., 2021). The molecular evolutionary genetic analysis grouped SODs of olive pollen independently into three clades of Cu/Zn-SODs, Fe- SODs and Mn-SODs (Zafra et al., 2018). The 17 identified SOD’s in Brassica rapa and and their paralogs in the present investigation were distributed across the genome as reported earlier in other crops and Brassica species (Verma et al., 2019). The variable number of SODs has been further attributed to whole genome duplication and events of polyploidy. The genes positioned on a homologous chromosome group having a sequence similarity of at least 90%. ≥ 90% are by and large premediated as homologous genes (Shumayla et al., 2016). The subcellular localization analysis indicated their presence in the cytoplasm for BrCu-ZnSODs and chloroplast/mitochondria in case of BrFe-MnSODs. The pattern of subcellular localization of SOD’s identified in Brassica rapa in the present investigation follows the analogy of earlier investigation. BrCu-ZnSODs are usually found in in the cytoplasm, chloroplast and peroxisome (Bueno et al., 1995), while, FeSODs have been discovered in the chloroplast and cytoplasm of cowpea plants (Moran et al., 2003, Miller, 2012). FeMn-SOD’s are also reported to be localized and predicted both in chloroplast & mitochondria in wheat (Tyagi et al., 2017). The physiochemical properties of SOD proteins in Brassica rapa depicted a similar trend in profile as reported and described like in S. bicolor (Filiz and Tombuloğlu, 2015).
The gene architecture of SOD’s in Brassica revealed a differential number of introns which ranged from 2 to 8. Among the 17 SOD’s identified in this investigation, the variable number of introns were highest in BrFe-MnSOD’s (Asensio et al., 2012). Similar pattern of intron organization were observed in S. bicolor i.e 5–7 (Filiz and Tombuloğlu, 2015). Fink and Scandalios, (2002) have also reported a highly conserved intron patterns (both number & position). In the present investigation, 10 conserved motifs were identifies among the SOD genes and these findings are fully supported with earlier reports (Feng et al., 2016). The numerous metal binding sites and their highly conserved nature have also been corroborated as earlier (Kitagawa et al., 1991).
Proteins require a structural framework to function effectively and maintain their dynamic character. The primary, secondary, and tertiary structures of SODs found in Brassica rapa were deduced from previously published SOD proteins in the IDB database, (Flückiger et al., 2002, Muñoz et al., 2005). The basic structure of Cu-SOD is a beta barrel, which consists of 8 antiparallel beta strands as reported earlier (Kitagawa et al., 1991). The secondary and tertiary structures of Mn-SOD’s and Fe-SOD types in Brassica rapa were in confirmity with the known and studied protein structures. These findings are well corroborated with the previous reports of Dehury et al. (2013) in (O. sativa) and Gopavajhula et al. (2013) n Glycine max. The phylogenetic analysis classified all the BrCu-SOD’s of Brassica rapa into BrCu-ZnSOD types and BrFe-MnSOD into BrFe-MnSOD group. However, multiple studies have shown that Mn-SODs and Fe-SODs are distinct in plants, with Mn-SODs sharing 70% homology with Fe-SODs of plants, showing that the two ancestral genes originated from different places (Miller, 2012). A vast number of studies have revealed that diverse abiotic stresses and varied environmental circumstances control the expression of SOD genes in plants, resulting in differences in SOD gene expression (Zhang et al., 2016). In the present investigation, among the 17 candidate genes, 15 SOD’s genes in Brassica rapa exhibited a detectable expression genes in at least one of the 6 lesions which are significantly supported with the findings of Feng et al. (2015) as investigated in MUSA acuminate. Field experiments and in silico analysis revealed that the superoxide dismutase (SOD) was the most influential antioxidant in resistance of triticale to drought stress; therefore, it could be used as an indirect selection index in early stages to distinguish resistant genotypes to drought stress (Moucheshi et al., 2021). Moreover, Mn-SOD and Fe-SOD showed similar expression levels for both genotypes under drought stress in triticale, but the expression level Cu/Zn-SOD was higher in range in the root and shoot of the tolerant genotype than the susceptible genotype. Cis regulatory elements play a essential role in the transcriptional regulation of gene activities that affect a variety of biological processes including developmental processes and abiotic stress responses (Yamaguchi and Shinozaki, 2005). As reported earlier, cis elements signify a critical role in various plant stress responses namely ABRE, DRE, CRT, SARE, and SURE which retort to ABA, dehydration, cold, S.A and sulphur, accordingly (Shi et al., 2010, Osakabe et al., 2014). The stress tolerance pathway is activated when transcription factors interact with Cis regulatory elements, for example, in tomato, the ERF transcription factor attaches to GCC Box and confers salt stress tolerance (Yang et al., 2018). The analysis revealed that CIS regulatory elements in Brassica rapa were identified and subsequently classified into five categories. Similar classification of CIS elements have also been carried out by Feng et al. (2016) in tomato and Tyagi et al. (2017) in wheat that were related to low temperatures, heat, drought, defence stresses and fungal elicitors.
5. Conclusion
Initially, ROS were considered as toxic molecules and products of aerobic metabolism, found in several subcellular compartments of the cells. The metabolism of ROS is crucial in crop growth development, however, the production and scavenging of ROS are essential factors of plant defense processes and overexpression of candidate genes encoding ROS detoxifying enzymes is often employed to improve tolerance against several abiotic stresses. The plant has to face a variety of stresses at once in the field, thus, identification of core genes, which can confer multiple abiotic stress tolerance, is of paramount importance. In the present investigation 17 putative SOD genes from Brassica rapa were identified, characterized and analysed. Their genome organization, phylogenetic classification, structure of genes, conserved motif elicitation, and phylogenetic relationships were elucidated, which indicated the conserved nature of exon/intron composition, conserved domain, and motifs of the gene family. The differential expression patterns of BrSODs across tissue-specific patterns signify that these genes play a critical role in the growth and developmental processes in Brassica rapa. This information generated during the course of this investigation led to the insight about the structural diversity, occurrence and syntenic relationship among different SODs across crop species. It is understood that abiotic stresses are major limiting factors affecting plant growth and development, globally. The tissue specific and stage specific expression levels of these genes indicated their role if different developmental and plant response mechanisms especially against biotic and abiotic stress conditions. As a result, the research contributes to a better understanding and functional characterisation of the SOD gene family in Brassica rapa. More detailed research in the function of BrSODs to be conducted by gene engineering and combined analysis of genomics, transcriptomics, proteomics, and metabolomics is envisaged in the future studies.
Funding
The current study has not been financed by any agency.
Ethical approval
This research article does not carry any studies with reference to animals executed by any of the authors.
Declaration of Competing Interest
The authors declare that they have no known competing financial interests or personal relationships that could have appeared to influence the work reported in this paper.
Footnotes
Peer review under responsibility of King Saud University.
Supplementary data to this article can be found online at https://doi.org/10.1016/j.sjbs.2021.08.009.
Appendix A. Supplementary material
The following are the Supplementary data to this article:
References
- Alscher R.G., Erturk N., Heath L.S. Role of superoxide dismutases (SODs) in controlling oxidative stress in plants. J. Exp. Bot. 2002;53(372):1331–1341. [PubMed] [Google Scholar]
- Apostolova E., Rashkova M., Anachkov N., Denev I., Toneva V., Minkov I., Yahubyan G. Molecular cloning and characterization of cDNAs of the superoxide dismutase gene family in the resurrection plant Haberlea rhodopensis. Plant Physiol. Biochem. 2012;55:85–92. doi: 10.1016/j.plaphy.2012.03.015. [DOI] [PubMed] [Google Scholar]
- Asensio A.C., Monreal G.M., Pires L., Gogorcena Y., Aparicio P.M.T., Moran J.F. Two Fe superoxided dismutase families respond differently stress and senescence in legumes. J. Plant Physiol. 2012;169:1253–1260. doi: 10.1016/j.jplph.2012.04.019. [DOI] [PubMed] [Google Scholar]
- Bailey T.L., Boden M., Buske F.A., Frith M., Grant C.E., Clementi L., Ren J., Li W.W., Noble W.S. MEME SUITE: tools for motif discovery and searching. Nucl. Acids Res. 2009;37(Web Server):W202–W208. doi: 10.1093/nar/gkp335. [DOI] [PMC free article] [PubMed] [Google Scholar]
- Behera L., Sharma S.S., Samal K.C. Role of reactive oxygen species in plant development and its detection assays. Biotica Research. 2020;2:789–791. [Google Scholar]
- Bueno P., Varela J., Gimenez-Gallego G., del Rio L.A. 1995 Peroxisomal copper, zinc superoxide dismutase (characterization of the isoenzyme from watermelon cotyledons) Plant Physiol. 1995;108(3):1151–1160. doi: 10.1104/pp.108.3.1151. [DOI] [PMC free article] [PubMed] [Google Scholar]
- Dehury, B., Sharma, K., Sarmah et al., 2013 In silico analyses of superoxide dismutases (SODs) of rice (Oryza sativa L.). J. Plant Biochem. Biotechnol., 22(1), 150–156.
- Dmitrieva V.A., Tyutereva E.V., Voitsekhovskaja O.V. Singlet oxygen in plants: Generation, detection, and signaling roles. Int. J. Mol. Sci. 2020;21(9):3237. doi: 10.3390/ijms21093237. [DOI] [PMC free article] [PubMed] [Google Scholar]
- Dong C., Zheng X., Li G., Zhu H., Zhou M., Hu Z. Molecular cloning and expression of two cytosolic copper–zinc superoxide dismutases genes from Nelumbo nucifera. Appl. Biochem. Biotechnol. 2011;163(5):679–691. doi: 10.1007/s12010-010-9074-1. [DOI] [PubMed] [Google Scholar]
- Feng K., Yu J., Cheng Y., Ruan M., Wang R. The SOD gene family in tomato: identification, phylogenetic relationships, and expression patterns. Front Plant Sci. 2016 doi: 10.3389/fpls.2016.01279. [DOI] [PMC free article] [PubMed] [Google Scholar]
- Feng X., Lai Z., Lin Y., Lai G., Lian C. Genome-wide identification and characterization of the superoxide dismutase gene family in Musa acuminata cv. Tianbaojiao (AAA group) BMC Genomics. 2015;16(1):1–16. doi: 10.1186/s12864-015-2046-7. [DOI] [PMC free article] [PubMed] [Google Scholar]
- Filiz E., Tombuloğlu H. Genome-wide distribution of superoxide dismutase (SOD)gene families in Sorghum bicolor. Turk. J. Biol. 2015;39:49–59. [Google Scholar]
- Filiz E., Koc I., Ozyigit I.I. Comparative analysis and modeling of superoxide dismutases (SODs) in Brachypodium distachyon L. Appl. Biochem. Biotechnol. 2014;173(5):1183–1196. doi: 10.1007/s12010-014-0922-2. [DOI] [PubMed] [Google Scholar]
- Fink R.C., Scandalios J.G. Molecular evolution and structure_function relationships of the superoxide dismutase gene families in angiosperms and their relationship to other eukaryotic and prokaryotic superoxide dismutases. Arch. Biochem. Biophys. 2002;399:19–36. doi: 10.1006/abbi.2001.2739. [DOI] [PubMed] [Google Scholar]
- Flückiger S., Mittl P.R.E., Scapozza L., Fijten H., Folkers G., Grütter M.G., Blaser K., Crameri R. Comparison of the crystal structures of the human manganese superoxide dismutase and the homologous Aspergillus fumigatus allergen at 2-Å resolution. J. Immunol. 2002;168(3):1267–1272. doi: 10.4049/jimmunol.168.3.1267. [DOI] [PubMed] [Google Scholar]
- Franceschini, A., Szklarczyk, D., Frankild, S., Kuhn, M., Simonovic, M. et al., 2013 STRING v9.1: protein-protein interaction networks, with increased coverage and integration. Nucleic Acids Res. 41, D808–15. [DOI] [PMC free article] [PubMed]
- Giannopolitis C.N., Ries S.K. Superoxide dismutase: I. Occurrence in higher plants. Plant Physiol. 1977;59:309–314. doi: 10.1104/pp.59.2.309. [DOI] [PMC free article] [PubMed] [Google Scholar]
- Gohari G., Alavi Z., Esfandiari E., Panahirad S., Hajihoseinlou S., Fotopoulos V. Interaction between hydrogen peroxide and SODium nitroprusside following chemical priming of Ocimum basilicum L. against salt stress. Physiol. Plant. 2020;168:361–373. doi: 10.1111/ppl.13020. [DOI] [PubMed] [Google Scholar]
- Ramana Gopavajhula V., Viswanatha Chaitanya K., Akbar Ali Khan P., Shaik J.P., Narasimha Reddy P., Alanazi M. Modeling and analysis of soybean (Glycine max L) Cu/Zn, Mn and Fe superoxide dismutases. Genet. Mol. Biol. 2013;36(2):225–236. doi: 10.1590/S1415-47572013005000023. [DOI] [PMC free article] [PubMed] [Google Scholar]
- Guo A.Y., Zhu Q.H., Chen X., Luo J.C. GSDS: a gene structure display server. Yi Chuan. 2007;29:1023–1026. [PubMed] [Google Scholar]
- Gupta S., Dong Y., Dijkwel P.P., Roeber B.M., Gechev T.S. Genome-Wide Analysis of ROS Antioxidant Genes in Resurrection Species Suggest an Involvement of Distinct ROS Detoxification Systems during Desiccation. Int. J. Mol. Sci. 2019;2019(20):3101. doi: 10.3390/ijms20123101. [DOI] [PMC free article] [PubMed] [Google Scholar]
- Habib N., Ali Q., Ali S., Javed M.T., Zulqurnain Haider M., Perveen R., Shahid M.R., Rizwan M., Abdel-Daim M.M., Elkelish A., Bin-Jumah M. Use of Nitric oxide and hydrogen peroxide for better yield of wheat (Triticum aestivum L.) under water deficit conditions: Growth, osmoregulation, and antioxidative defense mechanism. Plants. 2020;9(2):285. doi: 10.3390/plants9020285. [DOI] [PMC free article] [PubMed] [Google Scholar]
- Han L.-M., Hua W.-P., Cao X.-Y., Yan J.-a., Chen C., Wang Z.-Z. Genome-wide identification and expression analysis of the superoxide dismutase (SOD) gene family in Salvia miltiorrhiza. Gene. 2020;742:144603. doi: 10.1016/j.gene.2020.144603. [DOI] [PubMed] [Google Scholar]
- Han X.-M., Chen Q.-X., Yang Q.i., Zeng Q.-Y., Lan T., Liu Y.-J. Genome-wide analysis of superoxide dismutase genes in Larix kaempferi. Gene. 2019;686:29–36. doi: 10.1016/j.gene.2018.10.089. [DOI] [PubMed] [Google Scholar]
- Hasanuzzaman M., Bhuyan M., Anee T.I., Parvin K., Nahar K., Mahmud J.A., Fujita M. Regulation ofascorbate-glutathione pathway in mitigating oxidative damage in plants under abiotic stress. Antioxidants. 2019;8:384. doi: 10.3390/antiox8090384. [DOI] [PMC free article] [PubMed] [Google Scholar]
- Hasanuzzaman M., Nahar K., Gill S.S., Alharby H.F., Razafindrabe B.H., Fujita M. Hydrogen peroxide pretreatment mitigates cadmium-induced oxidative stress in Brassica napus L.: An intrinsic study on antioxidant defense and glyoxalase systems. Front. Plant Sci. 2017;8:115. doi: 10.3389/fpls.2017.00115. [DOI] [PMC free article] [PubMed] [Google Scholar]
- Hasanuzzaman M., Nahar K., Khan M.I.R., Al Mahmud J., Alam M.M., Fujita M. Regulation of reactive oxygen species metabolism and glyoxalase systems by exogenous osmolytes confers thermotolerance in Brassica napusDie Regulierung des Stoffwechsels reaktiver Sauerstoffspezies und der Glyoxalasesysteme durch exogene Osmolyten führt zu einer Wärmetoleranz bei Brassica napus. Gesunde Pflanz. 2020;72(1):3–16. [Google Scholar]
- Hu X., Hao C., Cheng Z.-M., Zhong Y. Genome-Wide Identification, Characterization, and Expression Analysis of the Grapevine Superoxide Dismutase (SOD) Family. Int. J. Genomics. 2019;2019:1–13. doi: 10.1155/2019/7350414. [DOI] [PMC free article] [PubMed] [Google Scholar]
- Hu B., Jin J.P., Guo A.Y., Zhang H., Luo J.C. GSDS 2.0: an upgraded gene feature visualization server. Bioinformatics. 2015;31:1296–1297. doi: 10.1093/bioinformatics/btu817. [DOI] [PMC free article] [PubMed] [Google Scholar]
- Hu L., Yang Y., Jiang L., Liu S. The catalase gene family in cucumber: genome-wide identification and organization. Genet. Mol. Biol. 2016;39:408–415. doi: 10.1590/1678-4685-GMB-2015-0192. [DOI] [PMC free article] [PubMed] [Google Scholar]
- Ji H.S., Bang S.G., Ahn M.A., Kim G., Kim E., Eom S.H., Hyun T.K. Molecular Cloning and Functional Characterization of Heat Stress-Responsive Superoxide Dismutases in Garlic (Allium sativum L.) Antioxidants. 2021;10:815. doi: 10.3390/antiox10050815. [DOI] [PMC free article] [PubMed] [Google Scholar]
- Jiang W.Q., Yang L., He Y.Q., Zhang H.T., Li W., Chen H.G., Ma D.F., Yin J.L. Genome-wide identification and transcriptional expression analysis of superoxide dismutase (SOD) family in wheat (Triticum aestivum) Peer J. 2019;7:e8062. doi: 10.7717/peerj.8062. [DOI] [PMC free article] [PubMed] [Google Scholar]
- Kim H.J., Kato N., Kim S., Triplett B. Cu/Zn superoxide dismutases in developing cotton fibers: evidence for an extracellular form. Planta. 2008;228(2):281–292. doi: 10.1007/s00425-008-0734-0. [DOI] [PMC free article] [PubMed] [Google Scholar]
- Kitagawa Y., Tanaka N., Hata Y., Kusunoki M., Lee G., Katsube G.Y. Three dimensional structure of Cu, Zn-superoxide dismutase from spinach at 2.0 A resolution. A resolution. J. Biochem. 1991;109:477–485. doi: 10.1093/oxfordjournals.jbchem.a123407. [DOI] [PubMed] [Google Scholar]
- Kliebenstein D.J., Monde R.A., Last R.L. Superoxide dismutase in Arabidopsis: an eclectic enzyme family with disparate regulation and protein localization. Plant Physiol. 1998;118:637–650. doi: 10.1104/pp.118.2.637. [DOI] [PMC free article] [PubMed] [Google Scholar]
- Kyte J., Dolittle R.F. A simple method for displaying the hydropathic character of a protein. J. Mol. Biol. 1982;157(1):105–132. doi: 10.1016/0022-2836(82)90515-0. [DOI] [PubMed] [Google Scholar]
- Lin Y.-L., Lai Z.-X. Superoxide dismutase multigene family in longan somatic emBryos: a comparison of CuZn- SOD, Fe-SOD, and Mn-SOD gene structure, splicing, phylogeny, and expression. Mol. Breed. 2013;32(3):595–615. [Google Scholar]
- Miller A.F. Superoxide dismutases: ancient enzymes and new insights. FEBS Lett. 2012;586:585–595. doi: 10.1016/j.febslet.2011.10.048. [DOI] [PMC free article] [PubMed] [Google Scholar]
- Molina R.J.J., Tsai C.J., Kirby E.G. The Populus superoxide dismutase gene family and its responses to drought stress in transgenic poplar overexpressing a pine cytosolic glutamine synthetase (GS1a) PLoS One. 2013;8 doi: 10.1371/journal.pone.0056421. article e56421. [DOI] [PMC free article] [PubMed] [Google Scholar]
- Moran J.F., James E.K., Rubio M.C., Sarath G., Klucas R.V., Becana M. Functional characterization and expression of a cytosolic iron-superoxide dismutase from cowpea root nodules.2003. Plant Physiol. 2003;133(2):773–782. doi: 10.1104/pp.103.023010. [DOI] [PMC free article] [PubMed] [Google Scholar]
- Moucheshi A.S., Sohrabi F., Fasihfar E., Baniasadi F., Riasat M., Mozafari A.A. Superoxide dismutase (SOD) as a selection criterion for triticale grain yield under drought stress: a comprehensive study on genomics and expression profiling, bioinformatics, heritability, and phenotypic variability. BMC Plant Biol. 2021;21:148. doi: 10.1186/s12870-021-02919-5. [DOI] [PMC free article] [PubMed] [Google Scholar]
- Muñoz I.G., Moran J.F., Becana M., Montoya G. The crystal structure of an eukaryotic iron superoxide dismutase suggests inter subunit cooperation during catalysis. Protein Sci. 2005;14(2):387–394. doi: 10.1110/ps.04979505. [DOI] [PMC free article] [PubMed] [Google Scholar]
- Osakabe Y., Yamaguchi‐Shinozaki K., Shinozaki K., Tran L.‐S.P. ABA control of plant macro element memBrane transport systems in response to water deficit and high salinity. New Phytol. 2014;202(1):35–49. doi: 10.1111/nph.2014.202.issue-110.1111/nph.12613. [DOI] [PubMed] [Google Scholar]
- Perry J.J.P., Shin D.S., Getzoff E.D., Tainer J.A. The structural biochemistry of the superoxide dismutases. Biochim. Biophys. Acta. 2010;1804(2):245–262. doi: 10.1016/j.bbapap.2009.11.004. [DOI] [PMC free article] [PubMed] [Google Scholar]
- Pilon M., Ravet K., Tapken W. The biogenesis and physiological function of chloroplast superoxide dismutases. Biochim. Biophys. Acta (BBA) – Bioenergetics. 2011;1807(8):989–998. doi: 10.1016/j.bbabio.2010.11.002. [DOI] [PubMed] [Google Scholar]
- Postel D., Vanlemmens O., Gode P., Ronco G., Villa P. PlantCare a database of plant cis acting regulatory elements and a portal tools for silico analysis of promoter sequences. Nucleic Acids Res. 2002;30:325–327. doi: 10.1093/nar/30.1.325. [DOI] [PMC free article] [PubMed] [Google Scholar]
- Richardson J.S. β-Sheet topology and the relatedness of proteins. Nature. 1977;268:495–500. doi: 10.1038/268495a0. [DOI] [PubMed] [Google Scholar]
- Rubio M.C., Becana M., Sato S., James E.K., Tabata S., Spaink H.P. Characterization of genomic clones and expression analysis of the three types of superoxide dismutases during nodule development in lotus japonicus. Mol. Plant-Microbe Interact. 2007;20(3):262–275. doi: 10.1094/MPMI-20-3-0262. [DOI] [PubMed] [Google Scholar]
- Yadav S., Gill S.S., Passricha N., Gill R., Badhwar P. Genome-wide analysis and transcriptional expression pattern-assessment of superoxide dismutase (SOD) in rice and Arabidopsis under abiotic stresses. Plant Gene. 2019;17:100165. doi: 10.1016/j.plgene.2018.10.001. [DOI] [Google Scholar]
- Shi Z., Maximova S.N., Liu Y., Verica J., Guiltinan M.J. Functional analysis of the TheoBromacacao NPR1 genein Arabidopsis. BMC Plant Biol. 2010;10(1):248. doi: 10.1186/1471-2229-10-248. [DOI] [PMC free article] [PubMed] [Google Scholar]
- Shumayla S.S., Kumar R., Mendu V., Singh K., Upadhyay S.K. Genomic dissection and expression profiling revealed functional divergence in Triticum aestivum leucine rich repeat receptor like kinases (TaLRRKs) Front. Plant Sci. 2016;7:1374. doi: 10.3389/fpls.2016.01374. [DOI] [PMC free article] [PubMed] [Google Scholar]
- Sohag A.A.M., Tahjib-Ul-Arif M., Brestic M., Afrin S., Sakil M.A., Hossain M.T., Hossain M.A., Hossain M.A. Exogenous salicylic acid and hydrogen peroxide attenuate drought stress in rice. Plant Soil Environ. 2020;66:7–13. [Google Scholar]
- Liu Q., Li X., Yan S., Yu T., Yang J., Dong J., Zhang S., Zhao J., Yang T., Mao X., Zhu X., Liu B. OsWRKY67 positively regulates blast and bacteria blight resistance by direct activation of PR genes in rice. BMC Plant Biol. 2018;18(1) doi: 10.1186/s12870-018-1479-y. [DOI] [PMC free article] [PubMed] [Google Scholar]
- Tamura K., Peterson D., Peterson N., Stecher G., Nei M., Kumar S. MEGA5: molecular evolutionary genetics analysis using maximum likelihood, evolutionary distance, and maximum parsimony methods. Mol. Biol. Evol. 2011;28(10):2731–2739. doi: 10.1093/molbev/msr121. [DOI] [PMC free article] [PubMed] [Google Scholar]
- Tepperman J.M., Dunsmuir P. Transformed plants with elevated levels of chloroplastic SOD are not more resistant to superoxide toxicity. Plant Mol. Bio. 1990;14(4):501–511. doi: 10.1007/BF00027496. [DOI] [PubMed] [Google Scholar]
- Terzi R., Kadioglu A., Kalaycioglu E., Saglam A. Hydrogen peroxide pretreatment induces osmotic stresstolerance by influencing osmolyte and abscisic acid levels in maize leaves. J. Plant Interact. 2014;9:559–565. [Google Scholar]
- Tyagi S., Sharma S., Taneja M., Kumar R., Sembi J.K., Upadhyay S.K. Superoxide dismutases in Bread wheat (Triticum aestivum L.): comprehensive characterization and expression analysis during development and biotic and abiotic stresses. Agri. Gene. 2017;6:1–13. [Google Scholar]
- Verma D., Lakhanpal N., Singh K. Genome-wide identification and characterization of abiotic-stress responsive SOD (superoxide dismutase) gene family in Brassica juncea and Brassica rapa. BMC Genomics. 2019;20:227. doi: 10.1186/s12864-019-5593-5. [DOI] [PMC free article] [PubMed] [Google Scholar]
- Wang W., Xia M.X., Chen J., Yuan R., Deng F.N., Shen F.F. Gene expression characteristics and regulation mechanisms of superoxide dismutase and its physiological roles in plants under stress. Biochem Mosc. 2016;81(5):465–480. doi: 10.1134/S0006297916050047. [DOI] [PubMed] [Google Scholar]
- Wang W., Xia M., Chen J., Deng F., Yuan R. Genome-wide analysis of superoxide dismutase gene family in Gossypium raimondii, and G. arboreum. Plant Gene. 2016;6:18–29. [Google Scholar]
- Wang W., Zhang X., Deng F., Yuan R., Shen F. Genome-wide characterization and expression analyses of superoxide dismutase (SOD) genes in Gossypium hirsutum. BMC Genomics. 2017;18:376. doi: 10.1186/s12864-017-3768-5. [DOI] [PMC free article] [PubMed] [Google Scholar]
- Yamaguchi S.K., Shinozaki K. Organization of cis-acting regulatory elements in osmotic-and cold-stress-responsive promoters. Trends Plant Sci. 2005;10(2):88–94. doi: 10.1016/j.tplants.2004.12.012. [DOI] [PubMed] [Google Scholar]
- Zafra A., Castro A.J., Alche J.D. Identification of novel superoxide dismutase isoenzymes in the olive (Olea europaea L.) pollen. BMC Plant Biol. 2018;18(114) doi: 10.1186/s12870-018-1328-z. [DOI] [PMC free article] [PubMed] [Google Scholar]
- Zhang X., Zhang L., Chen Y., Wang S., Fang Y., Zhang X., Yuhuan W., Xue W. Genome–wide identification of the SOD gene family and expression analysis under drought and salt stress in barley. Plant Growth Regul. 2021;94:49–60. [Google Scholar]
- Zhang J., Li B., Yang Y., Hu W., Chen F., Xie L., Fan L. Genome-wide characterization and expression profiles of the superoxide dismutase gene family in Gossypium. Int. J. Genomics. 2016:11. doi: 10.1155/2016/8740901. Article ID 8740901. [DOI] [PMC free article] [PubMed] [Google Scholar]
- Zhou C., Zhu C., Fu H., Li X., Chen L., Lin Y., Lai Z., Guo Y. Genome-wide investigation of superoxide dismutase (SOD) gene family and their regulatory miRNAs reveal the involvement in abiotic stress and hormone response in tea plant (Camellia sinensis) PLOS One. 2019 doi: 10.1371/journal.pone.0223609. [DOI] [PMC free article] [PubMed] [Google Scholar]
Associated Data
This section collects any data citations, data availability statements, or supplementary materials included in this article.