

Abstract
Scope
Next to galacto‐oligosaccharides (GOS), starch‐derived isomalto‐oligosaccharide preparation (IMO) and isomalto/malto‐polysaccharides (IMMP) could potentially be used as prebiotics in infant formulas. However, it remains largely unknown how the specific molecular structures of these non‐digestible carbohydrates (NDCs) impact fermentability and immune responses in infants.
Methods and Results
In vitro fermentation of GOS, IMO and IMMP using infant fecal inoculum of 2‐ and 8‐week‐old infants shows that only GOS and IMO are fermented by infant fecal microbiota. The degradation of GOS and IMO coincides with an increase in Bifidobacterium and production of acetate and lactate, which is more pronounced with GOS. Individual isomers with an (1↔1)‐linkage or di‐substituted reducing terminal glucose residue are more resistant to fermentation. GOS, IMO, and IMMP fermentation digesta attenuates cytokine profiles in immature dendritic cells (DCs), but the extent is dependent on the infants age and NDC structure.
Conclusion
The IMO preparation, containing reducing and non‐reducing isomers, shows similar fermentation patterns as GOS in fecal microbiota of 2‐week‐old infants. Knowledge obtained on the substrate specificities of infant fecal microbiota and the subsequent regulatory effects of GOS, IMO and IMMP on DC responses might contribute to the design of tailored NDC mixtures for infants of different age groups.
Keywords: galacto‐oligosaccharides, in vitro fermentation, infant formula, isomalto/malto‐polysaccharides, isomalto‐oligosaccharides
The in vitro fermentation of galacto‐oligosaccharide (GOS), isomalto‐oligosaccharide preparation (IMO) and isomalto/malto‐polysaccharides (IMMP) by pooled fecal inocula of 2‐ and 8‐week‐old infants shows that next to the size, the highly variable structure of oligosaccharides shows a huge impact on the fermentability of non‐digestible carbohydrates (NDCs) by infant fecal microbiota. GOS, IMO as well as IMMP fermentation digesta attenuated cytokine profiles in immature dendritic cells of which the extent is dependent on the infants age and NDC structure.

1. Introduction
Non‐digestible carbohydrates (NDCs) are often added to cow's milk‐based infant formulas to replace specific functions of human milk oligosaccharides (HMOs),[ 1 ] such as stimulation of microbial colonization[ 2, 3 ] and development of the gut immune barrier.[ 4, 5, 6 ] Next to the commonly used galacto‐oligosaccharides (GOS), starch‐derived NDCs could be of interest for the substitution of infant formulas. For example, isomalto/malto‐polysaccharides (IMMP) and isomalto‐oligosaccharide preparations (IMO) have recently gained attention for the effects they exert on microbiota and the immune system of pigs, mice and adult humans.[ 7, 8, 9, 10, 11 ] However, much less is known about the effects of those molecules on infants and how they relate to the health beneficial properties reported for GOS that is commonly used in infant formula as prebiotic NDC.[ 12, 13, 14, 15 ]
GOS is comprised of a highly complex lactose‐based mixture of galactose chains with a terminal galactose or glucose unit. The degree of polymerization (DP) of GOS oligomers typically ranges from 2 to 8 with a large number of isomers varying in level of branching and type of glycosidic linkage, including β(1‐2), β(1‐3), β(1‐4) and β(1‐6) linkages.[ 16 ] Besides reducing GOS with a free anomeric carbon at the terminal position, also non‐reducing GOS containing a (1↔1) linkage have been reported.[ 17, 18, 19, 20 ] A recently developed characterization method showed that the commercial Vivinal GOS is more structurally diverse than anticipated.[ 20 ] Over 100 different structures were identified in Vivinal GOS, including a large variety of non‐reducing GOS isomers with different location and anomeric configuration of the (1↔1) linkage. In addition, reducing isomers with a mono‐ or di‐substituted reducing glucose residue were easily distinguished based on MS2 fragmentation.[ 20 ]
For GOS, there are multiple studies available showing beneficial effects on gut microbiota composition in infants. For example, Matsuki et al.[ 12 ] showed that supplementation of infant formula with GOS stimulated the abundance of indigenous Bifidobacteria in the fecal microbiota in 0–2‐month‐old infants. In another study, in which infants were fed with GOS supplemented infant formula, an increase in Bifidobacterium abundance was also observed at 4 months of age compared to infants receiving formula without GOS.[ 13 ] Depending on the type of bacteria and its role in the microbial community, specific short chain fatty acids (SCFAs) with immuno‐modulatory properties such as butyrate, propionate and acetate, are produced upon fermentation.[ 21, 22 ] Besides their health benefits through fermentation, GOS can also directly affect epithelial and immune cell populations in the GI tract.[ 14, 15 ] For example, it was shown that GOS could attenuate the pro‐inflammatory cytokine responses induced during co‐culturing of epithelial cells with dendritic cells (DCs),[ 15 ] which are important antigen‐presenting cells present under the epithelial lining of the GI tract.[ 23 ] DCs are able to sample the luminal content by protruding their dendrites into the lumen,[ 24 ] which makes it highly likely that dendritic cells in infants can interact with the NDCs, but also with the different categories of bacterial metabolites present in the gut lumen.
Besides the commonly used GOS, IMO and IMMP are promising NDCs for the introduction in infant formula as they are both derived from starch, one of the most abundant and renewable polysaccharides available. Despite the fact that IMOs have shown to be partly digested by pancreatic amylase and intestinal brush border enzymes in vitro,[ 25 ] the prebiotic function has been confirmed in vivo in rats and pigs.[ 7, 26 ] IMO are produced from starch using enzymes from diverse glycosyl hydrolase (GH) families.[ 27 ] The enzymes exhibit transferase, hydrolytic or branching activity, which results in a mixture of α‐linked gluco‐oligomers varying in type of glycosidic linkage and DP (2–10).[ 27, 28 ] Production technologies used nowadays differ in the number and type of enzymes used, which results in the production of structurally distinct IMO preparations.[ 29, 30, 31 ] IMMPs are produced from starch as well, using 4,6‐α‐glucanotransferase. The enzyme introduces consecutive α(1‐6) linkages onto linear α(1‐4)‐linked gluco‐oligosaccharides, resulting in oligo‐ and polysaccharides that are less digestible in the small intestine.[ 32, 33, 34 ] The ratio between the two types of glycosidic linkages is dependent on the starch source, the enzyme used and the process conditions.[ 34 ] IMMPs are characterized by a broad molecular weight distribution reaching up to 65 kDa.[ 9 ] The potential prebiotic function of IMMP has been indicated in previous research, in which IMMP showed to be degradable by adult human gut microbiota.[ 9 ]
Interestingly, fermentation of IMO by adult fecal microbiota was shown to promote the growth of Bifidobacterium in a size‐specific fashion[ 8 ] since larger IMO stimulated the growth of Bifidobacterium in subjects with the Prevotella‐dominated enterotype more compared to smaller IMO. IMMP was also shown to be utilized in a size‐specific fashion by adult fecal microbiota, which coincided with an increase in relative abundance of Bifidobacterium and Lactobacillus.[ 9 ] In addition, the degradation rate was negatively correlated with the percentage of α(1‐6)‐linked glucose residues present in IMMP. This property could be of relevance when targeting glycosidic fermentation in the distal colon. Knowledge on microbiota‐dependent and direct immune effects of IMO and IMMP in infants or adults is still lacking. Nevertheless, the in vivo study by Wu et al.[ 7 ] reported promising effects of IMO supplementation on intestinal health and immune function in weaned piglets.
Nowadays, a growing volume of evidence is indicating that the health benefits exerted by NDCs are largely depending on the structure of the individual poly‐ and oligosaccharides present in the NDC mixtures.[ 8, 9, 35, 36, 37, 38, 39, 40 ] Therefore, keeping in mind the structural complexity of NDCs, it is of great importance to study NDC composition during biological processes in more detail to evaluate their potential for the supplementation of infant formulas. Since the microbiota composition and NDC‐degrading capacity develops rapidly after birth,[ 39, 40, 41 ] we investigated the fermentation of GOS, IMO and IMMP in an in vitro set‐up using pooled fecal inoculum of both 2‐ and 8‐week‐old infants, i.e., age classes for which we have previously shown different fermentation capacities.[ 39, 40 ] The fermentation characteristics of GOS were compared with IMO and IMMP, by zooming into the degradation of individual GOS and IMO DP3 isomers. The DP3 isomers are most abundant in the complex mixtures, and will also give insight in the fermentability of higher DPs. In addition, immature DCs were incubated with samples taken during the fermentations, to evaluate their effect on immune modulatory responses and cytokine production.
2. Experimental Section
2.1. Substrates
Purified Vivinal GOS (<3% monomers and lactose [w/w dry matter]) was kindly provided by Friesland Campina Ingredients (Amersfoort, The Netherlands). To obtain purified Vivinal GOS, the lactose present in Vivinal GOS was hydrolyzed by a β‐galactosidase with high lactose specificity, followed by removal of the monosaccharides by nanofiltration. In our previous publication we extensively discussed the oligosaccharide composition of purified Vivinal GOS, which is relevant for reproducibility and side‐by‐side comparison of data from different studies.[ 20 ]
The IMO preparation Vitafiber (BioNeutra, Edmonton, Canada) and IMMP were kindly provided by Avebe (Groningen, The Netherlands). IMMP (91% α(1‐6) linkages) was synthesized from debranched Etenia 457 starch (Avebe) using 4,6‐α‐glucanotransferase with N‐terminal truncation as reported elsewhere.[ 34 ]
2.2. Fermentation of GOS, IMO and IMMP by Infant Fecal Inoculum
2.2.1. Culture Medium
Standard ileal efflux medium (SIEM) was prepared as described previously with minor modifications.[ 9 ] Background fermentation was minimized by adding a low amount of carbohydrates (0.24 g L−1 SIEM). The carbohydrate medium component contained (g L−1): pectin, 12; xylan, 12; arabinogalactan, 12; amylopectin, 12; and starch, 100. The salt medium component contained NaCl (9 g L−1). The pH was adjusted to 5.8 using 2‐(N‐morpholino)ethanesulfonic acid (MES) buffer.
2.2.2. Fecal Inoculum
Parental written informed consent was provided for all infants. Since fecal donations from healthy volunteers are considered as noninvasive, the medical ethical committee approval was not required in the Netherlands. The fecal samples were collected from four vaginally born and exclusively breast‐fed infants. The infants did not have health issues and did not receive antibiotic treatment. At an age of 2 and 8 weeks, fecal material was collected directly after defecation from the diaper. The fecal material was immediately transferred to tubes and stored at ‐20 °C in home freezers, before being transported and stored at ‐80 °C. Pooled infant fecal inocula were prepared by combining the fecal material of the four infants (4 × 0.1 g) as reported elsewhere.[ 40 ] The bacterial functionality of the pooled infant fecal inoculum largely resembled the bacterial functionality of the fecal inocula of the infant population in general.[ 42 ]
2.2.3. In Vitro Fermentation
The in vitro fermentations were executed in duplicate as described elsewhere.[ 40 ] All handling procedures were performed in an anaerobic chamber (gas phase: 4% H2, 15% CO2 and 81% N2) (Bactron 300, Sheldon Manufacturing, Cornelius, USA). In short, the pooled fecal inoculum was combined with SIEM containing GOS, IMO or IMMP in sterile fermentation flasks in a ratio of 1:10 v/v with a total volume of 54 mL. The final concentration of GOS, IMO and IMMP in the fermentation liquid was 10 mg mL−1. Samples were collected with a syringe in triplicate at the start and after 14, 20, and 26 h. One sample collected at each fermentation time was immediately frozen in liquid nitrogen and stored at ‐80 °C to preserve the bacteria for later microbial analysis. The other two samples collected at the same time were heated for 5 min in a boiling water batch to inactivate enzymes present and subsequently stored at ‐20 °C until further analysis.
The following control fermentations were included: (1) inoculum without added GOS, IMO or IMMP to monitor background fermentation, (2) GOS, IMO or IMMP without inoculum to monitor contamination
2.3. Fate of GOS, IMO and IMMP Upon Fermentation
2.3.1. UHPLC‐PGC‐MS
To study the fate of individual isomers with different degrees of polymerization, GOS and IMO were analyzed on an Accela ultra‐high‐performance liquid chromatography (UHPLC) system (Thermo Scientific, San Jose, CA, USA) coupled to a mass spectrometer (LTQ Velos Pro ion trap MS, Thermo Scientific) as described elsewhere with minor modification of the eluent profile.[ 20 ] For the analysis of GOS, mobile phase A (ULC−MS water + 0.1% v/v formic acid) and B (acetonitrile + 0.1% v/v formic acid) were eluted as follows: 0–2 min, 3% B; 2–51.7 min, 3–11% B; 51.7–58.6 min, 11–15% B; 58.6–60.2 min, 15–100% B; 60.2–68.0 min, 100% B; 68.0–69.5, 100–3% B and 69.5–77.3 min, 3% B. For the analysis of IMO, mobile phase A and B were eluted as follows: 0–2 min, 2% B; 2–23.7 min, 2–9% B; 23.7–49.6 min, 9–14% B; 49.6–51.1 min, 14–100% B; 51.1–58.9 min, 100% B; 58.9–60.5, 100–2% B and 60.5–68.2 min, 2% B. Samples (1 µL, 0.25 mg mL−1) were injected on a Hypercarb porous graphitic carbon (PGC) column (3 µm particle size, 2.1 mm x 150 mm) in combination with a Hypercarb guard column (3 µm particle size, 2 mm x 10 mm; Thermo Scientific). The temperatures of the autosampler and column oven were controlled at 10 °C and 55 °C respectively. Prior to analysis fermentation samples were reduced using sodium borohydride to avoid the anomerization of oligosaccharides, followed by a purification step using solid phase extraction.[ 42 ]
DP3 standards β‐3’‐galactosyl‐lactose (Carbosynth, Berkshire, UK), β‐4’‐galactosyl‐lactose (Carbosynth), β‐6’‐galactosyl‐lactose (Carbosynth), maltotriose (Sigma‐Aldrich, St. Louis, MO, USA), isomaltotriose (Sigma‐Aldrich, St. Louis, MO, USA) and panose (α‐D‐Glcp‐(1→6)‐α‐D‐Glcp‐(1→4)‐D‐Glc) (Megazyme, Bray, Ireland) were used for the identification of GOS and IMO DP3 isomers. The other individual GOS and IMO DP3 isomers were characterized using MS fragmentation rules and NMR analysis of purified isomers as described in previous study for GOS.[ 20 ] The settings of the preparative UHPLC‐PGC‐MS method as developed for GOS[ 20 ] were slightly adjusted in order to collect purified IMO isomers present in the DP3 fraction (500 µL, 40 mg mL−1). In short, the flow rate was set at 17 mL min−1 and the fraction size at 7.48 mL. Mobile phase A (ULC−MS water + 0.1% v/v formic acid) and B (ACN + 0.1% v/v formic acid) were eluted as follows: 0−1.29 min, 4% B; 1.29–70.25 min, 4–20% B; 70.52–73.13 min, 20−100% B; 73.13−86.22 min, 100% B, 86.22–88.84 min, 100–4% B, followed by equilibration at 4% B.
2.3.2. High‐Performance Size Exclusion Chromatography (HPSEC)
The degradation of IMMP during fermentation was monitored by HPSEC (Ultimate 3000 HPLC system (Dionex, Sunnyvale, CA, USA) equipped with a Shodex RI‐101 refractive index detector (Showa Denko, Tokyo, Japan)) as reported elsewhere.[ 40 ] The samples were injected into three TSK‐Gel columns connected in series (4000‐3000‐2500 SuperAW; 150 × 6 mm), preceded by a TSK Super AW‐L guard column (35 × 4.6 mm) (Tosoh Bioscience, Tokyo, Japan). Pullulan standards (Polymer Laboratories, Palo Alto, CA, USA) were used for calibration.
2.4. Production of SCFAs and Other Organic Acids During Fermentation
To quantify the production of SCFAs during fermentation, fermentation samples were analyzed by gas chromatography according to the procedures used by Akkerman et al.[ 40 ] The production of the non‐volatile organic acids succinate and lactate, was quantified by high‐performance liquid chromatography.[ 43 ]
2.5. Microbial Composition Analysis
DNA extraction and PCR amplification of the V5‐V6 region of 16S ribosomal RNA (rRNA) genes with the forward and reverse barcoded primers BSF784 (RGGATTAGATACCC) and R1064 (CGACRRCCATGCANACCT), were executed as described previously.[ 40 ] Ten microliter of DNA template was used for t0 samples which contained 1.7–4.3 ng µL−1 DNA template. For samples with higher DNA concentrations, 0.7 µL of DNA template was used. Two synthetic communities with known composition were included as positive controls.[ 44 ]
After PCR amplification, products were purified and prepared for sequencing as reported elsewhere.[ 40 ] In short, two amplicon pools were formed by combining 200 ng of each barcoded sample and subsequently concentrated to 50 µL volume using the HighPrep PCR kit (MagBio Genomics, Alphen aan den Rijn, The Netherlands). Libraries were sent for adapter ligation and sequencing on an Illumina Hiseq2500 instrument (GATC‐Biotech, Konstanz, Germany).
The raw 16S rRNA gene amplicon sequencing data was processed and analyzed using the NG‐Tax 2.0 pipeline, with default settings and R version 3.5.0.[ 45 ] SILVA reference database release 132[ 46 ] was used for taxonomic classification. Relative abundances of bacteria at genus level were visualized using a bar plot by applying the functions tax_glom and transform in the phyloseq [ 47 ] and microbiome [ 48 ] R package respectively.
2.6. Stimulation of DCs with GOS, IMO and IMMP Fermentation Digesta
2.6.1. Dendritic cell Culture and Stimulation
To evaluate the immune stimulatory effects of fermentation digesta of GOS, IMO and IMMP on immature DC cytokine responses, DCs generated from umbilical cord blood CD34+ progenitor cells (hematopoietic stem cells) (MatTek Corporation, Ashland, MA, USA), were incubated with digesta for 48 h and subsequently cytokine levels in the supernatant were measured. Briefly, the DCs were thawed and seeded into 96‐well plates at a density of 70 × 104 cells well−1 in a volume of 200 µL and cultured for 24 h (37 ⁰C, 21% O2 and 5% CO2). After 24 h the cells were attached and medium could be replaced with medium containing the fermentation digesta. Before the digesta were diluted in the culture medium containing 50 ng mL−1 Polymyxin‐B (Invivogen, San Diego, CA, USA), bacteria were removed from the fermentation digesta by centrifugation (10 min, RT, 12,000 x g). Subsequently the supernatants were filtered through a 0.2 µm filter, diluted in DC‐MM culture medium (MatTek Corporation) at a ratio of 1:10 and added to the wells. The pH was set at 7.4 by the addition of 2 M NaOH. After 48 h of incubation, supernatants were collected and stored at ‐20 ⁰C until further analysis. Experiments were repeated six times.
2.6.2. Assessment of Cytokine Expression
To measure the levels of MCP‐1/CCL2, MIP‐1α/CCL3, IL‐1β, IL‐6, IL‐10 and TNFα in the DC supernatant a magnetic Luminex Assay (R&D systems, Biotechne, Minneapolis, USA) was used according to manufacturer's protocol. Briefly, antibody magnetic bead mix was added to a 96‐well plate. Cytokine standards were re‐suspended and serial dilutions were prepared. Standards and sample were added and incubated overnight at 4 ⁰C. After washing, detection antibodies were added and the plate was incubated for 30 min at RT while shaking. After incubation, the plate was washed again and incubated with streptavidin‐PE for 30 min at RT while shaking. Finally, the plate was washed again and 100 µL of wash buffer was added to each well. The plate was analyzed using a Luminex 200 System. The data obtained were analyzed using the Luminex xPONENT software.
2.6.3. Statistical Analysis
Statistical tests were performed using Prism 8 software (GraphPad, San Diego, CA, USA). Outliers were removed after testing using a Grubbs outlier test (alpha = 0.05). Data are shown as averages and error bars represent standard error means. Data was distributed normally and analyzed using a mixed‐effects model (REML) to test for differences between groups, followed by a Tukey's multiple comparisons test to compare the induced cytokine responses of the digesta of different substrates to the blank control and to compare the responses induced by digesta from fermentations with inoculum of 2‐ and 8‐week‐old infants.
3. Results
3.1. Vivinal GOS and the IMO Preparation Vitafiber are Structurally Highly Complex
Knowledge on the initial composition of NDCs is crucial for increasing our understanding of structure‐specific fermentability and immune effects of NDCs. Purified Vivinal GOS and the IMO preparation Vitafiber were analyzed by UHPLC‐PGC‐MS and NMR to characterize the individual components present in these commercial preparations with a strong focus on the DP3 isomers as these are most abundant and will also give insight into the structure and consequent fermentability of higher DPs. The composition of Vivinal GOS is extensively discussed in our previous work.[ 20 ] The most abundant reducing (20) and non‐reducing (11) GOS DP3 isomers, representing 44% of the total GOS preparation, are summarized in Tables S1 and S2, Supporting Information. The reducing isomers were most dominant as they contributed to 88% of total GOS DP3, based on peak areas as determined by UHPLC‐PGC‐MS.
The IMO preparation Vitafiber is composed of many structurally different oligosaccharides in the DP range 2–6 with 19% DP2, 44% DP3, 24% DP4, 9% DP5 and 4% DP6 (Figure 1). The DP2 fraction was for 60% composed of isomaltose (Figure S1, Supporting Information). In total nine reducing and six non‐reducing [(1↔1)‐linked] DP3 isomers were detected by UHPLC‐PGC‐MS (Figure 2), from which the reducing isomers were most abundant in total IMO DP3 (96%). NMR was applied for the characterization of three purified reducing (Figure 2; no. 1r, 3r, 8r) and three purified non‐reducing DP3 isomers (Figure 2; no. 1n, 2n and 5n) (Table S3, Supporting Information and provided explanation). Together with the use of available references and MS fragmentation rules as described for GOS,[ 20 ] conclusive or tentative characterization of 13 out 15 DP3 isomers was accomplished. MS2 fragmentation of IMO DP3 isomers is summarized in Table S4, Supporting Information. The variation in type of the glycosidic linkage partly explains the large diversity of reducing and non‐reducing isomers. In addition, similar to GOS, non‐reducing isomers with different position of the (1↔1) linkage were identified, e.g., β‐D‐Glcp‐(1↔1)‐α‐D‐Glcp‐(6←1)‐α‐D‐Glcp and α‐D‐Glcp‐(1→6)‐β‐D‐Glcp‐(1↔1)‐α‐D‐Glcp. Furthermore, DP3 isomers with a di‐substituted reducing terminal glucose were shown to be present in the IMO preparation.
Figure 1.

UHPLC‐PGC‐MS profile of reducing and non‐reducing oligosaccharides present in the IMO preparation Vitafiber and of DP 2‐6 after selection of the appropriate m/z for that DP. All elution profiles were normalized to the actual contribution of each DP to the total mixture. Annotation of individual reducing and non‐reducing IMO DP3 isomers is presented in Figure 2.
Figure 2.

Overview of conclusively and tentatively characterized or unknown reducing (A) and non‐reducing (B) DP3 isomers present in the IMO preparation Vitafiber. The peak numbers of the characterized isomers correspond to the peak numbers in Figure 7.
3.2. Size‐Specific Fermentation of GOS and IMO by Infant Fecal Microbiota
To monitor the fermentability of GOS, IMO and IMMP by infant fecal microbiota, fermentation digesta were analyzed by UHPLC‐PGC‐MS and HPSEC for the latter. First, the fermentability of the total GOS and IMO, as well as the fermentability of their size populations was assessed. GOS was degraded by fecal microbiota of both 2‐ and 8‐week‐old infants (Figure 3A,B). After 14 h of fermentation by fecal microbiota of 2‐week‐old infants, 81 ± 2% of all GOS structures remained, decreasing to 17 ± 5% after 26 h of fermentation. The fermentation rate was slightly higher with fecal microbiota of 8‐week‐old infants as 70 ± 3% and 12 ± 0.1% remained after 14 and 26 h of fermentation, respectively. Both with fecal microbiota of 2‐ and 8‐week‐old infants, the fermentability was negatively correlated with the size of the oligosaccharides. Although present in minor amounts in the initial GOS preparation, still more than 60% of GOS DP6 remained after 26 h of fermentation with both inocula.
Figure 3.

Relative abundance of oligosaccharides present in Vivinal GOS (A/B) andin the IMO preparation Vitafiber (C/D) at the start and after 14, 20 and 26 hof in vitro fermentation using fecal inoculum of 2 (A/C) and 8‐ (B/D)week‐old infants. Analysis was performed by UHPLC‐PGC‐MS. Concentrations per DP in the original GOS and IMO preparation were set to 100%.
In contrast to GOS, the oligomers present in the IMO preparation were not degraded in the first 14 h of fermentation by fecal microbiota of 2‐ and 8‐week‐old infants (Figure 3C,D). After 26 h of fermentation by fecal microbiota of 2‐week‐old infants, 18 ± 1% of IMO was remaining. IMO was degraded to a lesser extent by fecal microbiota of 8‐week‐old infants as 51 ± 4% remained after 26 h of fermentation. Similar to GOS, the fermentability of IMO by fecal microbiota of both 2‐ and 8‐week‐old infants was negatively correlated with the size of the oligosaccharides present in the IMO preparation. The high relative abundance of DP2 oligomers during the first 20 h of fermentation by fecal microbiota of 2‐week‐old infants could presumably be assigned to their formation upon degradation of higher DP oligomers. Nevertheless, after 26 h of fermentation, less than 18% of the DP2 oligomers remained.
Contrary to IMO, IMMP which is composed of a high variety of sequences of α(1‐6)‐linked glucose residues with a broad molecular weight distribution (DP 8–320), was not utilized by the fecal microbiota of both 2‐ and 8‐week‐old infants at all since no change in molecular weight distribution was observed upon incubation with fecal microbiota (Figure 4).
Figure 4.

HPSEC profiles of IMMP at the start and after 14, 20 and 26 h offermentation using pooled fecal inoculum of 2‐ (A) and 8‐ (B) week‐old infants.Calibration of the system using pullulan standards is indicated.
3.3. Isomer‐Specific Fermentation of GOS and IMO by Infant Fecal Microbiota
Since only GOS and IMO were utilized by infant fecal microbiota, further analysis on isomer‐specific fermentability was limited to these NDCs. The isomer‐specific fermentability was investigated by monitoring the individual DP3 oligomers in the fermentation digesta by UHPLC‐PGC‐MS. The DP3 isomers are most abundant and understanding the fermentation of DP3 isomers also contributes to unraveling the structure‐specific fermentability of higher DPs.
The fermentation of GOS DP3 showed isomer‐specific degradation with a preference for oligomers with a mono‐substituted reducing glucose residue. The GOS DP3 isomers with a di‐substituted reducing glucose residue (Table S1, Supporting Information; no. 1r, 2r, 5r, 9r, and 18r) remained virtually intact after 26 h of fermentation by fecal microbiota of 2‐week‐old infants (Figure 5A). With fecal microbiota of 8‐week‐old infants, the preference was more pronounced as exclusively GOS DP3 isomers with a di‐substituted reducing glucose residue were remaining after 20 h of fermentation (Figure 5C). Besides the type of substitution, the fermentability showed to depend on the type of glycosidic linkage as the fermentability of the different reducing DP3 oligomers with a mono‐substituted reducing glucose residue differed to a large extent. The fecal microbiota of both 2‐ and 8‐week old infants required most time for the degradation of GOS DP3 oligomers with an (1‐4)‐linked galactose unit at the non‐reducing end (Table S1, Supporting Information; no. 8r: β‐D‐Galp‐(1→4)‐β‐D‐Galp‐(1→4)‐D‐Glc and 11r: β‐D‐Galp‐(1→4)‐β‐D‐Galp‐(1→2)‐D‐Glc) (Figure 5A/C). The DP3 isomers with a β(1‐6)‐linked galactose unit at the non‐reducing end (Table S1, Supporting Information; no. 4r: β‐D‐Galp‐(1→6)‐β‐D‐Galp‐(1→X)‐D‐Glc, 12r: β‐D‐Galp‐(1→6)‐β‐D‐Galp‐(1→X)‐D‐Glc and 15r: β‐D‐Galp‐(1→6)‐β‐D‐Galp‐(1→4)‐D‐Glc) and DP3 isomer 17r (β‐D‐Galp‐(1→3)‐β‐D‐Galp‐(1→4)‐D‐Glc), were the first to be completely degraded by fecal inocula of 2‐ and 8‐week‐old infants.
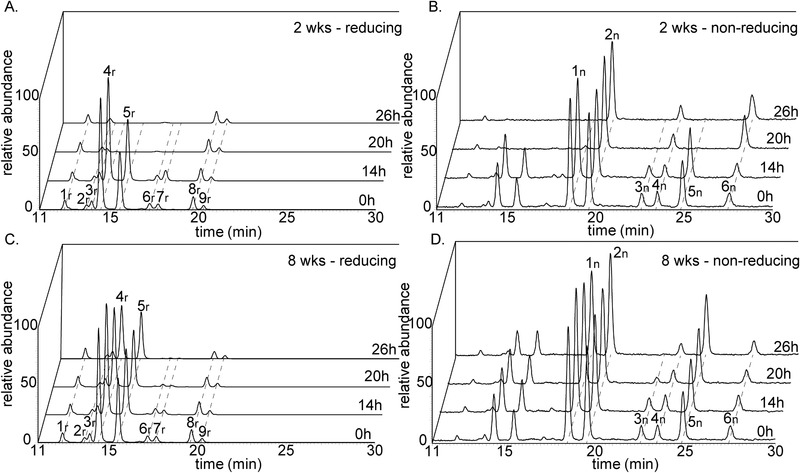
Figure 5.

UHPLC‐PGC‐MS profiles indicating reducing (m/z 505, 551 (M+FA)) (A/C) and non‐reducing (m/z 503, 549 (M+FA)) (B/D) DP3 isomers present in Vivinal GOS at the start and after 14, 20, and 26 h of fermentation using pooled fecal inoculum of 2‐ (A/B) and 8‐ (C/D) week‐old infants. Peak numbers correspond to the characterized isomers in Tables S1 and S2, Supporting Information with r: reducing isomers and n: non‐reducing isomers ((1↔1)‐linked). The most abundant peak in each chromatogram was set at 100%.
GOS fermentation led to an accumulation of non‐reducing DP3 isomers in the digesta with fecal microbiota of both 2‐ and 8‐week‐old infants (Figure 6). However, the resistance to fermentation was not only caused by the presence of the (1↔1) linkage. Several non‐reducing isomers (Table S2, Supporting Information; no. 1n, 3n, 9n, and 11n) were completely degraded within 20 h of fermentation by both inocula, whereas other non‐reducing isomers (Table S2, Supporting Information; 4n, 5n, and 8n) were still abundant after 26 h of fermentation (Figure 5B/D).
Figure 6.
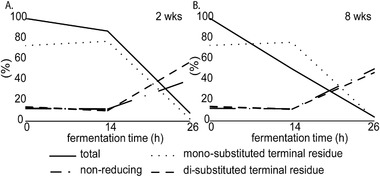
Percentage of total remaining DP3 isomers (solid line) during the in vitro fermentation of Vivinal GOS with fecal inoculum of 2‐ (A) and 8‐ (B) week‐old infants. The relative abundance of isomers with a mono‐ and di‐substituted terminal residue as well as non‐reducing isomers within the fermentation digesta at the given time point (sum of all DP3 isomers set at 100%) are presented as dotted and dashed lines.
The IMO DP3 oligomers were utilized in an isomer‐specific fashion by the fecal microbiota of 2‐ and 8‐week‐old infants. Infant fecal microbiota showed a similar resistance towards the fermentation of oligomers with a di‐substituted reducing glucose residue present in IMO preparation (Figure 2; no. 1r and 2r) as observed with GOS fermentation (Figure 7). More than 78% of the oligomers with a di‐substituted reducing glucose residue remained after 26 h of fermentation by fecal microbiota of 2‐ and 8‐week‐old infants, whereas the majority of the isomers with a mono‐substituted reducing glucose residue (Figure 2; no. 3r, 4r, 5r, 6r, and 7r) were fully utilized.
Figure 7.
UHPLC‐PGC‐MS profiles indicating reducing (m/z 505, 551 (M+FA)) (A/C) andnon‐reducing (m/z 503, 549 (M+FA)) (B/D) DP3 isomers present in the IMO preparation Vitafiber at the start and after 14, 20 and 26 h of fermentation using pooled fecal inoculum of 2‐ (A/B) and 8‐ (C/D) week‐old infants. Peak numbers correspond to the characterized isomers in Figure 2 with r: reducing isomers and n: non‐reducing isomers ((1↔1)‐linked). The most abundant peak ineach chromatogram was set at 100%.
The fermentability of the reducing IMO DP3 oligomers was also dependent on the type of glycosidic linkage. Infant fecal microbiota of both 2‐ and 8‐week‐old infants preferably utilized the IMO DP3 oligomers α‐D‐Glcp‐(1→6)‐α‐D‐Glcp‐(1→4)‐D‐Glc (no. 4r), α‐D‐Glcp‐(1→6)‐α‐D‐Glcp‐(1→6)‐D‐Glc (no. 5r), α‐D‐Glcp‐(1→4)‐α‐D‐Glcp‐(1→3/6)‐D‐Glc (no. 6r) and α‐D‐Glcp‐(1→4)‐α‐D‐Glcp‐(1→4)‐D‐Glc (no. 7r) over the DP3 oligomers α‐D‐Glcp‐(1→6)‐α‐D‐Glcp‐(1→3)‐D‐Glc (no. 3r) and α‐D‐Glcp‐(1→3)‐α‐D‐Glcp‐(1→4)‐D‐Glc (no. 8r) (Figure 2 and Figure 7A,C).
Similar to GOS, non‐reducing DP3 oligomers present in the IMO preparation were more resistant to fermentation than reducing DP3 oligomers (Figure 8). The non‐reducing DP3 oligomers contributed to 4% of the total amount of DP3 oligomers present in the initial IMO preparation, but increased up to 12% of the total amount of DP3 oligomers present in the digest collected after 26 h of fermentation by fecal microbiota of 2‐week‐old infants. With fecal microbiota of 8‐week‐old infants, the non‐reducing DP3 oligomers contributed to 6% of the total amount of DP3 oligomers present in the digest collected after 26 h of fermentation.
Figure 8.

Percentage of total remaining DP3 isomers (solid line) during the in vitro fermentation of the IMO preparation with fecal inoculum of 2‐ (A) and 8‐ (B) week‐old infants. The relative abundance of isomers with a mono‐ and di‐substituted terminal residue as well as non‐reducing isomers within the fermentation digesta at the given time point (sum of all DP3 isomers set at 100%) are given as dotted and dashed lines.
3.4. Age‐ and NDC‐Specific Increase in Bifidobacterium During Fermentation
To investigate the effect of the fermentation of GOS, IMO and medium supplemented with IMMP on the microbiota composition, 16S rRNA gene amplicon sequencing was performed. First, control fermentations without added NDCs (blank control) led to a decrease in relative abundance of Bifidobacterium in the first 14 h of fermentation from 41% to 3% and from 86% to 5% with fecal microbiota of 2‐ and 8‐week‐old infants, respectively (Figure S2, Supporting Information). Nevertheless, the absolute abundance of Bifidobacterium did not decrease throughout the fermentation as reflected by a large increase in the total number of bacteria in the first 14 h of fermentation from 6.7 to 10 log copy numbers/mL with fecal microbiota of 2‐week‐old infants and from 6.6 to 9.7 log copy numbers/mL with fecal microbiota of 8‐week‐old infants (Table S5, Supporting Information). Furthermore, the blank control fermentation led to an increase in Enterococcus and Escherichia‐Shigella, which can presumably be explained by the utilization of SIEM medium components such as bactopeptone, by these bacteria.
In contrast to the blank control fermentation, the fermentation of GOS by fecal microbiota of 2‐week‐old infants resulted in an increase in relative abundance of Bifidobacterium from 24 ± 3% to 63 ± 4% between 14 and 26 h of fermentation (Figure 9). The increase in relative abundance of Bifidobacterium was more pronounced in fecal microbiota of 8‐week‐old infants, from 53 ± 4% to 85 ± 7% between 14 and 26 h of fermentation. Similar to the blank control fermentation, background fermentation of SIEM medium components by Enterococcus and Escherichia‐Shigella was observed.
Figure 9.

Relative abundance of taxa at the highest classified taxonomy in duplicate fermentation digesta collected at the start and after 14 and 26 h of fermentation of GOS, IMO and medium supplemented with IMMP using pooled fecal inoculum of 2‐ (A) and 8‐ (B) week‐old infants.
The fermentation of IMO resulted in a less pronounced increase in relative abundance of Bifidobacterium than observed during GOS fermentation, from 4 ± 1% to 33 ± 3% between 14 and 26 h of fermentation with fecal microbiota of 2‐week‐old infants (Figure 9). In contrast, no considerable changes in relative abundance of Bifidobacterium were observed between 14 and 26 h of fermentation with fecal microbiota of 8‐week‐old infants. Similar to GOS and the blank control fermentation, Enterococcus and Escherichia‐Shigella were increased during fermentation of IMO by both inocula.
The fermentation of media supplemented with IMMP by both inocula did not result in considerable changes in the microbiota composition when compared to the control fermentation without added NDCs (Figure 9 and Figure S2, Supporting Information).
3.5. Acetate and Lactate Production During Fermentation of GOS and IMO by Infant Fecal Microbiota
SCFAs, lactate and succinate which have shown to have immunomodulatory activity,[ 21, 22 ] were quantified in the fermentation digesta collected during the fermentation of GOS, IMO and medium supplemented with IMMP by fecal microbiota of 2‐ and 8‐week‐old infants. The fermentation of GOS by fecal microbiota of 2‐ and 8‐week old infants resulted in significant production of organic acids compared to the control fermentation without added NDCs (Figure 10A,B and Figure S3, Supporting Information). A total organic acid level of 8.4 ± 0.9 µmol mg−1 was reached after 20 h of fermentation using fecal microbiota of 2‐week‐old infants, which increased up to 10.8 ± 0.4 µmol mg−1 after 26 h of fermentation (Figure 10A). Acetate, lactate, succinate, propionate and butyrate were produced in a ratio of 67.6:29.8:2:0.5:0.1. The organic acid concentrations were similar to those of fecal microbiota of 8‐week‐old infants, reaching a total level of 9 ± 0.7 and 10.4 ± 0.2 µmol mg−1 after 20 and 26 h of fermentation of GOS, respectively (Figure 10B). Acetate, lactate, succinate, propionate and butyrate were produced in a ratio of 63.2:34:2.2:0.5:0.1.
Figure 10.

Concentration of SCFAs, lactate and succinate in duplicate fermentation digesta collected at the start and after 14, 20, and 26 h from in vitro fermentation of GOS (A/B), the IMO preparation Vitafiber (C/D) and medium supplemented with IMMP (E/F) using pooled fecal inoculum of 2‐ (A/C/D) and 8‐ (B/D/F) week‐old infants.
In comparison to GOS, the fermentation of IMO by fecal microbiota of 2‐week‐old infants resulted in somewhat lower production of organic acids (Figure 10C). After 20 h of fermentation a total organic acid level of 7.6 ± 0.2 µmol mg−1 was reached, which further increased up to 9.4 ± 0.1 µmol mg−1 after 26 h of fermentation. Acetate, lactate, butyrate, succinate and propionate were produced in a ratio of 62.5:32.9:2.3:2.2:0.1. Production of organic acids was significantly lower with fecal microbiota of 8‐week‐old infants, reaching a total level of 3.9 ± 0.1 µmol mg−1 after 26 h of fermentation (Figure 10D). Acetate, lactate, succinate, propionate and butyrate were produced in a ratio of 49.5:38.3:10.8:1:0.4.
The fermentation of media supplemented with IMMP by fecal microbiota of 2‐ and 8‐week‐old infants resulted in a negligible total organic acid production of 1.2 ± 0.1 and 1.0 ± 0.1 µmol mg−1, respectively compared to the control fermentations without added NDCs (0.8 and 0.9 µmol mg−1; Figure S3, Supporting Information and Figure 10E,F), which confirms the limited fermentability of IMMP as observed by HPSEC.
3.6. Age‐ and NDC‐Specific Cytokine Induction by GOS, IMO, and IMMP Fermentation Digesta in Immature Dendritic Cells
As DCs are abundantly present under the epithelial lining of the gut,[ 24 ] we investigated the effect of the digesta of GOS, IMO and medium supplemented with IMMP fermented with fecal inoculum of either 2‐ or 8‐week‐old infants on DC cytokine responses. Since the incubation of DCs with t = 0 digesta of the blank control and all NDCs only resulted in low amounts of cytokine secretion, cytokine secretion at t = 0 was set at 1 for all groups. Incubation of DCs with digesta of the control fermentation with inocula of both 2‐ or 8‐week‐old infants without the addition of NDCs resulted in fermentation time dependent increases in cytokine production in DCs (Figure 11). Incubation of DCs with t = 14 and t = 26 digesta of the blank control fermentation with inoculum of 8‐week‐old infants resulted in significant higher levels of MIP‐1α/CCL3, IL‐1β, IL‐10 and TNFα when compared to the digesta of the blank fermentation with inoculum of 2‐week‐old infants. However, the incubation with the t = 26 digesta of the blank fermentation with inoculum of 8‐week‐old infants resulted in significant lower levels of IL‐6 when compared to the digesta of the blank fermentation with inoculum of 2‐week‐old infants.
Figure 11.
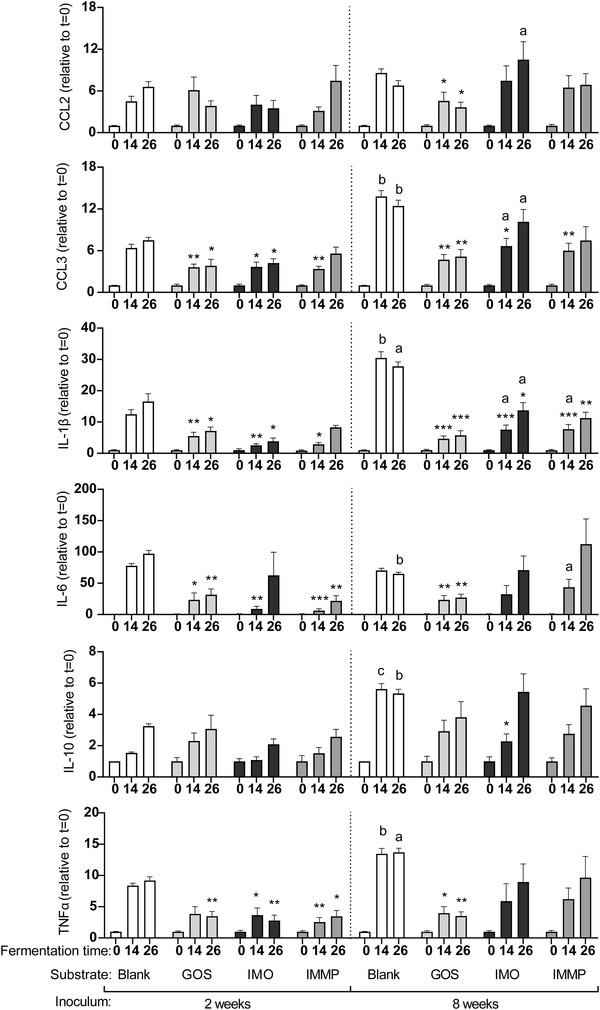
Cytokine secretion by DCs after incubation with digesta of the blank control, GOS, IMO or medium supplemented with IMMP fermented with fecal inoculum of 2‐ or 8‐week‐old infants taken at different timepoints during the fermentation. Statistical differences were tested using a mixed‐effects model (REML) test followed by a Tukey's multiple comparison test. Stars above bars represent statistical differences compared to the time‐matched blank fermentation samples (*p < 0.05, **p < 0.01, ***p < 0.001). Statistical differences between digesta of fermentations with inoculum of 2‐week‐old infants and the matched digesta of the fermentation with inoculum of 8‐week‐old infants are indicated above graphs (a p < 0.05, b p < 0.01, c p < 0.001,) (n = 6).
The digesta of GOS fermented with inoculum of 2‐week‐old infants attenuated the DC cytokine responses. Incubation of DCs with the t = 14 digesta resulted in a significant lower level of MIP‐1α/CCL3, IL‐1β, and IL‐6, while incubation with the t = 26 digesta of this fermentation resulted in significant lower levels of MIP‐1α/CCL3, IL‐1β, IL‐6, and TNFα when compared to the digesta of the blank fermentation. Digesta of the fermentation of GOS using inoculum of 8‐week‐old infants also resulted in an attenuation of cytokine responses compared to the digesta of the blank fermentation with inoculum of 8‐week‐old infants. Incubation with both the t = 14 and t = 26 digesta resulted in significant lower levels of MCP‐1/CCL2, MIP‐1α/CCL3, IL‐1β, IL‐6 and TNFα when compared to their matched blank controls. When cytokine responses induced by GOS digesta fermented with inoculum 2‐ and 8‐week‐old infants were compared, no significant differences in cytokine secretion patterns were found between the two age groups.
Like GOS, the digesta of IMO fermented with inoculum of 2‐week‐old infants also attenuated DC cytokine responses. The t = 14 digesta of this fermentation significantly reduced the levels of MIP‐1α/CCL3, IL‐1β, IL‐6 and TNFα, while the t = 26 digesta significantly reduced the levels of MIP‐1α/CCL3, IL‐1β and TNFα when compared to the digesta of the blank fermentation. The digesta of IMO fermented with inoculum of 8‐week‐old infants also had attenuating effects compared to the blank fermentation, however, to a lesser extent. Incubation of DCs with the t = 14 digesta resulted in significant lower levels of MIP‐1α/CCL3 and IL‐1β, while incubation with the t = 26 digesta of this fermentation only resulted in a significant lower level of IL‐1β. In addition, incubation with the t = 14 digesta fermented with inoculum of 8‐week‐old infants resulted in significant higher levels of MIP‐1α/CCL3 and IL‐1β when compared to the digesta fermented with inoculum of 2‐week‐old infants, while incubation of DCs with the t = 26 digesta of this fermentation resulted in significant higher levels of MIP‐1α/CCL3, IL‐1β and IL‐6.
Incubation of DCs with the t = 14 digesta of the medium supplemented with IMMP fermented with inoculum of 2‐week‐old infants resulted in a lower secretion of MIP‐1α/CCL3, IL‐1β, IL‐6 and TNFα, while incubation with t = 26 digesta of this fermentation resulted in lower secretion of IL‐6 and TNFα when compared to the blank control. Incubation of DCs with the t = 14 digesta of the fermentation of medium supplemented with IMMP fermented with inoculum of 8‐week‐old infants resulted in significant lower levels of MIP‐1α/CCL3 and IL‐1β, while the t = 26 digesta of this fermentation only reduced the level of MIP‐1α/CCL3 when compared to the blank control. In addition, incubation with the IMMP t = 14 digesta fermented with inoculum of 8‐week‐old infants resulted in significant higher levels of IL‐1β and IL‐6 when compared to the digesta fermented with inoculum of 2‐week‐old infants.
4. Discussion
Various NDCs including GOS, are often added to cow's milk‐based infant formula to partially substitute for the microbiota‐ and immune‐modulating properties of HMOs. However, it is not completely understood how structural factors (i.e., size, linkage‐types and monosaccharide composition) influence the health effects of NDCs. Hence, this study investigated the fermentability and consequent immune effects of GOS, IMO and IMMP in infants with a specific focus on the fate of individual DP3 isomers present in the complex NDC mixtures. The DP3 isomers are most abundant and understanding the fermentation of DP3 isomers also contributes to unraveling the structure‐specific fermentability of higher DPs. Recently, we discovered that Vivinal GOS is more structurally diverse than anticipated by using a newly developed high‐throughput characterization method based on UHPLC‐PGC‐MS.[ 20 ] More than 100 structures were identified, from which the most abundant reducing (20) and non‐reducing (11) DP3 isomers representing 44% of the total GOS preparation, were monitored to demonstrate the structure‐specific fermentability.
This characterization methodology originally developed for GOS,[ 20 ] also tremendously increased our understanding of the complexity of the IMO preparation Vitafiber. In total, nine reducing and six non‐reducing DP3 isomers were detected, which represented 44% of the total IMO preparation. Earlier HPAEC‐PAD analysis of starch‐derived IMO preparations only recognized four different reducing DP3 isomers.[ 49 ] The presence of non‐reducing isomers in starch‐derived IMO has not been reported before, presumably due to their low abundance (4% of total DP3). In total 13 out of 15, DP3 isomers were characterized with the use of established carbohydrate MS fragmentation rules[ 20, 50, 51 ] and NMR analysis of purified isomers. Interestingly, similar to GOS, we identified non‐reducing isomers with different position of the (1↔1) linkage, e.g., the IMO β‐D‐Glcp‐(1↔1)‐α‐D‐Glcp‐(6←1)‐α‐D‐Glcp and α‐D‐Glcp‐(1→6)‐β‐D‐Glcp‐(1↔1)‐α‐D‐Glcp. Additionally, similar to GOS, we characterized oligomers with a di‐substituted reducing terminal glucose in the IMO preparation, which remained unnoticed in previous research.
Recently, the non‐digestible nature of IMO but also of the commonly applied GOS, have been questioned due to their digestion by intestinal brush border enzymes in vitro.[ 25, 52 ] This limitation has only a minor impact when studying the fermentability of carbohydrates during early infancy, which is characterized by an overall lowered digestive capacity.[ 53 ] Hence, it can be assumed that in vivo the infant microbiota in the large intestine will encounter the largest part of the NDCs preparations, and that they are able to ferment them. In the in vivo situation, the bacterial metabolites produced upon fermentation of NDCs are able to influence the different layers of the intestinal barrier, including the immune cells present under the epithelial layer. DCs are antigen‐presenting immune cells that can protrude their dendrites through the epithelial layer and come in contact with the luminal content.[ 24 ] This, in combination with the highly permeable and relatively immature intestinal barrier that allows a non‐selective transfer of macromolecules over the epithelial barrier,[ 54 ] makes it likely that the luminal content influences DC maturation.
The commonly used Vivinal GOS was degraded by infant fecal microbiota, with similar structure selectivity for 2‐ and 8‐week‐old infants. The degradation coincided with an increase in relative abundance of Bifidobacterium as well as with the production of acetate and lactate, the main end products of the bifid shunt.[ 55 ] The bifidogenic effect of GOS is widely supported in vivo in infants at different ages as reviewed by Vandenplas et al.[ 56 ] IMO was also shown to be degradable by infant fecal microbiota, although at a lower rate compared to GOS. The preference of infant fecal microbiota for β‐linked galacto‐oligomers present in GOS over α‐linked gluco‐oligomers present in IMO is in line with the HMO‐adapted metabolic activity of the gut microbiota of the exclusively breast‐fed infants included in this study[ 57 ] as HMOs exhibit significant structural overlap with GOS.
In contrast to GOS, the degradation of IMO was dependent on infants age. The oligomers present in the IMO preparation were degraded to a larger extent by fecal microbiota of 2‐week‐old infants than by fecal microbiota of 8‐week‐old infants, which indicates the potential of tailored NDC preparations for infants of different age. The differences in fermentability of IMO between the age groups could possibly be ascribed to differences in microbiota composition on species level. However, confirmation was hindered by sequence similarity of the 16S rRNA gene between different species within the same genus.[ 58 ] Compared to GOS, the degradation of IMO by fecal microbiota of 2‐week‐old infants coincided with a less pronounced increase in relative abundance of Bifidobacterium and a lower production of acetate and lactate. Strikingly, whereas 50% of IMO was degraded by the fecal microbiota of 8‐week‐old infants, no changes in microbiota composition and organic acid production were observed compared to the control fermentation without added NDCs. Although infant fecal microbiota has not encountered α‐linked gluco‐oligomers before due to their absence in the human milk, the degradation of IMO could presumably be ascribed to the most dominant bifidobacterial species in breast‐fed infants; Bifidobacterium breve.[ 59 ] The genome of B. breve contains genes encoding oligo‐1,6‐α‐glucosidase, which can cleave the bonds between the glucose units present in the most abundant IMO DP3 isomers.[ 60 ] The bifidogenic effect of IMO has previously also been observed in vitro using adult fecal inoculum and bifidobacterial isolates.[ 8, 61 ]
The fermentability of the oligomers present in GOS and IMO by infant fecal microbiota was negatively correlated with oligomer size. This finding is in line with the intracellular degradation strategy of Bifidobacterium.[ 62 ] The intracellular degradation requires the uptake of the NDCs into the bacterial cell via specific transporter systems.[ 63 ] The size of the NDCs could limit this transport as exemplified for the degradation of long‐chain inulin by individual bifidobacterial strains.[ 64 ] The preferred utilization of oligomers with a lower DP was also reported in a previous fermentation study concerning adult fecal microbiota in combination with GOS.[ 36 ] UHPLC‐PGC‐MS also facilitated the monitoring of the degradation of individual isomers present in GOS and IMO. This aspect is often ignored in previous studies due to the structural complexity of NDCs.
The fermentability of the reducing GOS and IMO isomers was dependent on the substitution of the terminal reducing residue. Notably, DP3 isomers with a mono‐substituted reducing glucose residue were preferably fermented by fecal microbiota of 2‐ and 8‐week‐old infants. The differences in fermentability between the individual reducing GOS and IMO DP3 oligomers with a mono‐substituted reducing glucose residue can be explained by different types of glycosidic linkages present. For GOS, β‐D‐Galp‐(1→3)‐β‐D‐Galp‐(1→4)‐D‐Glc was most preferred by the microbiota, followed by DP3 oligomers with an β(1‐6)‐linked galactose unit at the non‐reducing end. Infant fecal microbiota required most time for the degradation of GOS DP3 oligomers with an β(1‐4)‐linked galactose unit at the non‐reducing end. This is in contrast to adult fecal microbiota, which preferred β(1‐4)‐linked GOS DP3 oligomers over other DP3 oligomers in a previous in vitro study.[ 36 ] The differences in preferential utilization of GOS oligomers are in line with the development of the gut microbial functionality upon aging.[ 65 ] In contrast to GOS, fermentation of the α‐linked gluco‐oligomers by infant fecal microbiota showed a clear preference for oligomers with an α(1‐4)‐linked glucose unit at the non‐reducing end over α‐D‐Glcp‐(1→3)‐α‐D‐Glcp‐(1→4)‐D‐Glc. Hence, the preference for specific type of glycosidic linkages by the infant fecal bacteria is suggested to be dependent on the monomer composition and anomeric configuration.
Overall, we are now able to describe differences in fermentability between individual non‐reducing GOS and IMO isomers. Previous research has established that purified bifidobacterial enzymes are capable of hydrolyzing non‐reducing GOS DP2[ 66 ] and the α(1↔1) linkage in trehalulose, a reducing isomer of sucrose.[ 60 ] Due to the chromatographic resolution of PGC, we discovered that specific non‐reducing GOS and IMO DP3 isomers are highly resistant to fermentation by infant fecal microbiota. The resistance to fermentation was dependent on the position of the (1↔1) linkage. For example, the non‐reducing IMO isomer beta‐D‐Glcp‐(1↔1)‐α‐D‐Glcp‐(6←1)‐α‐D‐Glcp (Figure 2; no 1n) was completely utilized after 26 h of fermentation by inocula of both 2‐ and 8‐week‐old infants, whereas isomer alpha‐D‐Glcp‐(1→6)‐β‐D‐Glcp‐(1↔1)‐α‐D‐Glcp (Figure 2; no 2n) remained virtually intact.
IMMP (1.4–52 kDa, 91% α(1‐6) linkages), which is also derived from starch but considerably larger than the oligomers present in the IMO preparation (0.3–1 kDa), was not degraded by fecal microbiota of 2‐ and 8‐week‐old infants. Previously, Bifidobacterium breve, one of the predominant species in the infant gut,[ 59 ] showed to be capable of degrading IMMP‐like exopolysaccharides containing up to 35% α(1‐6) linkages in a single culture fermentation.[ 67 ] The degradation was ascribed to the activity of amylopullulanase. This enzyme requires two α(1‐4)‐linked glucose units connected to both sides of the α(1‐6)‐linked glucose units.[ 68 ] The high percentage of α(1‐6) linkages in the IMMP included in this study presumably hindered the amylopullulanase activity, which could explain the resistance to fermentation by infant fecal microbiota.
In contrast to infant fecal microbiota, adult fecal microbiota has shown to be capable of degrading IMMP with different percentages of α(1‐6)‐linked glucose residues (27–96%).[ 9 ] Similar age‐dependency was shown for the degradation of native oat β‐glucans containing both β(1‐3)‐ and β(1‐4)‐linked glucose residues (300 kDa)[ 40, 69 ] and derived oligomers derived herefrom,[ 40, 69 ] which suggests that the large size forms a considerable barrier in fermentability of carbohydrates in early infancy. This finding is supported by the analysis of metagenomes from infant feces that showed an increase in genes encoding carbohydrate‐binding modules and endo‐acting enzymes responsible for the cleavage of polysaccharides upon the introduction of solid food, which coincides with a shift from a Bifidobacterium‐rich community towards a Bacteroides‐rich community.[ 70 ]
Fermentation digesta of all NDCs and the control without added NDCs induced fermentation‐time dependent cytokine responses in immature dendritic cells. The t = 0 digesta of all fermentations taken before the start of the fermentation with inoculum of either 2‐ or 8‐week‐old infants, only induced low levels of all chemokines and cytokines, indicating that the intact NDCs do not stimulate the DCs, which is in line with previous observations by Bermudez‐Brito et al., who also observed only mild activation of DCs by direct contact with intact fiber.[ 15 ] Incubation of DCs with the 14 and 26 h digesta of the control without added NDCs fermented with inoculum of either 2‐ or 8‐week‐old infants resulted in a higher chemokine and cytokine production in DCs than observed with fermentation digesta of all NDCs. The formation of pro‐inflammatory products including bacterial exopolysaccharides, cell wall components and nucleic acids[ 71 ] are likely responsible for the induction of cytokine responses.[ 39 ] The GOS digesta attenuated the cytokine responses in DCs. As suggested in a previous study,[ 39 ] the pro‐inflammatory responses are possibly attenuated by anti‐inflammatory products such as SCFAs, lactate and succinate, which were formed upon the fermentation of GOS but not during the blank fermentation.
The cytokine profiles in DCs induced by the 14 and 26 h digesta of IMO and the medium supplemented with IMMP fermented with inoculum of 2‐week‐old infants only differed slightly from the profiles induced by the digesta of GOS. The IMO digesta fermented by the inoculum of 2‐week‐old infants contained a similar organic acid content as the GOS digesta and might therefore also exert similar anti‐inflammatory properties. Although IMMP was not fermented by the inoculum of 2‐week‐old infants and did neither result in changes in microbiota composition nor the production of organic acids, cytokine responses were also similar as observed for GOS and IMO. A possible explanation for the attenuation of the pro‐inflammatory responses by the digesta of the IMMP fermentation with inoculum of 2‐week‐old infants, is that the presence of IMMP could have led to differences in the composition of immune‐regulating bacterial products other than SCFAs.
Interestingly, whereas the cytokine profiles induced by the GOS digesta did not differ between the 2‐ and 8‐week‐old infants, the digesta of IMO and medium supplemented with IMMP were significantly different between the two age groups. Incubation with the 14 and 26 h digesta of IMO and IMMP fermented with inoculum of 8‐week‐old infants resulted in different and less attenuating chemokine and cytokine responses when compared to the digesta of GOS. With respect to IMO, the finding could be explained by the limited fermentability of IMO by fecal microbiota of 8‐week‐old infants, which resulted in low amounts of immune‐modulating organic acids. However, the extent of immune attenuation cannot be solely explained by the extent of fermentation as exemplified by IMMP. The differences in immune attenuation by the unfermentable IMMP could possibly be ascribed to subtle differences in microbiota composition between 2‐ and 8‐week‐old infants, affecting the impact of the presence of IMMP on the formation of immune‐regulating bacterial products. Hence, the cytokines profiles induced by the NDC fermentation digesta were highly dependent on the molecular structures of the NDCs in combination with the age of the infants, which determines the fermentative capacity of the fecal microbiota and subsequently the formation of immune regulating bacterial products. This finding is corroborated by previous studies using an identical experimental set‐up,[ 39, 40 ] showing clear differences in cytokine profiles induced by fructans, oat β‐glucans and the NDCs studied here.
Taken together, the use of UHPLC‐PGC‐MS revealed that next to the size, the highly variable structure of oligosaccharides has a huge impact on the fermentability of NDCs by infant microbiota. The immune modulatory effects of the fermentation digesta of the different NDCs in this study were found to be dependent on the structure of the NDCs as well as on the infant's age. Interestingly, the IMO preparation has been shown to have potential as immune‐attenuating supplement for cow's milk‐based infant formula for infants in their first weeks of life. The knowledge obtained on the substrate specificities of the infant fecal microbiota and the subsequent effects it has on immune responses might contribute to the design of tailored NDC mixtures for infants of different age groups.
Conflict of Interest
The authors declare no conflict of interest.
Author Contributions
M.J.L. and R.A. contributed equally to this work. M.J.L., R.A.K., P.L.B., P.D.V. and H.A.S. designed the study. M.J.L. performed the fermentation experiments. R.A.K. performed the cell‐based experiments, assisted by M.M.F. and B.J.D.H. M.J.L. performed the microbiota analysis, assisted by G.D.A.H. and, E.G.Z. M.J.L. performed the NDC characterization analysis, assisted by R.H., K.M.H.D. and S.S.V.L. M.J.L., R.A.K., P.D.V., and H.A.S. wrote the manuscript. All authors have revised and improved the manuscript.
Supporting information
Supporting Information
Acknowledgements
Research of Madelon J. Logtenberg and Renate Akkerman was performed in the public‐private partnership “CarboKinetics” coordinated by the Carbohydrate Competence Center (CCC, www.cccresearch.nl). CarboKinetics is financed by participating industrial partners Agrifirm Innovation Center B.V., Cooperatie Avebe U.A., DSM Food Specialties B.V., FrieslandCampina Nederland B.V., Nutrition Sciences N.V., VanDrie Holding N.V. and Sensus B.V., and allowances of The Netherlands Organisation for Scientific Research (NWO).
Logtenberg M. J., Akkerman R., Hobé R. G., Donners K. M. H., Van S. S. Leeuwen, Hermes G. D. A., de B. J. Haan, Faas M. M., Buwalda P. L., Zoetendal E. G., de P. Vos, Schols H. A., Structure‐Specific Fermentation of Galacto‐Oligosaccharides, Isomalto‐Oligosaccharides and Isomalto/Malto‐Polysaccharides by Infant Fecal Microbiota and Impact on Dendritic Cell Cytokine Responses. Mol. Nutr. Food Res. 2021, 65, 2001077. 10.1002/mnfr.202001077
Contributor Information
Madelon J. Logtenberg, Email: madelon.logtenberg@wur.nl.
Renate Akkerman, Email: r.akkerman@umcg.nl.
Data Availability Statement
Data available on request from the authors.
References
- 1.Akkerman R., Faas M. M., de Vos P., Crit. Rev. Food Sci. Nutr. 2019, 59, 1486. [DOI] [PubMed] [Google Scholar]
- 2.Roger L. C., Costabile A., Holland D. T., Hoyles L., McCartney A. L., Microbiology 2010, 156, 3329. [DOI] [PubMed] [Google Scholar]
- 3.German J. B., Freeman S. L., Lebrilla C. B., Mills D. A., Nestle Nutr. Workshop Ser. Pediatr. Program 2008, 62, 205. [DOI] [PMC free article] [PubMed] [Google Scholar]
- 4.Comstock S. S., Wang M., Hester S. N., Li M., Donovan S. M., Br. J. Nutr. 2014, 111, 819. [DOI] [PubMed] [Google Scholar]
- 5.Lane J. A., O'Callaghan J., Carrington S. D., Hickey R. M., Br. J. Nutr. 2013, 110, 2127. [DOI] [PubMed] [Google Scholar]
- 6.Holscher H. D., Davis S. R., Tappenden K. A., J. Nutr. 2014, 144, 586. [DOI] [PubMed] [Google Scholar]
- 7.Wu Y., Pan L., Shang Q. H., Ma X. K., Long S. F., Xu Y. T., Piao X. S., Anim. Feed Sci. Technol. 2017, 230, 126. [Google Scholar]
- 8.Wu Q., Pi X., Liu W., Chen H., Yin Y., Yu H. D., Wang X., Zhu L., Anaerobe 2017, 48, 206. [DOI] [PubMed] [Google Scholar]
- 9.Gu F., Borewicz K., Richter B., van der Zaal P. H., Smidt H., Buwalda P. L., Schols H. A., Mol. Nutr. Food Res. 2018, 62, 1800232. [DOI] [PMC free article] [PubMed] [Google Scholar]
- 10.Mistry R. H., Borewicz K., Gu F., Verkade H. J., Schols H. A., Smidt H., Tietge U. J. F., Mol. Nutr. Food Res. 2020, 64, 2000251. [DOI] [PubMed] [Google Scholar]
- 11.Mizubuchi H., Yajima T., Aoi N., Tomita T., Yoshikai Y., J. Nutr. 2005, 135, 2857. [DOI] [PubMed] [Google Scholar]
- 12.Matsuki T., Tajima S., Hara T., Yahagi K., Ogawa E., Kodama H., Benefic. Microbes 2016, 7, 453. [DOI] [PubMed] [Google Scholar]
- 13.Sierra C., Bernal M. J., Blasco J., Martínez R., Dalmau J., Ortuño I., Espín B., Vasallo M. I., Gil D., Vidal M. L., Infante D., Leis R., Maldonado J., Moreno J. M., Román E., Eur. J. Nutr. 2015, 54, 89. [DOI] [PMC free article] [PubMed] [Google Scholar]
- 14.Wang J., Tian S., Yu H., Wang J., Zhu W., J. Agric. Food Chem. 2019, 67, 578. [DOI] [PubMed] [Google Scholar]
- 15.Bermudez‐Brito M., Sahasrabudhe N. M., Rosch C., Schols H. A., Faas M. M., de Vos P., Mol. Nutr. Food Res. 2015, 59, 698. [DOI] [PubMed] [Google Scholar]
- 16.Torres D. P. M., Gonçalves M. d. P. F., Teixeira J. A., Rodrigues L. R., Compr. Rev. Food Sci. Food Saf. 2010, 9, 438. [DOI] [PubMed] [Google Scholar]
- 17.van Leeuwen S. S., Kuipers B. J., Dijkhuizen L., Kamerling J. P., Carbohydr. Res. 2014, 400, 59. [DOI] [PubMed] [Google Scholar]
- 18.Coulier L., Timmermans J., Bas R., Van Den Dool R., Haaksman I., Klarenbeek B., Slaghek T., Van Dongen W., J. Agric. Food Chem. 2009, 57, 8488. [DOI] [PubMed] [Google Scholar]
- 19.Fransen C. T., Van Laere K. M., van Wijk A. A., Brull L. P., Dignum M., Thomas‐Oates J. E., Haverkamp J., Schols H. A., Voragen A. G., Kamerling J. P., Vliegenthart J. F., Carbohydr. Res. 1998, 314, 101. [DOI] [PubMed] [Google Scholar]
- 20.Logtenberg M. J., Donners K. M. H., Vink J. C. M., Leeuwen S. S. v., Waard P. d., Vos P. d., Schols H. A., J. Agric. Food Chem. 2020, 68, 7800. [DOI] [PMC free article] [PubMed] [Google Scholar]
- 21.Smith P. M., Howitt M. R., Panikov N., Michaud M., Gallini C. A., Bohlooly‐Y M., Glickman J. N., Garrett W. S., Science 2013, 341, 569. [DOI] [PMC free article] [PubMed] [Google Scholar]
- 22.Nastasi C., Candela M., Bonefeld C. M., Geisler C., Hansen M., Krejsgaard T., Biagi E., Andersen M. H., Brigidi P., Ødum N., Litman T., Woetmann A., Sci. Rep. 2015, 5, 16148. [DOI] [PMC free article] [PubMed] [Google Scholar]
- 23.Stagg A. J., Front. Immunol. 2018, 9, 2883. [DOI] [PMC free article] [PubMed] [Google Scholar]
- 24.Tezuka H., Ohteki T., Front. Immunol. 2019, 10, 1891. [DOI] [PMC free article] [PubMed] [Google Scholar]
- 25.Hu Y., Winter V., Gänzle M., Food Res. Int. 2020, 134, 109250. [DOI] [PubMed] [Google Scholar]
- 26.Ketabi A., Dieleman L. A., Gänzle M. G., J. Appl. Microbiol. 2011, 110, 1297. [DOI] [PubMed] [Google Scholar]
- 27.Casa‐Villegas M., Marín‐Navarro J., Polaina J., Amylase 2018, 2, 17. [Google Scholar]
- 28.Sorndech W., Nakorn K. N., Tongta S., Blennow A., LWT–Food Sci. Technol. 2018, 95, 135. [Google Scholar]
- 29.Niu D., Qiao J., Li P., Tian K., Liu X., Singh S., Lu F., Electron. J. Biotechnol. 2017, 26, 46. [Google Scholar]
- 30.Sorndech W., Sagnelli D., Blennow A., Tongta S., LWT–Food Sci. Technol. 2017, 79, 479. [Google Scholar]
- 31.Madsen L. R., Stanley S., Swann P., Oswald J., J. Food Sci. 2017, 82, 401. [DOI] [PubMed] [Google Scholar]
- 32.Leemhuis H., Dobruchowska J. M., Ebbelaar M., Faber F., Buwalda P. L., van der Maarel M. J. E. C., Kamerling J. P., Dijkhuizen L., J. Agric. Food Chem. 2014, 62, 12034. [DOI] [PubMed] [Google Scholar]
- 33.van der Zaal P. H., Klostermann C. E., Schols H. A., Bitter J. H., Buwalda P. L., Carbohydr. Polym. 2019, 205, 279. [DOI] [PubMed] [Google Scholar]
- 34.van der Zaal P. H., Schols H. A., Bitter J. H., Buwalda P. L., Carbohydr. Polym. 2018, 185, 179. [DOI] [PubMed] [Google Scholar]
- 35.Akbari P., Fink‐Gremmels J., Willems R. H. A. M., Difilippo E., Schols H. A., Schoterman M. H. C., Garssen J., Braber S., Eur. J. Nutr. 2017, 56, 1919. [DOI] [PMC free article] [PubMed] [Google Scholar]
- 36.Ladirat S., Schols H., Nauta A., Schoterman M., Schuren F., Gruppen H., Bioact. Carbohydr. Diet. Fibre 2014, 3, 59. [Google Scholar]
- 37.Depeint F., Tzortzis G., Vulevic J., I'Anson K., Gibson G. R., Am. J. Clin. Nutr. 2008, 87, 785. [DOI] [PubMed] [Google Scholar]
- 38.Lam K. L., Ko K. C., Li X., Ke X., Cheng W. Y., Chen T., You L., Kwan H. S., Cheung P. C., Molecules 2019, 24, 828. [DOI] [PMC free article] [PubMed] [Google Scholar]
- 39.Logtenberg M. J., Akkerman R., An R., Hermes G. D. A., de Haan B. J., Faas M. M., Zoetendal E. G., Schols H. A., de Vos P., Mol. Nutr. Food Res. 2020, 64, 2000068. [DOI] [PMC free article] [PubMed] [Google Scholar]
- 40.Akkerman R., Logtenberg M. J., An R., Van Den Berg M. A., de Haan B. J., Faas M. M., Zoetendal E., de Vos P., Schols H. A., Nutrients 2020, 12, 1660. [DOI] [PMC free article] [PubMed] [Google Scholar]
- 41.Albrecht S., Schols H. A., van den Heuvel E. G., Voragen A. G., Gruppen H., Carbohydr. Res. 2011, 346, 2540. [DOI] [PubMed] [Google Scholar]
- 42.Logtenberg M. J., Vink J. C. M., Serierse R. M., An R., Hermes G. D. A., Smidt H., Schols H. A., Bioact. Carbohydr. Diet. Fibre 2020, 24, 100235. [Google Scholar]
- 43.Ladirat S. E., Schuren F. H., Schoterman M. H., Nauta A., Gruppen H., Schols H. A., FEMS Microbiol. Ecol. 2014, 87, 41. [DOI] [PubMed] [Google Scholar]
- 44.Ramiro‐Garcia J., Hermes G. D. A., Giatsis C., Sipkema D., Zoetendal E. G., Schaap P. J., Smidt H., F1000Research 2016, 5, 1791. [DOI] [PMC free article] [PubMed] [Google Scholar]
- 45.Poncheewin W., Hermes G. D. A., van Dam J. C. J., Koehorst J. J., Smidt H., Schaap P. J., Front. Genet. 2020, 10, 1366. [DOI] [PMC free article] [PubMed] [Google Scholar]
- 46.Quast C., Pruesse E., Yilmaz P., Gerken J., Schweer T., Yarza P., Peplies J., Glöckner F. O., Nucleic Acids Res. 2012, 41, D590. [DOI] [PMC free article] [PubMed] [Google Scholar]
- 47.McMurdie P. J., Holmes S., PLoS One 2013, 8, e61217. [DOI] [PMC free article] [PubMed] [Google Scholar]
- 48.Lahti L., Shetty S., Tools for microbiome analysis in R 2017,. URL: http://microbiome.github.com/microbiome.
- 49.Goffin D., Robert C., Wathelet B., Blecker C., Malmendier Y., Paquot M., Chromatographia 2008, 69, 287. [Google Scholar]
- 50.Guan B., Cole R. B., J. Am. Soc. Mass Spectrom. 2008, 19, 1119. [DOI] [PubMed] [Google Scholar]
- 51.Black B. A., Lee V. S., Zhao Y. Y., Hu Y., Curtis J. M., Gänzle M. G., J. Agric. Food Chem. 2012, 60, 4886. [DOI] [PubMed] [Google Scholar]
- 52.Ferreira‐Lazarte A., Gallego‐Lobillo P., Moreno F. J., Villamiel M., Hernandez‐Hernandez O., J. Agric. Food Chem. 2019, 67, 4662. [DOI] [PubMed] [Google Scholar]
- 53.Nguyen T. T. P., Bhandari B., Cichero J., Prakash S., Food Res. Int. 2015, 76, 373. [DOI] [PubMed] [Google Scholar]
- 54.Weström B., Arévalo Sureda E., Pierzynowska K., Pierzynowski S. G., Pérez‐Cano F. ‐ J., Front. Immunol. 2020, 11, 1153. [DOI] [PMC free article] [PubMed] [Google Scholar]
- 55.Palframan R. J., Gibson G. R., Rastall R. A., Curr. Issues Intest. Microbiol. 2003, 4, 71. [PubMed] [Google Scholar]
- 56.Vandenplas Y., Zakharova I., Dmitrieva Y., Br. J. Nutr. 2015, 113, 1339. [DOI] [PubMed] [Google Scholar]
- 57.Sakanaka M., Gotoh A., Yoshida K., Odamaki T., Koguchi H., Xiao J. Z., Kitaoka M., Katayama T., Nutrients 2019, 12, 71. [DOI] [PMC free article] [PubMed] [Google Scholar]
- 58.Janda J. M., Abbott S. L., J. Clin. Microbiol. 2007, 45, 2761. [DOI] [PMC free article] [PubMed] [Google Scholar]
- 59.Turroni F., Peano C., Pass D. A., Foroni E., Severgnini M., Claesson M. J., Kerr C., Hourihane J., Murray D., Fuligni F., PLoS One 2012, 7, e36957. [DOI] [PMC free article] [PubMed] [Google Scholar]
- 60.Pokusaeva K., O'Connell‐Motherway M., Zomer A., Fitzgerald G. F., van Sinderen D., Appl. Environ. Microbiol. 2009, 75, 1135. [DOI] [PMC free article] [PubMed] [Google Scholar]
- 61.Hu Y., Ketabi A., Buchko A., Gänzle M. G., Lett. Appl. Microbiol. 2013, 57, 108. [DOI] [PubMed] [Google Scholar]
- 62.van den Broek L. A., Hinz S. W., Beldman G., Vincken J. P., Voragen A. G., Mol. Nutr. Food Res. 2008, 52, 146. [DOI] [PubMed] [Google Scholar]
- 63.Falony G., Lazidou K., Verschaeren A., Weckx S., Maes D., De Vuyst L., Appl. Environ. Microbiol. 2009, 75, 454. [DOI] [PMC free article] [PubMed] [Google Scholar]
- 64.Rossi M., Corradini C., Amaretti A., Nicolini M., Pompei A., Zanoni S., Matteuzzi D., Appl. Environ. Microbiol. 2005, 71, 6150. [DOI] [PMC free article] [PubMed] [Google Scholar]
- 65.Bhattacharya T., Ghosh T. S., Mande S. S., PLoS One 2015, 10, e0142038. [DOI] [PMC free article] [PubMed] [Google Scholar]
- 66.Van Laere K. M., Abee T., Schols H. A., Beldman G., Voragen A. G., Appl. Environ. Microbiol. 2000, 66, 1379. [DOI] [PMC free article] [PubMed] [Google Scholar]
- 67.Bai Y., Böger M., van der Kaaij R. M., Woortman A. J., Pijning T., van Leeuwen S. S., van Bueren A. L., Dijkhuizen L., J. Agric. Food Chem. 2016, 64, 2941. [DOI] [PubMed] [Google Scholar]
- 68.Hii S. L., Tan J. S., Ling T. C., Ariff A. B., Enzyme Res 2012, 2012, 921362. [DOI] [PMC free article] [PubMed] [Google Scholar]
- 69.Hughes S. A., Shewry P. R., Gibson G. R., McCleary B. V., Rastall R. A., FEMS Microbiol. Ecol. 2008, 64, 482. [DOI] [PubMed] [Google Scholar]
- 70.Ye L., Das P., Li P., Ji B., Nielsen J., FEMS Microbiol. Ecol. 2019, 95. [DOI] [PubMed] [Google Scholar]
- 71.Yiu J. H. C., Dorweiler B., Woo C. W., J. Mol. Med. 2017, 95, 13. [DOI] [PMC free article] [PubMed] [Google Scholar]
Associated Data
This section collects any data citations, data availability statements, or supplementary materials included in this article.
Supplementary Materials
Supporting Information
Data Availability Statement
Data available on request from the authors.