Abstract
Pb(II) complexes of bis(N-1,4-phenyl-N-(4-morpholinedithiocarbamato)) as Pb(II)–S and bis(N-diisopropyl-N-octyldithiocarbamato) as Pb(II)–P were prepared and characterized by optical, structural, morphological, and electrochemical techniques. The scanning electron microscopy analysis of Pb(II)–P and Pb(II)–S complexes consists of cubic crystals. X-ray diffraction and high-resolution transmission electron microscopy spectral studies revealed that the diameter increases in length for alkyl chain groups. This study demonstrates that the cubic shape of Pb(II) complexes can be synthesized from aromatic and aliphatic dithiocarbamate ligands. Photoluminescence analysis of both complexes fell within the blue shift region. The CV curve for Pb(II)–S revealed redox curves and the box-like shape as an indicative of a capacitive behavior, signifying limited catalytic redox activity. The J–V results for both sensitizers displayed satisfactory conversion efficiency (% η) between 3.77 and 3.96%.
Introduction
The fabrication and designing of dye-sensitized solar cells (DSSCs) as nonconventional photovoltaic innovation in the last two decades have created more zeal for chemists and materials scientists.1−4 The maximum power conversion efficiency of 14.4% displayed by DSSCs makes this technology similar in terms of relative advancement to the conventional silicon-based photovoltaic cells.5 One of the major components for a suitable DSSC architecture is the sensitized cell due to its light harvesting and control ability over charge separation properties.1 This enables the photosensitizer’s molecular structure to be altered to promote its light-harvesting capacity. This can be achieved by altering the anchoring groups and chromophores.6 These have paved the ways for the use of transition metal complexes as a sensitizer such as Zn porphyrins, Ru-based sensitizers, and perovskites, which promoted photovoltaic efficiencies.7−13 The high cost associated with Ru-based sensitizers has limited their application in large-scale commercialization. In addition, various organic sensitizers have not enhanced DSSCs.6,14−16
Coordination chemistry involving sulfur ligands has attained a very interesting ground due to their electrochemical properties, electrical conductivity, biological processes, molecular magnetism, and optoelectronic properties.17−19 The versatility of coordination chemistry such as dithiocarbamate complexes has emerged as one of the active areas of inorganic materials chemistry research in recent years.20−23 They have been found to exhibit better photoluminescence emission and supramolecular arrays.6,24,25 The use of dithiocarbamate complexes as sensitizers could serve new efficient photosensitizers due to their wide-band-gap properties compared to the organic sensitizer.26−32 Among these transition metal complexes, Pb(II) complexes are shown to be interesting p-block-based elements with various coordination geometries as a result of the stereochemically active 6s2 electron influence at its core.33 The distorted tetragonal pyramid has been highlighted as the common geometry of Pb(II) dithiocarbamate complexes.34,35 This geometry was obtained with diisopropyldithiocarbamate having intermolecular interactions around the isopropyl group.36 While hemidirected tetrahedral Pb(II) complexes were used to synthesize lead sulfide nanomaterials and thin films.37−39 This study reported on the structural, optical, and electrochemical activity of lead(II) complexes as photosensitizers in DSSCs.
Results and Discussion
In Figure 1, the stretching frequencies for Pb(II)–S, complexes at 1484 cm–1, implied a substantial double-bond attractiveness of the C–N bond in the DTC ligands.40 IR vibrational frequencies at 541 cm–1 correlate to the v(M–S).41 The main peaks of high concerns in DTC complexes of Pb(II)–P are three regions, which are 1495 cm–1 assigned to v(C–N) of NCS, 930 cm–1 assigned to v(C–S) of CSS, and 541 cm–1 assigned to the M–S bond, as seen in Figure 1.42 The C–N peak was observed at 1495 cm–1 for Pb(II)–P, and this indicated that there is delocalization of electrons in the center of the metals as a result of an increase in the character of the C–N bond due to the DTC ligands’ coordination. The shift in the complexes’ C–N stretching can be due to two major reasons, an increase in the C–N single bond character43 and the prevailing influence of the form DTC thioureide resonance (see the highlighted proposed structure for Pb(II)–P).44 The shift in C–S in both metal complexes showed that these ligands could act as bidentate ligands with sulfur.45 The M–S vibration stretchings observed at 541 cm–1 for both complexes correspond to the M ion bonded to DTC by the sulfur atoms.
Figure 1.
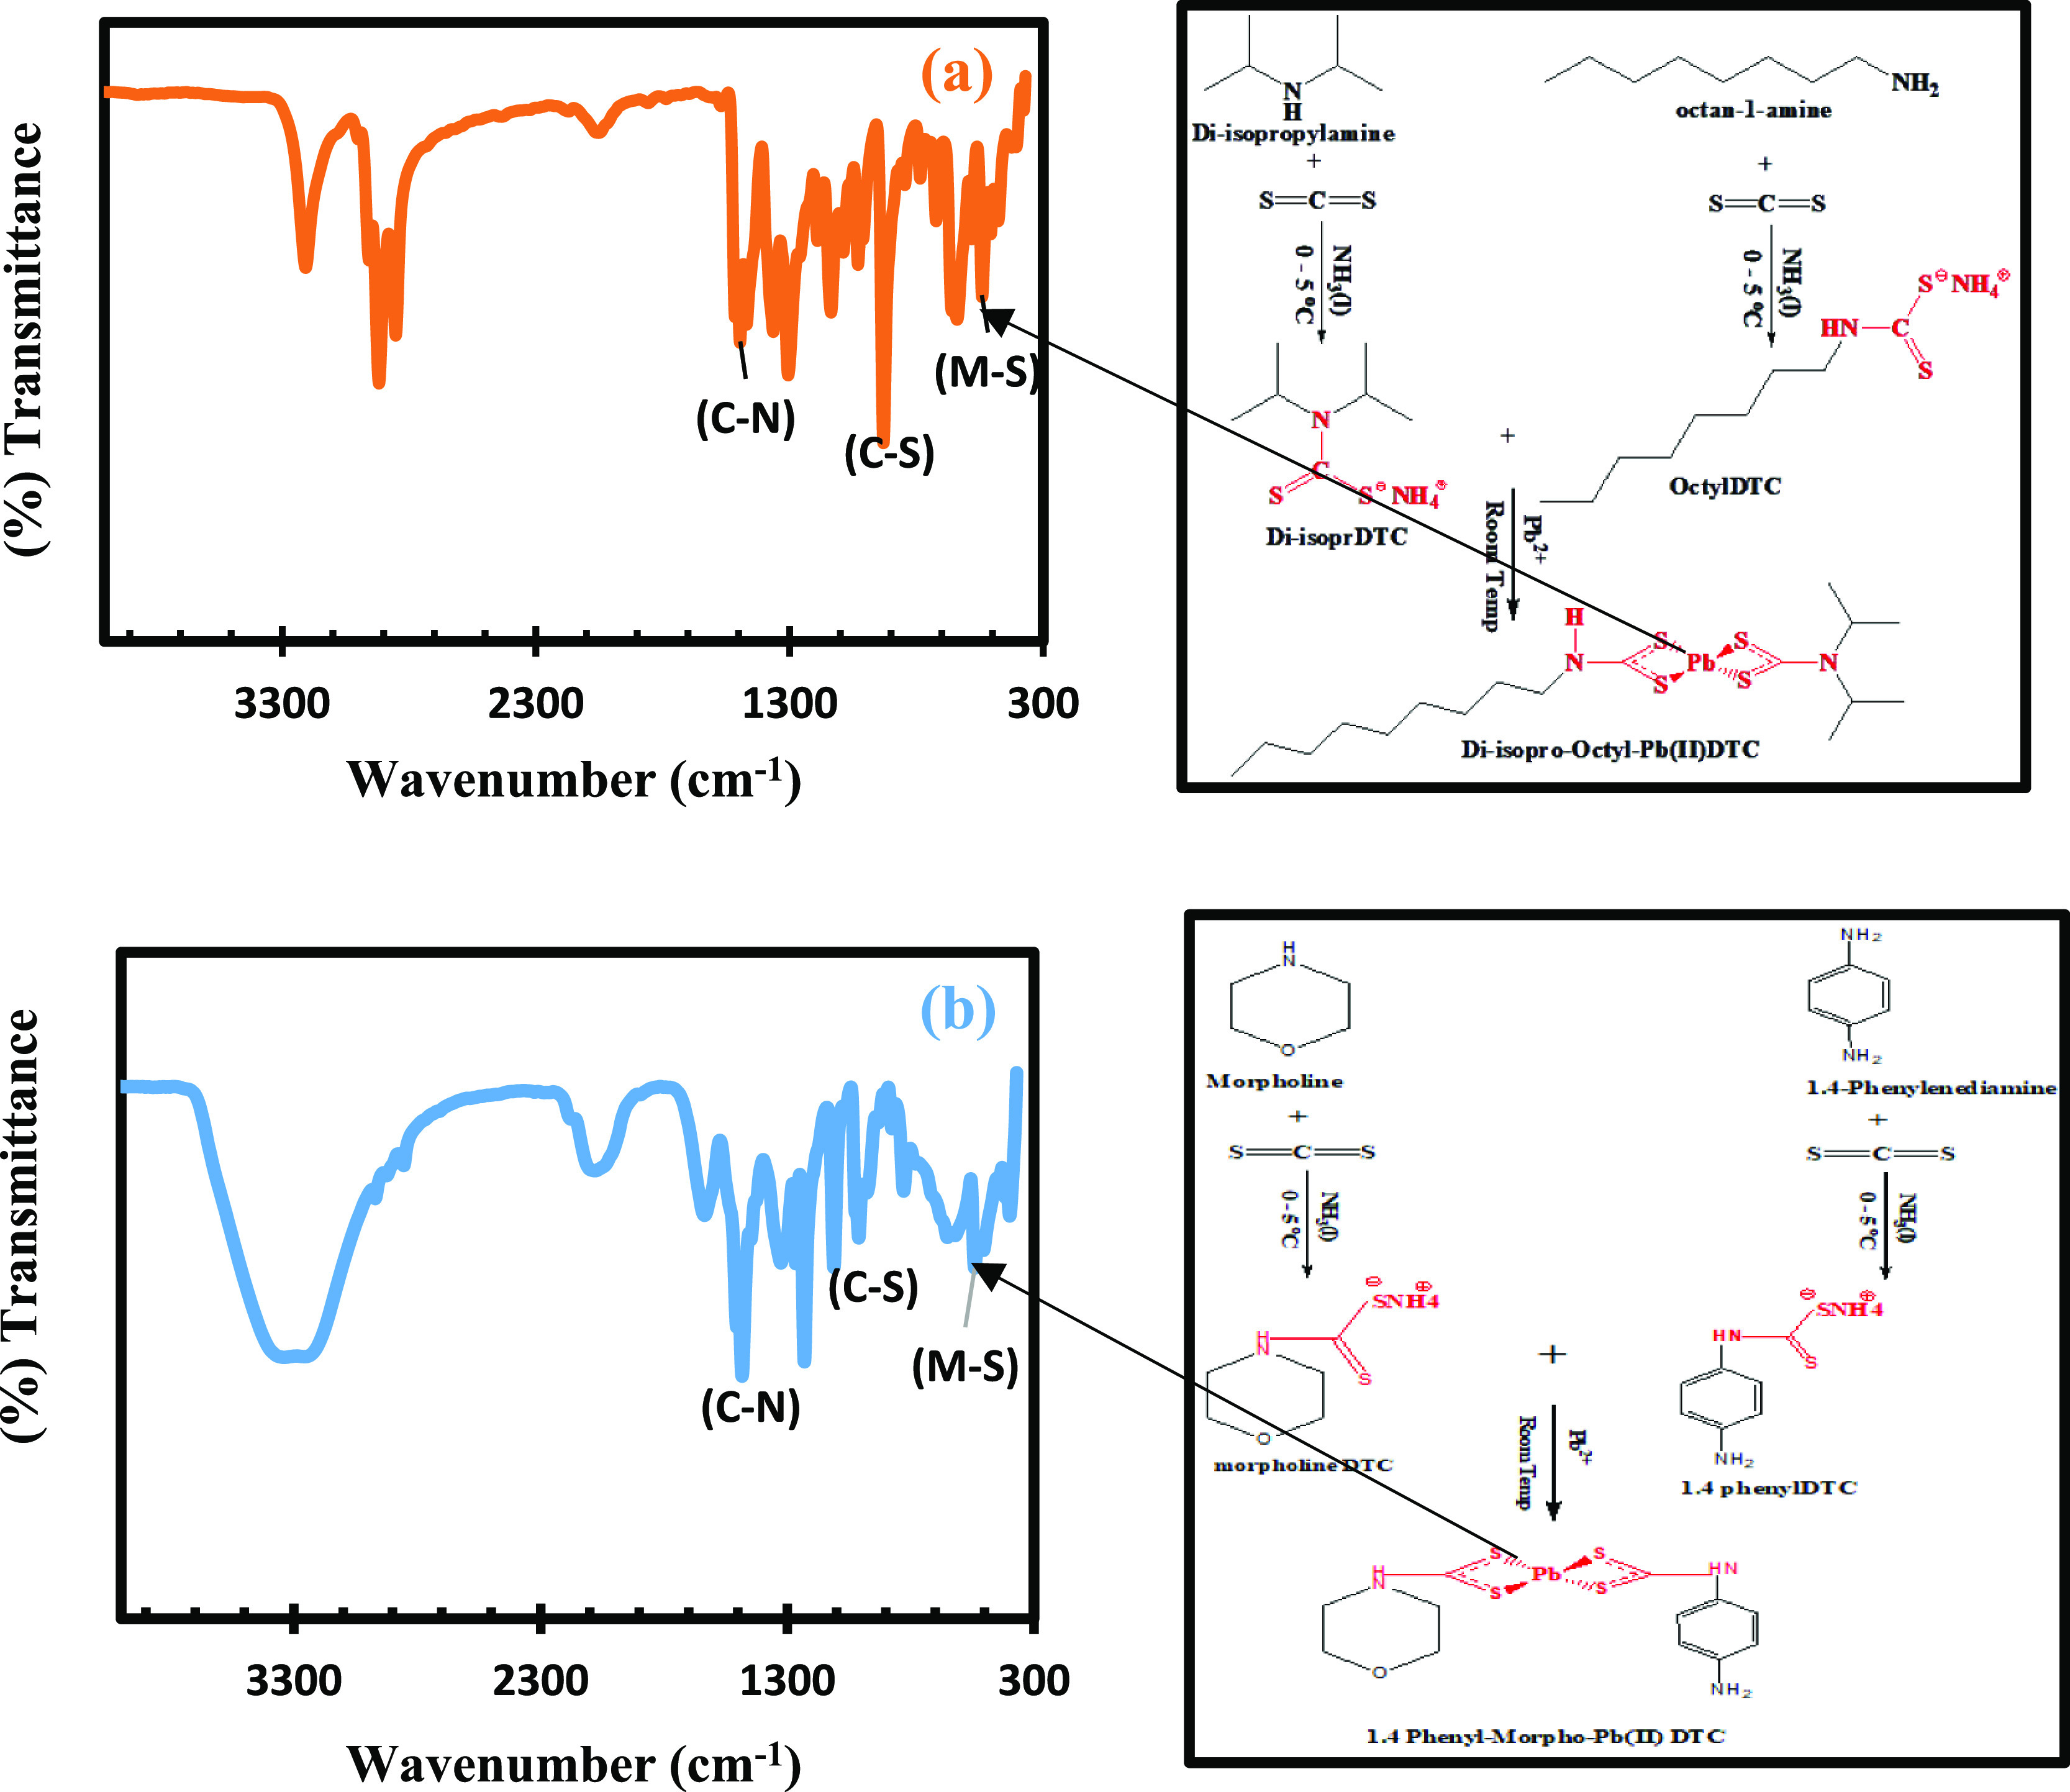
FTIR spectra of (a) Pb(II)–P and (b) Pb(II)–S with accompanying illustrations of the band stretching and vibrations.
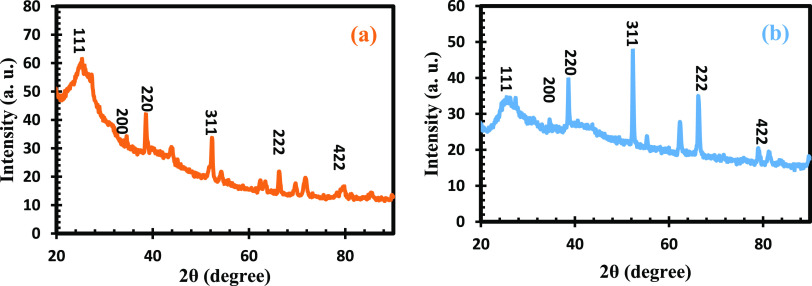
In order to evaluate the crystal structure of the metal complexes, X-ray diffraction (XRD) was employed and the patterns were obtained as shown in Figure 2. The XRD diffraction patterns for Pb(II)–P and Pb(II)–S complexes are in accordance with the cubic type structure relating to the standard card (JCPDS no. 05-0592). They are represented by their corresponding miller indices in the spectra. The peaks with values at 27.5, 34.7, and 79.2° are in accordance with crystalline planes of (111), (200), and (422), respectively.46 A d-spacing of 2.84 nm, an fwhm of 1.82 nm, and a particle size of 17.29 nm correspond to the (111) plane for Pb(II)–P, while Pb(II)–S has a d-spacing of 2.85 nm, an fwhm of 0.45 nm, and a particle size of 7.07 nm for the (111) plane. The peak at angle (2θ) 63° was observed in the study by ref (47), using similar secondary amines due to the S–Pb–S bond angle. Also, the longer alkyl chain groups have a lower crystallinity and uniform size compared to the smaller alkyl chain groups according to the study by ref (48), using primary and secondary amines similar to the present study. The obtained values from the present study are in agreement with the study by refs.47,48
Figure 2.
XRD spectra of (a) Pb(II)–P and (b) Pb(II)–S.
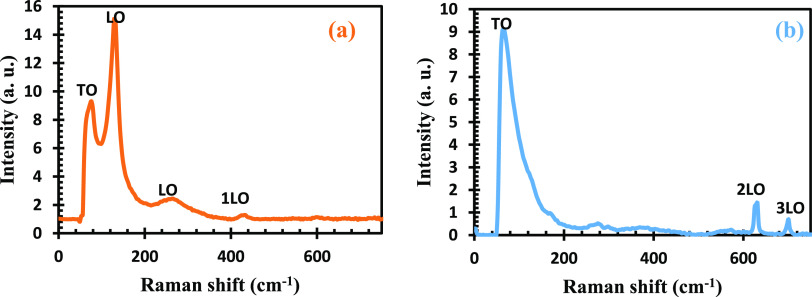
According to Raman spectroscopy, Pb(II) has a cubic B1 structure corresponding to the tetragonal phase, as observed in the XRD analysis, having the space group Fm3m with the unit cell containing eight atoms. The phonon mode for 1LO was observed at 429 cm–1, as shown in Figure 3, which is linked to the first overtune occurring at the center of the BZ, which was reported by ref (49), as Raman-active, while longitudinal optical (LO) at 132 and 262 cm–1, regarded as forbidden, is in agreement with the study by ref (50). Raman spectral peak at 74 cm–1 for the TO mode implies a reduced order spheroidal acoustic mode for Pb(II)–P complexes, which is supported by the high-resolution transmission electron microscopy (HRTEM) results. The peaks for the second overtones 2LO and 3LO were not detected in this study. The Raman spectrum of Pb(II)–S complexes displayed various vibrational modes (see Figure 3b). Raman spectra revealed a broad peak at 68 cm–1 for the TO mode regarded as the lowest-order spheroidal acoustic mode. This can be linked to the small size of Pb(II)–S complexes and supported by its HRTEM. The peaks at 602 and 699 cm–1 ascribed to second overtones 2LO and 3LO were observed in Pb(II)–S, which is linked to the sensitive nature of the ligands of Pb(II)–S to the laser. The peak at 994 cm–1 might be related to the Pb(II) crystal shape or photodegradation.51 These phonon modes for 1LO and LO were not observed in this Pb(II)–S, in line with the report of ref (50). It has been reported that Pb(II) having a characteristic Raman mode and symmetry at 205 cm–1 belong to first-order LO. While 454 cm–1 is the first overtone of the LO phonon mode (2LO), 630 cm–1 is the second overtone of the LO phonon mode (3LO), and peaks at 68 cm–1 are the lowest acoustic modes (TO).50 The (TO) modes observed in both samples attest to a good crystalline quality and epitaxy of the film. The absence of LO phonon modes is attributed to the metallization effect of semiconductors under high pressure. This transition is also considered as an indication of the material being transformed from a direct band gap into an indirect one.52 The band structure can be modified by strain or by reducing crystal size, and this further cemented the scanning electron microscopy (SEM) result size diameter for Pb(II)–S.
Figure 3.
Raman spectra of (a) Pb(II)–P and (b) Pb(II)–S.
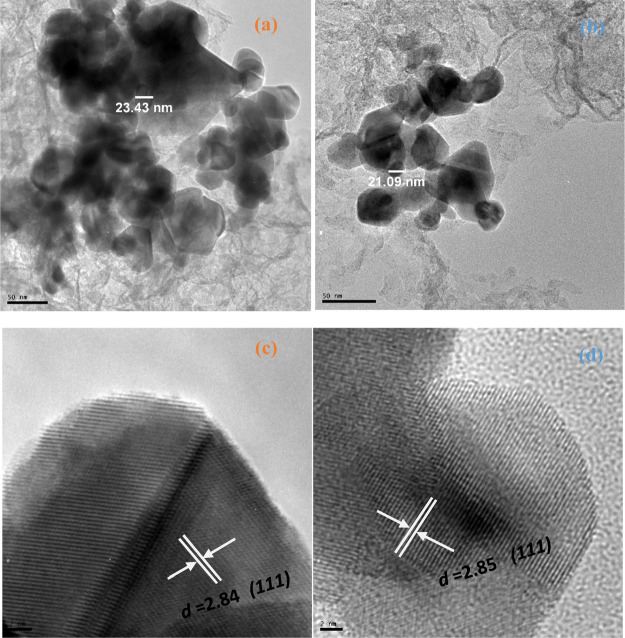
TEM images and size distribution of Pb(II)–P and Pb(II)–S complexes. Figure 4a shows the Pb(II)–P complex with spherical, monodispersed, and slight agglomeration with an average diameter size of 23.43 nm. The Pb(II)–S complex shape is slightly smaller in diameter size at 21.09 nm, as seen in Figure 4b. This variation in the diameter size could to be linked to the alkyl group’s chain lengths. The longer the alkyl group chain, the lower the diameter size; also, there is a slight difference in the morphology quality of the Pb(II)–P complex compared to Pb(II)–S. This finding is in agreement with the studies by refs.48,53
Figure 4.
HRTEM images of (a,c) Pb(II)–P and (b,d) Pb(II)–S.
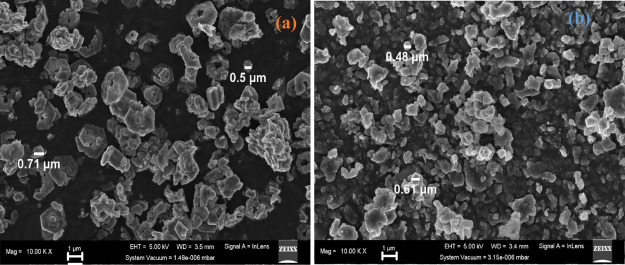
The SEM images of the Pb(II)–P and Pb(II)–S are seen in Figure 5a,b. The morphology for the Pb(II)–P complex consists of cubic crystals and a degree of plane-related growth of conjoined interlocking crystals. Two main morphologies observed in Pb(II)–S (Figure 5b) have a varying size of irregular flakes and with the small snowy crystallites, forming large cubic clusters.48,54Figure 5a,b displays the average diameter size of around 0.5–0.71 μm for Pb(II)–P, while the Pb(II)–S complex has a diameter size around 0.48–0.61 μm. The smaller size of Pb(II)–S complexes is attributed to the relative peak intensity of the TO phonon mode and the absence of the LO phonon mode, indicating lower crystallinity due to photodegradation, which confirms the Raman and XRD results.
Figure 5.
SEM images of (a) Pb(II)–P and (b) Pb(II)–S.
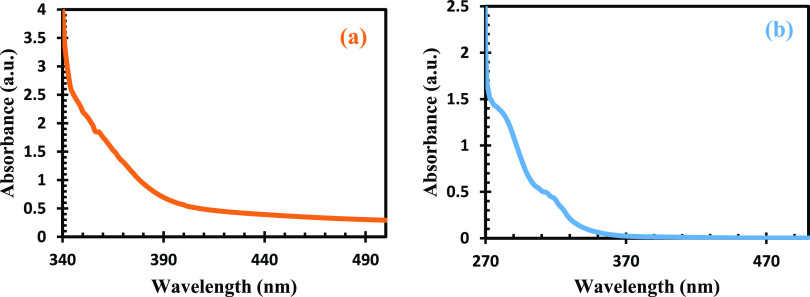
The electronic spectra of both complexes are shown in Figure 6, and Pb(II)–P has a wavelength of 350 nm with broad peaks. This could be due to correlation between the metal ion and donor atoms, which are sulfur atoms attached to the metals.55 The Pb(II)–S revealed electronic transitions of π → π* at 325 nm with a band gap of 3.87 eV. The small absorption peak observed for the Pb(II)–S complex is linked to d–d transition. Their d-orbitals are free for π-bonding which resulted in the formation of covalent complexes with absorption in the UV region.56,57
Figure 6.
UV–vis spectra of (a) Pb(II)–P and (b) Pb(II)–S.
The shape and size of semiconductor materials are one of the major indications of good optical properties, while lower absorption wavelength is influenced by small size, which is in good agreement with SEM and HRTEM results from this study and the report by ref (58).
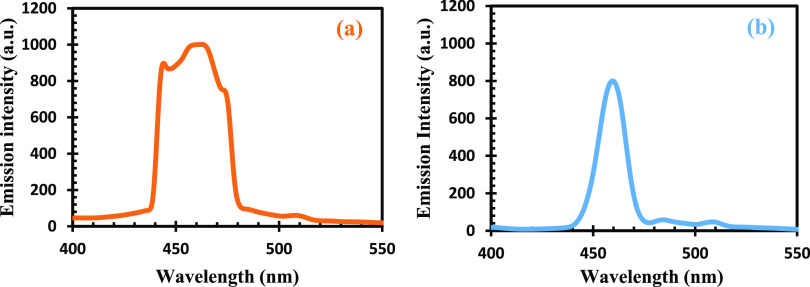
Photoluminescence spectra of the complexes are displayed in Figure 7. The peaks of great significance for better photosensitizers are the excitation and trapped luminescence. The broad band is regarded as trapped emission ascribed to the variation in particle size, while the sharp emission is regarded as excitation. The absorption spectra with the highest excitation emission peak were observed at 464.5 nm for Pb(II)–P. This falls within the blue shift region where optimum efficiency is attained, making these materials good candidates for solar cell application.56 The Pb(II)–S complexes follow the same trend with Pb(II)–P, with maximum emissions found at 455 nm Pb(II)–S.56 The observed sharp and broad emission peaks at 455 and 464.5 nm for Pb(II)–S and Pb(II)–P also increase with the increase in excitation wavelength. These peaks are related with transition of electrons from the conduction band to holes, trapped at interstitial Pb2+ sites.58
Figure 7.
Photoluminescence spectra of (a) Pb(II)–P and (b) Pb(II)–S.
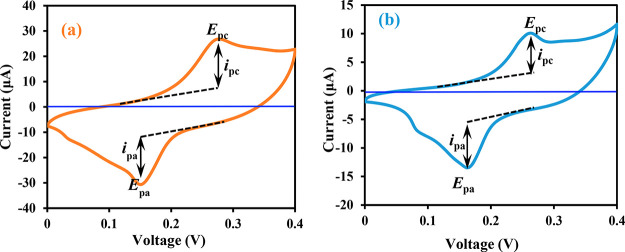
The CV technique was employed to verify the catalytic properties of Pb(II)–P and Pb(II)–S sensitizers using the three-electrode cell consisting of the TiO2 electrode, Pt counter electrode, and Ag/Ag+ as the reference electrode in HI-30 solution (as seen in Figure 8).
Figure 8.
CV curve of (a) Pb(II)–P and (b) Pb(II)–S.
Cyclic voltammetry measurements were conducted in the potential range from 0.0 to 0.4 V. The electrochemical parameters of Pb(II)–P and Pb(II)–S complexes are summarized in Table 1. Both sensitizer complexes display a similar redox behavior exhibiting the quasi-reversible redox process. The potential peak separation was lesser for Pb(II)–P electron transfer, with the ratio of anodic to cathodic peak currents at 0.97 V, while for Pb(II)–S, it is larger at 1.12 V. The redox behavior emanated from the complex moieties and in the redox reaction of the metal center is due to the effect of electrons withdrawing from the group attached to complexes with the ligands. This is in good agreement with the work by others.59,60
Table 1. J–V Parameters and Electrochemical Data of Pb(II)–P and Pb(II)–S.
| parameters | Pb(II)–P | Pb(II)–S |
|---|---|---|
| Jsc (mA/cm2) | 10 | 10 |
| Voc (V) | 0.59 | 0.57 |
| FF | 0.67 | 0.66 |
| η (%) | 3.96 | 3.77 |
| Ep,a (V) | 0.27 | 0.27 |
| Ep,c (V) | 0.15 | 0.17 |
| ΔEp = Ep,a – Ep,c (V) | 0.12 | 0.1 |
| E° = 1/2(Ep,a – Ep,c) (V) | 0.06 | 0.05 |
| ip,a/ip,c | 0.97 | 1.12 |
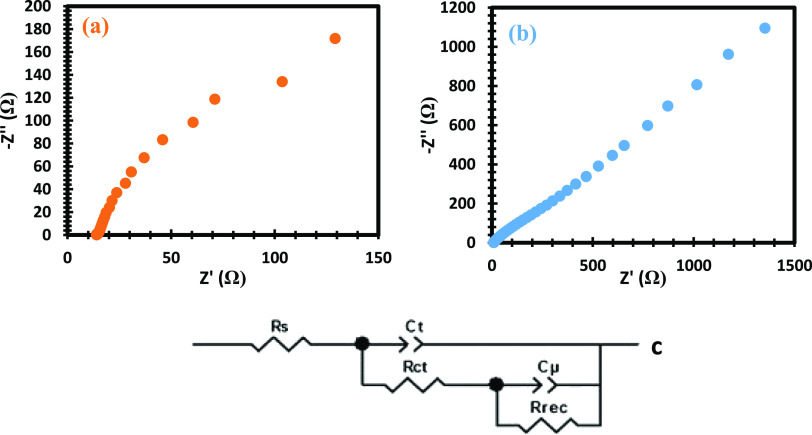
From electrochemical impedance spectroscopy (EIS) as seen in Figure 9, Pb(II)–P has a higher resistance, indicating that the materials did not fully cover the TiO2 electrode and poor connection. The high Rct observed in the Pb(II) electrode implies a nonconductive charge transfer, emanating from poor connections involving the particles and the electron transportation of the Pb(II)–P/electrolyte interface from the external circuit. Based on this fact, Pb(II)–P catalytic sites could not be optimizers to their full potentials which led to higher Rct. The Pb(II)–S complex plots revealed the kinetics around the electrode/electrolyte interface by providing adequate details. The delay in electron recombination is favorable at the electrode/electrolyte interface when there is a higher value in τ. Lower efficiency observed in the Pb(II)–S cells is linked to low electron lifetimes due to lower chemical capacitance properties at the electrode/electrolyte interface. Their good recombination resistance could not improve the electron lifetime due to their poor low chemical capacitance yield.61−63Figure 9c displays the equivalent circuit model fitted for the obtained semicircles.
Figure 9.
EIS spectra of (a) Pb(II)–P and (b) Pb(II)–S and (c) equivalent circuit model for fitting.
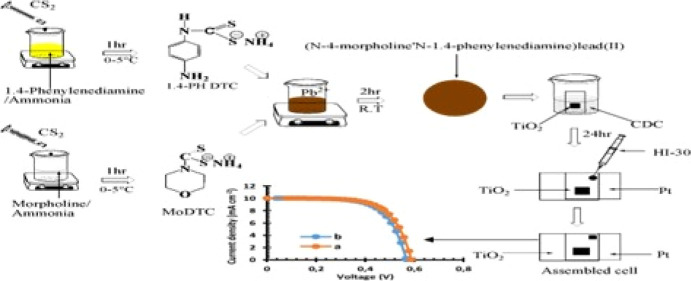
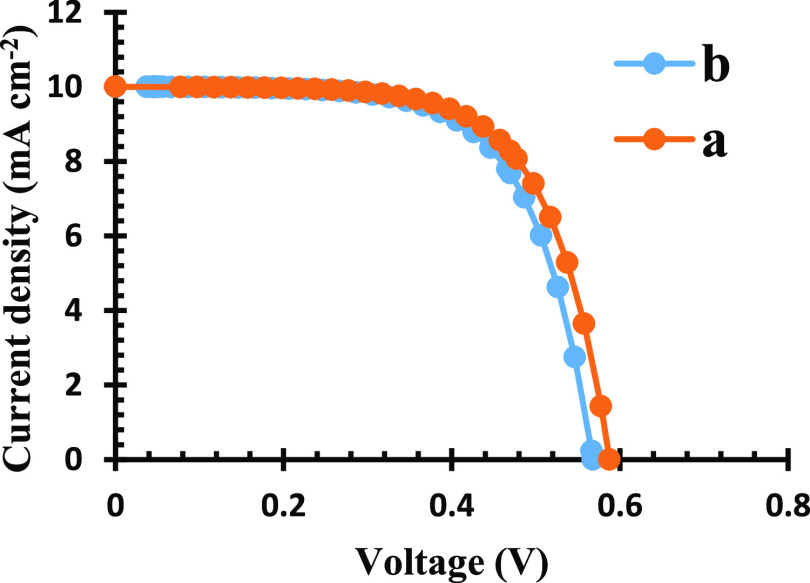
The current–voltage (J–V) curve for both sensitizer complexes is shown in Figure 10 and Table 1. The J–V parameters for this cell indicates that the short-circuit current (Jsc) was 10 mA cm–2 for both complexes and open-circuit (Voc) values were 0.59 and 0.57 V, respectively, for Pb(II)–P and Pb(II)–S, with efficiencies (η) of 3.96 and 3.77%, respectively. The fill factor is an essential parameter for assessment of the solar cell performance depending on their series resistance (Rs). The FF obtained in this study at 0.67 and 0.66% affirmed that recombination has taken place in both cells. The parameters of both complexes are very similar, and their better conversion could be linked to relatively better dye loading and wide electronic absorption properties. The obtained efficiencies in this study further agree with achieved efficiencies of the complex-based sensitizers from the studies by refs.59,60
Figure 10.
I–V of (a) Pb(II)–P and (b) Pb(II)–S.
Conclusions
Based on the findings of the present study, it can be concluded that the synthesized complexes as sensitizers can act as better sensitizers. XRD and HRTEM spectral studies revealed that the diameter increases with the increase in length of alkyl chain groups. This study demonstrates that the cubic shape of Pb(II) complexes can be synthesized from aromatic and aliphatic dithiocarbamate ligands. Both photosensitizers show maximum emission peaks at 464.5 nm for Pb(II)–P and at 455 nm for Pb(II)–S which fell within the blue shift region where optimum efficiency was obtained. The cyclic voltammetry curve reveals pseudo-behavior, implying a better electrical conductivity. Their good recombination resistance could not improve the electron lifetime due to their poor low chemical capacitance yield. The J–V results for both sensitizers displayed satisfactory photovoltaic performance with an efficiency (η) of 3.77–3.96%. The presented study will create curiosity among materials scientists to synthesize and fabricate new complex photosensitizers that can enhance DSSC applications. It is also recommended that attention should be placed on the assembling of the solar cells, in order to reduce the rate of recombination at the photoanode/dye/electrolyte that will enhance the Voc.
Methodology
Materials
Lead(II) chloride (PbCl2) salts, ammonia solution, morpholine, diisoproylamine, methanol, diethyl ester, octylamine, carbon disulfide, methanol, and 1,4-phenylenediamine were purchased from Merck and used with no further purification. Complete testing kits from Solaronix containing the TiO2 fluorine-doped tin oxide (FTO) substrate, platinum FTO, masks, gaskets, HI-30 electrolyte iodide, chenodeoxycholic acid (CDC), and hot seal were purchased.
Synthesis of Ligands and Complexes
Synthesis of Ammonium N-1,4-Phenylendiaminedithiocarbamate, 1,4-PH DTC
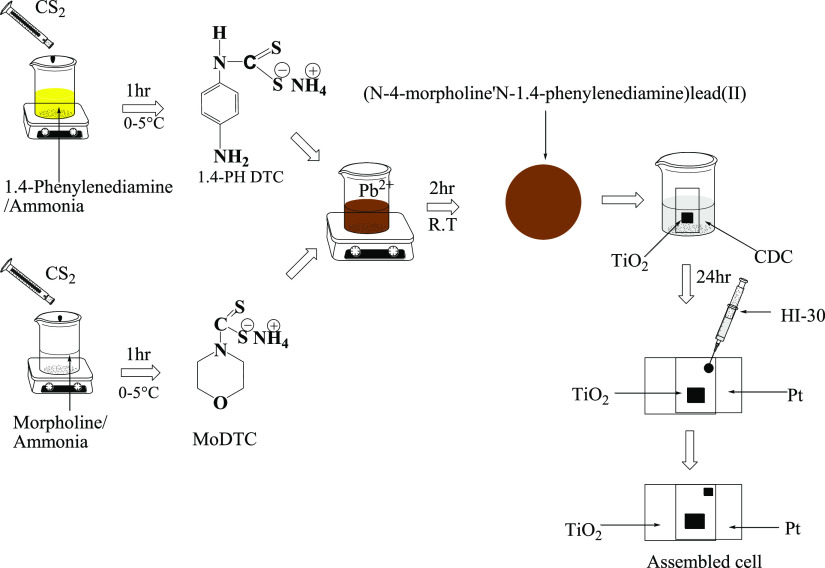
In a distinctive synthetic process, a mixture of 9.921 mL of 1.4-phenylenediamine (1.4 PHDTC) and 30 mL of concentrated aqueous ammonia in ice was injected into 6.043 mL of ice-cold carbon disulfide and stirred for 1 h, to give a white color precipitate. This was then washed with diethyl ether and dried for further analysis. Yield: 2.0732 g (20.89%). 1,4-PH DTC, 1H NMR (DMSO): δ 6.9 (m, 8H–C6H5), 3.4 (s, 2H–NH), 1.2 (t, 2H–CH2), 2.5 (s, 1H–SH). 13C NMR (DMSO): δ 40 (−NH2), 40 (−S–C) 207 (−CS2). Selected IR (cm–1) 1507 v(C–N), 974 v(C–S), 3075 v(N–H). UV–vis (CH3OH solution, nm): 325. Similar procedures were used for other ligands such as ammonium N-(4-morpholine)dithiocarbamte (as seen in Scheme 1), of 8.31 mL (0.1 mol) of morpholine, 9.64 mL (0.1 mol) of diisopropylamine, 16.548 mL of octylamine, and concentrated aqueous ammonia (30 mL) in ice bath, and 6.04 mL (0.1 mol) of cold carbon disulfide was added for each ligands. The liquid mixture was stirred for 1 h to obtain the final product which was filtered by suction and rinsed three times with cold diethyl ether.
Scheme 1. Synthesis and Assembling of Pb(II)–P and Pb(II)–S Cells.
Yield: 10.8450 g (125.73%). MODTC, 1H NMR (DMSO) 3.5 (s, 2H–NH), 2.1 (s, 1H–SH). 13C NMR (DMSO): δ 40 (S–C), 40 (NH2), 66 (C–O). Selected IR (cm–1): 1558 v(C–N), 983 v(C–S), 3177 v(N–H). UV–vis (CH3OH solution, nm): 325.
Yield: 14.8493 g (89.74%). OctDTC, selected IR (ATR, cm–1) v: 1470 (C–N), 939 (C–S), 3195 (N–H), 2920 (CH3), 2955 (CH2). 1H NMR (400.1 MHz, DMSO-d6, ppm): δ 1.3 (t, 2H–CH2), 3.5 (s, 2H–NH), 0.9 (t, 3H–CH3), 2.5 (s, 1H–SH). 13C NMR (100.6 MHz, DMSO-d6, ppm): δ = 14 (−CH3), 40 (−NH2), 19 (−CH2), 40 (C–S), 56 (C–NH). UV–vis (CH3OH solution, nm): 315.
Yield: 1.462 g (32.00%). Di-isoproylDTC, selected IR (ATR, cm–1) v: 1470 (C–N), 1095 (C–S), 3381 (N–H), 2821 (CH3). 1H NMR (400.1 MHz, DMSO-d6, ppm): δ 9.6 (s, 2H–NH),0.9 (t, 3H–CH3), 1.3 (s, 1H–SH). 13C NMR (100.6 MHz, DMSO-d6, ppm): δ 19–36 (−CH2), 202 (−CS2), 14 (−CH3), 56 (−C–NH). UV–vis (CH3OH solution, nm): 260.
Synthesis of Bis(N-1,4-phenyl-N-(4-morpholinedithiocarbamato))Pb(II) Complex as Pb(II)–S
Pb(II)–S was synthesized according to the literature method,64 and 0.4502 g (2.5 mmol) of morpholine dtc and 0.5025 g (2.5 mmol) of 1.4-phenylenediamine dtc were dissolved in about 15 mL of distilled water separately with the help of continuous stirring. PbCl2 (0.6953 g, 2.5 mmol) was also dissolved in 15 mL of distilled water separately at a ratio of 1:1:1, under constant stirring. Both ligand solutions were poured rapidly into PbCl2 solution under constant stirring. A dark brown precipitate was obtained, and the solution was allowed to stir for an hour to ensure complete reaction. The obtained precipitate was collected by vacuum filtration, washed three times with distilled water, and allowed to dry under vacuum over CaCl2. A similar procedure was used for the bis(N-diisopropyl-N-octyldithiocarbamato)Pb(II) complex, Pb(II)–P. Di-isopropyl dtc (0.4859, 2.5 mmol), 0.555 (2.5 mmol) of octyl dtc, 15 mL of distilled water, and 0.6953 g (2.5 mmol) of PbCl2 were used.
Assembling of DDSCs
QDSSCs were assembled according to the literature by ref (65) (as seen in Scheme 1), using platinum and TiO2 electrodes of 2 × 2 cm2 FTO substrate glass with 6 × 6 mm2 active areas coated on the TiO2 FTO. Sensitization of the prepared Pb(II)–P and Pb(II)–S was carried out using 10 mL of warm distilled water with CDC added as coadsorbents. The TiO2 substrate was soaked into the solution of sensitizers for 24 h. The two electrodes were held together using polyethylene and soldering iron, one coated with platinum and the other with TiO2 sensitized with the transition metal complexes. The commercial HI-30 electrolyte was introduced with a syringe as mediating solution with a content of iodide species of 0.05 M.
Physical Measurements
A PerkinElmer Lambda 25 UV–vis spectrophotometer was used to determine optical absorption properties of the samples at room temperature. The photoluminescence of the samples was obtained using a PerkinElmer LS 45 fluorimeter. All NMR analyses were carried out on a Bruker AV-400 spectrometer operating at a 1H frequency of 400.13 MHz, a temperature of 300 K, and a sample-spinning rate of 4 kHz. The 1H NMR and 13C NMR spectra were determined through a standard Bruker high-resolution magic-angle spinning probe with a magic-angle gradient. Raman spectra of the samples were obtained using a confocal Raman AFM imaging system (WITec GmbH) alpha300RS. A fiber coupled with DPSS laser of wavelength 532 nm that has an output power of 44 mW and a greatest yield control after a single mode fiber coupling was utilized as the excitation source. Fourier transform infrared (FTIR) nets were carried out by the Spectrum Two model PerkinElmer FTIR spectrophotometer at a 4 cm–1 resolution in the attenuated total reflection (ATR) mode using a ceramic light source, KBr/Ge beam splitter, and lithium tantalate (LiTaO3) detector. The spectra of FTIR were scanned between 370 and 4000 cm–1. Electrochemical studies were carried out using Metrohm 85695 Autolab—electrochemical analyzer with Nova 1.10 software. Scanning around the steady state of the DSSCs with i = 0 avoided a progressive change in the excitation state of the dye and its regeneration by the mediator at the cathode. Platinum sheet was used as a counter electrode, and titanium oxide was used as the anode, while the HI-30 iodide electrode was used as a reference electrode. CV was performed at various scan rates in the range of 0.05–0.35 V s–1 with an increase of 0.05 V s–1. All the experiments were performed at room temperature, including EIS that was carried out in the frequency range of 100 kHz to 100 mHz. Current density–voltage parameters were collected through a Keithley 2401 source meter and a Thorax light power meter. A Lumixo AM1.5 light simulator was employed, and the lamp was fixed at 50 cm height to avoid illumination outside of the working area. To avoid cell degradation, temperature was kept below 25 °C and the light power density was kept at 100 mW cm–2 (AM1.5). The XRD measurements were carried out on a Rigaku Ultima IV X-ray diffractometer using Cu Kα radiation (λ = 0.15406 nm). Field emission scanning electron microscopy (FE-SEM, Zeiss Auriga SEM) at a quickening voltage of 30 kV and JEOL JEM 2100 HRTEM instrument operating at 200 kV was utilized to study the size distributions and morphological properties of the complexes.
Acknowledgments
We appreciate the Energy, Materials and Inorganic Chemistry Research Group (EMICREG), at the University of Fort Hare for allowing to use their laboratory, materials, and instruments.
Author Contributions
M.A.A., conceptualization, methodology, validation, formal analysis, investigation, data curation, writing-original draft preparation, writing-review and editing, and visualization; J.Z.M. and E.L.M., conceptualization, methodology, review, resources, validation, funding acquisition, and supervision.
The authors wish to acknowledge the NRF Thuthuka Grant (GUN: 118139), National Department of Science and Innovation (DST/CON 0170/2019), Eskom TESP (P948), and National Research Foundation (GUN: 93215). Authors are also grateful for the financial support by Govan Mbeki Research and Development Centre (GMRDC), University of Fort Hare South Africa.
The authors declare no competing financial interest.
References
- Tadesse S. Photovoltaic performance of dye-sensitized solar cell based on eosin-Y photosensitizer and quasi-solid state electrolyte. Ethiop. J. Sci & Technol 2019, 12, 93–105. [Google Scholar]
- Hagfeldt A.; Boschloo G.; Sun L.; Kloo L.; Pettersson H. Dye-sensitized solar cells. Chem. Rev. 2010, 110, 6595–6663. 10.1021/cr900356p. [DOI] [PubMed] [Google Scholar]
- Bozic-Weber B.; Constable E. C.; Housecroft C. E. Light harvesting with Earth abundant d-block metals: development of sensitizers in dye-sensitized solar cells (DSCs). Coord. Chem. Rev. 2013, 257, 3089–3106. 10.1016/j.ccr.2013.05.019. [DOI] [Google Scholar]
- Rong Y.; Liu G.; Wang H.; Li X.; Han H. Monolithic all-solid-state dye-sensitized solar cells. Front. Optoelectron. 2013, 6, 359–372. 10.1007/s12200-013-0346-6. [DOI] [Google Scholar]
- Kakiage K.; Aoyama Y.; Yano T.; Oya K.; Fujisawa J.-i.; Hanaya M. Highly-efficient dye-sensitized solar cells with collaborative sensitization by silyl-anchor and carboxy-anchor dyes. Commun. Chem. 2015, 51, 15894–15897. 10.1039/c5cc06759f. [DOI] [PubMed] [Google Scholar]
- Muddassir M. N-methylferrocenyl-N-ethylhydroxy ammonium nitrate: synthesis, characterization, and sensitizer in dye-sensitized solar cells. Transition Met. Chem. 2020, 45, 457–465. 10.1007/s11243-020-00397-6. [DOI] [Google Scholar]
- Aghazada S.; Gao P.; Yella A.; Marotta G.; Moehl T.; Teuscher J.; Moser J.-E.; De Angelis F.; Grätzel M.; Nazeeruddin M. K. Ligand engineering for the efficient dye-sensitized solar cells with ruthenium sensitizers and cobalt electrolytes. Inorg. Chem. 2016, 55, 6653–6659. 10.1021/acs.inorgchem.6b00842. [DOI] [PubMed] [Google Scholar]
- Huang Y.; Chen W.-C.; Zhang X.-X.; Ghadari R.; Fang X.-Q.; Yu T.; Kong F.-T. Ruthenium complexes as sensitizers with phenyl-based bipyridine anchoring ligands for efficient dye-sensitized solar cells. J. Mater. Chem. C 2018, 6, 9445–9452. 10.1039/c8tc03288b. [DOI] [Google Scholar]
- Choi H.; Paek S.; Lim N.; Lee Y. H.; Nazeeruddin M. K.; Ko J. Efficient perovskite solar cells with 13.63% efficiency based on planar triphenylamine hole conductors. Chem.—Eur. J. 2014, 20, 10894–10899. 10.1002/chem.201403807. [DOI] [PubMed] [Google Scholar]
- Meng T.; Liu C.; Wang K.; He T.; Zhu Y.; Al-Enizi A.; Elzatahry A.; Gong X. High performance perovskite hybrid solar cells with E-beam-processed TiOx electron extraction layer. ACS Appl. Mater. Interfaces 2016, 8, 1876–1883. 10.1021/acsami.5b09873. [DOI] [PubMed] [Google Scholar]
- Yin H.; Chen S.; Cheung S. H.; Li H. W.; Xie Y.; Tsang S. W.; Zhu X.; So S. K. Porphyrin-based thick-film bulk-heterojunction solar cells for indoor light harvesting. J. Mater. Chem. C 2018, 6, 9111–9118. 10.1039/c8tc02838a. [DOI] [Google Scholar]
- Magomedov A.; Kasparavičius E.; Rakstys K.; Paek S.; Gasilova N.; Genevičius K.; Juška G.; Malinauskas T.; Nazeeruddin M. K.; Getautis V. Pyridination of hole transporting material in perovskite solar cells questions the long-term stability. J. Mater. Chem. C 2018, 6, 8874–8878. 10.1039/c8tc02242a. [DOI] [Google Scholar]
- Sidhik S.; Pasarán A. C.; Rosiles Pérez C.; López-Luke T.; De la Rosa E. Modulating the grain size, phase and optoelectronic quality of perovskite films with cesium iodide for high-performance solar cells. J. Mater. Chem. C 2018, 6, 7880–7889. 10.1039/c8tc02923g. [DOI] [Google Scholar]
- Mariotti N.; Bonomo M.; Fagiolari L.; Barbero N.; Gerbaldi C.; Bella F.; Barolo C. Recent advances in eco-friendly and cost-effective materials towards sustainable dye-sensitized solar cells. Green Chem. 2020, 22, 7168–7218. 10.1039/d0gc01148g. [DOI] [Google Scholar]
- Sharma K.; Sharma V.; Sharma S. S. Dye-sensitized solar cells: fundamentals and current status. Nanoscale Res. Lett. 2018, 13, 381. 10.1186/s11671-018-2760-6. [DOI] [PMC free article] [PubMed] [Google Scholar]
- Shalini S.; Balasundaraprabhu R.; Kumar T. S.; Prabavathy N.; Senthilarasu S.; Prasanna S. Status and outlook of sensitizers/dyes used in dye sensitized solar cells (DSSC): a review. Int. J. Energy Res. 2016, 40, 1303–1320. 10.1002/er.3538. [DOI] [Google Scholar]
- Kumar A.; Auvinen S.; Trivedi M.; Chauhan R.; Alatalo M. Synthesis, characterization and light harvesting properties of nickel(II) diimine dithiolate complexes. Spectrochim. Acta, Part A 2013, 115, 106–110. 10.1016/j.saa.2013.06.022. [DOI] [PubMed] [Google Scholar]
- Heuer-Jungemann A.; Feliu N.; Bakaimi I.; Hamaly M.; Alkilany A.; Chakraborty I.; Masood A.; Casula M. F.; Kostopoulou A.; Oh E.; Susumu K.; Stewart M. H.; Medintz I. L.; Stratakis E.; Parak W. J.; Kanaras A. G. The role of ligands in the chemical synthesis and applications of inorganic nanoparticles. Chem. Rev. 2019, 119, 4819–4880. 10.1021/acs.chemrev.8b00733. [DOI] [PubMed] [Google Scholar]
- Chauhan R.; Kociok-Köhn G.; Trivedi M.; Singh S.; Kumar A.; Amalanerkar D. P. Phenylmercury(II) methylferrocenyldithiocarbamate-functionalized dye-sensitized solar cells with hydroxy as an anchoring group. J. Solid State Electrochem. 2015, 19, 739–747. 10.1007/s10008-014-2660-3. [DOI] [Google Scholar]
- Van Zyl W. E.; Woollins J. D. The coordination chemistry of dithiophosphonates: An emerging and versatile ligand class. Coord. Chem. Rev. 2013, 257, 718–731. 10.1016/j.ccr.2012.10.010. [DOI] [Google Scholar]
- Singh V.; Chauhan R.; Gupta A. N.; Kumar V.; Drew M. G. B.; Bahadur L.; Singh N. Photosensitizing activity of ferrocenyl bearing Ni(II) and Cu(II) dithiocarbamates in dye sensitized TiO2 solar cells. Dalton Trans. 2014, 43, 4752–4761. 10.1039/c3dt52142g. [DOI] [PubMed] [Google Scholar]
- Singh V.; Chauhan R.; Kumar A.; Bahadur L.; Singh N. Efficient phenylmercury(II) methyl ferrocenyldithiocarbamate functionalized dye-sensitized solar cells. Dalton Trans. 2010, 39, 9779–9788. 10.1039/c0dt00575d. [DOI] [PubMed] [Google Scholar]
- Kumar A.; Chauhan R.; Molloy K. C.; Kociok-Köhn G.; Bahadur L.; Singh N. Synthesis, structure and light-harvesting properties of some new transition-metal dithiocarbamates involving ferrocene. Chem.—Eur. J. 2010, 16, 4307–4314. 10.1002/chem.200903367. [DOI] [PubMed] [Google Scholar]
- Singh V.; Kumar A.; Prasad R.; Rajput G.; Drew M. G. B.; Singh N. The interplay of secondary Hg···S, Hg···N and Hg···π bonding interactions in supramolecular structures of phenylmercury(II) dithiocarbamates. CrystEngComm 2011, 13, 6817–6826. 10.1039/c1ce05678f. [DOI] [Google Scholar]
- Rajput G.; Yadav M. K.; Thakur T. S.; Drew M. G. B.; Singh N. Versatile coordination environment and interplay of metal assisted secondary interactions in the organization of supramolecular motifs in new Hg(II)/PhHg(II) dithiolates. Polyhedron 2014, 69, 225–233. 10.1016/j.poly.2013.12.005. [DOI] [Google Scholar]
- Wang Z.; Wang H.; Liang M.; Tan Y.; Cheng F.; Sun Z.; Xue S. Judicious design of indoline chromophores for high-efficiency iodine-free dye-sensitized solar cells. ACS Appl. Mater. Interfaces 2014, 6, 5768–5778. 10.1021/am500575s. [DOI] [PubMed] [Google Scholar]
- Kumar D.; Justin Thomas K. R.; Lee C.-P.; Ho K.-C. Organic dyes containing fluorene decorated with imidazole units for dye-sensitized solar cell. J. Org. Chem. 2014, 79, 3159–3172. 10.1021/jo500330r. [DOI] [PubMed] [Google Scholar]
- Yu L.; Shi W.; Lin L.; Liu Y.; Li R.; Peng T.; Li X. Effects of benzo-annelation of asymmetric phthalocyanine on the photovoltaic performance of dye-sensitized solar cells. Dalton Trans. 2014, 43, 8421–8430. 10.1039/c4dt00411f. [DOI] [PubMed] [Google Scholar]
- Yang J.; Ganesan P.; Teuscher J.; Moehl T.; Kim Y. J.; Yi C.; Comte P.; Pei K.; Holcombe T. W.; Nazeeruddin M. K.; Hua J.; Zakeeruddin S. M.; Tian H.; Grätzel M. Influence of the donor size in D– π–A organic dyes for dye-sensitized solar cells. J. Am. Chem. Soc. 2014, 136, 5722–5730. 10.1021/ja500280r. [DOI] [PubMed] [Google Scholar]
- Lefebvre J.-F.; Sun X.-Z.; Calladine J. A.; George M. W.; Gibson E. A. Promoting charge-separation in p-type dye-sensitized solar cells using bodipy. Chem. Commun. 2014, 50, 5258–5260. 10.1039/c3cc46133e. [DOI] [PubMed] [Google Scholar]
- Bozic-Weber B.; Brauchli S. Y.; Constable E. C.; Fürer S. O.; Housecroft C. E.; Malzner F. J.; Wright I. A.; Zampese J. A. Improving the photoresponse of copper(I) dyes in dye-sensitized solar cells by tuning ancillary and anchoring ligand modules. Dalton Trans. 2013, 42, 12293–12308. 10.1039/c3dt51416a. [DOI] [PubMed] [Google Scholar]
- Bozic-Weber B.; Constable E. C.; Fürer S. O.; Housecroft C. E.; Troxler L. J.; Zampese J. A. Copper(I) dye-sensitized solar cells with [Co(bpy)3]2+/3+ electrolyte. Chem. Commun. 2013, 49, 7222–7224. 10.1039/c3cc44595j. [DOI] [PubMed] [Google Scholar]
- Davidovich R. L.; Stavila V.; Whitmire K. H. Stereochemistry of lead(II) complexes containing sulfur and selenium donor atom ligands. Coord. Chem. Rev. 2010, 254, 2193–2226. 10.1016/j.ccr.2010.05.013. [DOI] [Google Scholar]
- Lewis E. A.; McNaughter P. D.; Yin Z.; Chen Y.; Brent J. R.; Saah S. A.; Raftery J.; Awudza J. A. M.; Malik M. A.; O’Brien P.; Haigh S. J. In situ synthesis of PbS nanocrystals in polymer thin films from lead(II) xanthate and dithiocarbamate complexes: evidence for size and morphology control. Chem. Mater. 2015, 27, 2127–2136. 10.1021/cm504765z. [DOI] [Google Scholar]
- Sadovnikov S. I.; Gusev A. I. Structure and properties of PbS films. J. Alloys Compd. 2013, 573, 65–75. 10.1016/j.jallcom.2013.03.290. [DOI] [Google Scholar]
- Angeloski A.; Gentle A. R.; Scott J. A.; Cortie M. B.; Hook J. M.; Westerhausen M. T.; Bhadbhade M.; Baker A. T.; McDonagh A. M. From lead(II) dithiocarbamate precursors to a fast response PbS positive temperature coefficient thermistor. Inorg. Chem. 2018, 57, 2132–2140. 10.1021/acs.inorgchem.7b03009. [DOI] [PubMed] [Google Scholar]
- Mubiayi K. P.; Revaprasadu N.; Garje S. S.; Moloto M. J. Designing the morphology of PbS nanoparticles through a single source precursor method. J. Saudi Chem. Soc. 2017, 21, 593–598. 10.1016/j.jscs.2017.02.002. [DOI] [Google Scholar]
- Ketchemen K. I. Y.; Mlowe S.; Nyamen L. D.; Aboud A. A.; Akerman M. P.; Ndifon P. T.; O’Brien P.; Revaprasadu N. Heterocyclic lead(II) thioureato complexes as single-source precursors for the aerosol assisted chemical vapour deposition of PbS thin films. Inorg. Chim. Acta 2018, 479, 42–48. 10.1016/j.ica.2018.04.023. [DOI] [Google Scholar]
- Oluwalana A. E.; Ajibade P. A. Synthesis and crystal structures of Pb(II) dithiocarbamates complexes: precursors for PbS nanophotocatalyst. J. Sulphur Chem. 2020, 41, 182–199. 10.1080/17415993.2019.1703986. [DOI] [Google Scholar]
- Ajibade P. A.; Idemudia O. G.; Okoh A. I. Synthesis, characterization and antibacterial studies of metal complexes of sulfadiazine with N-alkyl-N-phenyldithiocarbamate. Bull. Chem. Soc. Ethiop. 2013, 27, 77–84. 10.4314/bcse.v27i1.8. [DOI] [Google Scholar]
- Shahid M.; Rüffer T.; Lang H.; Awan S. A.; Ahmad S. Synthesis and crystal structure of a dinuclear zinc(II)-dithiocarbamate complex, bis{[(μ2-pyrrolidinedithiocarbamato-S, S′)(pyrrolidinedithiocarbamato-S,S′) zinc(II)]}. J. Coord. Chem. 2009, 62, 440–445. 10.1080/00958970802255741. [DOI] [Google Scholar]
- Adeyemi J. O.; Onwudiwe D. C.; Hosten E. C. Organotin(IV) complexes derived from N-ethyl-N-phenyldithiocarbamate: Synthesis, characterization and thermal studies. J. Saudi Chem. Soc. 2018, 22, 427–438. 10.1016/j.jscs.2017.08.004. [DOI] [Google Scholar]
- Shi Y.; Chu W.; Wang Y.; Wang S.; Du J.; Zhang J.; Li S.; Zhou G.; Qin X.; Zhang C. Synthesis, characterization and cytotoxicity of the Au(III) complexes with cyclic amine-based dithiocarbamate ligands. Inorg. Chem. Commun. 2013, 30, 178–181. 10.1016/j.inoche.2013.02.010. [DOI] [Google Scholar]
- Nqombolo A.; Ajibade P. A. Synthesis and spectral studies of Ni(II) dithiocarbamate complexes and their use as precursors for nickel sulphides nanocrystals. J. Chem. 2016, 2016, 1293790. 10.1155/2016/1293790. [DOI] [Google Scholar]
- Sainorudin M. H.; Sidek N. M.; Ismail N.; Rozaini M. Z. H.; Harun N. A.; Sabiqah Tuan Anuar T. N.; Abd Rahman Azmi A. A.; Yusoff F. Synthesis, Characterization and Biological Activity of Organotin(IV) Complexes featuring di-2-ethylhexyldithiocarbamate and N-methylbutyldithiocarbamate as Ligands. GSTF J. Chem. Sci. 2015, 2, 2. 10.7603/s40837-015-0002-3. [DOI] [Google Scholar]
- Hussain A.; Begum A.; Rahman A. Characterization of nanocrystalline lead sulphide thin films prepared by chemical bath deposition technique. Arabian J. Sci. Eng. 2013, 38, 169–174. 10.1007/s13369-012-0390-3. [DOI] [Google Scholar]
- Afzaal M.; Ellwood K.; Pickett N. L.; O’Brien P.; Raftery J.; Waters J. Growth of lead chalcogenide thin films using single-source precursors. J. Mater. Chem. 2004, 14, 1310–1315. 10.1039/b313063k. [DOI] [Google Scholar]
- Akhtar J.; Malik M. A.; O’Brien P.; Helliwell M. Controlled synthesis of PbS nanoparticles and the deposition of thin films by Aerosol-Assisted Chemical Vapour Deposition (AACVD). J. Mater. Chem. 2010, 20, 6116–6124. 10.1039/c0jm00830c. [DOI] [Google Scholar]
- Krauss T. D.; Wise F. W. Coherent acoustic phonons in a semiconductor quantum dot. Phys. Rev. Lett. 1997, 79, 5102. 10.1103/physrevlett.79.5102. [DOI] [Google Scholar]
- Sadovnikov S. I.; Rempel A. A. Crystal structure of nanostructured PbS films at temperatures of 293–423 K. Phys. Solid State 2009, 51, 2375–2383. 10.1134/s1063783409110298. [DOI] [Google Scholar]
- Stadelmann K.; Elizabeth A.; Martín Sabanés N.; Domke K. F. The SERS signature of PbS quantum dot oxidation. Vib. Spectrosc. 2017, 91, 157–162. 10.1016/j.vibspec.2016.08.008. [DOI] [Google Scholar]
- Lin C.-M.; Hsu I.-J.; Lin S.-C.; Chuang Y.-C.; Chen W.-T.; Liao Y.-F.; Juang J.-Y. Pressure effect on impurity local vibrational mode and phase transitions in n-type iron-doped indium phosphide. Sci. Rep. 2018, 8, 1284. 10.1038/s41598-018-19679-2. [DOI] [PMC free article] [PubMed] [Google Scholar]
- Adeyemi J. O.; Onwudiwe D. C. PbS Nanoparticles Prepared Using 1,10-Phenanthroline Adduct of Lead(II) Bis(N-alkyl-N-phenyldithiocarbamate) as Single Source Precursors. Molecules 2020, 25, 2097. 10.3390/molecules25092097. [DOI] [PMC free article] [PubMed] [Google Scholar]
- Saah S. A.; Boadi N. O.; Adu-Poku D.; Wilkins C. Lead ethyl dithiocarbamates: Efficient single-source precursors to PbS nanocubes. R. Soc. Open Sci. 2019, 6, 190943. 10.1098/rsos.190943. [DOI] [PMC free article] [PubMed] [Google Scholar]
- Sathiyaraj E.; Thirumaran S. Synthesis and spectral studies on Pb(II) dithiocarbamate complexes containing benzyl and furfuryl groups and their use as precursors for PbS nanoparticles. Spectrochim. Acta, Part A 2012, 97, 575–581. 10.1016/j.saa.2012.06.052. [DOI] [PubMed] [Google Scholar]
- Kanchi S.; Singh P.; Bisetty K. Dithiocarbamates as hazardous remediation agent: A critical review on progress in environmental chemistry for inorganic species studies of 20th century. Arabian J. Chem. 2014, 7, 11–25. 10.1016/j.arabjc.2013.04.026. [DOI] [Google Scholar]
- Bhatt S. V.; Deshpande M. P.; Chaki S. H.; Patel N. H.; Pandy N.; Soni B. H. Chemical synthesis and characterization of lead sulphide (PbS) nanoparticles. AIP Conf. Proc. 2011, 1349, 281–282. 10.1063/1.3605844. [DOI] [Google Scholar]
- Yun S.; Lund P. D.; Hinsch A. Stability assessment of alternative platinum free counter electrodes for dye-sensitized solar cells. Energy Environ. Sci. 2015, 8, 3495–3514. 10.1039/c5ee02446c. [DOI] [Google Scholar]
- Neetu; Manar K. K.; Srivastava P.; Singh N. Homoleptic d10 metal complexes containing ferrocenyl functionalized dithiocarbamates as sensitizers for TiO2 based dye-sensitized solar cells. Sol. Energy 2018, 176, 312–319. 10.1016/j.solener.2018.10.033. [DOI] [Google Scholar]
- Yadav R.; Waghadkar Y.; Kociok-Köhn G.; Kumar A.; Rane S. B.; Chauhan R. Transition metal ferrocenyl dithiocarbamates functionalized dye-sensitized solar cells with hydroxy as an anchoring group. Opt. Mater. 2016, 62, 176–183. 10.1016/j.optmat.2016.09.071. [DOI] [Google Scholar]
- Chen Y.; Zhang X.; Tao Q.; Fu W.; Yang H.; Su S.; Mu Y.; Zhou L.; Li M. High catalytic activity of a PbS counter electrode prepared via chemical bath deposition for quantum dots-sensitized solar cells. RSC Adv. 2015, 5, 1835–1840. 10.1039/c4ra08076a. [DOI] [Google Scholar]
- Onah E. O.; Offiah S. U.; Chime U. K.; Whyte G. M.; Obodo R. M.; Ekechukwu O. V.; Ahmad I.; Ugwuoke P. E.; Ezema F. I. Comparative photo-response performances of dye sensitized solar cells using dyes from selected plants. Surf. Interfaces 2020, 20, 100619. 10.1016/j.surfin.2020.100619. [DOI] [Google Scholar]
- Tyona M. D.; Jambure S. B.; Lokhande C. D.; Banpurkar A. G.; Osuji R. U.; Ezema F. I. Dye-sensitized solar cells based on Al-doped ZnO photoelectrodes sensitized with rhodamine. Mater. Lett. 2018, 220, 281–284. 10.1016/j.matlet.2018.03.040. [DOI] [Google Scholar]
- Agoro M. A.; Mbese J. Z.; Meyer E. L. Electrochemistry of Inorganic OCT-PbS/HDA and OCT-PbS Photosensitizers Thermalized from Bis(N-diisopropyl-N-octyldithiocarbamato) Pb(II) Molecular Precursors. Molecules 2020, 25, 1919. 10.3390/molecules25081919. [DOI] [PMC free article] [PubMed] [Google Scholar]
- Mbese J. Z.; Meyer E. L.; Agoro M. A. Electrocatalytic properties of PbS nanocrystals structured from (bis(N-1,4-phenyl-N-(4-morpholine))dithiocarbamato Pb(II) complexes) as photosensitizer for quantum-dots-sensitized solar cells. Mater. Lett. 2020, 271, 127770. 10.1016/j.matlet.2020.127770. [DOI] [Google Scholar]


