Abstract
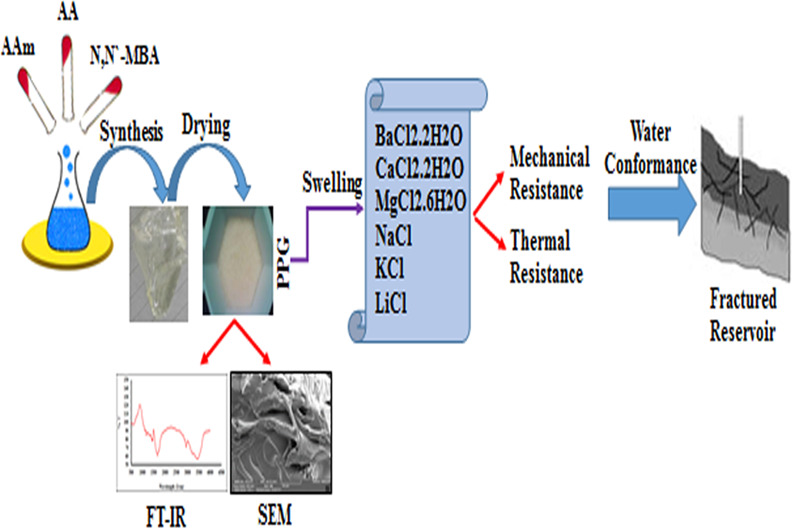
Unwanted water production is a serious problem accompanying oil extraction especially in oil-fractured reservoirs. An effective approach to tackle this issue is to utilize gels as a blockage agent. In this paper, an effective series of preformed particle gels (PPGs) was synthesized by a free radical copolymerization of acrylamide and acrylic acid [poly(AAm-co-AA)] copolymers. The key factors of synthesis experiments, gelation time, drying behavior, swelling capacity (in CaCl2·2H2O, MgCl2·6H2O, BaCl2·2H2O, KCl, NaCl, and LiCl saline solutions with 200,000 ppm concentration and pH from 3 to 8), and mechanical and thermal resistance of the synthesized PPGs (with a homemade apparatus) were elucidated. Laboratory results revealed that the prepared PPG sample 1 (9.65 mole ratio of AAm/AA and 6 mol % of MBA) would be a good candidate for controlling water in oil and gas reservoirs with a salinity, pressure, and temperature of up to 200,000 ppm, 300 bar, and 170 °C, respectively, and pH values ranging from 3 up to 8.
Introduction
Unwanted water production is a serious problem widely occurring during oil production.1 Almost the daily global water production from oil reservoirs is estimated to be around 220 million barrels, which is equal to an average water to oil ratio of 3:1.2 Processing this unwanted water will cause the annual global cost of water handling to increase even to more than 40 billion dollars.3 Besides, unwanted water production causes several environmental problems such as microbial growth, scale formation, and corrosion. Reducing oil and gas recovery factors resulting from excess water production led researchers to seek ways to control unwanted water production.4−6
Hitherto, many researchers had concluded that gel treatment in fracture reservoirs would be good to enhance oil recovery.7−9 Generally, gel treatment reduces water production by changing wettability10,11 or blocking fractures.12 Two kinds of gels can be placed in fractures to control unwanted water production from oil and gas wells: immature gel (gelant)13−15 and preformed particle gel (PPG).16,17 In in situ crosslinking gels, a gelant, which is a mixture of monomers, polymers, and crosslinkers, is injected into a target formation, and the gel formation process occurs under reservoir conditions. The formed gels prevent water production by fully or partially sealing the formation zone, increasing the sweep efficiency. However, PPGs are dry powders with adjustable size between μm and cm prepared from hydrogels with a high capacity of water absorption. The crosslinking process of PPGs occurs on the surface facilities, and then, the prepared PPGs are injected into the reservoir formation. PPGs swell in formation water between 30 and 200 times of their basic size with a controllable swelling rate and block the naturally or artificially created fractures.18,19 The most important superiority of PPGs over the gelant is that the gelation time, an underlying factor for the success of conformance control, is precisely controllable in PPGs, while in gelants, it is significantly affected by reservoir conditions such as the pressure, temperature, pH, and salinity of the formation.20 Therefore, the major challenge in the gelant injection process is the uncertainty in its gelation time. The conversion of the gelant into the gel before it reaches target formation or gelant dilution in contact with water fails the gelant performance.21 Although the gelants have less mechanical strength, PPGs are resistant to all types of saline solutions with high concentrations and have good thermal and mechanical resistance.22−24 Therefore, scientific research studies confirmed that the performance of PPGs was more prosperous than that of in situ gels in preventing excess water production from oil reservoirs.25−27
Field studies indicated that the synthesis approach of hydrogels,28−30 salt solution properties (including the salt type and concentration and pH of the solution), and environmental properties where PPGs are placed (including temperature and pressure of the medium) can affect the PPG performance.31,32 Imran et al.33 discussed the challenges existing in environmentally and economically producing oil from reservoirs including undesirable water channels. They concluded that conformance control, PPG transportation, and surface wettability are deciding factors affecting PPG efficiency. Sedy Esfahlan et al.34 comprehensively categorized PPGs and investigated main factors affecting their performance including their size, swelling capacity, blockage efficiency, and rheological properties. Lenji et al.35 investigated the effect of polymer concentration, crosslinker mole percentage, temperature, pH, and salinity on the PPG swelling capacity. Their results revealed that increasing polymer concentration, crosslinker mole percentage, and salinity causes PPG swelling capacity to reduce, while pH outside the range of 5–9 and temperature more than 100 °C did not significantly affect the PPG swelling capacity. Mehrabianfar et al.36 investigated the application of a kind of superabsorbent polymers crosslinked with potassium salt on fracture plugging. They used a glass micromodel to investigate the sweep efficiency of the PPGs and concluded that water diversion into the zone with low permeability, resulting from fracture plunging, is the main mechanism of PPG treatment. Salehi et al.37 introduced the network parameters of PPGs as a novel technique in predicting the PPG performance in porous media and in investigating the PPG resistance under high-salt conditions.
Since PPG injection is one of the best and most impressive methods to block the naturally or artificially fractured reservoirs, in this study, almost all the vital factors that can influence PPG application in blocking fractures were investigated. To do this, the synthesis approach of the PPG samples (different mole percentages of the crosslinker agent and various mole ratios of monomers), their drying behavior under three different conditions (atmospheric conditions; oven, 60 °C; and vacuum oven, 60 °C), and their swelling behavior in different salt solutions (BaCl2·2H2O, CaCl2·2H2O, MgCl2·6H2O, KCl, NaCl, and LiCl with 200,000 ppm concentration and pH values ranging from 3 to 8) were simultaneously examined. Then, for the first time, the mechanical and thermal resistances of the synthesized hydrogels were concurrently examined in a homemade device at high pressures (up to 300 bar) and high temperatures (up to 170 °C). In the end, the performance evaluation of the synthesized PPGs was conducted in order to suggest a proper PPG with the ability to block fractures and prevent undesirable water production from oil reservoirs.
Experimental Section
Materials and Instrumentation
Two monomers including acrylamide (AAm, >99%, Sigma-Aldrich) and acrylic acid (AA, >99%, Sigma-Aldrich) were used as the reactants in the polymerization process. Potassium persulfate (KPS, >99%, Sigma-Aldrich) and N,N′-methylenebisacrylamide (MBA, >99%, Sigma-Aldrich) were considered as the initiator and crosslinker agents, respectively. Distilled water was used throughout synthesis experiments. Swelling capacity of the synthesized PPG samples was investigated in several inorganic saline solutions including lithium chloride (LiCl, >98%, Merck), sodium chloride (NaCl, >99.5%, Merck), magnesium chloride hexahydrate (MgCl2·6H2O, 99%, Merck), potassium chloride (KCl, >99%, Merck), barium chloride dihydrate (BaCl2·2H2O, >99%, Merck), and calcium chloride dihydrate (CaCl2·2H2O, 99%, Merck). To adjust the pH value, NaOH (99%, Sigma-Aldrich, 0.1 M) and HCl (99%, Sigma-Aldrich, 0.1 M) were used. The pH of saline solutions was measured with a pH meter (±0.1 error, Milwaukee pH Meter w/ATC) calibrated with the buffer solutions with pH 4, 7, and 10. A digital balance measured the weight of swollen PPG samples (Sartorius balance, BP 210 S, German). Wet swollen hydrogel samples were dried on a filter paper (grade 40:8 μm, Whatman filter paper) under room conditions. Carbonate slabs were taken from an Iranian oil reservoir. A core-slabbing device (France-VINCI, 4000 W) was used to cut carbonate slabs into a cylindrical shape with a length and diameter of 5 and 2.54 cm, respectively. A Shimadzu FTIR-8300 instrument and scanning electron microscope (VEGA3 TESCAN, at 20 kV) were used to record the Fourier-transform infrared spectroscopy (FT-IR) spectra and scanning electron microscopy (SEM) images of PPG samples, respectively.
Synthesis of PPGs
In capped poly(vinyl chloride) straws, samples were synthesized by a free radical approach.38 The amount of AAm in all of the experiments was kept at 0.50 g. In each straw, a specified amount of AA and 0.50 g of AAm were solved in 1.0 mL of distillated water. A total of 0.20 mL of MBA solution (as a crosslinker agent, 6–18 mol % MBA/mL water) was then added to each straw. After that, 0.10 mL of potassium persulfate solution as an initiator (0.05 g of KPS/mL of water) was subjoined to the reaction mixture. To active the initiator agent and complete the synthesis process, straws were kept in an oil bath at 80 °C for 3 h. In the end, samples were put out from the straws, washed with distillated water, cut into small pieces, and dried in three consequent steps: under atmospheric conditions, in an oven, and in a vacuum oven.
Swelling Study
To measure the swelling percentage (% S) of the synthesized samples, 0.10 g of the dried PPG sample (0.2–1.0 μm) was put into each CaCl2·2H2O, MgCl2·6H2O, BaCl2·2H2O, NaCl, LiCl, and KCl (20 mL, 200,000 ppm) salt solution under ambient conditions for 3 h. Meanwhile, samples were removed from each saline solution and weighed using a digital balance every 3 min. Equation 1 indicates the procedure of swelling percentage calculation of the PPG samples below
| 1 |
In the end of the initial swelling study, which took 3 h, PPG samples were maintained in their salt solutions for 12 months. After this time, the equilibrium swelling capacity10 of the samples was measured as eq 2
| 2 |
pH Sensitivity
As the PPG samples should be used in acidic and alkaline medium, the effect of pH on the swelling capacity of samples was also investigated. To do so, two saline solutions (20 mL, 200,000 ppm) were prepared from each of the divalent salts, BaCl2·2H2O, MgCl2·6H2O, and CaCl2·2H2O. For each type of the salts, two alkaline and acidic solutions were made with NaOH (0.1 M) and HCl (0.1 M), respectively. Then, 0.1 g of the dried sample was first swollen in the alkaline medium for half an hour. Next, it was swollen in the acidic medium for another half an hour. Sample displacement between alkaline and acidic media was repeated from every half an hour to 3 h. In each solution, swelling percentage of the synthesized PPG samples was calculated using eq 1, and pH of the saline solutions was measured using a pH meter every 3 min.
Physical and Chemical Experiments
PPG samples (sample 1–9) were prepared through a free radical copolymerization approach. The chemical situations of PPG production are given in Table 1. Synthesized samples were dried in three successive stages, that is, under atmospheric conditions, in an oven (60 °C), and in a vacuum oven (60 °C). The PPG swelling percentages were investigated in several saline solutions including CaCl2·2H2O, MgCl2·6H2O, BaCl2·2H2O, NaCl, LiCl, and KCl (20 CC., 200,000 ppm) at room temperature.
Table 1. Synthesis Conditions of PPG Samples.
| sample | AAm (gr) | AA (mL) | AAm/AA (mole ratio) | MBA (mol %) |
|---|---|---|---|---|
| 1 | 0.5 | 0.05 | 9.65 | 6 |
| 2 | 0.5 | 0.05 | 9.65 | 14 |
| 3 | 0.5 | 0.05 | 9.65 | 18 |
| 4 | 0.5 | 0.10 | 4.82 | 6 |
| 5 | 0.5 | 0.10 | 4.82 | 14 |
| 6 | 0.5 | 0.10 | 4.82 | 18 |
| 7 | 0.5 | 0.20 | 2.41 | 6 |
| 8 | 0.5 | 0.20 | 2.41 | 14 |
| 9 | 0.5 | 0.20 | 2.41 | 18 |
Mechanical and Thermal Experiments
A homemade instrument was used to measure the maximum pressure and temperature that the swollen PPG samples are capable of tolerating without destructing their structures. Mechanical and thermal experiments were performed with the synthesized samples and prepared salt solutions (20 mL, 200,000 ppm), as explained below.
Device Description
The mechanical and thermal resistance measurement of hydrogels was done using a homemade device; its schematic diagram is shown in Figure 1a,b. It is a cylindrical vessel (ss-316) with a length of 20 cm and a diameter of 5 cm surrounded by a coil element and connected to a controller (SUNWARD ENG, SUN15-TC) to set the required temperature of the system. To measure PPG damage at low-permeability zones, a cylindrical space for a core sample with a length of 5 cm and a diameter of 2.54 cm was considered at the bottom of the device. The maximum working pressure and temperature of the device are up to 600 bar and 180 °C, respectively.
Figure 1.
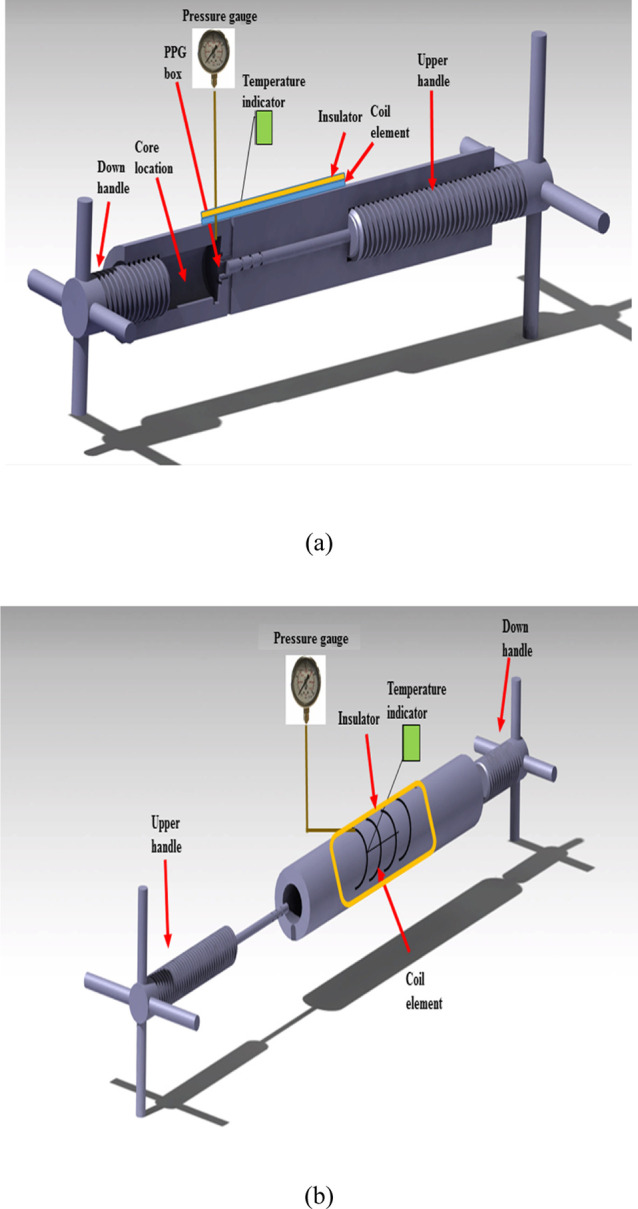
Schematic diagram of the device: (a) inner view (b) exterior view.
Mechanical Resistance Measurement
Mechanical resistance is considered as the maximum pressure that the hydrogel can tolerate before breaking. To assay the mechanical resistance of the PPG samples, PPGs were swollen up to 20 wt % of their equilibrium swelling capacities (eq 1). The swollen samples were put into the device and enclosed with the core sample (from the end) and the upper handle of the device (from the top). By rotating the upper handle, pressure force with a magnitude of more than 5 bar was exerted on the swollen PPG samples every second. The pressure changes were monitored using a pressure gauge installed in the container containing swollen PPGs. It was expected that the pressure increases until the structure of the PPG samples collapses. The pressure at which the gel structure breaks down indicates the mechanical strength of the hydrogels.
Thermal Resistance Measurement
Thermal resistance of the hydrogel is defined as the temperature at which the gel structure decomposes. To calculate the thermal resistance of the PPG samples, the prepared core sample was put into the bottom section of the device. PPG samples were swollen as described in the “Mechanical Resistance Measurement” and then disembogued into the device. Next, the thermal coil, which was firmly wrapped around the device, was turned on to heat the PPG samples up to 170 °C. Since the outer surface of the thermal coil wrapped around the outer surface of the device was entirely covered with thermal insulation (rockwool), it was expected that the heat transfer would be completely conducted to the hydrogels with minimum heat loss. After half an hour, the PPG samples were removed from the device and weighed. In this experiment, the upper handle was open, and the water evaporated from the hydrogels was exported from the encasement.
Concurrent Mechanical and Thermal Resistance Measurement
To simultaneously measure mechanical and thermal resistances of the PPG samples, all the mentioned studies in the mechanical resistance experiment were repeated. However, in this step, after arriving to the desired pressure (300 bar), the thermal coil was turned on, and the PPG samples were heated. The upper handle closed the path through which vapor can exit; therefore, the evaporated water from the samples could not be extracted from the device and pressure increased continually. The pressure of the device had to be kept at 300 bar with rotating the upper handle and increasing the volume, which was available for the PPG samples. Thereupon, experiments ended as soon as vapor could be removed from the device with another slightest rotating movement of the upper handle. In the end of the experiment, the PPG samples were removed from the device and reweighed.
Results and Discussion
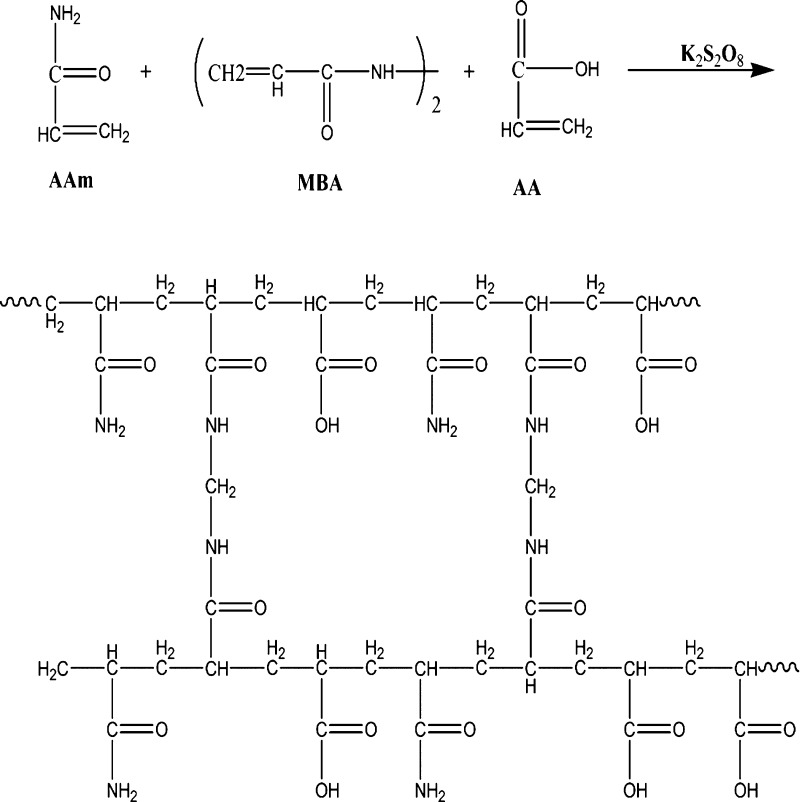
In this paper, nine poly(AAm-co-AA) copolymers were synthesized through a free radical approach. Scheme 1 illustrates the occurred reaction in the synthesis medium. FT-IR tests confirmed the desired structures in the synthesized PPG samples. As an example for sample 1, according to Figure 2, the bands of N–H and O–H (appeared in the range of 3100–3500 cm–1) clearly show poly(AAm-co-AA) formation. In addition, there are two absorption peaks in the range of 3163–3394 cm–1 because of the symmetric and asymmetric NH2 stretching vibrations of AAm and one peak at 1120 cm–1 due to C–C stretching vibrations. Besides, the wide absorption bands (appeared in the range of 3400–2975 cm–1) are attributed to the −OH from the carboxylic group. The stretching vibrations of CH2, CH, C–O of the carbonyl group of acrylamide, C–O of the carbonyl group of acrylic acid, and C–N can be confirmed based on the values of 2916, 1846, 1643, 1720, and 1436 cm–1, respectively. In addition, the SEM images of the PPG samples were taken to show the morphology of samples. The magnitude of most pores existing in samples 1, 2, 4, and 7 was about 1.6, 1.8, 1.9, and 4.4 μm, respectively (Figure S1a–d). Therefore, the size of pores was changed from 1.6 to 4.4 μm by changing vital factors.
Scheme 1. Schematic Preparation of the Preformed Particle Hydrogel.
Figure 2.
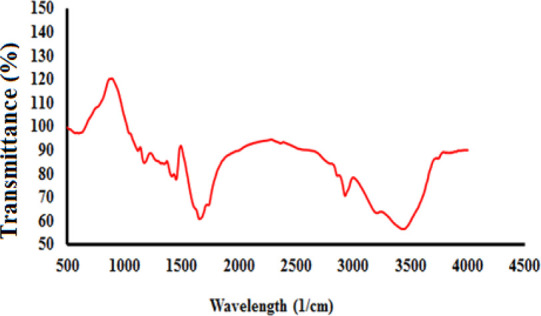
Fourier transform infrared spectroscopy of sample 1.
Physical and Chemical Experiments
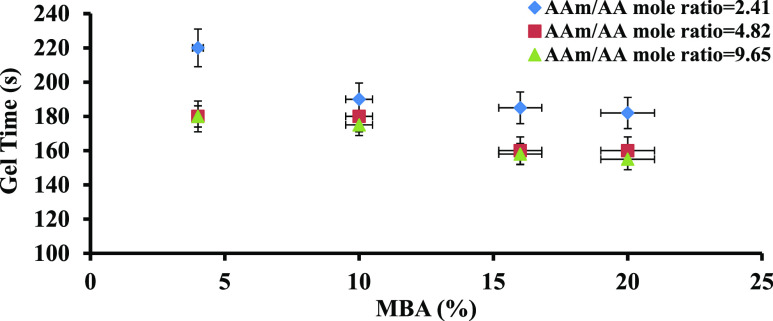
Gelation time is the first parameter that was measured and examined in the synthesis reaction. The transformation time from the viscous structure into a tensile structure is named as the gelation time. As the straw was visible, this transformation was easily viewed; besides, there was a thermal jumping at this point appearing on the thermometer embedded in the synthesis medium. The mole ratio of AAm/AA and the concentration of MBA affected the gelation time. Figure 3 and Table 2 show that the gelation time decreased with increasing mole percentage of the crosslinker agent and, therefore, increasing viscosity of the hydrogel. Similarly, the growth of macroradical chains and the mobility of the reactants can be restricted with a rising AAm/AA mole ratio; therefore, the gelation time of the hydrogels decreased with a rising mole ratio of AAm/AA.
Figure 3.
Effect of MBA concentration on the gelation time.
Table 2. Gelation Time of PPG Samples.
| sample | AAm/AA (mole ratio) | MBA (mol %) | gelation time (s) |
|---|---|---|---|
| 1 | 9.65 | 6 | 180 |
| 2 | 9.65 | 14 | 170 |
| 3 | 9.65 | 18 | 155 |
| 4 | 4.82 | 6 | 188 |
| 5 | 4.82 | 14 | 185 |
| 6 | 4.82 | 18 | 165 |
| 7 | 2.41 | 6 | 208 |
| 8 | 2.41 | 14 | 207 |
| 9 | 2.41 | 18 | 200 |
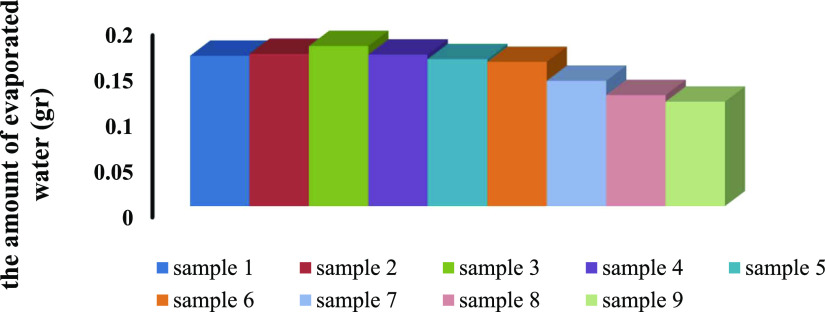
After completion of the synthesis experiments, samples were dried and cut into small pieces. In this study, all PPG samples were dried in three different steps: under ambient conditions (25 °C, half an hour), in an oven (60 °C, half an hour), and in a vacuum oven (60 °C, 24 h). In the first step, samples were picked from the straws and immediately placed on a digital balance. The weight of the samples was recorded at regular time intervals of 5 min for half an hour. The next step started instantly after the first one; PPG samples were put into an oven (60 °C) for half an hour, and they were taken out every 5 min to be weighed quickly and then returned to the oven. In the third step, samples were kept in a vacuum oven for 24 h (60 °C), and after that time, the weight of the samples was recorded again. The amount of water evaporation was calculated according to the PPGs’ weight loss. It was expected that water evaporates from surface and large pores (15–25 μm) in the first step, from medium pores (7–15 μm) in the second step, and from small pores (3–7 μm) in the third step. Figure 4 and Table 3 illustrate the amount of evaporated water from PPG samples under atmospheric conditions. It is clear that the amount of weight reduction of samples was first increased with decreasing the mole ratio of AAm/AA because of increasing amide–water and carboxylate–water hydrogen bonds, and then, it was decreased due to increasing repulsive forces among the functional groups. The role of MBA concentration in the amount of water evaporation from samples was more important in high mole ratios of AAm/AA. In addition, in low concentration of MBA, larger pores are likely to form. Therefore, the amount of evaporated water from PPG samples increased with decreasing mole percentage of MBA. The water reduction of samples in the oven and vacuum oven was similar to that expressed under atmospheric conditions (Figure S2a,b and Tables S1 and S2).
Figure 4.
Amount of evaporated water from samples under atmospheric conditions.
Table 3. Amount of Evaporated Water (gr) under Atmospheric Conditions (25 °C and 1 atm).
| sample | AAm/AA (mole ratio) | MBA (mol %) | the amount of evaporated water (g) |
|---|---|---|---|
| 1 | 9.65 | 6 | 0.1647 |
| 2 | 9.65 | 14 | 0.1373 |
| 3 | 9.65 | 18 | 0.1145 |
| 4 | 4.82 | 6 | 0.1660 |
| 5 | 4.82 | 14 | 0.1753 |
| 6 | 4.82 | 18 | 0.1217 |
| 7 | 2.41 | 6 | 0.1610 |
| 8 | 2.41 | 14 | 0.1667 |
| 9 | 2.41 | 18 | 0.1580 |
The dried PPG samples were then cut into small pieces in the range of 1–2 μm. Next, the swelling percentage of the synthesized PPG samples was measured in the several saline solutions including CaCl2·2H2O, MgCl2·6H2O, BaCl2·2H2O, KCl, NaCl, and LiCl (20 mL, 200,000 ppm, under atmospheric conditions). It was found that all the PPG samples were more swollen over time (Figure S3a–f and Tables S3–S8), and the MBA mole percentage, AAm/AA mole ratio, type of salt solution, pH of the saline solution, and time can affect the swelling percentage of samples.
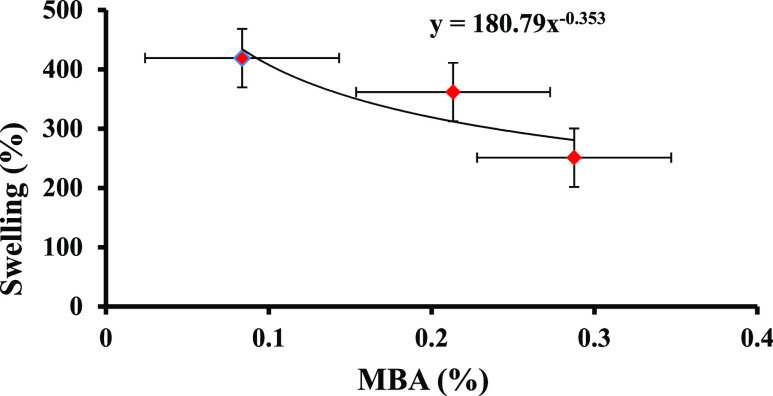
To examine the effect of MBA concentration on the swelling capacity of PPG samples, Figure 5 and Table 4 show the swelling percentage of PPG samples versus the mole percentage of MBA in CaCl2·2H2O salt solution with the AAm/AA mole ratio of 4.82 and swelling time of 180 min. As can be seen, the swelling capacity of PPG samples reduced with rising mole percentage of MBA. Increasing the crosslinker agent causes the density of the solution to increase, forming a viscous structure with a low ability to expand and absorb a large amount of water.39,40 The power law eq 3 describes the swelling behavior of samples versus the mole percentage of MBA in the mentioned conditions (obtained from the curve fitting).
| 3 |
where 0.353 and 180.79 show the impact of MBA mole percentage on the swelling capacity of PPG samples and the difference of swelling capacity of two samples in the same amount of the crosslinker agent, respectively.
Figure 5.
Swelling percentage of samples (% S) vs MBA concentration.
Table 4. Effect of MBA Changes on the Swelling Percentage of PPG Samples in the CaCl2·2H2O Salt Solution.
| sample | AAm/AA (mole ratio) | MBA (mol %) | swelling time (min) | swelling (%) |
|---|---|---|---|---|
| 4 | 4.82 | 6 | 180 | 419 |
| 5 | 4.82 | 14 | 180 | 362 |
| 6 | 4.82 | 18 | 180 | 251 |
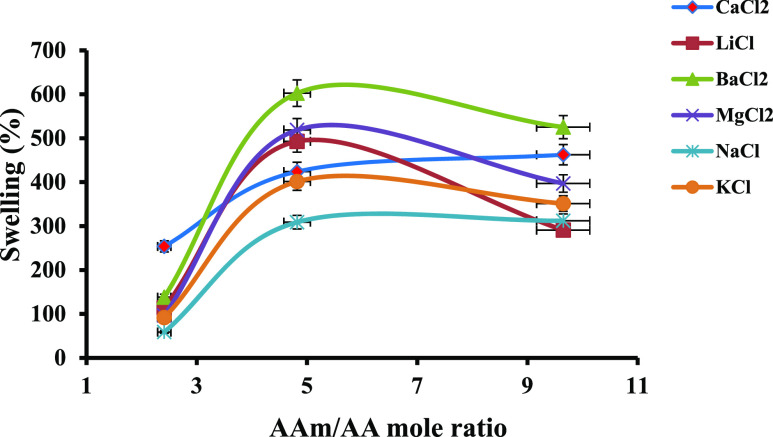
The impact of the AAm/AA mole ratio on the swelling percentage of PPG samples is shown in Figure 6 and Table 5 (the mole percentage of MBA, weight of AAm, and time of swelling were kept at 6 mol %, 0.5 g, and 177 min, respectively, as an example). Based on Figure 6, the swelling percentage of samples was first increased until 4.82 mole ratio of AAm/AA, and then, it was decreased. The flourishing section of the curve was because of the reduction of repulsive forces among the carboxylate groups existing in the AA structure. The falling section of the curve was due to the increasing viscosity of the solution and the reduction of the osmotic pressure resulting from the carboxylate groups existing in the copolymer chains.41,42
Figure 6.
Swelling percentage of samples (% S) vs AA concentration.
Table 5. Effect of the AAm/AA Mole Ratio on the Swelling Percentage of the PPG Samples.
| sample | saline solution | AAm/AA (mole ratio) | MBA (mol %) | swelling time (min) | swelling (%) |
|---|---|---|---|---|---|
| 4 | CaCl2·2H2O | 2.41 | 6 | 177 | 254 |
| 5 | CaCl2·2H2O | 4.82 | 6 | 177 | 424 |
| 6 | CaCl2·2H2O | 9.65 | 6 | 177 | 462 |
| 4 | MgCl2·6H2O | 2.41 | 6 | 177 | 114 |
| 5 | MgCl2·6H2O | 4.82 | 6 | 177 | 493 |
| 6 | MgCl2·6H2O | 9.65 | 6 | 177 | 291 |
| 4 | BaCl2·2H2O | 2.41 | 6 | 177 | 138 |
| 5 | BaCl2·2H2O | 4.82 | 6 | 177 | 603 |
| 6 | BaCl2·2H2O | 9.65 | 6 | 177 | 525 |
| 4 | LiCl | 2.41 | 6 | 177 | 97 |
| 5 | LiCl | 4.82 | 6 | 177 | 519 |
| 6 | LiCl | 9.65 | 6 | 177 | 397 |
| 4 | NaCl | 2.41 | 6 | 177 | 59 |
| 5 | NaCl | 4.82 | 6 | 177 | 309 |
| 6 | NaCl | 9.65 | 6 | 177 | 312 |
| 4 | KCl | 2.41 | 6 | 177 | 92 |
| 5 | KCl | 4.82 | 6 | 177 | 401 |
| 6 | KCl | 9.65 | 6 | 177 | 351 |
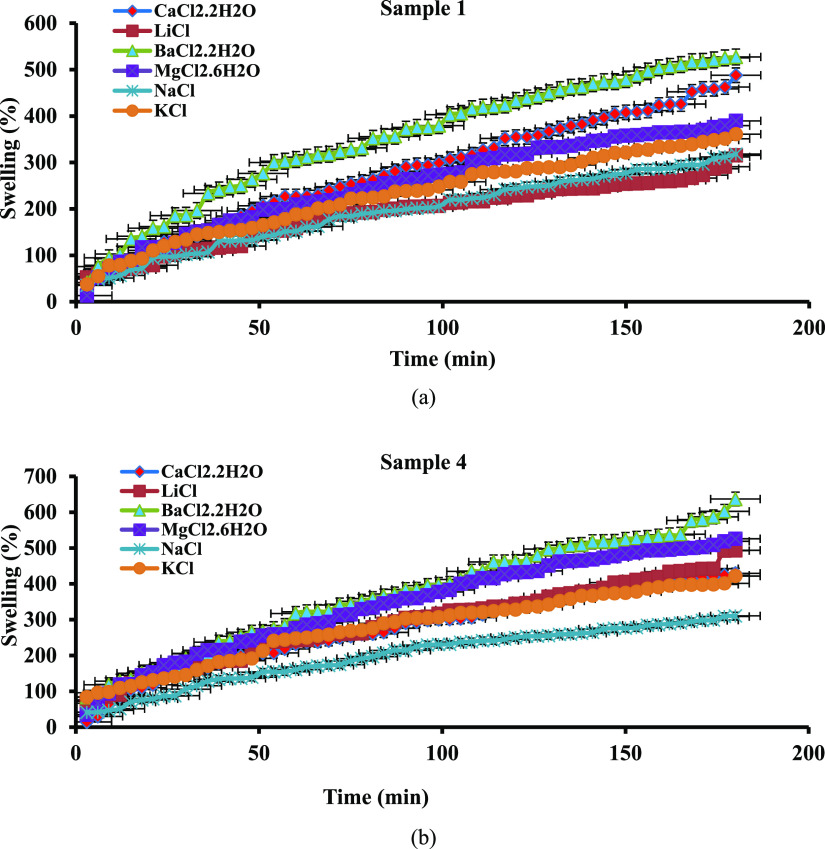
Among all PPG samples, samples 1 and 4 had more swelling percentage in all the examined salt solutions. To compare the ability of the salt solutions in swelling PPG samples, the swelling curves of samples 1 and 4 are typically plotted in Figure 7a,b and Tables S9 and S10, respectively. As the anionic species in the all mentioned salt solutions was chloride ions, the observed differences among swelling curves in Figure 7 can be attributed to the type of cations existing in the prepared salt solutions (Ba2+, Ca2+, Sr2+, Mg2+, K+, Na+, and Li+). There are more ions that are mobile in the saline solutions with divalent cations such as CaCl2·2H2O, MgCl2·6H2O, and BaCl2·2H2O than those with monovalent cations such as LiCl, KCl, and NaCl. Therefore, the osmotic pressure resulted from the difference between the mobile ions existing in the salt solutions and in the PPG structure, and water absorbency was more in the saline solutions with the divalent cations than for those with the monovalent cations.
Figure 7.
Swelling percentage of samples (% S) vs time: (a) sample 1 (b) sample 4.
To predict the amount of swollen PPG samples that is required to control unwanted water production from oil fields, the maximum swelling capacity of samples must be known. This is a key factor called the equilibrium swelling ratio.10 To do so, 0.1 g of each dried PPG sample was kept in each of the mentioned salt solutions (20 mL, 200,000 ppm) for 12 months under atmospheric conditions. After that time, samples were weighed, and their equilibrium swelling ratio was calculated by eq 2.
The results presented in Table 6 showed that samples had high equilibrium swelling ratios in the saline solutions with divalent cations than with monovalent cations, and sample 1 had the greatest equilibrium swelling ratio equal to 11.72 in BaCl2·2H2O salt solution (200,000 ppm concentration).
Table 6. Maximum Equilibrium Swelling Percentage of PPG Samples.
| equilibrium
swelling ratio |
||||||
|---|---|---|---|---|---|---|
| sample | CaCl2·2HO | BaCl2·2HO | MgCl2·6H2O | NaCl | KCl | LiCl |
| 1 | 11.56 | 11.72 | 11.23 | 9.04 | 8.79 | 10.80 |
| 2 | 7.43 | 11.34 | 6.86 | 5.33 | 4.92 | 7.33 |
| 3 | 6.02 | 5.77 | 5.37 | 4.61 | 4.23 | 5.51 |
| 4 | 6.65 | 11.36 | 8.01 | 6.73 | 6.03 | 8.14 |
| 5 | 7.02 | 6.19 | 5.75 | 4.78 | 4.54 | 6.44 |
| 6 | 5.14 | 5.13 | 3.54 | 4.19 | 4.06 | 5.57 |
| 7 | 4.40 | 4.46 | 2.83 | 2.47 | 2.42 | 3.45 |
| 8 | 2.46 | 2.86 | 1.42 | 1.33 | 1.16 | 3.27 |
| 9 | 2.61 | 2.09 | 1.59 | 1.21 | 0.72 | 3.20 |
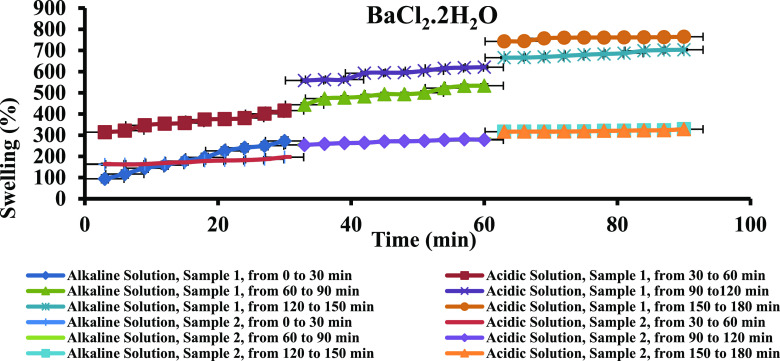
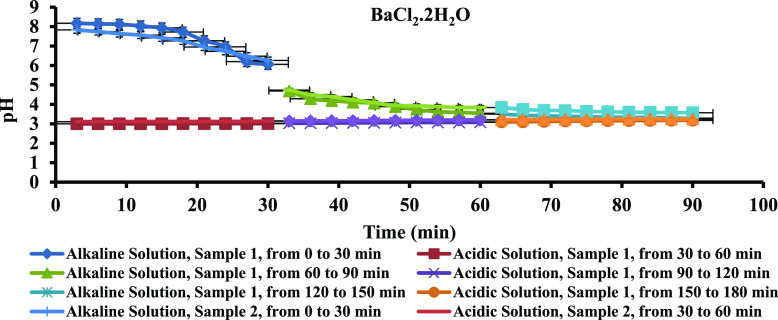
Since the PPG samples have to be injected into the oil reservoir and pH of most of the oil fields is between 4 and 6, the swelling capacity of the PPG samples was investigated under acidic and alkaline medium. To do so, samples 1 and 2 that have more swelling percentage and BaCl2·2H2O, CaCl2·2H2O, and MgCl2·6H2O salt solutions, which have more ability to swell hydrogels, were examined (the detailed information is given in the Supporting Information). According to Figure 8 and Table 7, the PPG swelling percentage increased with time in both acidic and alkaline media of BaCl2·2H2O saline solution. In acidic medium, the osmotic pressure of all the examined salt solutions and consequently swelling percentage of all samples increased due to interring double negative charge per one positive charge into the swelling medium. In alkaline medium, ionization of carboxylate groups and repulsion forces between them caused the swelling capacity of the PPG samples to increase. The trend of swelling changes in other mentioned saline solutions was the same as that in the BaCl2·2H2O salt solution (Figure S4a,b and Tables S11 and S12). Figure 9 and Table 8 show the changes in pH of the BaCl2·2H2O salt solution versus time. Due to hydrogen bonds forming between acid and amide functional groups and water, the pH of the acidic medium increased over time. In alkaline medium, due to increasing ionic strength and decreasing hydroxide ion activity in the salt water, pH of the saline solutions decreased over time. The pH changes of PPG samples in the other saline solutions were similar to those in the BaCl2·2H2O saline solution (Figure S5a,b and Tables S13 and S14).
Figure 8.
Swelling percentage of samples (% S) in alkaline and acidic media.
Table 7. Swelling Percentage of the PPG Sample 1 in Acidic and Alkaline Media of the BaCl2·2H2O Saline Solution.
| time (min) | NaOH | HCl |
|---|---|---|
| 3 | 94 | 314 |
| 6 | 117 | 322 |
| 9 | 144 | 347 |
| 12 | 159 | 354 |
| 15 | 178 | 357 |
| 18 | 195 | 374 |
| 21 | 226 | 376 |
| 24 | 241 | 381 |
| 27 | 250 | 401 |
| 30 | 273 | 416 |
| 33 | 444 | 558 |
| 36 | 473 | 562 |
| 39 | 477 | 563 |
| 42 | 483 | 593 |
| 45 | 493 | 595 |
| 48 | 494 | 595 |
| 51 | 500 | 604 |
| 54 | 522 | 616 |
| 57 | 532 | 619 |
| 60 | 534 | 621 |
| 63 | 666 | 743 |
| 66 | 666 | 744 |
| 69 | 670 | 757 |
| 72 | 674 | 760 |
| 75 | 680 | 761 |
| 78 | 683 | 761 |
| 81 | 687 | 762 |
| 84 | 699 | 762 |
| 87 | 702 | 763 |
| 90 | 703 | 765 |
Figure 9.
pH variation versus time.
Table 8. pH Changes of the BaCl2·2H2O Salt Solution Versus Time.
| time (min) | pH (NaOH) | pH (HCl) |
|---|---|---|
| 3 | 8.17 | 3 |
| 6 | 8.14 | 3 |
| 9 | 8.12 | 3 |
| 12 | 8.03 | 3 |
| 15 | 7.93 | 3 |
| 18 | 7.72 | 3.01 |
| 21 | 7.27 | 3.01 |
| 24 | 6.96 | 3.01 |
| 27 | 6.2 | 3.01 |
| 30 | 6.06 | 3.01 |
| 33 | 4.69 | 3.03 |
| 36 | 4.29 | 3.03 |
| 39 | 4.19 | 3.04 |
| 42 | 4.11 | 3.05 |
| 45 | 4.06 | 3.05 |
| 48 | 3.88 | 3.06 |
| 51 | 3.74 | 3.07 |
| 54 | 3.62 | 3.07 |
| 57 | 3.59 | 3.07 |
| 60 | 3.54 | 3.08 |
| 63 | 3.5 | 3.1 |
| 66 | 3.44 | 3.1 |
| 69 | 3.41 | 3.12 |
| 72 | 3.39 | 3.14 |
| 75 | 3.36 | 3.15 |
| 78 | 3.35 | 3.16 |
| 81 | 3.33 | 3.16 |
| 84 | 3.33 | 3.17 |
| 87 | 3.3 | 3.18 |
| 90 | 3.29 | 3.18 |
Mechanical and Thermal Experiments
Since PPGs have to be injected into the oil and gas reservoirs, which have high temperatures and pressures, other vital factors for oil and gas producers are mechanical and thermal resistances of the PPG samples. The PPG samples 1, 2, and 4 with decent swelling capacity, the PPG samples 3 and 5 with low swelling percentage, and MgCl2·6H2O, CaCl2·2H2O, and BaCl2·2H2O salt solutions with the highest ability in the swelling process among the salts assessed in this work have been chosen for the mechanical and thermal experiments.
The mechanical resistance of the PPG samples was examined up to 300 bar, less than the maintenance pressure of the device. For the PPG samples 1, 2, and 4, pressure had a rising trend up to 300 bar and never decreased, while for the PPG samples 3 and 5 (with low swelling percentage), pressure dropped sharply from 240 and 215 bar, respectively, to atmospheric pressure. It means that all the PPG samples with decent swelling capacity (samples 1, 2, and 4) had the ability to resist high pressures (300 bar), while the others with low swelling percentage (samples 3 and 5) failed in pressure resistance experiments. Because of the high amount of crosslinker agents existing in their structures, the PPG samples 3 and 5 had low flexibility and could not tolerate high pressures.
To examine thermal resistance of the PPG samples, the swollen samples 1, 2, and 4 were kept at a temperature of 170 °C for half an hour. After that time, samples were put out from the device and weighed by the digital balance. Results showed that large amounts of captured water in pores were evaporated, and the PPG samples were greatly dried. The swelling percentage of the examined samples before and after the mechanical and thermal experiments is shown in Table 9.
Table 9. Result of the Thermal and Mechanical Experiments.
| swelling
percentage before test |
swelling
percentage after test |
|||||
|---|---|---|---|---|---|---|
| sample | CaCl2·2HO | BaCl2·2HO | MgCl2·6H2O | CaCl2·2HO | BaCl2·2HO | MgCl2·6H2O |
| Thermal Experiments | ||||||
| 1 | 901.48 | 954.61 | 867.98 | 23.24 | 26.47 | 12.98 |
| 2 | 568.23 | 884.97 | 532.85 | 29.44 | 35.82 | 22.92 |
| 3 | 501.38 | 589.65 | 497.68 | 2.56 | 15.32 | 5.47 |
| 4 | 518.47 | 896.27 | 596.30 | 8.84 | 21.48 | 12.99 |
| 5 | 556.89 | 632.48 | 514.76 | 3.14 | 17.31 | 6.98 |
| Mechanical Experiments | ||||||
| 1 | 901.48 | 954.61 | 867.98 | 824.92 | 881.28 | 816.66 |
| 2 | 568.23 | 884.97 | 532.85 | 498.43 | 820.89 | 471.63 |
| 3 | 501.38 | 589.65 | 497.68 | 104.97 | 127.38 | 100.72 |
| 4 | 518.47 | 896.27 | 596.30 | 424.42 | 822.96 | 489.59 |
| 5 | 556.89 | 632.48 | 514.76 | 125.38 | 132.89 | 107.98 |
| Concurrent Mechanical and Thermal Experiments | ||||||
| 1 | 901.48 | 954.61 | 867.98 | 897.98 | 950.67 | 861.23 |
| 2 | 568.23 | 884.97 | 532.85 | 560.97 | 878.69 | 529.02 |
| 3 | 501.38 | 589.65 | 497.68 | 487.85 | 568.27 | 480.74 |
| 4 | 518.47 | 896.27 | 596.30 | 498.16 | 879.94 | 575.36 |
| 5 | 556.89 | 632.48 | 514.76 | 532.27 | 598.78 | 487.93 |
Since there are simultaneously high pressures and temperatures in the oil and gas reservoirs, the synchronous effect of high temperature and pressure was examined in the third step. To do so, the temperature of the coil element and pressure of the device were kept at 170 °C and 300 bar, respectively. Each experiment was continued until the upper handle was placed on the eve of opening. At this time, the upper handle can be opened with a slight rotational movement. In fact, the experiment was finished, and samples were extracted from the device and reweighed. Results indicated that the weight of swollen samples remained greatly constant; it was due to high pressure of the medium in which PPGs were located. This high pressure did not allow extraction of water from the PPG structure. Figure 10a,b shows that most part of the network structure of PPG sample 1 remained intact after mechanical (300 bar for 2 days) and concurrent mechanical and thermal experiments (300 bar and 170 °C).
Figure 10.
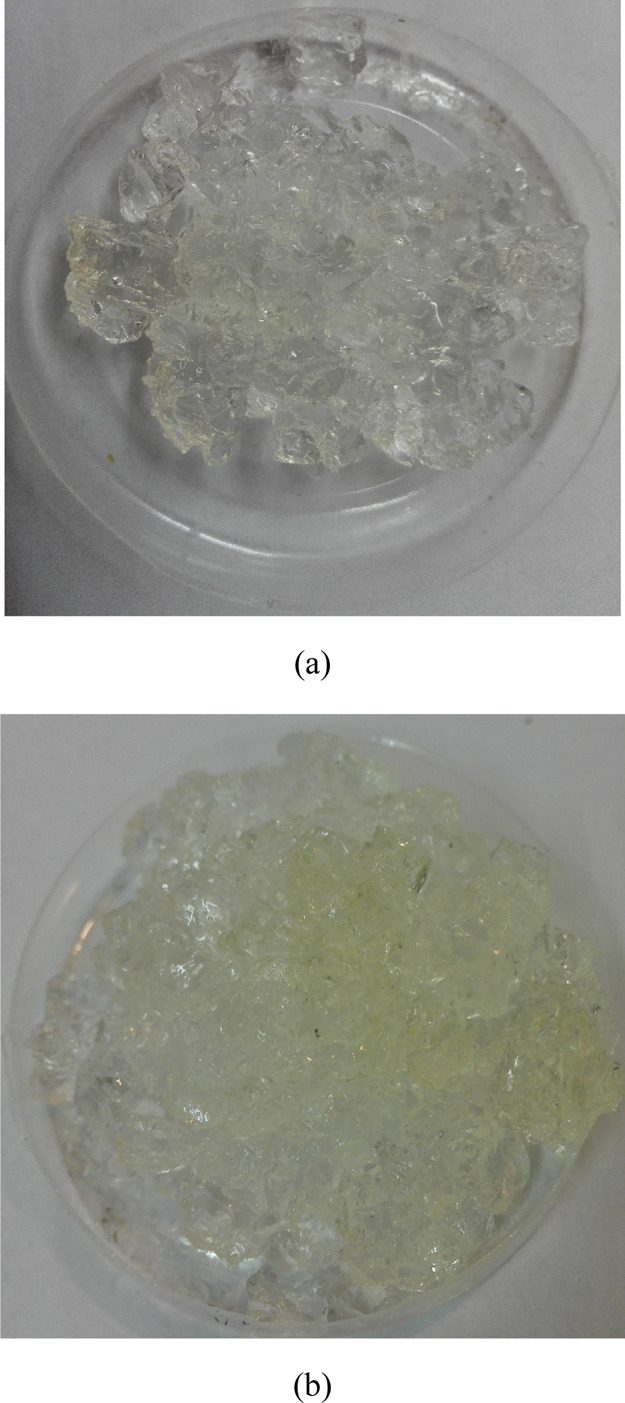
Image of PPG sample 1 after (a) mechanical (300 bar for 2 days) and (b) concurrent mechanical and thermal treatments. Photograph courtesy of “Samira Heidari”. It is a free domain.
In the end of all experimental studies, the outcomes revealed that increasing the crosslinker agent forms smaller pores in the gel structure, decreases gelation time, and reduces the PPG swelling percentage. Raising the AAm/AA mole ratio increases gelation time and has a maximum point in the swelling percentage curve of samples. BaCl2.2H2O, CaCl2·2H2O, and MgCl2·6H2O salt solutions, which have divalent cations, had more ability to swell the PPG samples than KCl, LiCl, and NaCl salt solutions with monovalent cations. Additionally, it was found that the MBA mole percentage of 6, AAm/AA mole ratio of 4.82, and KPS concentration of 0.05 g/mL are the optimum conditions for the maximum swelling capacity of the PPG samples. In the end of all experimental studies, it was concluded that sample 1, which had the equilibrium swelling percentage of 1172.16% in BaCl2·2H2O saline solution (20 mL, 200,000 ppm) and the concurrent mechanical and thermal resistance (300 bar and 170 °C), is an efficient candidate to control unwanted water from oil and gas fields.
Conclusions
In this paper, an effective series of PPG samples was synthesized to be used in blocking naturally or artificially fractured reservoirs with a high amount of unwanted water production. Additionally, the network structure, gelation time, drying behavior [under atmospheric conditions, in an oven (60 °C), and in a vacuum oven (60 °C)], swelling behavior (in several salt solutions with 200,000 ppm concentration and pH values from 3 up to 8), mechanical resistance (under high pressures), and thermal resistance (under high temperatures) of the synthesized PPG samples were simultaneously examined. Totally, findings indicate that the synthesized PPG sample 1 has decent swelling capacity and resistance under conditions of high salinity (200,000 ppm and pH in the range of 3–8), high pressure (300 bar), and high temperature (170 °C).
Acknowledgments
The authors are grateful to the Shiraz University and Enhanced Gas Condensate Recovery Research Group for supporting this research.
Supporting Information Available
The Supporting Information is available free of charge at https://pubs.acs.org/doi/10.1021/acsomega.1c02638.
SEM images of samples, amount of evaporated water from samples in the oven and vacuum oven, swelling percentage of samples (% S) versus time, swelling percentage of samples (% S) in alkaline and acidic media, pH variation versus time, swelling percentage of samples (% S) in BaCl2·2H2O, CaCl2·2H2O, MgCl2·2H2O, NaCl, KCl, and LiCl saline solutions over time, swelling percentage of the PPG samples 1 and 4 in saline solutions, swelling percentage of PPG sample 1 in acidic and alkaline media of CaCl2·2H2O and MgCl2·6H2O saline solutions, and pH changes of the CaCl2·2H2O and MgCl2·6H2O salt solutions versus time (PDF)
The authors declare no competing financial interest.
Supplementary Material
References
- Shamlooh M.; Hussein I. A.; Nasser M. S.; Magzoub M.; Salehi S. Development of pH-controlled aluminum-based polymeric gel for conformance control in sour gas reservoirs. ACS Omega 2020, 5, 24504–24512. 10.1021/acsomega.0c02967. [DOI] [PMC free article] [PubMed] [Google Scholar]
- Fayzullin M.; Tippel P.; Gonzalez J.; Egger S.. Understanding excessive water production in highly faulted mature gas condensate field: From well operations to revival of integrated history matching. IADC/SPE Asia Pacific Drilling Technology Conference, 2014.
- Bailey B.; Crabtree M.; Tyrie J.; Elphick J.; Kuchuk F.; Romano C.; Roodhart L. Water control. Oilfield Rev. 2000, 12, 30–51. [Google Scholar]
- Seethepalli A.; Adibhatla B.; Mohanty K. K. Physicochemical interactions during surfactant flooding of fractured carbonate reservoirs. SPE J. 2004, 9, 411–418. 10.2118/89423-pa. [DOI] [Google Scholar]
- Sydansk R. D.; Romero-Zerón L.. Reservoir Conformance Improvement; Society of Petroleum Engineers Richardson: TX, 2011. [Google Scholar]
- Hirasaki G.; Zhang D. L. Surface chemistry of oil recovery from fractured. Oil-Wet, Carbonate Formation. SPE J. 2003, 9, 151–162. 10.2118/80988-MS. [DOI] [Google Scholar]
- Portwood J. T.The kansas arbuckle formation: Performance evaluation and lessons learned from more than 200 polymer-gel water-shutoff treatments. SPE Production Operations Symposium, 2005.
- Sydansk R. D.; Southwell G. P. More than 12 years’ experience with a successful conformance-control polymer-gel technology. SPE Prod. Facil. 2000, 15, 270–278. 10.2118/66558-pa. [DOI] [Google Scholar]
- Bai B.; Wei M.; Liu Y.. Experience with a successful preformed particle gel conformance control technology. SPE production and operations symposium, 2013.
- Standnes D. C.; Austad T. Wettability alteration in chalk: 2. mechanism for wettability alteration from oil-wet to water-wet using surfactants. J. Pet. Sci. Eng. 2000, 28, 123–143. 10.1016/s0920-4105(00)00084-x. [DOI] [Google Scholar]
- Zhang P.Water-based EOR in fractured chalk; wettability and chemical additives. Ph.D. thesis, Department of Petroleum Engineering, University of Stavanger, 2006. [Google Scholar]
- Stavland A.; Jonsbraten H. C.; Vikane O.; Skrettingland K.; Fischer H.. In-depth water diversion using sodium silicate on snorre-factors controlling in-depth placement. SPE European Formation Damage Conference, 2011.
- Willhite G. P.; Pancake R. E. Controlling water production using gelled polymer systems. SPE Reservoir Eval. Eng. 2008, 11, 454–465. 10.2118/89464-pa. [DOI] [Google Scholar]
- Al-Muntasheri G. A.; Sierra L.; Garzon F. O.; Lynn J. D.; Izquierdo G. A.. Water shut-off with polymer gels in a high temperature horizontal gas well: A success story. SPE Improved Oil Recovery Symposium, 2010.
- Spildo K.; Skauge A.; Aarra M. G.; Tweheyo M. T. A new polymer application for north sea reservoirs. SPE Reservoir Eval. Eng. 2009, 12, 427–432. 10.2118/113460-pa. [DOI] [Google Scholar]
- Liu Y.; Zhu M.; Liu X.; Zhang W.; Sun B.; Chen Y.; Adler H.-J. P. High clay content nanocomposite hydrogels with surprising mechanical strength and interesting deswelling kinetics. Polymer 2006, 47, 1–5. 10.1016/j.polymer.2005.11.030. [DOI] [Google Scholar]
- Bai B.; Huang F.; Liu Y.; Seright R. S.; Wang Y.. Case study on prefromed particle gel for in-depth fluid diversion. SPE symposium on improved oil recovery, 2008.
- Salehi M. B.; Soleimanian M.; Moghadam A. M. Examination of disproportionate permeability reduction mechanism on rupture of hydrogels performance. Colloids Surf., A 2019, 560, 1–8. 10.1016/j.colsurfa.2018.09.085. [DOI] [Google Scholar]
- Heidari S.; Doust J. S.; Esmaeilzadeh F. Synthesis of poly (AAm-Co-AA) and investigation of its swelling behavior: Using response surface methodology (RSM). Model. Numer. Simul. Mater. Sci. 2018, 8, 65. 10.4236/mnsms.2018.84004. [DOI] [Google Scholar]
- Aqcheli F.; Salehi M. B.; Pahlevani H.; Taghikhani V. Rheological properties and the micromodel investigation of nanosilica gel-reinforced preformed particle gels developed for improved oil recovery. J. Pet. Sci. Eng. 2020, 192, 107258. 10.1016/j.petrol.2020.107258. [DOI] [Google Scholar]
- Alhuraishawy A. K.; Imqam A.; Wei M.; Bai B.. Coupling low salinity water flooding and preformed particle gel to enhance oil recovery for fractured carbonate reservoirs. SPE Western Regional Meeting, 2016.
- Zhu D.; Bai B.; Hou J. Polymer gel systems for water management in high-temperature petroleum reservoirs: A chemical review. Energy Fuels 2017, 31, 13063–13087. 10.1021/acs.energyfuels.7b02897. [DOI] [Google Scholar]
- Zhu D.; Hou J.; Wei Q.; Wu X.; Bai B. Terpolymer gel system formed by resorcinol--hexamethylenetetramine for water management in extremely high-temperature reservoirs. Energy Fuels 2017, 31, 1519–1528. 10.1021/acs.energyfuels.6b03188. [DOI] [Google Scholar]
- Pérez-Robles S.; Matute C. A.; Lara J. R.; Lopera S. H.; Cortés F. B.; Franco C. A. Effect of nanoparticles with different chemical nature on the stability and rheology of acrylamide sodium acrylate copolymer/chromium (iii) acetate gel for conformance control operations. Nanomaterials 2020, 10, 74. 10.3390/nano10010074. [DOI] [PMC free article] [PubMed] [Google Scholar]
- Tongwa P.; Nygaard R.; Bai B. Evaluation of a nanocomposite hydrogel for water shut-off in enhanced oil recovery applications: Design, synthesis, and characterization. J. Appl. Polym. Sci. 2013, 128, 787–794. 10.1002/app.38258. [DOI] [Google Scholar]
- Tongwa P.; Nygaard R.; Blue A.; Bai B. Evaluation of potential fracture-sealing materials for remediating CO2 leakage pathways during CO2 sequestration. Int. J. Greenhouse Gas Control 2013, 18, 128–138. 10.1016/j.ijggc.2013.06.017. [DOI] [Google Scholar]
- Bai B.; Zhang H. Preformed-particle-gel transport through open fractures and its effect on water flow. SPE J. 2011, 16, 388–400. 10.2118/129908-pa. [DOI] [Google Scholar]
- Malana M. A.; Bukhari J.-u. -D.; Zohra R. Synthesis, swelling behavior, and network parameters of novel chemically crosslinked poly (acrylamide-co-methacrylate-co-acrylic acid) hydrogels. Des. Monomers Polym. 2014, 17, 266–274. 10.1080/15685551.2013.840501. [DOI] [Google Scholar]
- Othman M. B. H.; Akil H. M.; Osman H.; Khan A.; Ahmad Z. Synthesis, characterisation and thermal properties of hyperbranched polyimide derived from melamine via emulsion polymerisation. J. Therm. Anal. Calorim. 2015, 120, 1785–1798. 10.1007/s10973-015-4464-9. [DOI] [Google Scholar]
- Craciun G.; Manaila E.; Stelescu M. D. Electron beam synthesis and characterization of acrylamide/acrylic acid hydrogels using trimethylolpropane trimethacrylate as cross-linker. J. Chem. 2016, 2016, 1470965. 10.1155/2016/1470965. [DOI] [Google Scholar]
- Hamouda A.; Amiri H. Factors affecting alkaline sodium silicate gelation for in-depth reservoir profile modification. Energies 2014, 7, 568–590. 10.3390/en7020568. [DOI] [Google Scholar]
- Brattekås B.; Graue A.; Seright R. S.. Low salinity chase waterfloods improve performance of Cr (iii)-acetate HPAM gel in fractured cores. SPE International Symposium on Oilfield Chemistry, 2015.
- Akbar I.; Hongtao Z. The opportunities and challenges of preformed particle gel in enhanced oil recovery. Recent Innovations Chem. Eng. 2020, 13, 290–302. 10.2174/2405520413666200313130911. [DOI] [Google Scholar]
- Esfahlan M. S.; Khodapanah E.; AirezaTabatabaei-Nezhad S. Comprehensive review on the research and field application of preformed particle gel conformance control technology. J. Pet. Sci. Eng. 2021, 202, 108440. 10.1016/j.petrol.2021.108440. [DOI] [Google Scholar]
- Lenji M. A.; Haghshenasfard M.; Sefti M. V.; Salehi M. B.; Heidari A. Experimental study of swelling and rheological behavior of preformed particle gel used in water shutoff treatment. J. Pet. Sci. Eng. 2018, 169, 739–747. 10.1016/j.petrol.2018.06.029. [DOI] [Google Scholar]
- Mehrabianfar P.; Malmir P.; Soulgani B. S.; Hashemi A. Study on the optimization of the performance of preformed particle gel (PPG) on the isolation of high permeable zone. J. Pet. Sci. Eng. 2020, 195, 107530. 10.1016/j.petrol.2020.107530. [DOI] [Google Scholar]
- Salehi M. B.; Moghadam A. M.; Jarrahian K. Effect of network parameters of preformed particle gel on structural strength for water management. SPE Prod. Oper. 2020, 35, 362–372. 10.2118/193631-pa. [DOI] [Google Scholar]
- Mutar M. A.; Kmal R. K. Preparation of copolymer of acrylamide and acrylic acid and its application for slow release sodium nitrate fertilizer. Al-Qadisiyah J. Pure Sci. 2012, 17, 71–83. [Google Scholar]
- Peppas N. A.; Mikos A. G.. Preparation methods and structure of hydrogels. Hydrogels in Medicine and Pharmacy; CRC Press, 2019; pp 1–26. [Google Scholar]
- Harsh D. C.; Gehrke S. H.. Characterization of ionic water absorbent polymers: Determination of ionic content and effective crosslink density. Studies in Polymer Science; Elsevier, 1990; Vol. 8, pp 103–124. [Google Scholar]
- Athawale V. D.; Vidyagauri V. L. Graft copolymerization onto starch. 3: Grafting of acrylamide using ceric ion initiation and preparation of its hydrogels. Starch/Stärke 1998, 50, 426–431. . [DOI] [Google Scholar]
- Lee W.-F.; Yuan W.-Y. Thermoreversible hydrogels x: Synthesis and swelling behavior of the (N-isopropylacrylamide-co-sodium 2-acrylamido-2-methylpropyl sulfonate) copolymeric hydrogels. J. Appl. Polym. Sci. 2000, 77, 1760–1768. . [DOI] [Google Scholar]
Associated Data
This section collects any data citations, data availability statements, or supplementary materials included in this article.


