Abstract
The wettability of gas and liquid on the coal surface is one of the fundamental factors that affect the depressurization process during the coalbed methane (CBM) extraction. The wettability of coal surface changed after electrochemical modification, leading to the change in methane adsorption/desorption and water movement in coal reservoirs. Thus, the CH4 adsorption amount, desorption ratio, and coal–water contact angle of raw and modified anthracite samples were measured and simulated. The mechanism of electrochemical modification was analyzed by functional groups, surface free energy, pore characteristics, interaction energies, and coal swelling. The experimental results showed that the saturated adsorption amount of methane decreased from 41.49 to 34.72 mL/g, and the simulation results showed that the saturated adsorption amount of methane decreased from 2.01 to 1.83 mmol/g. The coal–water contact angle also decreased from 81.9 to 68.6°. Electrochemical modification mainly affects the wettability of CH4 and H2O by changing the functional groups and pore structures of anthracite, and the influence on functional groups of coal surface is greater. This work provided a basis for enhancing CBM extraction by electrochemical modification.
1. Introduction
Extracting CBM from unmineable coal seams provides clean energy to the modern world. In China, the detectable CBM reserves are 36.8 × 10¹² m3 that are explored above the underground depth of 2000 m spanning 41.5 × 10⁴ km2 area.1 The existing studies focused on accelerating methane extraction mainly aim at improving the permeability of coal reservoirs,2 enhancing methane desorption,3 and optimizing the wettability characteristics of coal.4 For example, hydraulic fracturing and CO2 injection into coal seams to displace CH4 were effective in enhancing the CBM extraction.5 The application of hydraulic fracturing aims to create fractures and increase the seepage channels of methane and water, without considering the CH4 adsorption characteristics of coal. The wettability of H2O/CH4/CO2 on the coal surface is a fundamental petrophysical parameter, which plays a significant role in CBM extraction.6 However, the existing approaches have a limited impact on the gas–liquid wetting characteristics of coal surfaces.
Electrochemical modification on coal, rock, and clay has attracted increasing interest all over the world.7−12 The electrochemical method can accelerate methane seepage by removing filling matters like calcite and pyrite.13−15 Meanwhile, the CH4 adsorption decreased after electrochemical treatment due to the increase of carboxyl and other oxygen-containing groups, and the desorption ratio and diffusion coefficient increased after modification due to the strength of interaction of methane and anthracite weakened.16,17 Unfortunately, the previous research studies mainly described the phenomena of the electrochemical process and the results, the molecular mechanism of electrochemical modification involved was limited. The molecular mechanism of the gas–liquid wetting characteristics of coal surfaces in successful CBM extraction cannot be overstated. Recently, molecular simulations have been used for characterizing the adsorption behaviors of gases (CO2, N2, and CH4) and liquids (H2O).18−20 More than 134 coal molecular models have been established during the 1942–2010 years, the coal models established by researchers laid a foundation for the simulation of gas and liquid adsorption on coal before and after modification.21−24 The strength of interaction between methane and coal molecular can also be simulated via molecular simulation.25 The methane adsorption capacity on activated carbon made of anthracite decreased with the increase in micropore diameter.26 The existing research studies have laid the foundation for the establishment of the anthracite model and the simulation of gas adsorption before and after electrochemical modification.
The effect mechanism of electrochemical modification on the wettability of gas and liquid of coals still needs better understanding. Thus, the molecular structures of the Qinshui Basin anthracite samples before and after modification have been represented and established. Also, we carried out the CH4 adsorption isotherms before and after modification by experiment and molecular simulation. The coal–water contact angle, interaction strength, and radial distribution functions (RDFs) were also obtained to discuss the modification mechanism on the wettability of gas and liquid of anthracite.
2. Results of Electrochemical Modification
2.1. Molecular Model Validation
The molecular model of anthracite was validated by carbon content, density, and CH4 adsorption amount. The carbon content accounts for 86.6% of the coal model, in accordance with the raw Jincheng NO. 15 anthracite coal in the Qinshui Basin (88.4%).27 The density of the established coal molecular model is 1.53 g/cm3, conforming to the test results of 1.5 g/cm3 and other reports between 1.3 and 1.7 g/cm3.28Figure 1 shows the validation of methane adsorption, it can be seen that the simulated trend was in good agreement with the experimental data. Hence, the molecular model and its parameters are applicable for the anthracite coal in Qinshui Basin.
Figure 1.
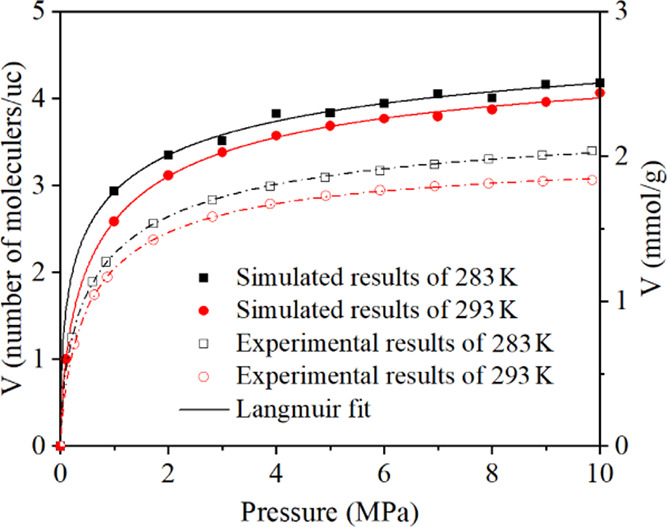
Molecular simulated and experimental results of CH4 adsorption isotherms at 283 and 293 K.
2.2. CH4 Adsorption Isotherm after Electrochemical Treatment
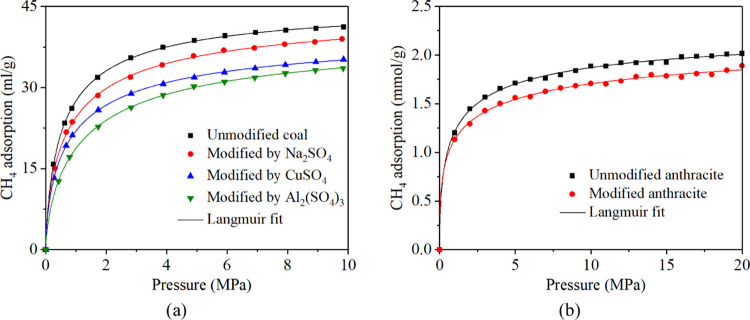
The CH4 adsorption isotherms on anthracite after being modified by Na2SO4, CuSO4, and Al2(SO4)3 electrolytes were tested, the results are shown in Figure 2. Langmuir model is used to fit methane adsorption data to better analyze the methane adsorption behavior in anthracite, and it is expressed as follows29,30
| 1 |
where V is the CH4 adsorption amount, VL is the saturated adsorption amount of CH4, PL is the Langmuir pressure, and P is the pressure of CH4. Figure 2a shows that the unmodified anthracite has the largest adsorption capacity for methane. The CH4 adsorption is 41.17 mL/g under the pressure of 9.86 MPa. After fitting with the Langmuir equation, the R2 is 0.99, and the Langmuir fitting parameter a is 41.49 mL/g, indicating the saturated adsorption VL of unmodified anthracite sample is 41.49 mL/g, and the parameter PL–1 is 2.27 MPa–1, indicating that the adsorption pressure is 0.44 MPa when the methane adsorption amount of the raw coal sample is generally saturated. After electrochemical modification with three types of electrolytes, the adsorption capacity of coal samples decreased. The addition of Al2(SO4)3 can reduce the adsorption capacity of anthracite to CH4 effectively. Based on the constructed anthracite molecular models before and after electrochemical modification, CH4 adsorption was simulated by molecular dynamics. Figure 2b shows the molecular dynamics simulation results; the CH4 adsorption was also decreased after electrochemical modification (Table 1).
Figure 2.
Experiment (a) and simulation (b) results of CH4 adsorption isotherms before and after electrochemical modification.
Table 1. Methane Sorption Data of Raw and Treated Coals.
| experiment number | coal type | coal mass (g) | VL (mL/g) | PL–1 (MPa–1) | R2 |
|---|---|---|---|---|---|
| ET1 | unmodified coal | 21.77 | 41.49 | 2.27 | 0.99 |
| ET 2 | modified by Na2SO4 | 20.98 | 39.06 | 1.96 | 0.99 |
| ET 3 | modified by CuSO4 | 24.98 | 34.84 | 2.06 | 0.99 |
| ET 4 | modified by Al2(SO4)3 | 21.02 | 34.72 | 1.30 | 0.99 |
2.3. CH4 Desorption after Electrochemical Modification
The CH4 desorption of coal before and after electrochemical modification was measured, as shown in Figure 3. The diffusion coefficient was also obtained according to eq 2,17 the results are shown in Figures 4 and 5.
| 2 |
where Qt is the cumulative diffusion amount of CH4 at time t, cm3/g; Qt/Q∞ is the cumulative diffusion proportion of CH4; D is diffusion coefficient, cm2/s; r0 is the radius of tested coal samples, cm, and t is the time of CH4 diffusion on coal samples, s. Figures 6 and 7 show that the methane desorption ratio of the raw anthracite was 63.43% and the diffusion coefficient is 4.58 × 10⁻⁶ cm2/s. After modification, the methane desorption ratio of anthracite was improved. The desorption ratios increased to 67.39, 84.87, and 887.45% after being modified by Na2SO4, CuSO4, and Al2(SO4)3 respectively. The diffusion coefficients were increased to 4.99 × 10⁻⁶, 7.77 × 10⁻⁶, and 8.08 × 10⁻⁶ cm2/s, respectively. The results of the desorption test showed that the electrochemical modification effectively reduced the methane adsorption performance on the anthracite surface and improved the methane desorption of anthracite. The Al3+ ion electrolyte can effectively improve the desorption ratio of methane in anthracite, which was a more effective type of electrolyte.
Figure 3.
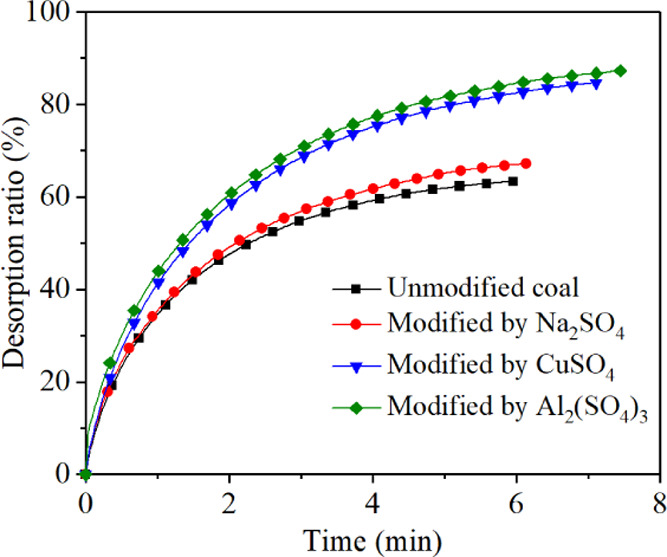
Experimental results of the CH4 desorption ratio (%) of raw and modified anthracite samples.
Figure 4.
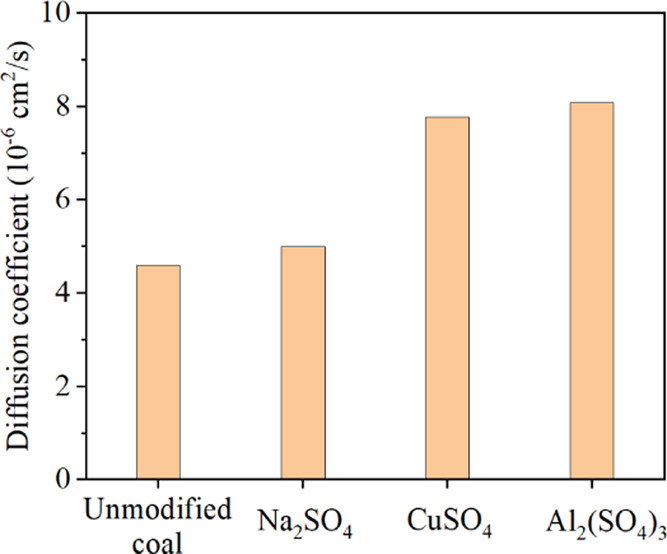
Experimental results of the diffusion coefficient before and after electrochemical modification.
Figure 5.
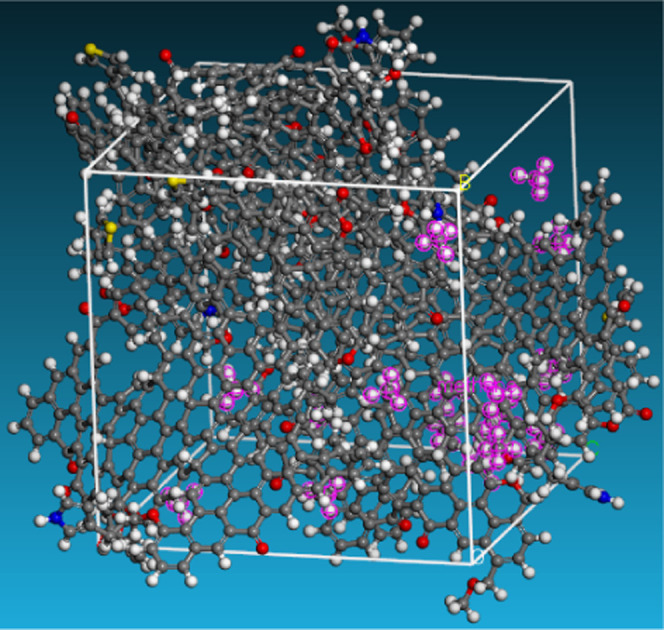
Diffusion of CH4 in anthracite model. Color code: CH4 (Carmine).
Figure 6.
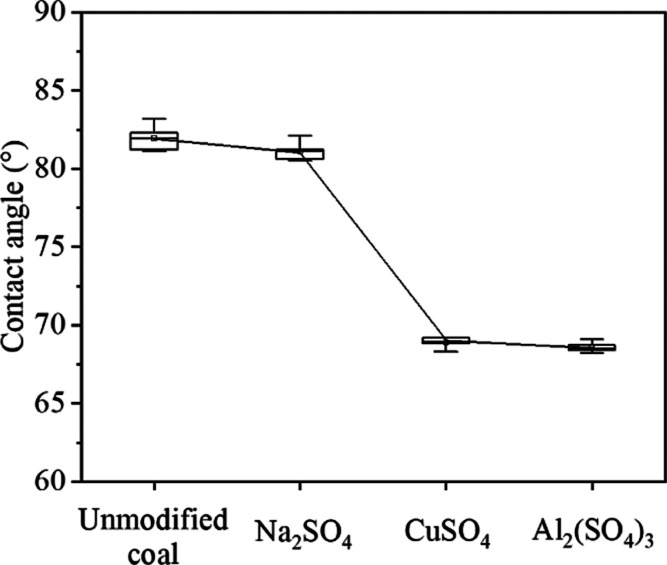
Contact angle of coal–water after electrochemical modification.
Figure 7.
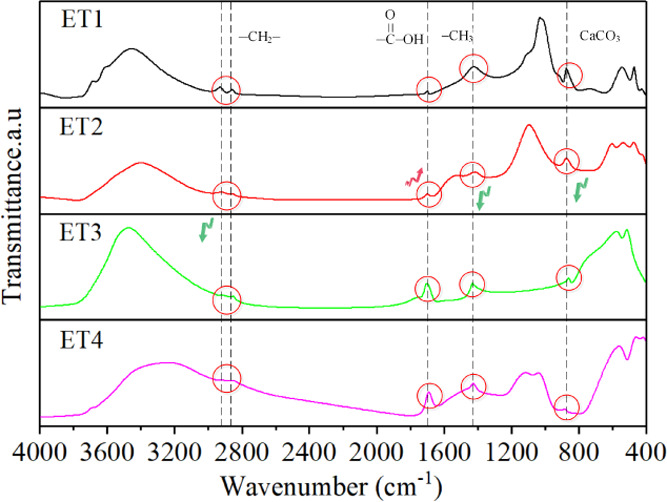
Changes of surface functional groups of raw and modified coal samples.
The CH4 self-diffusion coefficient was gained by calculating the mean square displacement over time,31 as shown in Figure 5. The transport diffusion coefficient was also obtained by the Maxwell–Stefan diffusion model.32 The results of the calculated CH4 diffusion coefficient in the raw and modified anthracites are listed in Table 2, which further identifies that the CH4 diffusion coefficient increased after electrochemical modification.
Table 2. Diffusion Coefficient of Methane in Coal before and after Electrochemical Modification.
| coal samples | DS (10–6 cm2/s) | Dt (10–6 cm2/s) | D (10–6 cm2/s) | (Dt-D)/D (%) |
|---|---|---|---|---|
| unmodified anthracite | 0.91 | 4.87 | 4.59 | 6.19 |
| modified anthracite | 1.16 | 6.19 | 8.08 | 23.33 |
2.4. Water Wettability of Anthracite after Electrochemical Modification
The water wettability of anthracite can be characterized by the coal–water contact angle. In this experiment, the coal–water contact angle was measured by Sigma 700 surface/tension tensiometer produced by Biolin Scientific of Sweden, and the contact angle was measured by the Washburn method. The test results of the coal–water contact angle before and after modification are shown in Figure 6. It can be seen that the average coal–water contact angle of unmodified coal ET1 is 81.9° and the coal–water contact angle of anthracite is reduced after electrochemical modification with three electrolytes. The coal–water contact angle of anthracite coal sample modified with Na2SO4 electrolyte is reduced to 80.5–83.1° with an average of 81.3°. The coal–water contact angle of anthracite coal sample modified with CuSO4 electrolyte is reduced to 68.3–69.2° with an average of 68.9°. The coal–water contact angle of the anthracite coal sample modified with the Al2(SO4)3 electrolyte is reduced to 68.2–69.1° with an average of 68.6°. The results show that the coal–water contact angle of coal samples after electrochemical modification is reduced to varying degrees, which means the H2O wettability of anthracite increased after electrochemical modification.
3. Discussion of Electrochemical Modification on Anthracite
3.1. Change of Functional Groups on Coal Surface
The CH4 wettability can be characterized by functional groups on the coal surface. Fourier transform infrared (FTIR) shows the change in surface functional groups of the raw and electrochemical modified coal samples. The peak at 3600 cm–1 indicates that anthracite itself contains a hydroxyl (−OH), which has a notable impact on coal electronegativity. After electrochemical modification, the peak areas of alkyl groups around 2920, 2850, and 1430 cm–1 were decreased because the oxygen-containing groups of coal samples in the anode region were reduced due to the decomposition into gas due to oxidation. When the applied DC electric field voltage is greater than the decomposition potential of water (generally > 1.7 V), the peak of carboxylic acid increases. Simultaneously, H+ ions diffuse to the modified middle and cathode areas by electromigration, resulting in the acidification of coal samples. Besides, the peaks attributed to carbonate minerals near 876 and 1430 cm–1 are also decreased, which is due to the reaction of acid generated by electrochemical reaction with carbonate minerals. Feng et al.33 also found that although the specific surface area, pore volume, and oxygen-containing groups (especially carboxyl groups) of the coal samples increased after acidification, the adsorption capacity of methane decreased. Hao et al.34 found that there was a significant negative correlation between the saturated adsorption capacity of coal and the oxygen–carbon ratio (O/C) of coal when the surface of bituminous coal was modified by acidification, that is, when the number of micropores of coal samples was similar, the adsorption capacity of coal samples with a higher oxygen content and a poorer hydrophobicity to methane was lower, which was consistent with the result that the wettability of anthracite was enhanced and the methane adsorption capacity was declined after this electrochemical modification.
3.2. Change of Pore Characteristics
Figure 8 shows that the change of mesopores in the raw and electrochemical modified coal samples modification is limited; this is due to the fact that the anthracite samples used in this electrochemical experiment are 60–80 mesh granular coal samples, and the change of dissolution of filling minerals in coal macropores and fissures by electrochemical modification is not obvious. However, from the data of pore characteristics in Table 3, it can be seen that the specific surface area and pore volume of anthracite after electrochemical modification by four metal ion electrolytes are slightly increased because the electrochemical reaction erodes some minerals such as carbonate, pyrite, and anorthite attached to the surface of coal particles, which also adsorb methane. Combined with the FTIR results shown in Figure 7, the methane adsorption capacity was influenced by the increase of oxygen-containing groups and the change of pore characteristics, and the former has a stronger effect. The removal of anorthite after electrochemical modification is also contributed to the increase of pore specific surface area, pore volume, and pore diameter, and the increase of pore volume and pore diameter directly leads to the improvement of methane desorption capacity in anthracite, which is consistent with the promotion of anthracite methane desorption rate after electrochemical modification.
Figure 8.
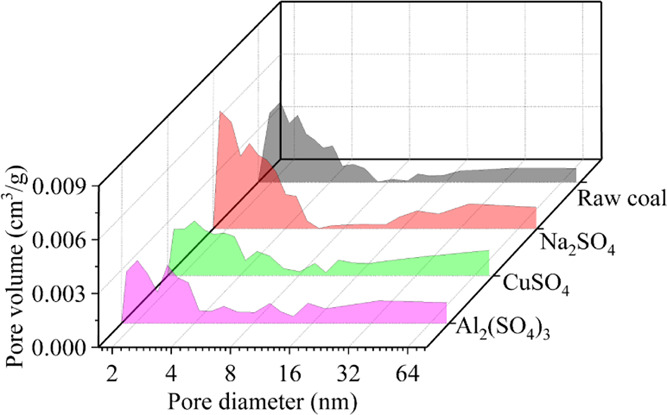
Change of pore size distribution in anthracite after electrochemical modification.
Table 3. Test Results of Pore Characteristics of Raw and Modified Coal Samples.
| coal type | surface area (m2/g) | pore volume (×10–3 cm3/g) |
|---|---|---|
| unmodified coal | 2.28 | 1.89 |
| modified by Na2SO4 | 2.65 | 2.25 |
| modified by CuSO4 | 2.97 | 2.54 |
| modified by Al2(SO4)3 | 2.79 | 2.22 |
3.3. Analysis of Interaction Energies and Coal Swelling
Figure 9 shows the change of the interaction energy between anthracite and CH4, before and after electrochemical modification, with the adsorption pressure P. The simulation results indicate that the interaction energy reaches the maximum at the pressure of 1 MPa and decreases with the increase of adsorption pressure (becomes more negative). Before and after electrochemical modification, the maximum interaction energies between anthracite and methane are −37.40 and −32.10 kJ/mol at 1 MPa, respectively. With the increase of adsorption pressure, the negative values of the interaction energy are larger, indicating that the methane adsorption capacities in coal increase, reaching −79.69 and −71.68 kJ/mol at 20 MPa, respectively. At this time, the methane adsorption capacity is the strongest. When the adsorption pressure is fixed, the interaction energy between anthracite and methane before electrochemical modification is greater than that after electrochemical modification. After modification, the interaction energy between anthracite and methane becomes more positive, indicating that the adsorption capacity is weakened as shown in Figure 2.
Figure 9.
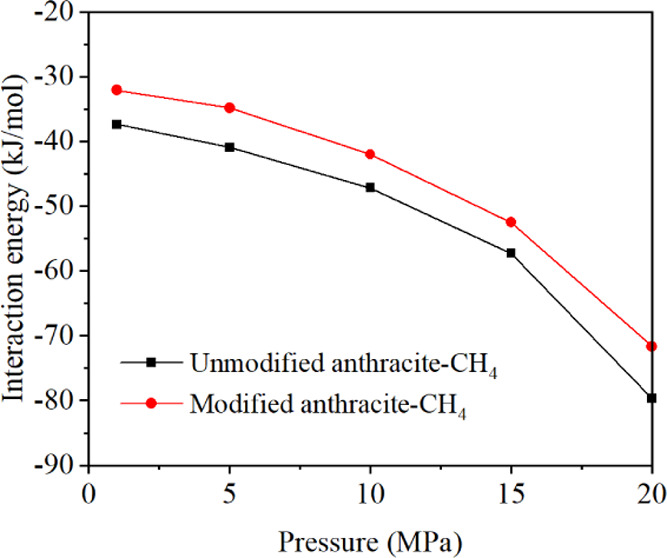
Interaction energy between CH4 and anthracite before and after electrochemical modification.
Figure 10 shows the change of volume deformation of anthracite with adsorption pressure before and after electrochemical modification. The swelling ratio is defined as (Vi– V0)/V0, where V0 and Vi are the initial and current occupied volumes by coal molecules, respectively. With the increase in adsorption pressure, the volume of anthracite increases first and then decreases. The increase of anthracite volume sample in the initial stage is due to the increase in CH4 adsorbed on the anthracite surface. The expansion effect caused by gas adsorption is stronger than the mechanical compression with increasing pressure. With the continuous increase in adsorption pressure, the mechanical compression induced by pressure continues to increase, while the increase in adsorbed CH4 is limited.31 As a result, the volume of anthracite decreases. After electrochemical modification, the adsorption capacity of anthracite to methane decreased, resulting in the volume change of anthracite sample after modification being smaller than that before modification in the initial stage. The volume change of the modified anthracite also exhibited a trend of first increasing and then decreasing, but the turning point pressure decreased from 11 to 10 MPa, which was because the Langmuir parameter PL of methane adsorption of modified anthracite decreased from 2.27 to 1.81 MPa. The results indicate that the methane adsorption capacity in anthracite decreases after electrochemical modification, and the pressure decreases when it reaches half of the saturated adsorption capacity. As the pressure continues to rise, the volume expansion effect of anthracite caused by methane adsorption weakens.
Figure 10.
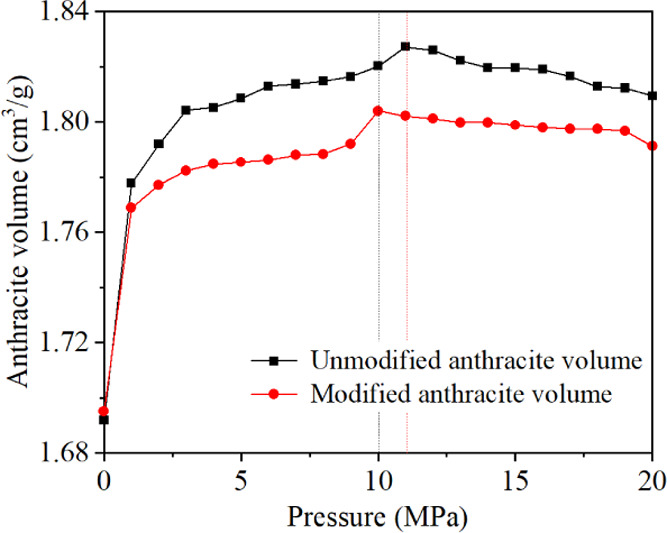
Change of coal volume with adsorption pressure before and after electrochemical modification.
Radial distribution functions (RDFs) can express the strength of gas–atoms interaction in the porous material, such as gas–coal and gas–organic matter. It is a function of atomic density with the distance between gas and solid atoms and can be expressed as
| 3 |
where dN is the number of molecules j from r to r + dr of i and ρj is the density of j. When the adsorption pressure is 20 MPa, the RDFs of anthracite before and after electrochemical modification is analyzed. The results are shown in Figure 11. It can be seen that the peak formed between anthracite and CH4 before electrochemical modification is larger than that between anthracite and methane after electrochemical modification. When the distance r is about 4.7 Å, the anthracite sample before electrochemical modification has the largest wave peak at 20 MPa. When the distance r is about 4.7 Å, the possibility of methane adsorption is 1.10 times higher. After electrochemical modification, the maximum peak value decreases to 1.05, which indicates that the interaction between CH4 molecule and anthracite model is weakened after electrochemical modification, which is consistent with the analysis result of the interaction energy between coal and methane molecule in Figure 9.
Figure 11.
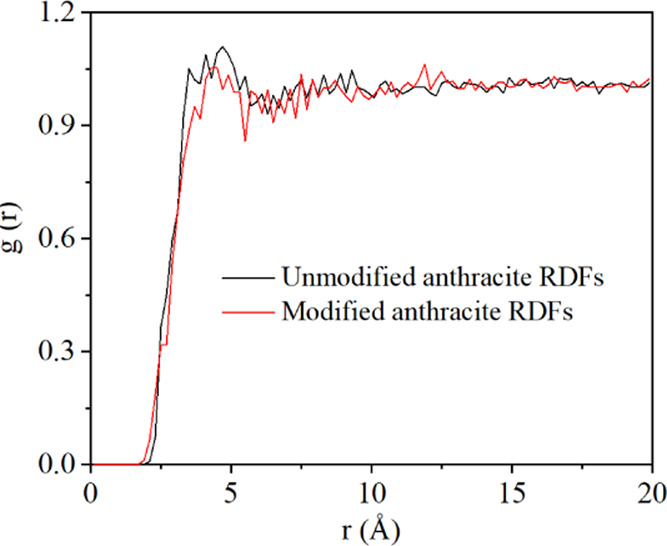
Results of the RDFs of coal samples before and after electrochemical modification.
4. Application and Significance
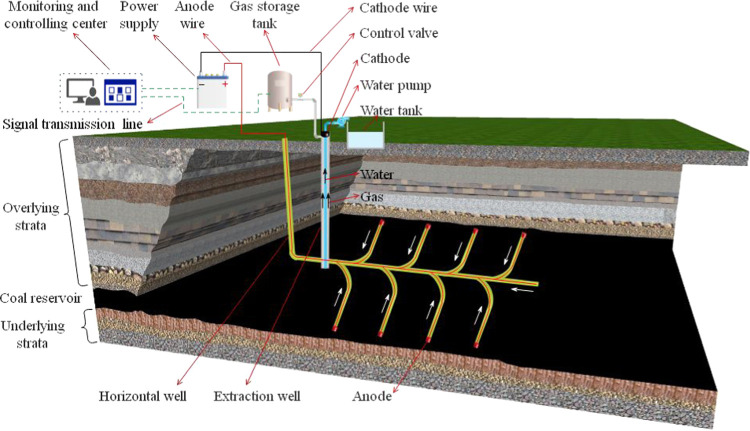
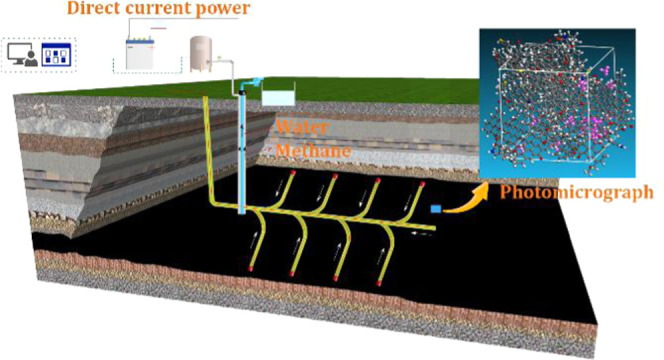
Electrochemical modification has been successfully applied in soft soil consolidation, soil decontamination, tailings dewatering, and coal desulfurization. Although the research studies on the electrochemical modification for accelerating methane extraction is still limited in the laboratory tests, studies have shown that the electrochemical method can achieve the purpose of enhanced methane extraction by reducing methane adsorption, enhancing methane desorption, and accelerating gas–liquid two-phase flow. So far, with the development of electrochemical modification methods, scholars believe that reasonable designed parameters electrochemistry can not only achieve the purpose of soil decontamination, dehydration, and electroosmotic consolidation but also be an effective method to strengthen CBM extraction. As shown in Figure 12, the cathode of the DC power supply is arranged at the extraction well and the anode of the power supply is arranged at the far end of the horizontal well. After power is on, the movement of water and methane is toward the cathode due to the electroosmotic effect; as a result, the rate of CBM extraction is enhanced.
Figure 12.
Schematic diagram of an enhanced CBM extraction by electrochemical modification.
5. Conclusions
-
(1)
For enhancing the CBM extraction, the CH4 and H2O wettability of Qinshui anthracite was analyzed by experiment and molecular simulation to reveal the electrochemical modification essence of CH4 adsorption performance in anthracite.
-
(2)
The application of electrochemical modification is efficient for CBM extraction due to the decrease in CH4 adsorption. The molecular mechanism is that the interaction between anthracite and CH4 decreases.
-
(3)
The larger wettability of H2O on anthracite surface occupies the effective adsorption site of CH4 further increase the CH4 extraction.
-
(4)
The effect of mental ion electrolytes on anthracite electrochemical modification has been discussed above, which is limited to explain the wettability change of all electrolytic solutions and coals. More types of electrolytic solutions and coals will be tested and analyzed in our further work.
6. Molecular Simulation and Experiment Details
6.1. Coal Samples and Molecular Models
The anthracite samples for the experiments were obtained from Jincheng, Shanxi Province of China. The coal samples were pulverized to pass through 60–80 mesh sieves (particle size of 0.18–0.25 mm) and then desiccated in a vacuum oven at 100–105 °C for 20 h. The mean maximum vitrinite reflectance (Ro,max) was 3.385% (>2.50%), and it can be indicated that the coal sample used in the experiment is anthracite with a high metamorphic degree. The proximate analysis and proximate analysis tests followed the GB/T 212-2008 and GB/T 476-2001 standard, respectively. The results are listed in Table 4.
Table 4. Analysis Results of the Anthracite Samplea.
| proximate
analysis (wt %) |
ultimate
analysis (daf, %) |
|||||||
|---|---|---|---|---|---|---|---|---|
| Ro,max (%) | moisture (ad) | ash yield (ad) | volatile matter (daf) | C | H | O | S | N |
| 3.385 | 1.65 | 5.21 | 6.12 | 86.22 | 2.648 | 6.741 | 0.42 | 1.04 |
ad: air basis; daf: dry ash-free basis.
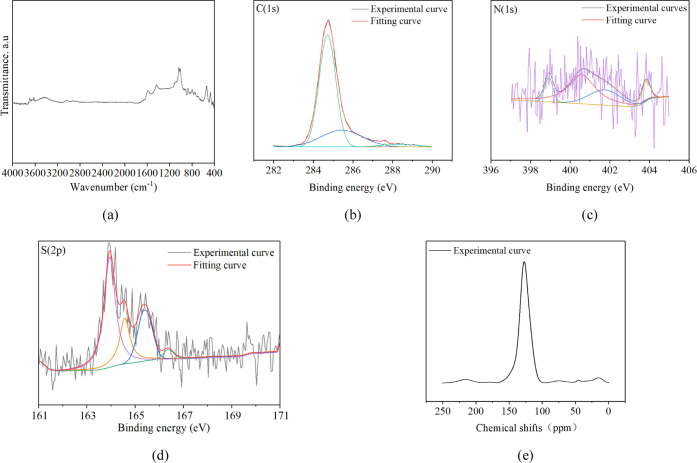
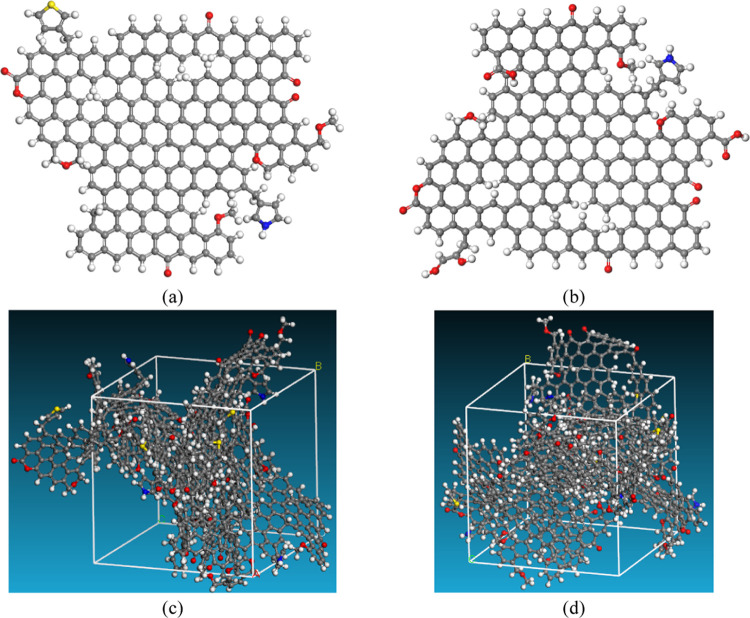
The molecular model of the anthracite was expressed by ss13C NMR, FTIR, and X-ray photoelectron spectroscopy (XPS). The results of the ultimate analysis showed that the proportion of H/C, O/C, S/C, and N/C of anthracite is 0.36, 0.05, 0.01, and 0.01, respectively. The surface groups of anthracite were measured by the FTIR device named Nicolet is5, as shown in Figure 13a. The XPS was performed by ESCALA B250, and the test results of C (1s), N (1s), and S (2P) and the fitting curves are shown in Figure 13b–d respectively. The ss13C NMR was tested by AVAVCE III HD 600 MHz. The test result is shown in Figure 13e, and the fitting results are listed in Table 5. Based on the spectroscopic data for the anthracite samples (Figure 13a–e), the plant and three-dimensional (3D) models of anthracite before and after modification were constructed in Materials Studio software, as shown in Figure 14a–d. The change in functional groups referred to the FTIR test results. Five plant models (anthracite unit molecules) were constituted to construct the 3D models (amorphous cells) with periodicity in three directions, and the composition is C201H77O10NS and C198H71O15N with 290 and 285 atoms, respectively. Besides, considering that electrochemical modification has a limited effect on pore structures coal, the influence of pore size distribution and pore size change is not considered in the construction of the model. The simulated cell of anthracite is sliced parallel three planes, respectively. The cell was minimized by annealing dynamics with a temperature cycle from 300 to 1000 K.18,35,36 The final structures of the unit cell in three dimensions were 24.5 × 24.5 × 24.5 Å for anthracite.
Figure 13.
Test and fitting results of FTIR, XPS, and NMR of anthracite: (a) FTIR spectra, (b) XPS spectra of C1s, (c) XPS spectra of N1s, (d) XPS spectra of S2p, and (e) NMR spectra of 13C.
Table 5. Structural Parameters and Proportion of Anthracite (%)a.
| coal | fa | fal | fa′ | faC | faH | faN | faB | faS | faP | fal* | falH |
|---|---|---|---|---|---|---|---|---|---|---|---|
| anthracite | 93.05 | 6.95 | 89.31 | 3.74 | 48.81 | 40.50 | 30.47 | 9.55 | 0.48 | 2.30 | 6.49 |
PS: fa-total sp2 carbons; fal-total sp3 carbons; fa′-aromatic carbons; faC-carbonyl/carboxyl carbons; faH-protonated aromatic carbons; faN-nonprotonated aromatic carbons; faB-aromatic bridgehead carbons; faS-alkylated aromatic carbons; faP-phenols and phenolic ethers; fal*-methyl or methoxyl groups; falH-CH or CH2.
Figure 14.
Molecular model of anthracite in the Qinshui basin. Chemical formula. Color code: C (gray), H (white), O (red), N (blue), and S (yellow). (a) Two-dimensional model of raw anthracite. (b) Two-dimensional model of treated anthracite. (c) Three-dimensional model of raw anthracite. (d) Three-dimensional model of the treated anthracite.
6.2. Electrochemical Modification Equipment
Figure 15 shows the device for testing the prepared coal samples. The device is mainly composed of a DC (direct current) power, an injection pump, a multimeter, two electrode plates, and three potential probes. The electrolyzer is made of Plexiglas plates with an internal dimension of φ50 × 100 mm. The detailed information of the electrochemical modification apparatus and CH4 adsorption/desorption characteristics measurement instrument has been described in our previous work.17
Figure 15.
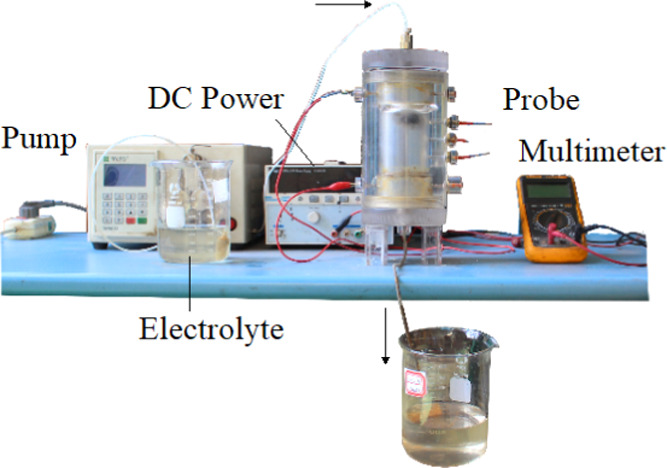
Images of the experimental apparatus.
6.3. Implementation of Molecular Simulation
The Grand Canonical Monte Carlo simulations and molecular dynamics simulations were used in the process of simulations, which include adsorption amount, interaction energy, anthracite volume, and adsorption site. The simulation was realized under a compass force field in materials studio software with a cutoff distance of 1.25 nm.37,38 Periodic boundary conditions were applied in three directions. The total configurations for each case were 2 × 10⁷ configurations, which ensured the equilibrium of the system and adsorption calculations.39,40 The NPT ensemble and the NVE ensemble were selected for molecular dynamics simulations to analyze the volume and the interaction energy. To calculate the CH4 desorption coefficient, the NPT ensemble was used for molecular dynamics simulations. After that, the mean square displacement was simulated in the Forcite analysis.
Acknowledgments
The use of the Materials Studio software package, which is supported by the Key Laboratory of Coal Science and Technology of the Ministry of Education and Taiyuan University of Technology, is gratefully acknowledged.
This research was supported financially by the National Natural Science Foundation of China [grant number U1810102] and [grant number 41902179], the Shanxi Applied Basic Research Program, Youth Science and Technology Research Foundation [grant number 2019010D211033], the projects supported by Liaoning Provincial Natural Science Foundation [grant number 2020-KF-22-02], the general projects of the National Natural Science Foundation of China [grant number 61973305], the Beijing Science and Technology Project [grant number Z201100004520015], the Tiandi Technology Co., Ltd., Science and Technology Innovation and Entrepreneurship Fund Special Industry–University Research Science and Technology Cooperation Project [grant number 2020-2-TD-CXY006], and the special key projects of Science and Technology Innovation and Entrepreneurship Fund of China Coal Science and Industry Group [grant number 2019-2-ZD002].
The authors declare no competing financial interest.
References
- Xu H.; Sang S.; Yang J.; Jin J.; Hu Y.; Liu H.; Ren P.; Gao W. In-situ stress measurements by hydraulic fracturing and its implication on coalbed methane development in Western Guizhou, SW China. J. Unconv. Oil Gas Resour. 2016, 15, 1–10. 10.1016/j.juogr.2016.04.001. [DOI] [Google Scholar]
- Lin B.; Shen C. Coal permeability-improving mechanism of multilevel slotting by water jet and application in coal mine gas extraction. Environ. Earth Sci. 2015, 73, 5975–5986. 10.1007/s12665-015-4154-8. [DOI] [Google Scholar]
- Shen J.; Qin Y.; Fu X.; Wang G.; Chen R.; Zhao L. Study of high-pressure sorption of methane on Chinese coals of different rank. Arabian J. Geosci. 2015, 8, 3451–3460. 10.1007/s12517-014-1459-y. [DOI] [Google Scholar]
- Saghafi A.; Javanmard H.; Pinetown K. Study of coal gas wettability for CO2 storage and CH4 recovery. Geofluids 2014, 14, 310–325. 10.1111/gfl.12078. [DOI] [Google Scholar]
- Bakhshi E.; Rasouli V.; Ghorbani A.; Marji M. F.; Damjanac B.; Wan X. Lattice numerical simulations of lab-scale hydraulic fracture and natural interface interaction. Rock Mech. Rock Eng. 2019, 52, 1315–1337. 10.1007/s00603-018-1671-2. [DOI] [Google Scholar]
- Arif M.; Jones F.; Barifcani A.; Iglauer S. Influence of surface chemistry on interfacial properties of low to high rank coal seams. Fuel 2017, 194, 211–221. 10.1016/j.fuel.2017.01.027. [DOI] [Google Scholar]
- Guo J.; Kang T.; Kang J.; Chai Z.; Zhao G. Accelerating methane desorption in lump anthracite modified by electrochemical treatment. Int. J. Coal Geol. 2014, 131, 392–399. 10.1016/j.coal.2014.06.011. [DOI] [Google Scholar]
- Coughlin R. W.; Farooque M. Consideration of electrodes and electrolytes for electrochemical gasification of coal by anodic oxidation. J. Appl. Electrochem. 1980, 10, 729–740. 10.1007/BF00611276. [DOI] [Google Scholar]
- Zhang L.; Kang T.; Kang J.; Zhang X.; Zhang R.; Kang G. Effects of electrolyte pH on the electro-osmotic characteristics in anthracite. ACS Omega 2020, 5, 29257–29264. 10.1021/acsomega.0c04013. [DOI] [PMC free article] [PubMed] [Google Scholar]
- Peng C.; Almeira J. O.; Abou-Shady A. Enhancement of ion migration in porous media by the use of varying electric fields. Sep. Purif. Technol. 2013, 118, 591–597. 10.1016/j.seppur.2013.08.007. [DOI] [Google Scholar]
- Boulakradeche M. O.; Akretche D. E.; Cameselle C.; Hamidi N. enhanced electrokinetic remediation of hydrophobic organics contaminated soils by the combination of non-ionic and ionic surfactants. Electrochim. Acta 2015, 174, 1057–1066. 10.1016/j.electacta.2015.06.091. [DOI] [Google Scholar]
- Xue Z.; Tang X.; Yang Q. Influence of voltage and temperature on electro-osmosis experiments applied on marine clay. Appl. Clay Sci. 2017, 141, 13–22. 10.1016/j.clay.2017.01.033. [DOI] [Google Scholar]
- Steel K. M.; Besida J.; O’Donnell T. A.; Wood D. G. Production of ultra clean coal: Part I—Dissolution behaviour of mineral matter in black coal toward hydrochloric and hydrofluoric acids. Fuel Process. Technol. 2001, 70, 171–192. 10.1016/S0378-3820(01)00171-0. [DOI] [Google Scholar]
- Kelsall G. H.; Yin Q.; Vaughan D. J.; England K. E. R.; Brandon N. P. Electrochemical oxidation of pyrite (FeS2) in aqueous electrolytes. J. Electroanal. Chem. 1999, 471, 116–125. 10.1016/S0022-0728(99)00261-2. [DOI] [Google Scholar]
- Shen Y.; Liu X.; Sun T.; Jia J. Recent advances of sodium borohydride reduction in coal water slurry desulfurization: integration of chemical and electrochemical reduction. RSC Adv. 2012, 2, 8867–8882. 10.1039/C2RA20884A. [DOI] [Google Scholar]
- Kang J.; Zhang B.; Wang J.; Wu J.; Wang L.; Yin B.; Kang T. Mechanical testing of anthracite to assess its surface energy and temperature dependence. Fuel 2019, 239, 76–86. 10.1016/j.fuel.2018.10.153. [DOI] [Google Scholar]
- Zhang X.; Zhang R.; Kang T.; Hu Y. The adsorption and desorption behavior of CH4 on Jincheng anthracite modified in Fe3+ and Cu2+ ion electrolytes. Energy Fuels 2020, 34, 1251–1258. 10.1021/acs.energyfuels.9b02622. [DOI] [Google Scholar]
- Huang L.; Ning Z.; Wang Q.; Zhang W.; Cheng Z.; Wu X.; Qin H. Effect of organic type and moisture on CO2/CH4 competitive adsorption in kerogen with implications for CO2 sequestration and enhanced CH4 recovery. Appl. Energy 2018, 210, 28–43. 10.1016/j.apenergy.2017.10.122. [DOI] [Google Scholar]
- Bhoi S.; Banerjee T.; Mohanty K. Molecular dynamic simulation of spontaneous combustion and pyrolysis of brown coal using ReaxFF. Fuel 2014, 136, 326–333. 10.1016/j.fuel.2014.07.058. [DOI] [Google Scholar]
- Zhang J.; Clennell M. B.; Dewhurst D. N.; Liu K. Combined Monte Carlo and molecular dynamics simulation of methane adsorption on dry and moist coal. Fuel 2014, 122, 186–197. 10.1016/j.fuel.2014.01.006. [DOI] [Google Scholar]
- Zhang J.; Liu K.; Clennell M. B.; Dewhurst D. N.; Pervukhina M. Molecular simulation of CO2-CH4 competitive adsorption and induced coal swelling. Fuel 2015, 160, 309–317. 10.1016/j.fuel.2015.07.092. [DOI] [Google Scholar]
- Yu S.; Bo J.; Wu L. Molecular simulation of CH4/CO2/H2O competitive adsorption on low rank coal vitrinite. Phys. Chem. Chem. Phys. 2017, 19, 17773–17788. 10.1039/C7CP02993D. [DOI] [PubMed] [Google Scholar]
- Xiang J.; Zeng F.; Li B.; Zhang L.; Li M.; Liang H. Construction of macromolecular structural model of anthracite from Chengzhuang coal mine and its molecular simulation. J. Fuel Chem. Technol. 2013, 41, 391–400. 10.1016/S1872-5813(13)60022-5. [DOI] [Google Scholar]
- Mosher K.; He J.; Liu Y.; Rupp E.; Wilcox J. Molecular simulation of methane adsorption in micro- and mesoporous carbons with applications to coal and gas shale systems. Int. J. Coal Geol. 2013, 109–110, 36–44. 10.1016/j.coal.2013.01.001. [DOI] [Google Scholar]
- Nie B.; Wang L.; Li X.; Wang C.; Li L. Simulation of the interaction of methane, carbon dioxide and coal. Int. J. Min. Sci. Technol. 2013, 23, 919–923. 10.1016/j.ijmst.2013.11.007. [DOI] [Google Scholar]
- Luo J.; Liu Y.; Jiang C.; Chu W.; Jie W.; Xie H. Experimental and modeling study of methane adsorption on activated carbon derived from anthracite. J. Chem. Eng. Data 2011, 56, 4919–4926. 10.1021/je200834p. [DOI] [Google Scholar]
- Wang Y.; Wei X.; Xie R.; Liu F.; Li P.; Zong Z. Structural characterization of typical organic species in Jincheng No. 15 anthracite. Energy Fuels 2015, 29, 595–601. 10.1021/ef502373p. [DOI] [Google Scholar]
- Nord G.; Esteves M.; Lapetite J. M.; Hauet A. Effect of particle density and inflow concentration of suspended sediment on bedload transport in rill flow. Earth Surf. Processes Landforms 2009, 34, 253–263. 10.1002/esp.1710. [DOI] [Google Scholar]
- Gasparik M.; Ghanizadeh A.; Bertier P.; Gensterblum Y.; Bouw S.; Krooss B. M. High-pressure methane sorption isotherms of black shales from the Netherlands. Energy Fuels 2012, 26, 4995–5004. 10.1021/ef300405g. [DOI] [Google Scholar]
- Zhang B.; Kang J.; Kang T. Molecular simulation of methane adsorption and its effect on kaolinite swelling as functions of pressure and temperature. Molecular Simulation 2018, 44, 789–796. 10.1080/08927022.2018.1453138. [DOI] [Google Scholar]
- Zhang B.; Kang J.; Kang T.; Kang G.; Zhao G. Molecular dynamics simulations of CH4 diffusion in kaolinite: Influence of water content. Int. J. Coal Sci. Technol. 2019, 6, 556–563. 10.1007/s40789-019-00275-2. [DOI] [Google Scholar]
- Kärger J.; Binder T.; Chmelik C.; Hibbe F.; Krautscheid H.; Krishna R.; Weitkamp J. Microimaging of transient guest profiles to monitor mass transfer in nanoporous materials. Nat. Mater. 2014, 13, 333–343. 10.1038/nmat3917. [DOI] [PubMed] [Google Scholar]
- Feng Z.; Cai T.; Zhou D.; Zhao D.; Zhao Y.; Wang C. Temperature and deformation changes in anthracite coal after methane adsorption. Fuel 2017, 192, 27–34. 10.1016/j.fuel.2016.12.005. [DOI] [Google Scholar]
- Hao S.; Wen J.; Yu X.; Chu W. Effect of the surface oxygen groups on methane adsorption on coals. Appl. Surf. Sci. 2013, 264, 433–442. 10.1016/j.apsusc.2012.10.040. [DOI] [Google Scholar]
- Sui H.; Yao J. Effect of surface chemistry for CH4/CO2 adsorption in kerogen: A molecular simulation study. J. Nat. Gas Sci. Eng. 2016, 31, 738–746. 10.1016/j.jngse.2016.03.097. [DOI] [Google Scholar]
- Wang T.; Tian S.; Li G.; Sheng M. Selective adsorption of supercritical carbon dioxide and methane binary mixture in shale kerogen nanopores. J. Nat. Gas Sci. Eng. 2018, 50, 181–188. 10.1016/j.jngse.2017.12.002. [DOI] [Google Scholar]
- Sun H.; Ren P.; Fried J. R. The COMPASS force field: Parameterization and validation for phosphazenes. Comput. Theor. Polym. Sci. 1998, 8, 229–246. 10.1016/S1089-3156(98)00042-7. [DOI] [Google Scholar]
- Zhao Y.; Feng Y.; Zhang X. Molecular simulation of CO2/CH4 self- and transport diffusion coefficients in coal. Fuel 2016, 165, 19–27. 10.1016/j.fuel.2015.10.035. [DOI] [Google Scholar]
- Zhang B.; Kang J.; Kang T. Effect of water on methane adsorption on the kaolinite (0 0 1) surface based on molecular simulations. Appl. Surf. Sci. 2018, 439, 792–800. 10.1016/j.apsusc.2017.12.239. [DOI] [Google Scholar]
- Zhang B.; Kang J.; Kang T. Monte Carlo simulations of methane adsorption on kaolinite as a function of pore size. J. Nat. Gas Sci. Eng. 2018, 49, 410–416. 10.1016/j.jngse.2017.11.026. [DOI] [Google Scholar]


