

Abstract

Permeability is one of the important parameters for reservoir evaluation, development, and production prediction. Shale oil and gas being an important unconventional energy source, the characteristics of extremely low porosity and permeability bring great challenges to development. Therefore, it is crucial to accurately describe the permeability of shale reservoirs. Based on the steady-state method, pulse decay method, and nuclear magnetic resonance (NMR) method, this paper systematically analyzed the adaptability of various test methods in shale reservoir permeability characterization and optimized the best test method. On this basis, a new high-precision NMR single parameter Tw of shale reservoirs is established, and the compatibility between the model and the experimental results is verified. The results show that the new model with Tw as the main parameter is the most accurate one to calculate the permeability of shale reservoirs in the range of 10–3–100 mD. The correlation coefficient between the weighted average relaxation time and pulse decay method is as high as 96.31%, and the relative error between the permeability predicted by the new model and the pulse permeability is 19.43%. These studies have laid a theoretical foundation for the quantitative characterization of fluid seepage capacity in shale reservoirs.
1. Introduction
Shale oil and gas have become an important source of energy and play an important strategic role.1 The physical properties of shale reservoirs are poor, the pore throat has reached the nanometer level, the porosity is about 4∼8%, and the matrix permeability is in the range of 0.0001∼1 mD. Permeability is one of the key parameters necessary for shale gas reservoir evaluation, productivity calculation, and development plan formulation. A reasonable and accurate permeability testing method plays a crucial guiding role in the development plan formulation and economic analysis of shale reservoirs.2,3
The commonly used methods for testing rock permeability in laboratories can be divided into steady-state methods and unsteady-state methods.4−6 A steady-state method is a standard method for indoor measurements of core permeability.7 A steady-state method is a calculation method based on Darcy’s law. The seepage of the test medium in the rock pores needs to reach a stable state, and when the critical Reynolds number Re < 7, Darcy’s law can be applied.8,9 The rock permeability measured by a conventional steady-state method in the laboratory is closely related to the inject pressure.10 Gas is usually used as the inject medium. However, gas often has “gas slippage effect” when the shale reservoir has seepage at low pressure. In order to correct the slippage effect, it is necessary to perform multiple measurements under different displacement pressures. Through Klinkenberg equation fitting, the K∞ permeability independent of test pressure can be obtained.11 However, for tight reservoirs such as shale, it takes a long time for the upstream and downstream flow to reach a stable state, which is susceptible to the influence of ambient temperature during a long period of experiment, resulting in core expansion or contraction, leading to the change of rock permeability.12
The pulse decay method is different from the steady state method, the pulse decay permeability does not require recording of sample exit velocity and injection differential pressure, through test sample one-dimensional unsteady seepage pore pressure with time attenuation in the process of data and combined with the corresponding mathematical model and test instrument is limited by the initial conditions and boundary conditions, the seepage equation of accurate solution and suitable simplified error control, so as to obtain the permeability of reservoir parameters. Because the pulse decay method is used to monitor the unsteady flow pressure, compared with the steady-state method, the test time is greatly shortened and the error influence such as temperature fluctuation caused by long-term measurements is reduced.13−15
Based on the difference between the steady-state method and the pulse decay method to test shale permeability, the pulse decay method has been well applied in tight reservoirs such as shale.16−18 In order to be able to better evaluate the permeability of low-permeability reservoirs, reduce and avoid conventional penetration experiment error, at the same time reduce the complexity of conventional permeability experiments and optimization of experiment operation, and improve the measurement precision, Seevers et al., for the first time, proposed a method for estimating permeability by nuclear magnetic resonance (NMR) methods.19−21 Compared with the steady-state method and the unsteady-state method, the NMR method can be used to detect rock permeability rapidly and nondestructively. At the same time, it is one of the important means to effectively recognize reservoirs and evaluate reservoir parameters. In essence, it reflects the pore structure of reservoirs by measuring hydrogen signals in fluid.22−24 Scholars have proposed a variety of rock NMR permeability calculation models; currently, the main models used are the Coates model, SDR model, the corresponding extended model, and the single-parameter model. This is shown in Table 1.25−27 However, these models are all based on the analysis and statistics of conventional reservoirs and tight sandstone reservoirs. There are few studies on the applicability and prediction effect of shale reservoirs; there is no unified conclusion on whether the prediction parameters in the current model are applicable to the calculation of shale permeability.
Table 1. Permeability Prediction Model Based on NMR.
| model name | expression | model parameters |
|---|---|---|
| Coates model |  |
φ is the core porosity; FFI is the bound fluid saturation, %; and BVI is the movable fluid saturation, % |
| Coates extension model |  |
φ is the core porosity; C1, m, and n are model parameters; FFI is the bound fluid saturation, %; and BVI is the movable fluid saturation, % |
| SDR model | K = C2φ4T2g2 | C2 is the model parameter; φ is the core porosity; T2g is the geometric mean of relaxation time, ms |
| SDR expansion model | K = C3φm2T2gn | C3, m, and n are model parameters; φ is the core porosity; and T2g is the geometric mean of relaxation time, ms |
| single-parameter model27 | K = C4e(C5T2g) | C4 and C5 are the model parameters; T2g is the geometric mean of relaxation time, ms |
Therefore, in this paper, in order to give the recommendation value for the relatively accurate measurement range, the steady-state method and the pulse decay method are used to test the shale core respectively to study the applicability of the two test methods in the shale permeability test systematically; based on the pulse decay method and considering the contribution of different pore structures to permeability, a new NMR permeability testing model for shale is proposed, which provides a reference for indoor permeability testing.
2. Results and Discussion
2.1. Analysis of Experimental Results
Figure 1 shows the comparison results of the permeability between the steady-state method and the pulse decay methods in 16 shale samples. In Figure 1a, the test results of the steady-state method and pulse attenuation method are set as a limit of 1 × 10⁻¹ mD. When the permeability is greater than 1 × 10⁻¹ mD, the permeability test results are basically the same. As shown in the log–log coordinate diagram in Figure 1b, the lower the permeability of shale, the larger the error between the two kinds of permeability. For example, the corresponding pulse permeability of rock samples with the Klinkenberg permeabilities of 0.0146 and 0.3587 mD is 0.0005 and 0.3946 mD, respectively, and the mutual error calculated based on the Klinkenberg permeability is 96.84 and 10.02%, respectively.
Figure 1.

Comparison of permeability between the steady-state method and the pulse decay method: (a) comparison of permeabilities as measured by the two methods; (b) relative error of permeability measured by two methods.
Combined with Figures 1 and 2, it can be seen that the relative errors of the two kinds of permeability increase with the decrease of the steady-state permeability. Statistics show that the relative errors of steady-state permeability and pulse permeability of 17 shale cores range from 1.84 to 96.84%, with an average value of 45.83%. When steady-state permeability is greater than 1 × 10⁻¹ mD, the relative error of the two permeability is greater than 63.21%. When the permeability is less than 1 × 10⁻¹ mD, the relative error of the two kinds of permeability is less than 28.40%.
Figure 2.
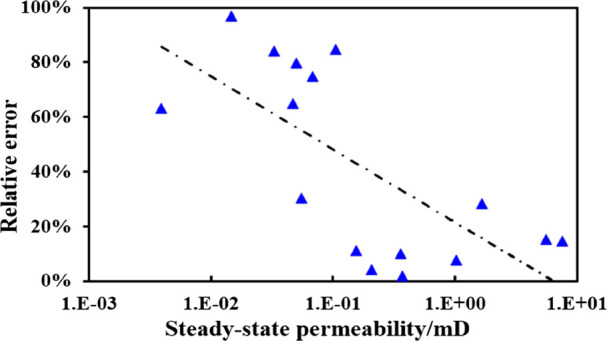
Relationship between relative errors and steady-state permeability.
The experimental results show that the steady-state permeability and pulse attenuation permeability have obvious differences in different permeability ranges. In order to further analyze the reasons for the obvious differences between the two kinds of permeability, the experimental principles are compared and analyzed respectively.
As shown in Figure 3, during the steady-state method experiment, a certain continuous pressure is applied at one end of the core to make nitrogen form a stable one-dimensional seepage flow in the core, and the permeability of the rock sample is calculated by using Darcy’s formula. As shown in Figure 4, the pulse attenuation rule is that one-dimensional seepage flow is formed in the pore of the core by applying instantaneous pressure pulse in the upstream of the core, and permeability is calculated according to the attenuation curve of the upper and downstream pressure difference over time. The pressure difference through the sample in the steady-state method experiment is usually much higher than that in the pulse attenuation experiment. A large pressure difference will lead to an uneven distribution of effective stress on the sample.4 For pulse attenuation experiments, data interpretation usually occurs when the upstream and downstream pressures are nearly equal as they approach the equilibrium pressure. As a result, the distribution of pressure and stress across the sample is more uniform.
Figure 3.

Schematic diagram of the steady-state method.
Figure 4.

Schematic diagram of the pulse decay method.
The precondition of permeability measurement by steady-state method is that the seepage in the pore needs to reach a stable state, for shale rock, with very low permeability, smaller differential pressure to reach a steady state to take a long time, achieve steady state, through greater pressure to speed up and because of the high-pressure difference to produce non-Darcy flow, at this time, Darcy’s law has not been established. Therefore, the steady-state method takes a long time, and the long-term measurement will lead to temperature fluctuations, device leakage, and other problems, which will make the core compress or expand, leading to inaccurate experimental results. The pulse decay method monitors the pressure of unsteady flow, thus shortening the measurement time to a large extent and reducing the error influence caused by too long time. For high permeability cores, the initial instantaneous pressure pulse reaches equilibrium very quickly, which makes the measurement time too short, and the measurement results are greatly affected by the error of the device operation.
For shale samples with permeability greater than 0.1 mD, compared with the pulse decay method, the steady-state method and pulse decay method test results are in the same order of magnitude, and the relative error is small. In addition, the steady-state method has a relatively simple operation method and data processing analysis. Therefore, when the permeability is greater than 0.1 mD, the steady-state method is recommended. When the permeability is less than 0.1 mD, the measurement results of the pulse decay method are more reliable due to the difference of experimental equipment and experimental principles. However, the pulse decay method requires a long period of system equilibrium time before the start of the experiment, and it needs to derive various analytical solutions of permeability from experimental data, which makes the comparison of calculation results more complicated. According to Figure 1a, in the range of 0.1–1 mD, the permeabilities measured by the pulse decay method and steady-state method are in the same order of magnitude, and the results are basically the same. Therefore, cores with a permeability less than 1 mD were selected from existing samples in this paper. Based on the current NMR permeability prediction model, a fast, high precision, and suitable NMR permeability prediction model is established based on the test results of the pulse decay method through NMR experiments.
2.2. Permeability Prediction Based on NMR
2.2.1. Comparison of Common Models
This is shown in Table 1, for sandstone, carbonate, and other reservoirs, NMR models for predicting rock permeability mainly include the Coates model, SDR model, and extended model. For shale reservoirs, there is a single-parameter model based on the NMR prediction model.
Based on the Coates model, SDR model, extended model, single-parameter model, and pulse permeability, the prediction results of different models are quantitatively evaluated. Comparison between the predicted permeability of each model and the pulse permeability results is shown in Figure 5. Models 1 and 2 predicted permeability according to NMR porosity, movable fluid saturation, and bound fluid saturation parameters. Model 2 changed from a constant property to variable constant on the basis of Model 1. Figure 5a shows the results of comparison between the Coates permeability prediction model and pulse decay method. The correlation between the two is only 32.27%, and the relative error is 208.84%; the NMR permeability of some samples is not in the same order of magnitude as that of the pulse attenuation method. Figure 5b shows the result of comparison between the Coates extended model and pulse attenuation method. Linear regression analysis was conducted based on pulse permeability, and the fitting result was as follows: C1 = 0.176, m1 = 0.473, and n1 = 1.015. The permeability calculated according to Model 2 has a good correlation with the pulse decay method, and the correlation coefficient can reach 91.3%, but the relative error is still large.
Figure 5.

Permeability of the five NMR prediction models is compared with that of the pulse attenuation method: (a) Coates model, (b) Coates extended model, (c) SDR model, (d) SDR extended model, and (e) single-parameter model.
The SDR model and the SDR extension model take the geometric mean T2 and porosity as parameters, which are not affected by the movable fluid saturation and irreducible water saturation, which makes the model simpler. Fitting analysis was carried out according to the above method to get C2 = 1.806. In Figure 9c, the correlation between the two is 35.10%, and the relative error is large. Most of the predicted permeabilities and pulse permeabilities are not in the same order of magnitude. For Model 4, linear regression analysis was carried out to obtain C3 = 0.143, m2 = 0.987, and n2 = 11.899. As shown in Figure 5d, the permeability predicted by the SDR extended model has a good correlation with the pulse permeability, with a correlation coefficient of 89.75% and a relative error of 94.64%. Compared with the previous three models, it has a good correlation but a relatively large error.
Figure 9.

Part of experimental rock samples.
Model 5 is a single-parameter model, which only takes the geometric mean T2 as a parameter to be considered, and the pulse permeability is used for fitting analysis, C4 = 3.078 and C5 = 13.348. In Figure 5e, the correlation between the predicted permeability result of Model 5 and the pulse permeability is 90.44%, with a relative error of 64.30%. In summary, Model 5, which only considers the geometric mean value of a single parameter, has a good correlation with the pulse permeability results and can be used to predict permeability more accurately, but the relative error is still large.
According to the comparative analysis of the permeability prediction model based on NMR and the permeability measured by the pulse decay method, the experimental results show that the relative error between the Coates model and pulse decay method is the largest. The Coates model mainly considers the core porosity, movable fluid saturation, and bound fluid saturation parameters, and the permeability of some samples predicted by the Coates model is not in the same order of magnitude as that of the pulse decay method. The extended model also shows the same results. The difference between the SDR model and Coates model is that the saturation of movable fluid is not considered, but the core porosity and geometric mean T2 are taken as parameters, and the extended model of the SDR model has a lower relative error than the Coates model. Compared with the Coates and SDR models, Model 5 only considers the geometric mean T2 parameter, which is simpler, but the permeability predicted by this model has a better correlation with the pulse attenuation permeability, and the relative error is the smallest.
2.2.2. Correlation Analysis of Main NMR Parameters and Permeability
In order to further analyze the reasons for the error between the predicted permeability results of each model and the pulse permeability, parameters such as NMR porosity, the ratio of movable fluid saturation to irradiated water saturation, and the geometric mean value of T2 relaxation time were selected in this paper to analyze the errors respectively with the pulse attenuation method permeability.
A large number of experiments show that porosity and permeability are not correlated to a certain extent. The pores in shale are mainly formed by hydrocarbon generation from organic matter, with a complex pore structure and seepage law. As shown in Figure 6a, the correlation between porosity and permeability is only 26.56%, and the core permeability with high porosity is even relatively low. The permeability is related to the geometric shape of the void, the size of particles, the direction of arrangement, the pore throat connectivity, and other factors in the direction of permeability; the porosity has a poor correlation with permeability.
Figure 6.

Correlation analysis between main NMR parameters and permeability: (a) porosity parameter, (b) FFI/BVI parameter, and (c) T2g parameter.
Models 1 and 2 considered the bound fluid saturation/movable fluid saturation (FFI/BVI) parameters for shale reservoirs with poor fluid mobility and usually by centrifugation measure the irreducible water saturation and movable fluid saturation, but as a result of shale samples having a lower permeability, there is very little displacement of water by centrifugal experiments, and the experimental results are influenced by environmental factors and large experimental operation. In Figure 6b, the correlation between FFI/BVI and the pulse decay method is only 27.14%. Therefore, the permeability of the prediction model, which takes permeability and FFI/BVI as parameters, has a large relative error with pulse permeability, and this method is not suitable for the prediction of shale reservoir permeability.
In Figure 6c, there is a good correlation between the geometric mean of relaxation time and pulse permeability, and the correlation coefficient is 72.70%. The geometric mean of relaxation time represents the distribution state of fluid in shale pores. In Model 5, the geometric mean of relaxation time is considered as the only parameter that greatly improves the accuracy of permeability prediction results. Therefore, among the main parameters considered by the above five models, the geometric mean of relaxation time and pulse permeability have a good correlation and can be used as the main parameters of the permeability prediction model.
2.2.3. Establishment and Evaluation of the NMR Permeability Prediction Model
On studying the geometric mean of relaxation time of T2g in NMR, it is found that the geometric mean of relaxation time is greatly affected by the extreme marker value, and each marker value must be a positive number greater than 0 to determine the geometric mean. However, the porosity component of shale samples in small pores is less than 10–5, and the porosity components of the beginning relaxation time and the end relaxation time are significantly different. Therefore, T2g as a parameter to predict permeability has a certain error. In order to further reduce the prediction error of the NMR permeability model, on the basis of Model 5, the porosity component is taken as the weight coefficient to calculate the T2 weighted average, as shown in eq 1.
| 1 |
There is a good correlation between the weighted average of Tw relaxation time and pulse permeability, with a correlation coefficient of 96.31%, as shown in Figure 7. Using Tw as a parameter of the permeability prediction model, it can better reflect the diversity of fluid space in shale reservoirs. The new model can be expressed as follows (eq 2):
| 2 |
Figure 7.

Weighted mean of T2 relaxation time is correlated with pulse permeability.
As shown in Figure 8, the relative error of the two kinds of permeability is 19.43% when the permeability is calculated by the new model. The permeability of the shale sample studied in this paper is basically 10–3 to 100 mD. The permeability of the single-parameter prediction model based on the weighted average of relaxation time is in the same order of magnitude as the pulse permeability, and the relative error is low. Therefore, the new model can well predict the permeability of shale samples.
Figure 8.

Comparison of pulse permeability and NMR permeability.
As shown in Table 2, the relative errors of the permeability results and pulse permeability predicted by the two Cotes models and SDR models are large, and the permeability results are not in the same order of magnitude. The permeability prediction results of the SDR extended model and single-parameter model have relatively small errors compared with the first three models, but the prediction results still have large errors compared with the pulse permeability. The relative error between the permeability results predicted by the new parameter model and the pulse permeability is the smallest, only 19.43%.
Table 2. Fitting Formula and Errors of Permeability Prediction Models Based on NMR.
| model name | fitting formula | MAPE/% |
|---|---|---|
| Coates model | 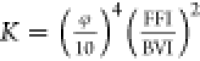 |
208.84 |
| Coates extension model |  |
337.68 |
| SDR model | K = C2φ4T2g2 | 215.94 |
| SDR extension model | K = 0.143φ–0.987T2g11.899 | 94.64 |
| single-parameter model | K = 3.078e(13.348T2g) | 64.30 |
| new parameter model | K = 3 × 10⁻⁶ exp (6.3416Tw) | 19.43 |
Above comprehensive analysis results of several models found that the new parameter Tw has a good correlation with the permeability measured by the pulse decay method, and compared with other nuclear magnetic permeability prediction models, the new model to predict the permeability of the samples and the pulse attenuation method showed that the permeability value has a smaller relative error; therefore, the new model is more suitable for predicting the permeability of low-permeability shale. However, this new model in the prediction of permeability at present also has certain limitations; Tw permeability parameters and the permeability of the pulse decay model have good correlation, and the model is based on the permeability of the pulse attenuation method for fitting, and this experiment adopts the pulse attenuation device, due to the upstream and downstream chamber volume and accuracy sensors. Therefore, the current permeability test range of this model is in the order of 10–3 to 100 mD. To determine whether this model is suitable for the prediction of samples with permeability lower than the order of 10–3 mD, further research work needs to be carried out.
3. Conclusions
Shale reservoirs have extremely complex pore connectivity, and different test methods provide test results that have great uncertainty. Based on three different permeability testing methods, this paper conducts permeability testing and prediction respectively. By comparing and analyzing the results of different permeability calculation methods, a more accurate permeability prediction model is proposed. The conclusions are as follows:
-
(1)
The study shows that compared with the steady-state method, the pulse decay method is more suitable for the measurement of shale permeability when the permeability is less than 0.1 mD. The lower the permeability, the greater the error of the experimental results of the two methods, and the maximum value can reach 96.84%. When the permeability is greater than 0.1 mD, the relative error of the two permeability testing methods is less than 28.40%, and when the permeability is less than 0.1 mD, the relative error is more than 63.21%.
-
(2)
Taking the pulse decay method permeability as the standard, the correlation between the parameters of the current NMR permeability prediction model and the pulse permeability is deeply explored. The research shows that the shale core porosity and irreducible water saturation have poor correlation with the permeability and are not suitable as the prediction parameters of shale permeability.
-
(3)
On the basis of considering the correlation between the main parameters of NMR and the permeability of the pulse decay method, the single-parameter “Tw” model of shale NMR permeability is established; the Tw parameter has a good correlation with pulse permeability, which can better reflect the diversity of fluid space in shale reservoirs. The relative error of permeability between this model and the pulse decay method is 19.43%, indicating that this model can accurately predict shale permeability.
4. Experimental Materials and Methods
4.1. Experimental Materials
The experimental materials were seven ultralow permeability intersalt shale cores in a block of Jianghan Oilfield, China, three ultralow permeability continental shale cores in a block of Shengli Oilfield, China, and six ultralow permeability marine shale cores in a block of Longmaxi Formation, Fuling shale gas field, China. Table 3 shows the conventional physical properties of 16 rock samples. The permeability distribution range of the 16 rock samples covers the reservoirs with low–ultralow permeability and also contains three different lithologies of intersalt shale, marine shale, and continental shale, which are well representative.
Table 3. Petrophysical Properties of Sandstone Samples.
| sample composition |
||||
|---|---|---|---|---|
| core lithology | K∞ distribution range/mD | quantity/piece | porosity/% | Klinkenberg permeability/mD |
| intersalt shale | >1.0 | 3 | 5.804–6.836 | 1.651–7.6104 |
| 0.1–1.0 | 1 | 6.225 | 0.105 | |
| 0.01–0.1 | 3 | 4.514–8.995 | 0.033–0.068 | |
| continental shale | 0.1–1.0 | 3 | 6.245–7.724 | 0.154–0.369 |
| 0.01–0.1 | 3 | 5.323–7.485 | 0.015–0.056 | |
| marine shale | >1.0 | 1 | 3.533 | 1.016 |
| 0.1–1.0 | 1 | 3.951 | 0.359 | |
| <0.01 | 1 | 3.381 | 0.004 | |
In this paper, shale cores with different permeability levels were selected to drill plunger samples with a diameter of about 2.5 cm and a length of about 5 cm. Both ends of the plunger samples were cut flat, and the rock samples with obvious defects on the surface of the plunger were removed. Part of the rock sample is shown in Figure 9.
4.2. Experimental Method
4.2.1. Steady-State Method
Figure 10 shows the experimental flow chart of the steady-state method, which is mainly divided into three parts. The upstream is connected with a nitrogen bottle and constant pressure valve, the middle is a core holder, and the downstream is connected with a high-precision flowmeter with a measuring range of 0∼600 mL/min and an accuracy of 0.01 mL/min. For low-permeability cores, Malkovsky showed through experimental studies that constant pressure displacement was more accurate than constant velocity measurement data.9
Figure 10.

Flow chart of the steady-state permeability measurement experiment.
Test steps are as follows:
-
(1)
Obtain a core of standard size and weigh it.
-
(2)
Add the foaming liquid in the soap film flowmeter to an appropriate liquid level, and connect the soap film flowmeter with the outlet end of the core gripper.
-
(3)
After the rock sample is put into the holder, the confining pressure is increased to 2 MPa. Gas (nitrogen) of different pressures is applied respectively to the upstream of the rock sample, and the flow rate is measured by the downstream soap film flowmeter. The outlet end of the flowmeter is connected with the atmosphere.
-
(4)After the gas flow is stable, the gas flow rate is tested to calculate the apparent permeability, and the core’s Klinkenberg permeability is finally obtained by fitting according to the Klinkenberg equation (eq 3).
In the formula, Kg and K∞ are, respectively, the gas permeability and Klinkenberg permeability of rock samples, mD; b is the slippage factor, representing the strength of slippage effect in porous media, MPa; p̅ is the average gas pressure, MPa.
3
4.2.2. Pulse Decay Method
In this paper, the main shale pore size distribution used for the pulse decay method is in the range of 2–50 nm, and the average pore size is 35 nm, which belongs to the mesopore core. In the process of shale permeability testing and analysis, because the pores in shale are complex and diverse and most of them are nanosized, the gas flow process is controlled by slippage effect and solid surface force. The pulse decay method is not designed to fully capture the apparent diffusion of adsorbed gas, and it has some limitations in measuring shale permeability. The current experimental study shows that the slippage effect can be ignored when the pore size is greater than 32 nm and the gas pressure is greater than 7 MPa when the pulse attenuation method is used to measure the permeability of shale. Meanwhile, due to the weak adsorption of nitrogen, nitrogen was used as the high-pressure gas source in the test, and the change of upstream and downstream pressure was controlled within 5% of the initial pore pressure, so that the influence of gas desorption on permeability calculation could be ignored.28Figure 11 shows the experimental flow chart of the pulse decay method. The core permeability can be obtained through the upstream and downstream pressure attenuation curves with the theory of gas unsteady flow.
Figure 11.

Flow chart of the permeability measurement experiment by the pulse decay method.
The specific experimental steps are as follows:
-
(1)
Open all valves and inject gas at constant pressure. After the pressure is balanced for a few minutes, close the charging valve to ensure that the precision pressure gauge counts zero.
-
(2)
Close valve 2. When valve 7 is closed, open valve 6 to empty the pressure downstream of rooms 2 and 3, so that the pressure gauge can reach the maximum range.
-
(3)
Close valve 6, and the confining pressure and displacement pressure gradually increase to the target pressure with step length ΔP = 0.5 MPa (confining pressure, 9 MPa; inject pressure, 7 MPa).
-
(4)
After the pore pressure of upper and lower chambers and the rock sample reaches equilibrium, the pressure of the downstream chamber is manually reduced by about 70 kPa to form an initial attenuation pressure pulse to monitor ΔP and pressure of chamber 2, with the calculated average pore pressure Pm. Close valves 3 and 4 for a constant value.
The mathematical model for calculating the pulse permeability of rock samples based on the experimental data is shown in eq 4:14
| 4 |
In the formula, k is the permeability of the pulse decay method; c is the compressibility of pore fluid; φ is the core porosity; μ is the fluid viscosity; L is the length of the rock sample; and S is the slope of pressure difference p and time t of the upper and downstream chambers of the pulse permeameter tested in the monologarithmic coordinate graph; a and b are respectively the ratio of pore volume of the rock sample to upper and downstream chamber volume of the pulse permeability meter. When a = b = 1, f(a, b) =1.71.
4.2.3. NMR Method
The research instrument used in this paper is the RecCore 2500 low-field nuclear magnetic resonance instrument from the Institute of Percolation and Fluid Mechanics, Chinese Academy of Sciences, Langfang, China. Figure 12 shows the flow chart of the NMR test experiment; the main experimental steps are as follows:
-
(1)
First, drill one or two representative standard cores with a diameter of 2.5 cm from the full-diameter core, wash the oil-bearing core, and dry it.
-
(2)
Then, the core is vacuumed at 80 °C for 12 h.
-
(3)
The core is pressurized with saturated kerosene for 24 h.
-
(4)
The saturated core was detected by the NMR T2 attenuation spectrum, and the data were processed.
-
(5)
A high-speed centrifugal test was carried out with 3 MPa centrifugal force, and the BVI was calculated by weighing and the NMR test again.
Figure 12.

Flow chart of the NMR test experiment.
Acknowledgments
Our work was supported by study on characteristics of salt solution and salt plugging during fracturing flowback of inter-salt shale reservoir (Grant 33550000-20-FW2099-0155).
The authors declare no competing financial interest.
References
- Zou C. N.; Pan S. Q.; Jing Z. H.; Gao J. L.; Yang Z.; Wu S. T.; Zhao T. Shale oil and gas revolution and its influence. Acta Petrol. Sin. 2020, 41, 1–12. [Google Scholar]
- Pan Z.; Ma Y.; Danesh N.N.; Connell L. D.; Samder R.; Down D. I.; Camilleri M.. Measurement of shale anisotropic permeability and its impact on shale gas production. SPE Asia Pacific Unconventional Resources Conference and Exhibition. 2015.
- Gensterblum Y.; Ghanizadeh A.; Cuss R. J.; Amann-Hidenbrand A.; Zoback M. D. Gas transport and storage capacity in shale gas reservoirs - A review. Part A: transport processes. J. Unconv. Oil Gas Resour. 2015, 12, 87–122. 10.1016/j.juogr.2015.08.001. [DOI] [Google Scholar]
- Sander R.; Pan Z.; Connell L. D. Laboratory measurement of low permeability unconventional gas reservoir rocks: A review of experimental methods. J. Nat. Gas Sci. Eng. 2017, 37, 248–279. 10.1016/j.jngse.2016.11.041. [DOI] [Google Scholar]
- Carles P.; Egermann P.; Lenormand R.; Lombard J.. Low permeability measurements using steady-state and transient methods. In International symposium of the SCA 2007.
- Sun J. C.; Yang Z. M.; Guo H. K.; Xiao Q. H.; Hao M. X.; Xuan X. U. Comparative study of tight reservoir permeability using steady-state and unsteady-state methods. Rock Soil Mech. 2013, 34, 1010–1016. [Google Scholar]
- Sandra P.; Gerald H.; Benjamin N. Low-permeability measurements: insights. Petrophysics 2016, 57, 30–40. [Google Scholar]
- Gensterblum Y.; Ghanizadeh A.; Krooss B. M. Gas permeability measurements on australian subbituminous coals: fluid dynamic and poroelastic aspects. J. Nat. Gas Sci. Eng. 2014, 19, 202–214. 10.1016/j.jngse.2014.04.016. [DOI] [Google Scholar]
- Malkovsky V. I.; Zharikov A. V.; Shmonov V. M. New methods for measuring the permeability of rock samples for a single-phase fluid. Izv. Phys. Solid Earth. 2009, 45, 89–100. 10.1134/S1069351309020013. [DOI] [Google Scholar]
- Li S.; Dong M.; Li Z. Measurement and revised interpretation of gas flow behavior in tight reservoir cores. J. Pet. Sci. Eng. 2009, 65, 81–88. 10.1016/j.petrol.2008.12.017. [DOI] [Google Scholar]
- Klinkenberg L. J.The permeability of porous media to liquids and gases. American Petroleum Institute Drilling and Production-Practice. 1941.
- Liu J. N.; Qin J. S.; Wu X. D. Experimental study on the effect of temperature on rock permeability. J. Univ. Pet., China, Ed. Nat. Sci. 2001, 25, 51–53. [Google Scholar]
- Brace W. F.; Walsh J. B.; Frangos W. T. Permeability of granite under high-pressure. J. Geophys. Res. 1968, 73, 2225–2236. 10.1029/JB073i006p02225. [DOI] [Google Scholar]
- Dicker A. I.; Smits R. M. A practical approach for determining permeability from laboratory pressure-pulse decay measurement. Soc. Pet. Eng. J. 1988, 87, 285–292. 10.2118/17578-MS. [DOI] [Google Scholar]
- Jones S. C. A technique for faster pulse-decay permeability measurements in tight rocks. SPE Form. Eval. 1997, 12, 19–26. 10.2118/28450-PA. [DOI] [Google Scholar]
- Rushing J. A.; Newsham K. E.; Lasswell P. M.; Cox J. C.; Blasingame T. A.. Klinkenerg-Corrected Permeability Measurements in Tight Gas Sands: Steady-State Versus Unsteady-State Techniques. SPE Annual Technical Conference and Exhibition. 2004.
- Kumar H.; Elsworth D.; Mathews J. P.; Marone C. Permeability evolution in sorbing media: analogies between organic-rich shale and coal. Geofluids. 2016, 16, 43–55. 10.1111/gfl.12135. [DOI] [Google Scholar]
- Wang Y.; Xiaochun L. I.; Wei N. Experimental study of storage-variable transient pulse method for permeability measurement. Chin. J. Rock Mech. Eng. 2010, 29, 3113–3121. [Google Scholar]
- Seevers D. O.A nuclear magnetic method for determining the permeability of sandstones. Trans. SPWLA Annu. Logging Symp. 1966.
- Timur A. An investigation of permeability, porosity and residual water saturation relationships. Log Anal. 1968, 9, 8–17. [Google Scholar]
- Kenyon W. E. Petrophysical principles of applications of NMR logging. Log Anal. 1997, 38, 21–40. [Google Scholar]
- Chen Y. L.Study of microscopic pore structure characterization and digital core model of gas shale. Southwest Pet. Univ: Chengdu, 2016. [Google Scholar]
- Rios E. H.; Ramos P.; Machado V.; Stael G. C.; Azeredo R. Modeling rock permeability from NMR relaxation data by PLS regression. J. Appl. Geophys. 2011, 75, 631–637. 10.1016/j.jappgeo.2011.09.022. [DOI] [Google Scholar]
- Xu H.; Fan Y.; Hu F.; Li C.; Yu J.; Liu Z. Characterization of pore throat size distribution in tight sandstones with nuclear magnetic resonance and high-pressure mercury intrusion. Energies 2019, 12, 1528. 10.3390/en12081528. [DOI] [Google Scholar]
- Mao Z. Q.; Xiao L.; Wang Z. N. Estimation of permeability by integrating nuclear magnetic resonance(NMR)logs with mercury injection capillary pressure(MICP)data in tight gas sands. Appl. Magn. Reson. 2013, 44, 449–468. 10.1007/s00723-012-0384-z. [DOI] [Google Scholar]
- Kenyon W. E.; Day P. I.; Straley C.; Willemsen J. F. A Three-Part Study of NMR Longitudinal Relaxation Properties of Water-Saturated Sandstones. SPE Form. Eval. 1988, 3, 622–636. 10.2118/15643-PA. [DOI] [Google Scholar]
- Zhou S.; Xue H.; Guo W.; Li X. A new nuclear magnetic resonance permeability model of shale of Longmaxi Formation in southern Sichuan Basin. J. Univ. Pet., China, Ed. Nat. Sci. 2016, 40, 56–61. 10.3969/j.issn.1673-5005.2016.01.008. [DOI] [Google Scholar]
- Yang Y.; Zou W.; Zhang H.; Wu X. Recognitions on the flow mechanism of shale during the plug pulse decay measurement. Nat. Gas Ind. 2019, 39, 71–78. 10.1016/j.ngib.2019.05.005. [DOI] [Google Scholar]