We read with interest the recently published paper by Gerner-Smidt et al. (1) critically evaluating two commercial software packages (the BioImage system and the Molecular Analyst Fingerprinting Plus system [MAFP]; Bio-Rad) in relation to their ability to compare discriminate populations of Listeria monocytogenes on the basis of electrophoretic data. We would like to comment on some aspects of the comparison of banding patterns from different gels and the critical relevance of the band-linking procedure.
Since electrophoretic mobility of bands is scarcely reproducible in different experiments, even with the highest degree of standardization (2), comparison of patterns from different runs can be performed either by transforming migration data into molecular weights (BioImage) or by varying the gel picture scale in order to align the bands of the same internal standard present in all gels (MAFP). In our opinion, the latter procedure involves linear variation of the lane dimensions, not necessarily proportional to the actual migration dynamics of each band in agarose gels.
In order to produce evidence to support our opinion, we ran a 100-bp ladder (New England Biolabs, Beverley, Mass.) in two lanes on the same gel for 60 and 90 min. Migration data measured with NIH-Image 1.62 software (National Institutes of Health, Bethesda, Md.) were transformed (Kaleida Graph 3.08 program; Synergy Software) into molecular weights by regression analysis using migration data (distances from the well) and the known molecular weight of the standard.
The normalization procedure suggested by MAFP was reproduced by graphically aligning the well line and the 100-bp bands of the 60- and 90-min images. The average variability within gels run for the same time was 1.82% (standard error [SE] = 0.60), while the comparison of 60- and 90-min runs displayed a 9.21% (SE = 1.13) variability.
These data show that the linear modification of gel length suggested by the manufacturers of the MAFP software, producing a fivefold increase in the level of error, is not a completely legitimate operation. However, it is possible to control the accuracy of the alignment by asking MAFP to calculate and then compare the molecular weights of the bands of each standard in the merged gels.
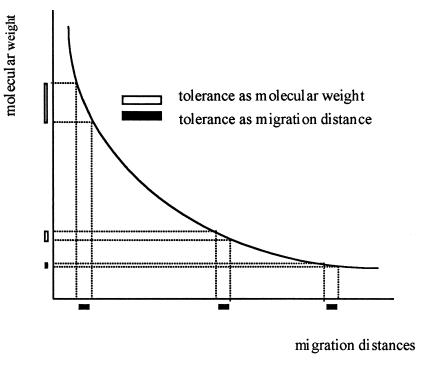
Another misleading characteristic of the MAFP software is that corresponding bands from different lanes of the same gel are linked to each other by using a tolerance value expressed in pixels. As a matter of fact, since the relationship between migration (expressed in pixels) and molecular size (expressed in base pairs) is not necessarily linear, the same tolerance gives rise to larger molecular weight differences in the upper part of the gel. This is particularly important in pulsed-field gel electrophoresis (PFGE) gels, where the regression curves between migration distances (x axis) and molecular weights (y axis) exhibit hyperbolic shapes (Fig. 1).
FIG. 1.
Calibration curve between molecular size (kilobases) and migration distance (pixels) of a chromosomal DNA resolved in a PFGE gel of a standard strain.
The above observations suggest that the application of algorithms based only on migration distances, besides yielding data which are de facto inaccessible for comparison to the scientific community, requires further elaborations by other systems.
REFERENCES
- 1.Gerner-Smidt P, Graves L M, Hunter S, Swaminathan B. Computerized analysis of restriction fragment length polymorphism patterns: comparative evaluation of two commercial software packages. J Clin Microbiol. 1998;36:1318–1323. doi: 10.1128/jcm.36.5.1318-1323.1998. [DOI] [PMC free article] [PubMed] [Google Scholar]
- 2.van Belkum A, van Leeuwen W, Kaufmann M E, Cookson B, Forey F, Etienne J, Goering R, Tenover F, Steward C, O’Brien F, Grubb W, Tassios P, Legakis N, Morvan A, El Solh N, de Ryck R, Struelens M, Salmenlinna S, Vuopio-Varkila J, Kooistra M, Talens A, Witte W, Verbrugh H. Assessment of resolution and intercenter reproducibility of results of genotyping Staphylococcus aureus by pulsed-field gel electrophoresis of SmaI macrorestriction fragments: a multicenter study. J Clin Microbiol. 1998;36:1653–1659. doi: 10.1128/jcm.36.6.1653-1659.1998. [DOI] [PMC free article] [PubMed] [Google Scholar]


