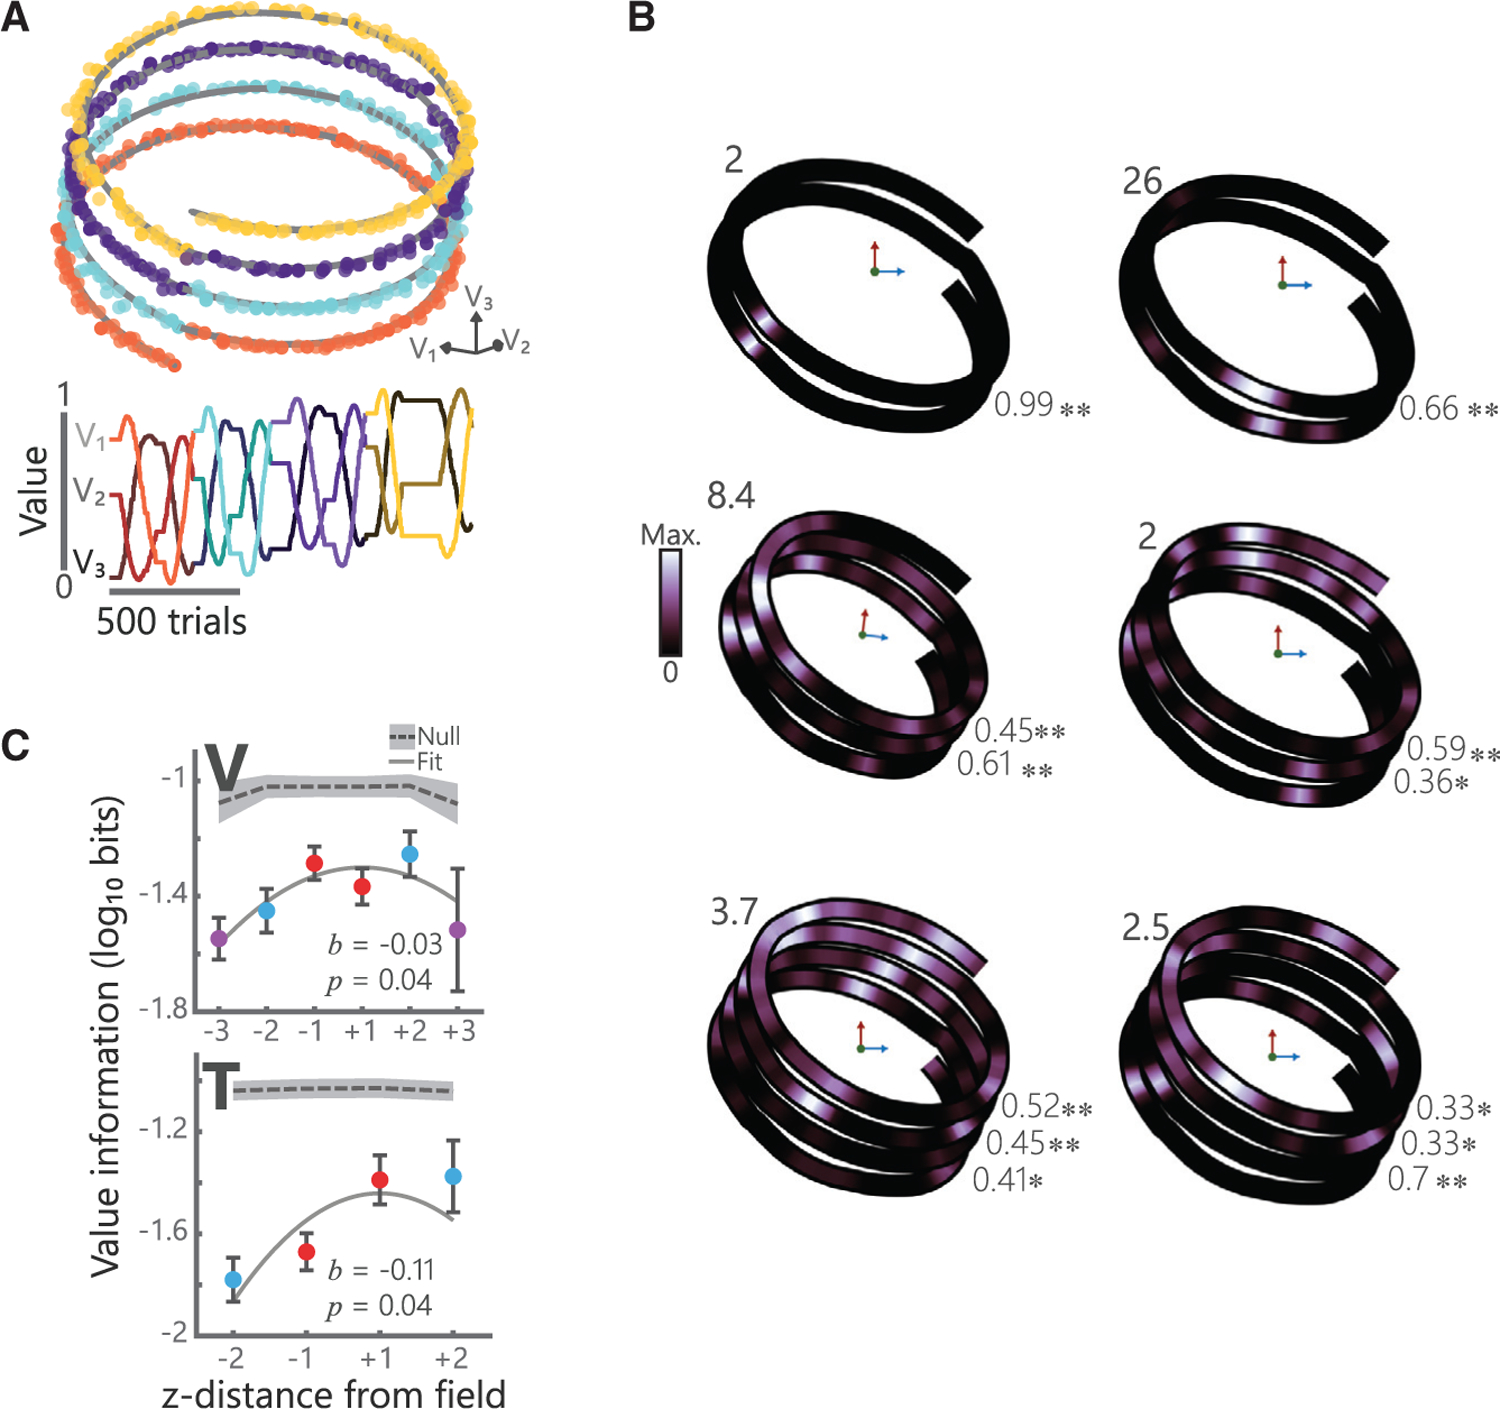
Figure 3. Value place neurons map the extent of three-dimensional value space.

(A) Example helical trajectory from a session where subject V performed 4 loops of the helix. Convention follows Figure 2A.
(B) Single neuron examples showing value place fields in three dimensions for sessions where subjects completed two (left), three (middle), or four (right) loops of the helix. Numbers in the upper left of each plot denote the maximum firing rate of that neuron. Numbers in the bottom right of each plot denote spatial correlations between adjacent loops for each neuron (*p < 0.01, **p < 1 3 10‒6).
(C) Spatial information of value place fields in three dimensions. For each neuron, 0 was defined as the location with the maximum spatial information and the information content for prior and subsequent loops is illustrated (mean ± SEM). A quadratic fit of log-transformed spatial information, I, by z-distance (lnI = b0 + b1[z-distance]2) was significant in both subjects. Gray shading indicates null distributions derived from applying the same procedure to shuffled data (250 shuffles, 95% confidence interval shown).
See also Figures S1, S2, S3, and S4.
