

SUMMARY
The development of precision medicine approaches for diffuse large B cell lymphoma (DLBCL) is confounded by its pronounced genetic, phenotypic, and clinical heterogeneity. Recent multiplatform genomic studies revealed the existence of genetic subtypes of DLBCL using clustering methodologies. Here, we describe an algorithm that determines the probability that a patient’s lymphoma belongs to one of seven genetic subtypes based on its genetic features. This classification reveals genetic similarities between these DLBCL subtypes and various indolent and extranodal lymphoma types, suggesting a shared pathogenesis. These genetic subtypes also have distinct gene expression profiles, immune microenvironments, and outcomes following immunochemotherapy. Functional analysis of genetic subtype models highlights distinct vulnerabilities to targeted therapy, supporting the use of this classification in precision medicine trials.
INTRODUCTION
Initial progress toward a molecular diagnosis of DLBCL subtypes came with the advent of gene expression profiling, which was used to define two prominent “cell-of-origin” (COO) subtypes comprising 80%–85% of cases, termed germinal center B cell-like (GCB) and activated B cell-like (ABC), with the remaining cases declared “unclassified” (Alizadeh et al., 2000; Rosenwald et al., 2002). This classification accounted for some of the heterogeneity in the clinical outcome following R-CHOP (rituximab plus cyclophosphamide, doxorubicin, vincristine, and prednisone) chemotherapy (Alizadeh et al., 2000; Lenz et al., 2008a; Rosenwald et al., 2002). This COO methodology has proved useful in understanding the varied responses of patients with diffuse large B cell lymphoma (DLBCL) to targeted therapies such as ibrutinib, an inhibitor of B cell receptor (BCR) signaling (Wilson et al., 2015b). Nonetheless, the COO distinction does not fully account for the heterogeneous responses and outcomes following either R-CHOP therapy or targeted therapy. This is likely because gene expression profiling provides a phenotypic description of cancers rather than a genetic description that encompasses tumor pathogenesis more directly.
While recurrent genetic aberrations in individual genes have elucidated oncogenic mechanisms in DLBCL, progress toward a genetic classification of DLBCL tumors required the integration of genomic data from multiple analytic platforms to identify genes that were recurrently altered by mutations, translocations, and/or copy-number alterations (Chapuy et al., 2018; Schmitz et al., 2018). Mathematically distinct clustering methods were used to assort DLBCL tumors into genetic subtypes that are characterized by genomic aberrations in subtype-specific hallmark genes. The potential clinical utility of this genetic classification was evident by the association of the subtypes with outcome following R-CHOP therapy.
Many clustering methods are limited by the necessity to place a tumor sample into no more than one subtype and by the fact that the subtype assignment of a particular tumor can vary when different tumors are included during the clustering process. Such methods are therefore not appropriate in clinical settings where molecular diagnoses are required in real time for individual tumors. We have therefore developed an algorithm to classify an individual patient’s tumor based on the probability of belonging to a particular genetic subtype, allowing for the possibility that the tumor may have acquired more than one genetic program during its evolution.
RESULTS
Development of the LymphGen Genetic Subtype Classifier
We created the LymphGen algorithm to provide a probabilistic classification of a tumor from an individual patient into a genetic subtype. We define a genetic subtype as a group of tumors that is enriched for genetic aberrations in a set of subtype predictor genes. These subtype predictor genes are identified by considering each possible combination of genetic aberrations (i.e., mutations, copy-number alterations, or fusions) as a separate genetic “feature” and scoring a tumor as positive for a feature if one or more of its genetic aberrations is observed. LymphGen uses the presence or absence of each subtype predictor feature to provide a probability that a tumor belongs to the subtype.
To implement LymphGen in DLBCL, we first needed to define the genetic subtypes to which a tumor could be assigned. For this subtype discovery effort, we used the GenClass algorithm (Schmitz et al., 2018), which begins with several “seed” tumor subsets and iteratively sorts tumors into and out of these seeds, converging on a classification that maximizes the genetic distinctiveness of the resulting subtypes (Figure 1A). First, we chose seeds representing the four previously identified genetic subtypes: MCD (including MYD88L265P and CD79B mutations), BN2 (including BCL6 translocations and NOTCH2 mutations), N1 (including NOTCH1 mutations), and EZB (including EZH2 mutations and BCL2 translocations). Among the remaining cases in our cohort (hereafter “NCI cohort” Schmitz et al., 2018), TP53 was the most frequently mutated gene (25.2%) that was not also significantly enriched in one of the previous subtypes. TP53 inactivation has been previously associated with aneuploidy in DLBCL (Bea et al., 2004; Chapuy et al., 2018; Monti et al., 2012). In the NCI cohort, tumors with a homozygous TP53 deletion (5.9%) or the combination of a heterozygous TP53 deletion and a TP53 mutation (8.7%) had the most aneuploidy, as assessed by the number of gains and losses of chromosomal segments. We therefore formed a seed class of cases with these TP53 features, which we term “A53” (aneuploid with TP53 inactivation). We also observed that mutations in TET2, P2RY8, and SGK1 were recurrently mutated among the genetically unassigned cases (10.1%, 6.9%, and 6.9% of cases, respectively), with the majority (54%) of SGK1 mutations truncating the protein. TET2 mutations were significantly associated with truncating SGK1 mutations (p = 0.001) and with P2RY8 mutations (p = 0.033), leading us to create a second new seed class based on these features, which we term “ST2” (SGK1 and TET2 mutated). Using the six seed classes defined above, the GenClass algorithm assigned 54% of the cases.
Figure 1. Development of the LymphGen Classifier.
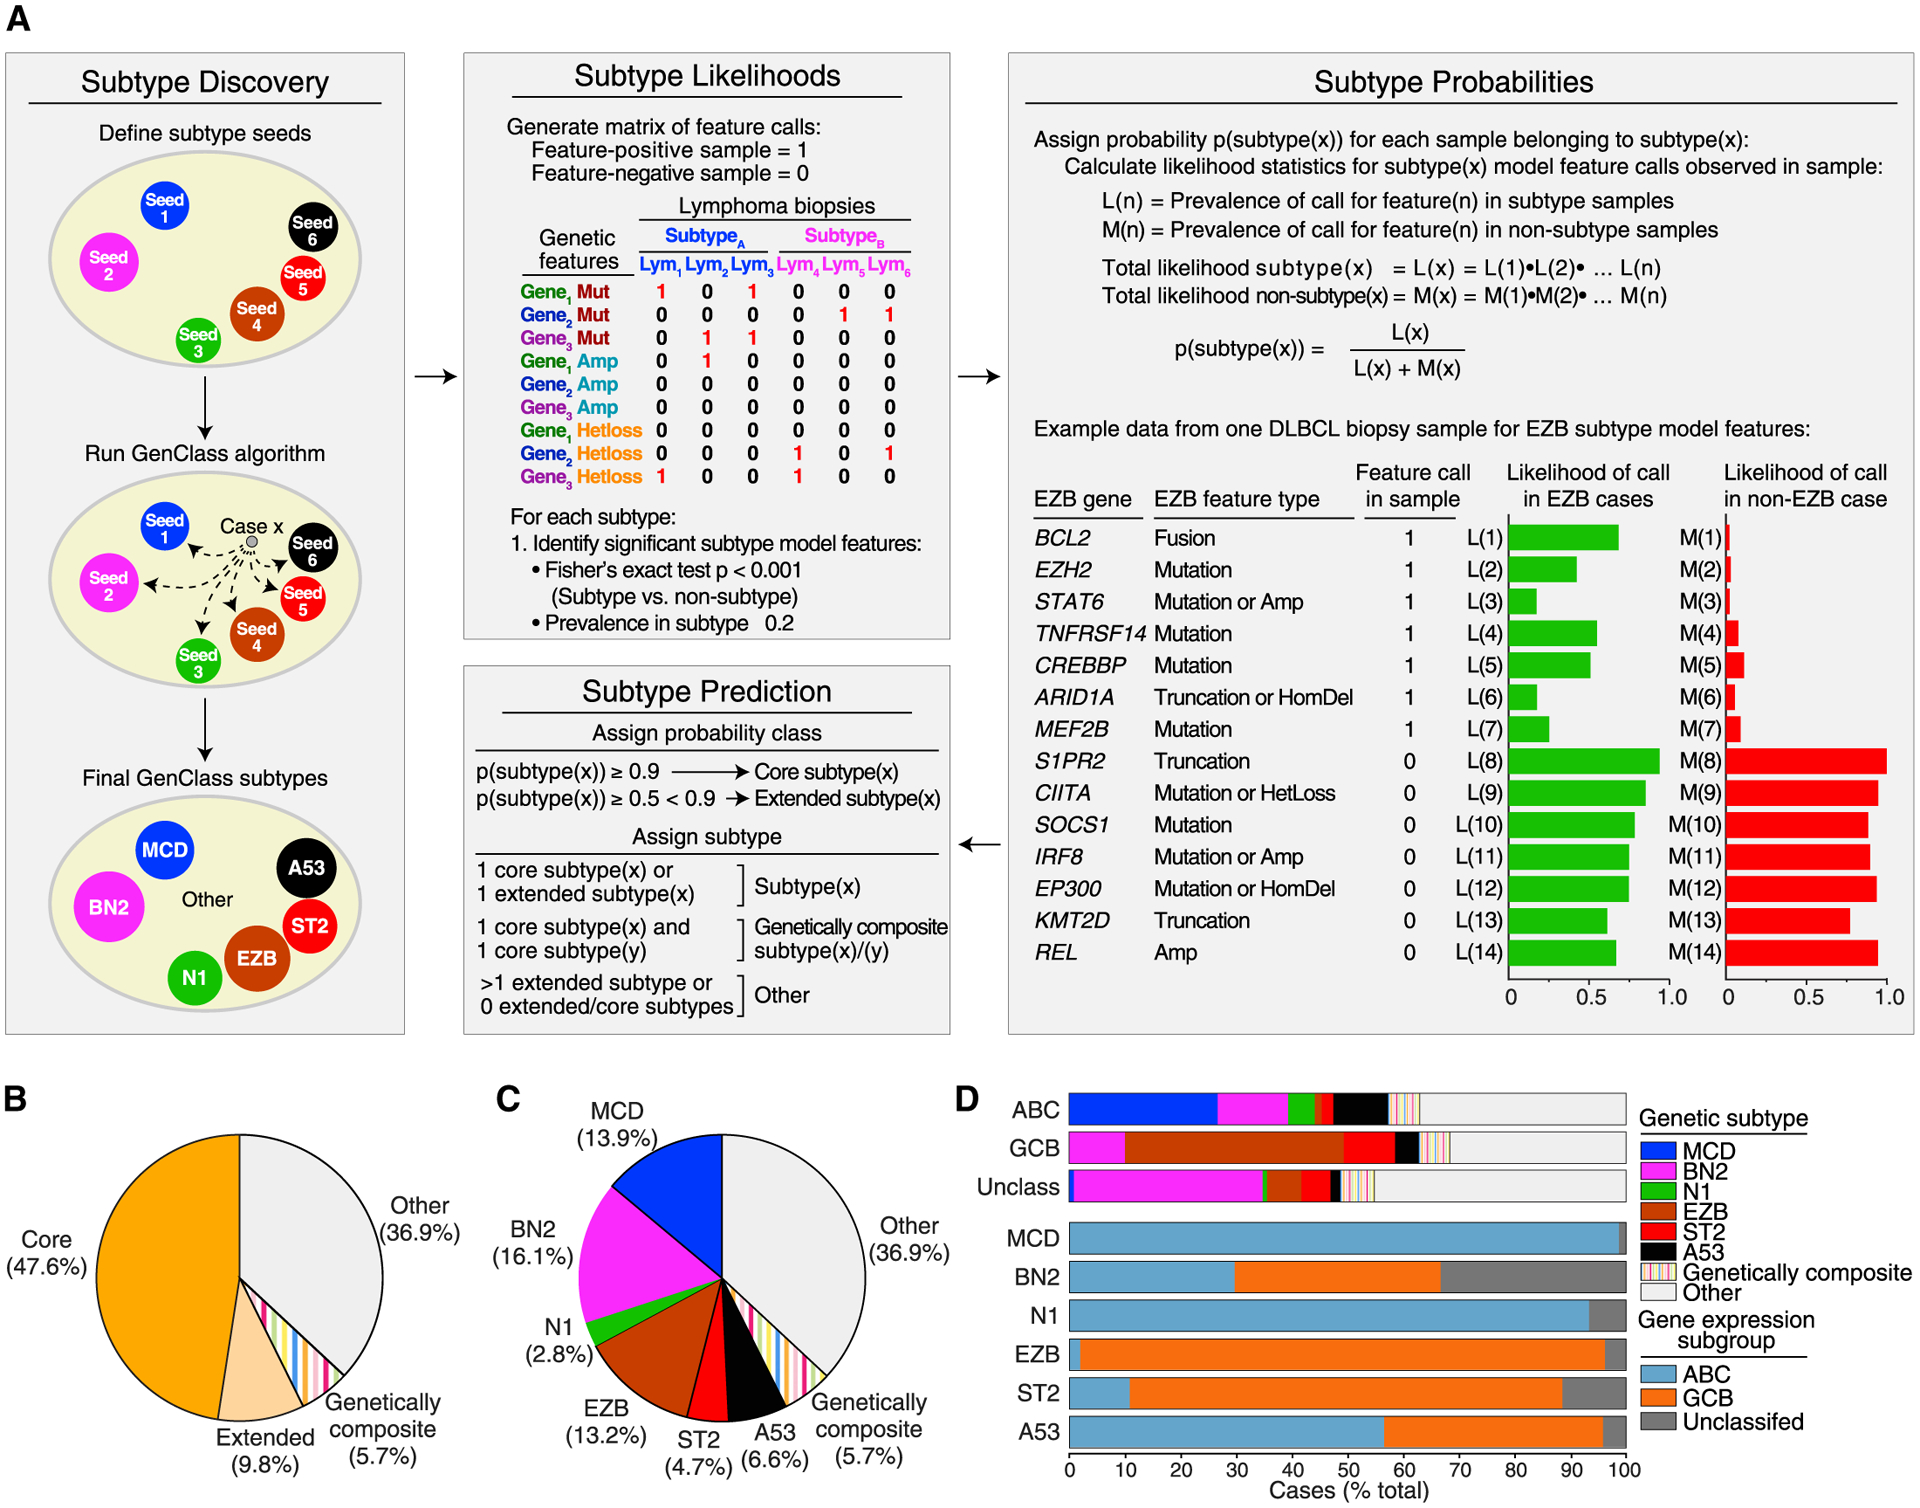
(A) Cancer subtype discovery and prediction using the LymphGen algorithm. Shown at left is the discovery of cancer subtypes starting with “seed” sets of cases using the GenClass algorithm (Schmitz et al., 2018). The LymphGen algorithm uses prevalences of genetic features to estimate the likelihood that a feature is associated with a subtype and combines these likelihoods to calculate a probability that a tumor belongs to a genetic subtype. The example shows features associated with the EZB subtype as present (“1”) or absent (“0”) in an individual tumor sample, and the likelihoods that the tumor is EZB or non-EZB based on each feature. The final panel illustrates how LymphGen assigns a tumor using the subtype probabilities.
(B) Frequency of cases with high probability (“Core”) or moderate probability (“Extended”) subtype assignments, genetically composite cases, and unassigned (Other) cases.
(C) Prevalence of various genetic subtypes.
(D) Top: prevalence of subtypes in DLBCL COO subgroups. Bottom: prevalence of COO subgroups within each genetic subtype.
See also Figure S1.
LymphGen next develops a separate Bayesian predictor model for each GenClass subtype, which determines the probability that a tumor belongs to the subtype based on its genetic features (Figure 1A). The algorithm defines subtype predictor features that distinguish the subtype from all other cases (p ≤ 0.001, Fisher’s exact test, prevalence >0.2) and uses the prevalence of the feature in the subtype and its prevalence in other cases to estimate the likelihood that a tumor with that feature belongs to the subtype. These likelihood estimates are then used in Bayes formula to calculate the probability that an individual tumor belongs to a subtype based on its constellation of genetic features. Thus, for each DLBCL tumor, LymphGen calculates six probabilities, one for each GenClass-defined subtype. We defined tumors with subtype probabilities of >90% or 50%–90% as “core” or “extended” subtype members, respectively. Tumors that were core members of more than one subtype were termed “genetically composite” (Figure S1). In the NCI cohort, the LymphGen algorithm identified 47.6% core cases, 9.8% extended cases, and 5.7% genetically composite cases (Figure 1B). Altogether 329 (63.1%) of the 574 cases in the NCI cohort were classified, which is substantially greater than the 46.6% classified previously (Schmitz et al., 2018) (Figures 1B and 1C). The inability of LymphGen to classify the remaining cases stemmed from three issues: some tumors had a few features characteristic of one or more subtype but not enough to be classified, some had unique features that were not recurrent in DLBCL, and others had very few genetic features at all.
In the resulting genetic taxonomy, each of the DLBCL COO gene expression subgroups included multiple genetic subtypes, with ABC tumors enriched for MCD, GCB tumors enriched for EZB and ST2, and unclassified tumors enriched for BN2 (Figure 1D). Conversely, some genetic subtypes were largely composed of tumors belonging to the same gene expression subgroup (MCD, N1, EZB), while others comprised different gene expression subgroups, with BN2, A53, and ST2 being the most phenotypically diverse.
Genetic Attributes of DLBCL Subtypes
To display the genetic composition of the subtypes, we selected a set of genetic features that were significantly associated with a subtype (p ≤ 0.01) and were present in >10% of the subtype (Figures 2 and S2A). Many subtype-defining mutations are likely due to activation-induced deaminase-dependent somatic hypermutation (Schmitz et al., 2018), which in many cases produced truncating mutations in subtype-specific tumor-suppressor genes (e.g., PRDM1, ETV6, TOX, HLA-A, HLA-B, HLA-C in MCD, TNFRSF14 in EZB, and NFKBIA in ST2).
Figure 2. Genetic Features of DLBCL Genetic Subtypes.
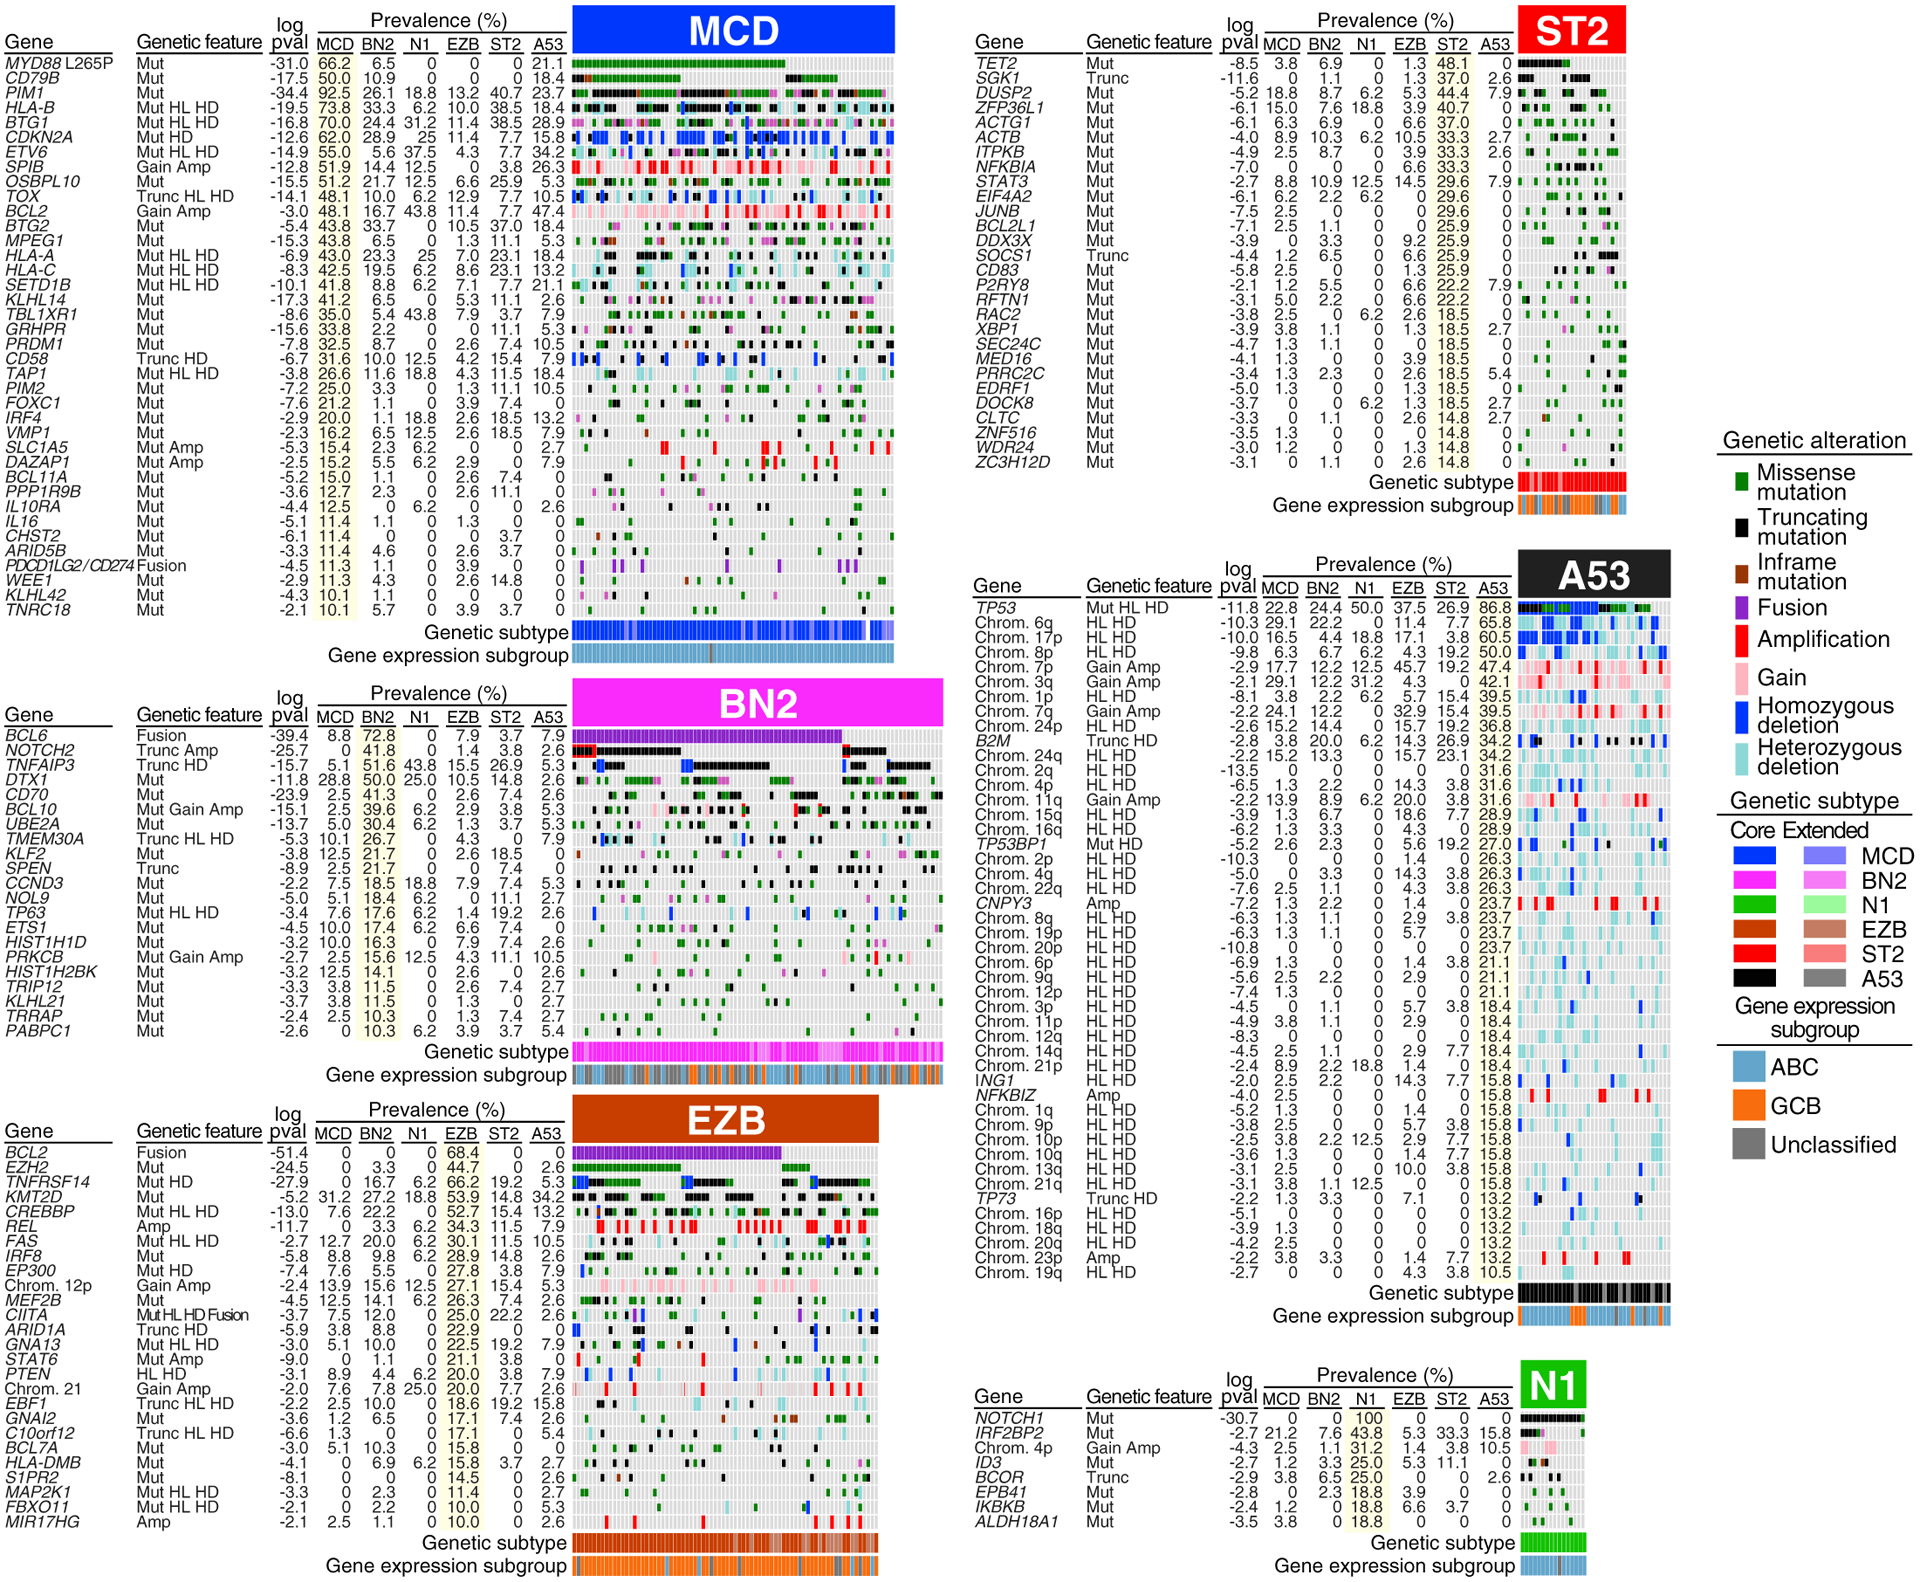
Shown is the prevalence of the indicated genetic features in each DLBCL subtype. Log10 p value (pval) is based on the difference in prevalence in the indicated subtype versus all other samples. HL, heterozygous loss; HD, homozygous deletion; Gain, single-copy gain; Amp, amplification; Mut, mutation; Trunc, protein-truncating mutation: Fusion, chromosomal translocation. See also Figure S2.
MYD88L265P and CD79B mutations, the genetic hallmarks of MCD, cooperatively activate nuclear factor κB (NF-κB) via the My-T-BCR supercomplex involving MYD88, TLR9, and the BCR (Phelan et al., 2018). MCD tumors also frequently delete the CDKN2A tumor-suppressor locus, encoding the cell-cycle inhibitors p16INK4A and p15INK4B as well as p19ARF, which stabilizes p53. The viability of MCD cells is likely sustained by BCL2, which is upregulated epigenetically and by copy number gain/amplification (Figure S2B). Another prominent theme in MCD tumors is immune evasion (see below).
BN2 is characterized by mutations that activate NOTCH2 or inactivate the NOTCH antagonist SPEN in 50% of tumors, 72% of which also have a BCL6 translocation. Mutations targeting components of the BCR-dependent NF-κB pathway (PRKCB, BCL10, TNFAIP3, TNIP1) are also prominent in BN2, suggesting that these tumors rely on this pathway for survival. Interactions with T and natural killer (NK) cells are potentially compromised in BN2 by CD70 deletions. CCND3 mutations likely foster vigorous proliferation in BN2, as in Burkitt’s lymphoma (BL) (Schmitz et al., 2012).
Epigenetic dysregulation is a defining attribute of EZB due to inactivation of several epigenetic regulators (KMT2D, CREBBP, EP300, ARID1A, IRF8, MEF2B, EBF1) and mutational activation of EZH2 (Mlynarczyk et al., 2019; Pasqualucci and Dalla-Favera, 2018). Inactivation of the S1PR2/GNA13 pathway in EZB alters GC B cell migration and signaling (Muppidi et al., 2014). Phos-phatidylinositol 3-kinase (PI3K) signaling in EZB is promoted by inactivating mutations and deletions of PTEN and MIR17HG amplification (Pfeifer et al., 2013). Recurrent REL amplification may deregulate EZB metabolism and growth, as in normal GC B cells (Heise et al., 2014).
Several genetic lesions in EZB potential perturb their interaction with T follicular helper (TFH) cells. Major histocompatibility complex (MHC) class II expression and function in EZB may be compromised by EZH2 activation (Ennishi et al., 2019b) and inactivation of CIITA (Steidl et al., 2011) and HLA-DMB (Denzin and Cresswell, 1995), potentially modulating interactions between lymphoma cells and TFH cells. The survival of EZB lymphoma cells that inactivate herpesvirus entry mediator (TNFRSF14) may be enhanced by TFH-mediated CD40 signaling (Mintz et al., 2019). STAT6 mutations may modulate the ability of TFH-derived interleukin-4 (IL-4) to promote plasma cell differentiation (Weinstein et al., 2016).
ST2 is named for its recurrent SGK1 and TET2 mutations. ST2 tumors acquire TET2 truncating mutations suggesting a tumor-suppressor function, as in mouse GC B cell lymphomagenesis (Dominguez et al., 2018). The majority of SGK1 mutations are truncating, suggesting a tumor-suppressor function that may involve PI3K signaling, since SGK1 is an AKT-family kinase (Di Cristofano, 2017). JAK/STAT signaling is likely promoted in ST2 by inactivation of SOCS1 (Linossi and Nicholson, 2015), inactivation of DUSP2 (Lu et al., 2015), and by known STAT3-activating mutations (Y640F, D661Y) (Crescenzo et al., 2015). Inactivating mutations in ST2 targeting P2RY8 and its signaling mediator GNA13 prevent responses to S-geranylgeranyl-L-glutathione, which spatially confines normal GC B cells and inhibits their AKT activity (Lu et al., 2019). Finally, some ST2 tumors apparently activate NF-κB by inactivating IκBα (NFKBIA) (Baeuerle and Baltimore, 1988).
A53 is characterized by TP53 mutations and deletions. A53 tumors also acquire homozygous deletions and mutations targeting 53BP1 (TP53BP1), a DNA-damage sensor that prevents aneuploidy (Celeste et al., 2002), consistent with the recurrent gains and losses of chromosome arms in A53. Some A53 abnormalities have been previously associated with ABC DLBCL, including: deletion of 6q, harboring the tumor suppressors TNFAIP3 and PRDM1; gain/amplification of 3q (Lenz et al., 2008b); focal amplification of NFKBIZ (Nogai et al., 2013); amplification of CNPY3 (Phelan et al., 2018); and BCL2 amplification. Additional focal deletions target the tumor suppressors p73 and ING1 (Tallen and Riabowol, 2014). Finally, A53 tumors frequently delete or mutationally inactivate β2-microglobulin (B2M), providing a mechanism of escape from immune surveillance (Challa-Malladi et al., 2011).
N1 is characterized by gain-of-function NOTCH1 mutations, similar to those in chronic lymphocytic leukemia and mantle cell lymphoma. These tumors additionally acquire mutations targeting B cell differentiation regulators (ID3, BCOR) and IκB kinase β (IKBKB), including the V203I isoform that constitutively activates NF-κB (Cardinez et al., 2018).
Relationship of DLBCL Genetic Subtypes to Other Lymphoid Malignancies
While DLBCLs typically present clinically in lymph nodes and other immune tissues, primary extranodal lymphomas present as tumors involving various non-lymphoid organs. Primary extranodal lymphomas frequently acquire MYD88L265P and/or CD79B mutations as well as other MCD-defining mutations (Figures 3A, 3B, and S3B). Notably, in the NCI cohort, MCD DLBCL tumors spread secondarily to extranodal sites in 30% of cases, and 46% of these occurred at sites that can give rise to primary extranodal lymphomas—the central nervous system (CNS), vitreo-retina, testis, and breast—whereas other DLBCL subtypes spread to these sites significantly less often (Figure 3C). Primary extranodal lymphomas often arise in the CNS, ocular vitreo-retina, and testis, all considered “immune-privileged” sites because they tolerate allografts and permit only selective access by immune cells (Shechter et al., 2013). In this regard it is notable that 72.5% of MCD tumors acquire homozygous deletions, truncating mutations, or translocations that could allow them to evade immune surveillance by several mechanisms including (1) reduced antigen presentation due to MHC class I or TAP1 inactivation, (2) decreased T cell activation due to gene fusions that elevate expression of CD274 and PDCD1LG2, encoding PD-L1 and PD-L2, respectively, and (3) diminished NK activation due to CD58 inactivation (Challa-Malladi et al., 2011) (Figures 3D and S3A).
Figure 3. Similarities of DLBCL Genetic Subtypes to Other Lymphoid Malignancies.
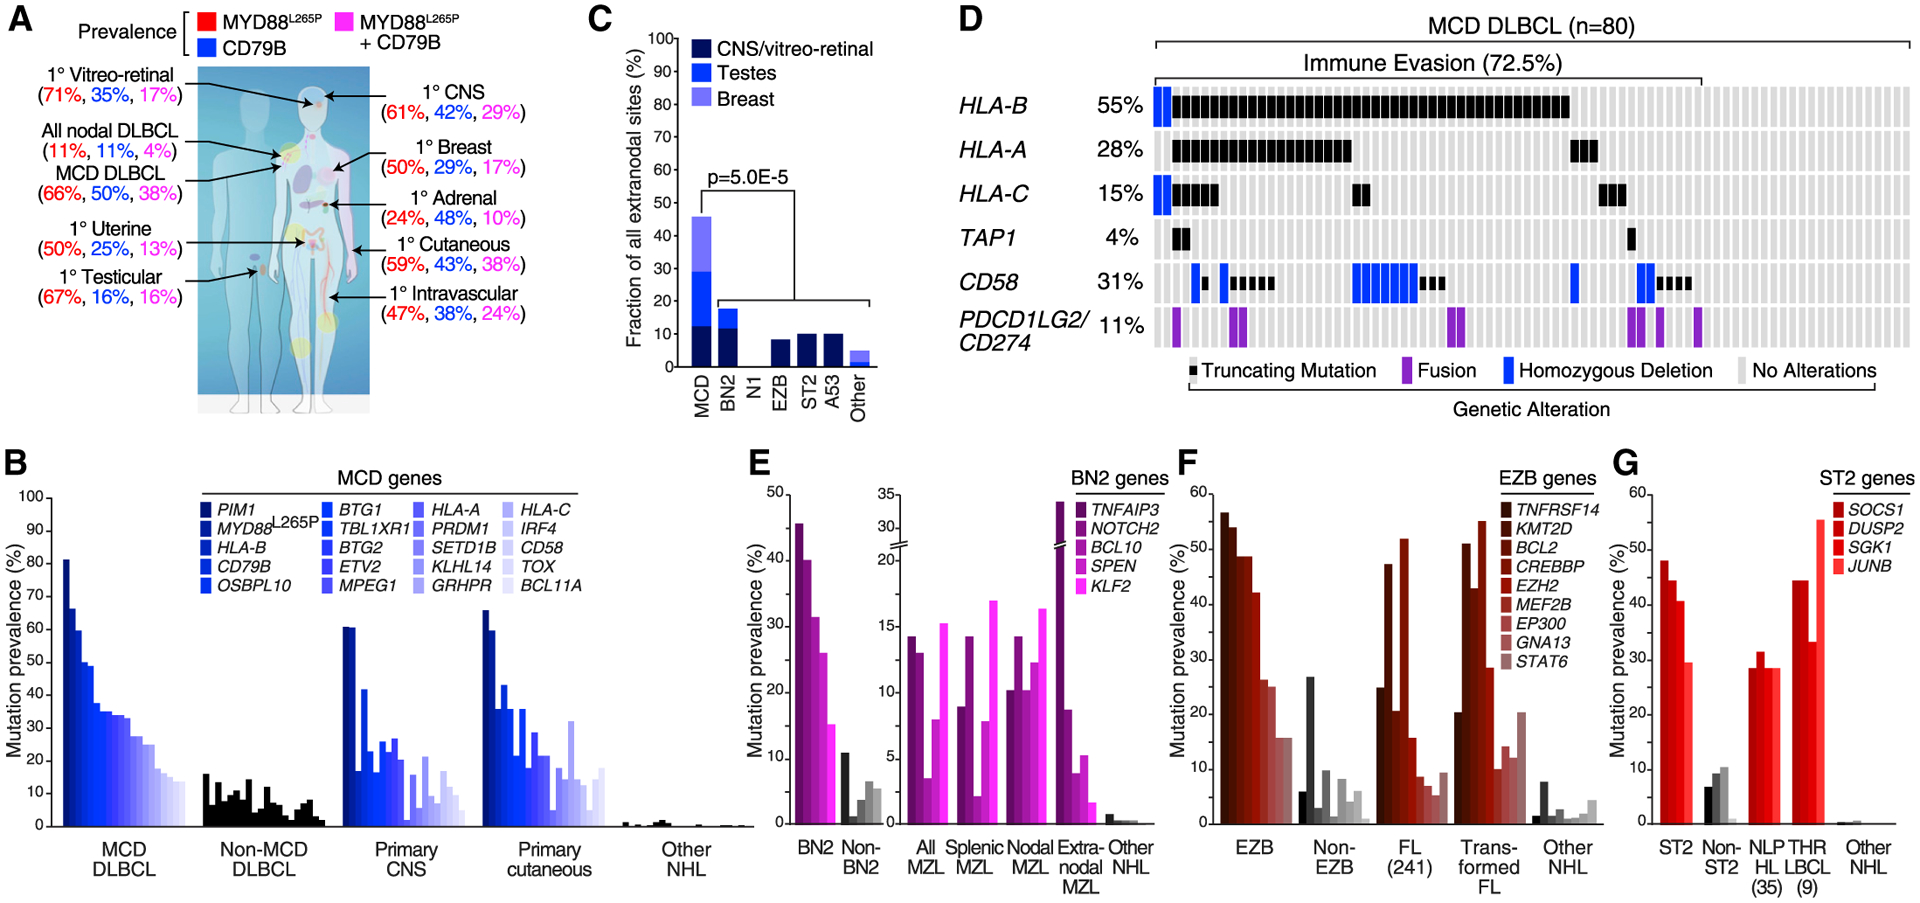
(A) Prevalence of CD79B and MYD88L265P mutations in the indicated nodal and extranodal forms of DLBCL, shown according to the color code above. The percent prevalence of tumors with the indicated genotypes in each of the indicated lymphoma types is shown according to the color code.
(B) Prevalence of MCD-defining mutations in primary CNS lymphoma and primary cutaneous lymphoma. Other NHL, other non-Hodgkin lymphomas (see STAR Methods).
(C) Secondary extranodal involvement in genetic subtypes of DLBCL. p Value is based on Fisher’s exact test,
(D) Genetic aberrations favoring immune escape in MCD DLBCL.
(E) Prevalence of BN2-defining mutations in the indicated types of marginal-zone lymphoma (MZL) and in other NHLs.
(F) Prevalence of EZB-defining mutations in follicular lymphoma (FL), transformed FL, and other NHLs.
(G) Prevalence of ST2-defining mutations in nodular lymphocyte-predominant Hodgkin lymphoma (NLPHL), T cell/histiocyte-rich large B cell lymphoma (THRLBCL), and other NHLs.
See also Figure S3.
Genetic aberrations of several DLBCL subtypes reveal potential pathogenetic relationships with more indolent lymphomas. Mutations characteristic of BN2 link this subtype to marginal-zone lymphomas (MZLs) (Figure 3E), befitting the essential role of NOTCH2 in the differentiation of follicular B cells to marginal zone B cells (Saito et al., 2003). BCL6 translocations, which characterize BN2, are rare in indolent MZLs but common in MZLs that have transformed into aggressive large cell variants (Flossbach et al., 2011; Ye et al., 2008). Follicular lymphoma (FL) shares many genetic lesions with EZB (Figure 3F), as does transformed FL, which can histologically resemble DLBCL. The genetic signature of ST2 betrayed an intriguing similarity with two histologically distinct lymphomas, nodular lymphocyte-predominant Hodgkin lymphoma (NLPHL) and T cell histiocyte-rich large B cell lymphoma (THRLBCL) (Figure 3G). NLPHL is an indolent Hodgkin lymphoma variant that retains expression of GC B cell genes and can transform into an aggressive large cell form (Timens et al., 1986). Morphological similarities between NLPHL and THRLBCL led pathologists to suspect a link between these entities, which was reinforced by shared mutations in SOCS1, DUSP2, SGK1, and JUNB, all characteristic of ST2 (Hartmann et al., 2016; Schuhmacher et al., 2019).
Validation of the LymphGen Classification
To evaluate the reproducibility of the LymphGen algorithm in identifying genetic subtypes of DLBCL, we used it to assign tumors from two validation cohorts to genetic subtypes (Figure S4A and Table S1). The first cohort (n = 304) was used previously to identify DLBCL subtypes (denoted “Harvard”) and was analysed for exomic mutations, copy number in selected genomic regions, and BCL2/BCL6 rearrangements (Chapuy et al., 2018). A second cohort (n = 332) was used previously to identify signatures of poor prognosis in DLBCL (denoted “BCC”) and was analyzed here for mutations in 82 lymphoma-associated genes as well as for whole-genome copy-number aberrations (Table S2) (Ennishi et al., 2019a).
Because each of the DLBCL cohorts had different data types available, we designed LymphGen to function using various combinations of mutational data (whole-exome or gene panel resequencing), copy-number data (regional or whole genome), and rearrangement data for BCL2 and BCL6. Given the robust performance of LymphGen with varying genetic inputs (Figure S4B), we have implemented LymphGen for general research use at https://llmpp.nih.gov/lymphgen/index.php.
To compare the LymphGen-assigned subtypes between the cohorts, we first normalized the cohorts to be equivalent to a population-based DLBCL cohort with respect to overall COO composition (Scott et al., 2015), given the relationship between COO and the genetic subtypes. In these normalized cohorts, the prevalences of the gene subtypes were roughly comparable (Figure 4A), as were their COO compositions (Figure 4B). Moreover, in the Harvard cohort, each LymphGen subtype was drawn predominantly from a single genetic “cluster,” as defined previously (Chapuy et al., 2018), with a 75% overall agreement between the analytic methodologies (Figure S4C).
Figure 4. Validation of the LymphGen Classification.
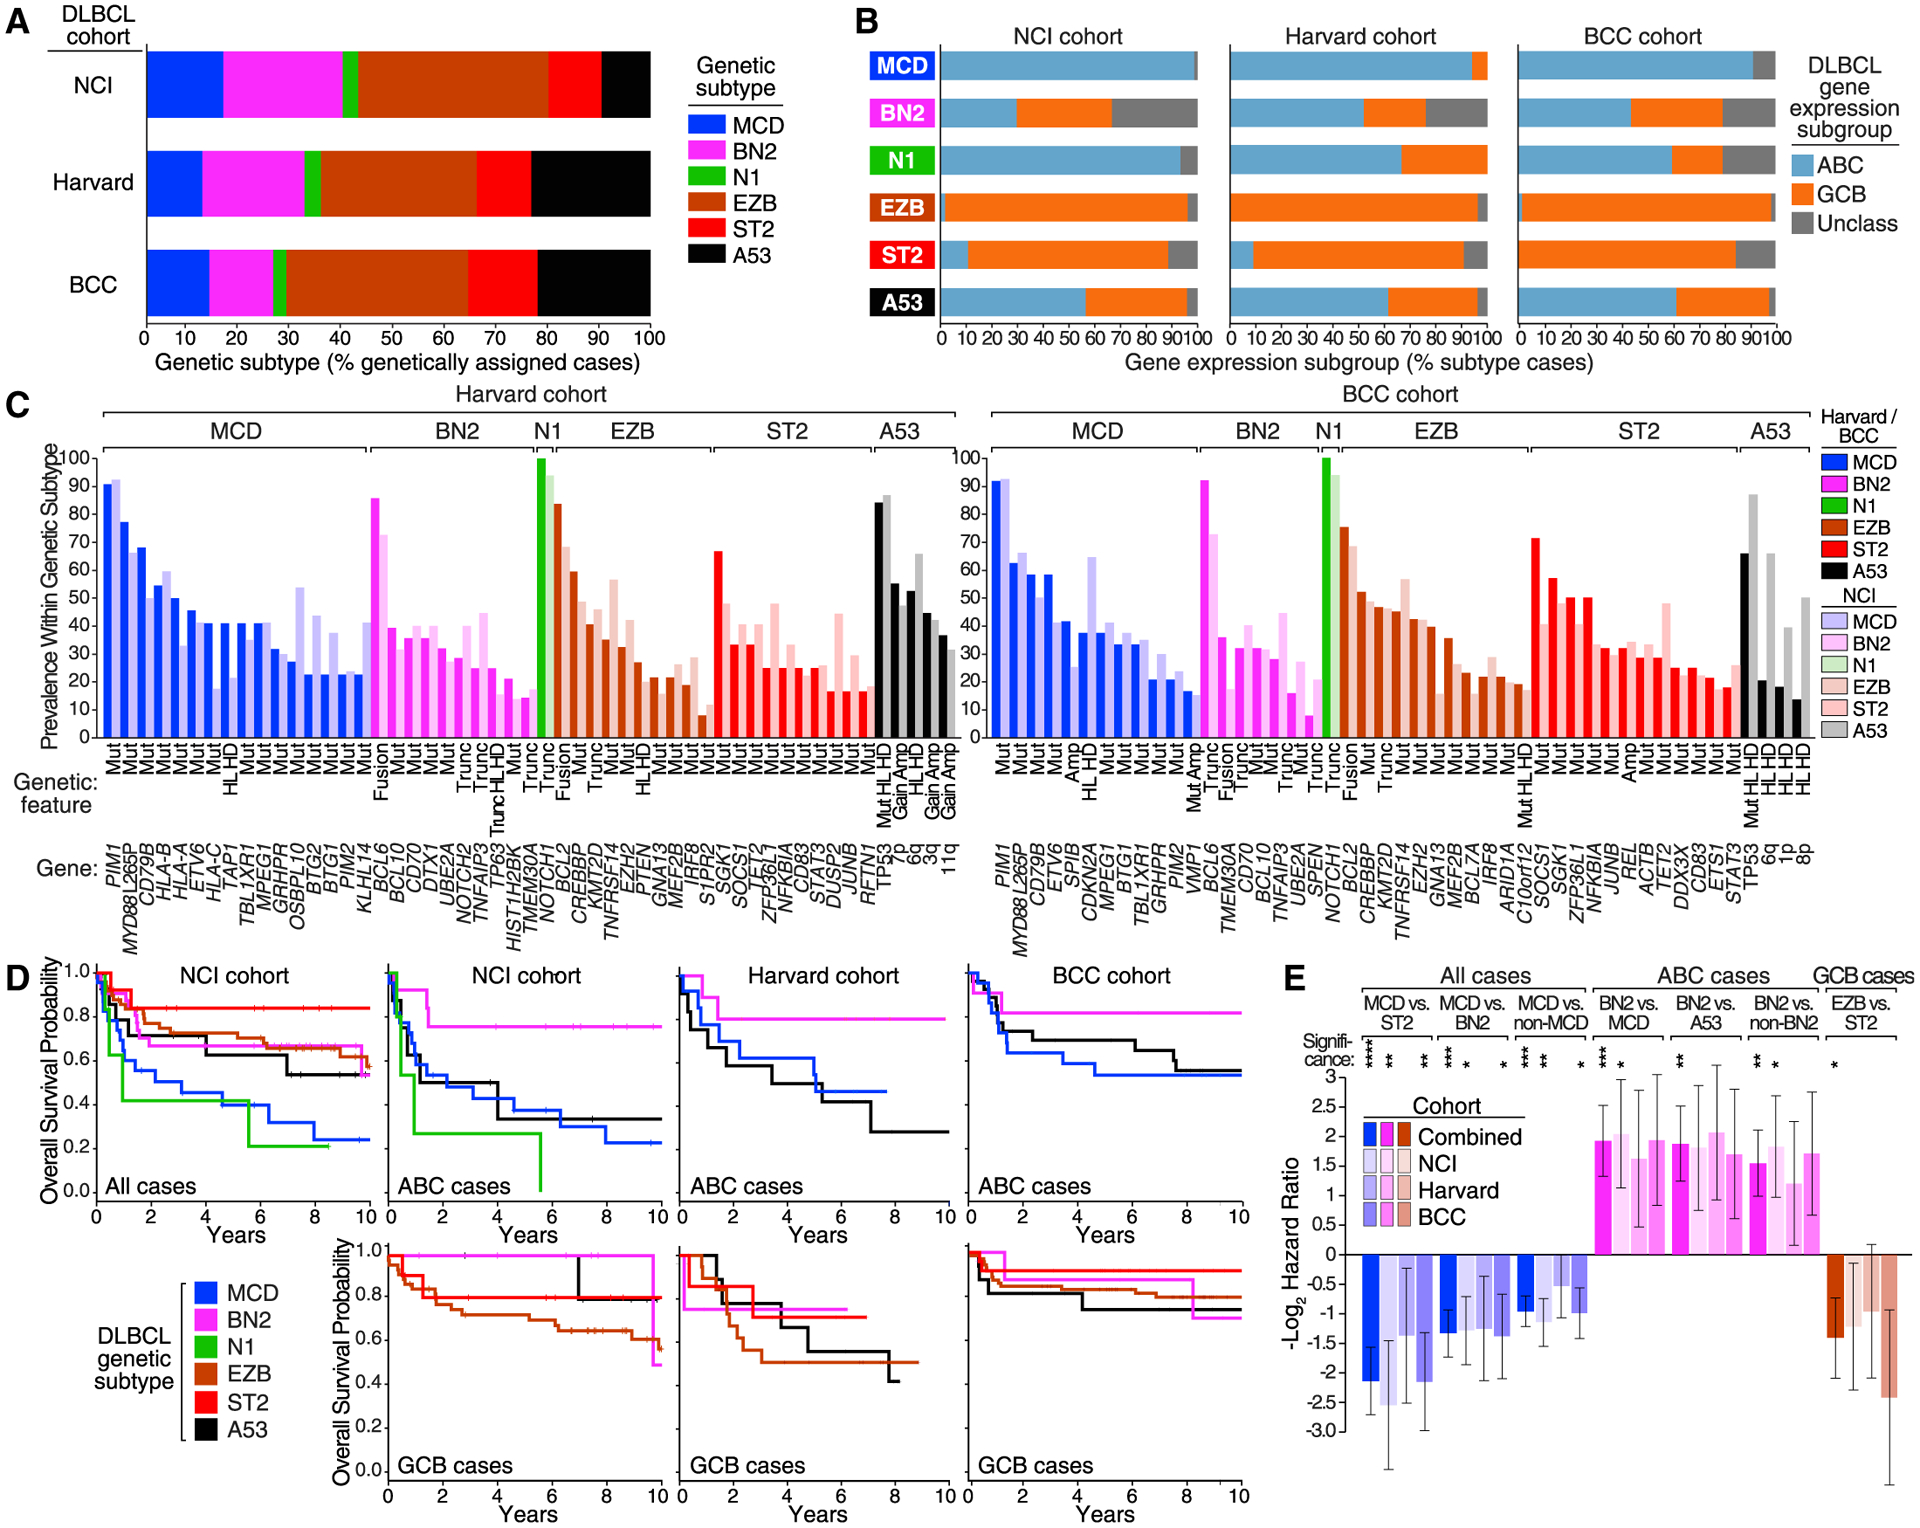
(A) Prevalence of DLBCL subtypes classified by LymphGen.
(B) Prevalence of COO subgroups within genetic subtypes.
(C) Prevalence of the indicated genetic features within the genetic subtypes defined in the Harvard and BCC cohorts in comparison with the NCI cohort.
(D) Kaplan-Meier plots of overall survival within the indicated DLBCL cohorts, in all cases, ABC cases, or GCB cases, as indicated.
(E) Hazard ratios (−log2 transformed) for the indicated comparisons between LymphGen subtypes in the indicated DLBCL cohorts. Error bars denote SEM.
Significance: ****p ≤ 0.0001; ***p ≤ 0.001; **p ≤ 0.01; *p ≤ 0.05. See also Figures S4 and S5; Tables S1, S2, and S3.
The genetic features associated with each subtype in the three cohorts were generally comparable in prevalence (Figure 4C). To evaluate this genetic coherence quantitatively, we iteratively computed LymphGen subtype scores based on gene sets in which one subtype-defining genetic feature was left out, and statistically compared the scores between tumors in which the omitted genetic feature was present or absent. By this metric, we observed significant similarity in the genetic coherence of features defining the MCD, BN2, EZB, and ST2 subtypes in the two validation cohorts (p ≤ 6.3 × 10⁻⁷; Table S3); N1 could not be evaluated by this method due to the statistical dominance of NOTCH1 mutations. Since A53 is defined primarily by copy-number alterations and TP53 inactivation, we instead statistically evaluated the relationship between the number of copy-number alterations in each case with TP53 mutations and/or deletion, which again revealed significant genetic similarity between the cohorts (p ≤ 4.4 × 10⁻⁹; Table S3).
We next evaluated the survival of patients assigned to LymphGen subtypes in each cohort. The overall survival characteristics of the cohorts were distinct, most likely reflecting accrual bias (Figure S5A, Table S1). Nonetheless, the genetic subtypes defined in each cohort had similar associations with overall survival, as judged by the Kaplan-Meier method (Figure 4D). Within each cohort, MCD had an inferior survival, especially when compared with ST2 and BN2. Among ABC cases in each cohort, BN2 was favorable, especially when compared with MCD and A53. Among GCB cases, EZB had an inferior survival comparedwith ST2.Given these consistent survival trends, we used data from all three cohorts to estimate joint hazard ratios (Figure 4E). In this model, the survival of MCD was inferior to ST2, BN2, and all non-MCD patients (p < 0.001); the survival of BN2 was favorable compared with MCD, A53, and all non-BN2 patients within ABC (p < 0.01); and the survival of EZB was inferior to ST2 within GCB (p = 0.032).
While the genetic subtypes clearly subdivided the outcomes within the ABC and GCB gene expression subgroups, the reverse was also true. Within BN2 and A53, the COO subgroups had significantly disparate survival characteristics (Figure S5B), demonstrating that tumor genotype and phenotype must both be considered when attempting to understand the response to therapy.
Subtypes of EZB DLBCL with Distinct Genetic, Phenotypic, and Clinical Attributes
Given the recent demonstration that GCB DLBCL can be subdivided into prognostic subtypes by two gene expression signatures (MHG and DHIT), we investigated how this phenotypic distinction was related to the DLBCL genetic subtypes (Ennishi et al., 2019a; Sha et al., 2019). Since these signatures were correlated in the NCI cohort (p = 1.5 × 10⁻¹⁴), we focused on DHIT for simplicity. This signature was initially identified using the subset of GCB tumors that have BCL2 and MYC rearrangements (“double hit”), which are known to have a poor prognosis, but could also identify a larger subset of GCB tumors with an inferior prognosis (Ennishi et al., 2019a).
Using the NCI cohort, we investigated the relationship of DHIT with other gene expression signatures and genetic features. Among GCB cases, EZB had significantly higher DHIT scores than other subtypes (p = 0.002; Figure 5A). Likewise, among 30 GCB tumors classified as DHIT+, the majority (70%) were either EZB or genetically composite cases with features of EZB and A53 (Figure 5B).
Figure 5. Genetic Analysis of the DHIT Signature.
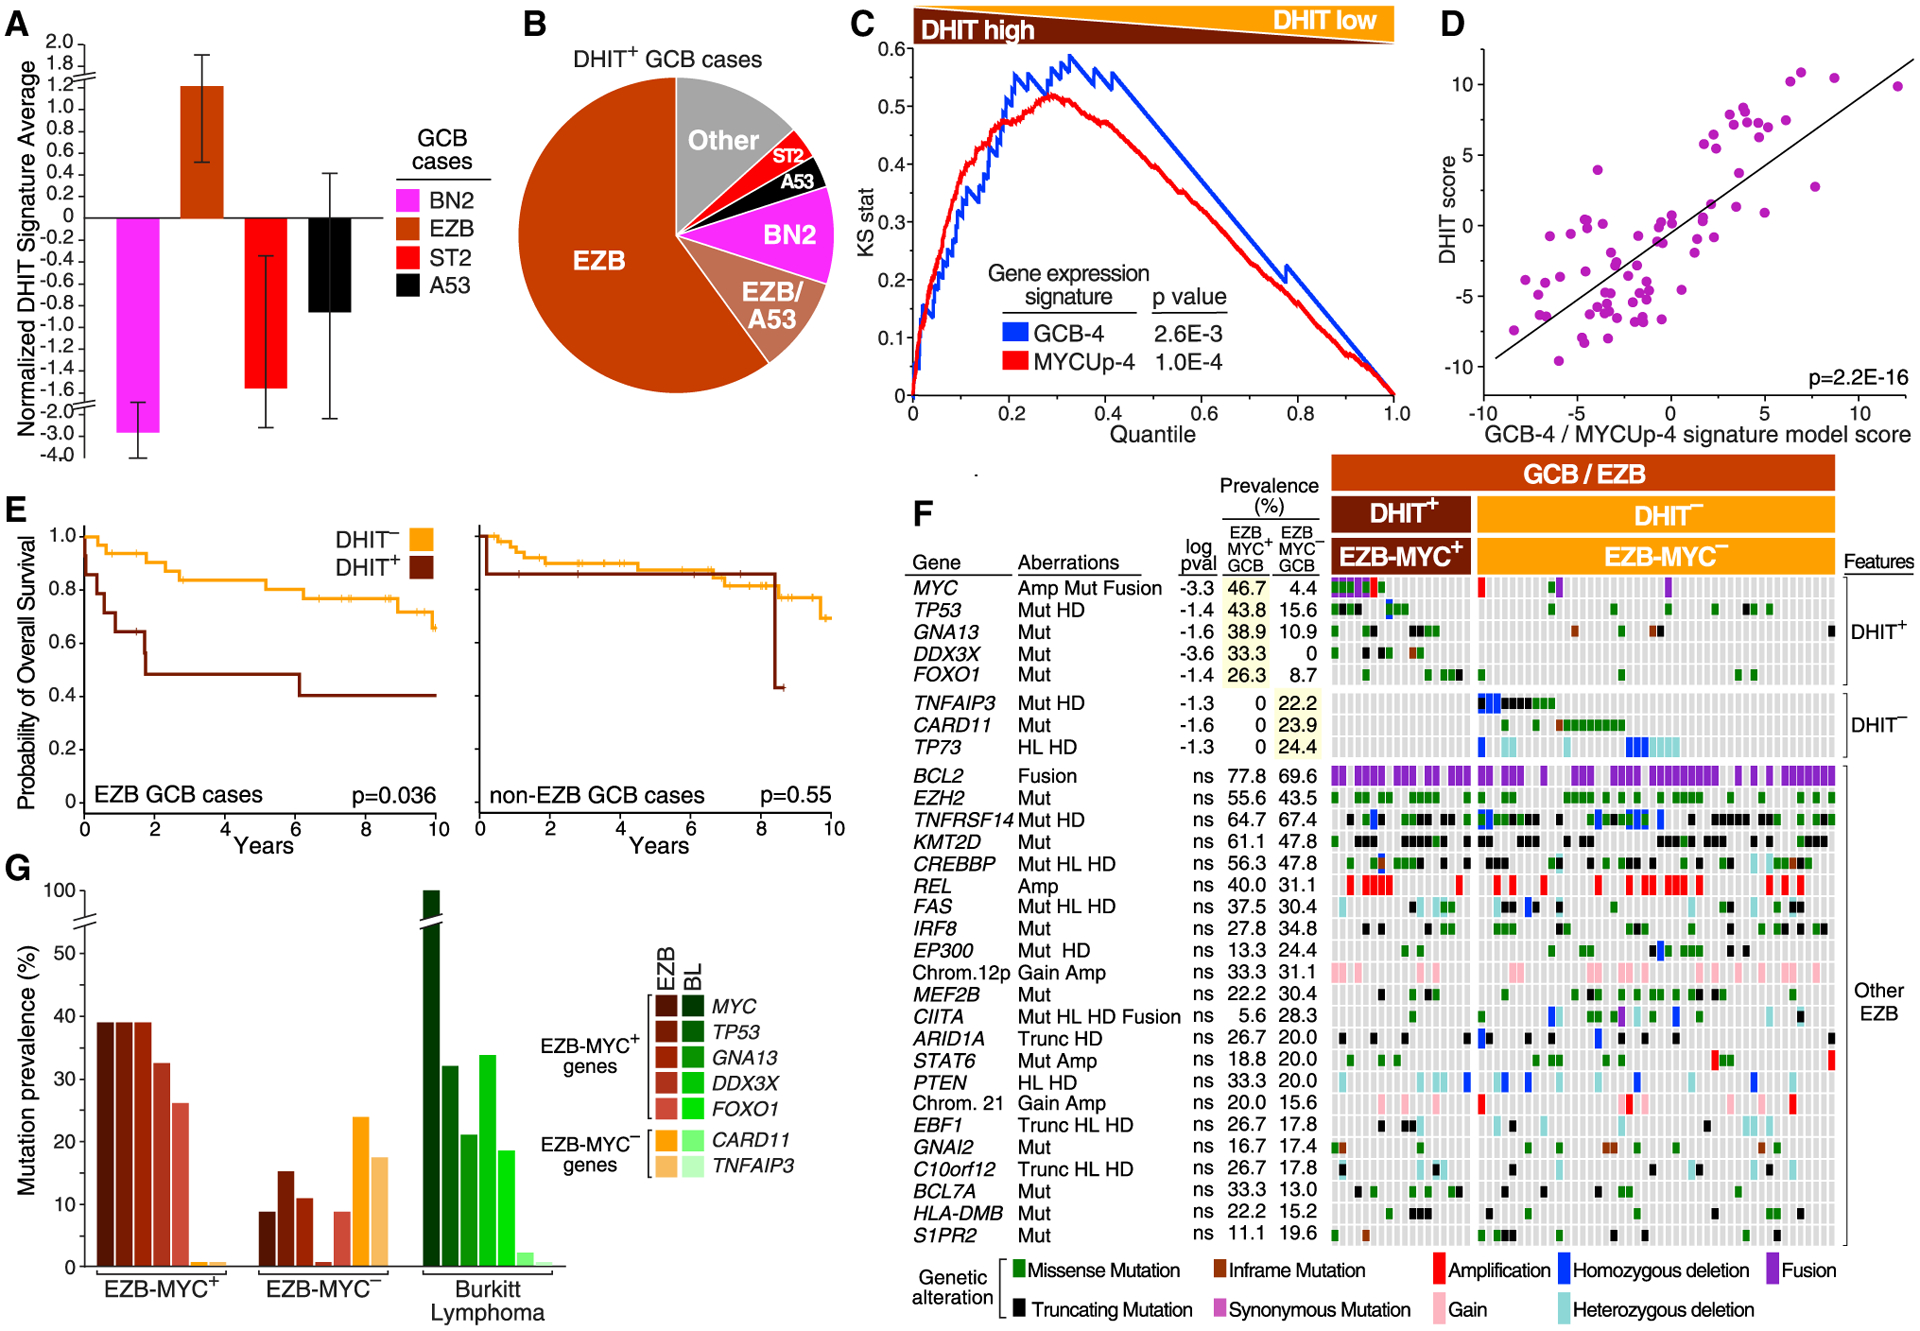
(A) Relative expression of DHIT in the indicated subtypes within GCB DLBCL. Error bars indicate SEM.
(B) Prevalence of subtypes within DHIT+ GCB DLBCL.
(C) Gene set enrichment analysis of DHIT versus the GCB-4 and MYCUp-4 signatures. Cases are ranked by T statistic, with high expression of the DHIT signature to the left. Kolmogorov-Smirnov p values are shown.
(D) Correlation between the DHIT score and a linear model score derived using GCB-4 and MYCUp-4 signature averages. Each dot is an EZB case. A F-test p value with two degrees of freedom is shown.
(E) Kaplan-Meier plots of survival for DHIT+ and DHIT− cases among EZB (left) and non-EZB (right) GCB cases. p Values are calculated using a log rank test.
(F) Genetic features that distinguish EZB-MYC+ (DHIT+) from EZB-MYC− (DHIT−) GCB DLBCL (top two panels), and features shared by EZB-MYC+ and EZB-MYC− (bottom panel). Log10 p value (pval) is based on the difference in prevalence between EZB-MYC+ and EZB-MYC− cases. ns, not significant.
(G) Prevalence of genetic features that distinguish EZB-MYC+ from EZB-MYC− in BL.
The gene expression signatures most correlated with DHIT were two that distinguish BL from DLBCL: the MHG signature and GCB-4, defined as the subset of genes characteristically expressed in normal GC B cells that are expressed more highly in BL than in DLBCL (Dave et al., 2006) (Table S4). Signatures of intermediate- and dark-zone GC B cells were also correlated (GCB-9 and GCB-10, respectively), suggesting that DHIT reflects dynamic changes in GC B cell differentiation. DHIT was also correlated with signatures of MYC activity, notably MYCUp-4, consisting of genes that are induced by MYC and are direct MYC binding targets (Zeller et al., 2006). DHIT also correlated with a signature of adverse survival in DLBCL (Prolif-6) that includes MYC and its target genes GNL3 and NPM3 (Rosenwald et al., 2002).
We therefore hypothesized that DHIT is a composite signature that reflects both GC B cell differentiation and MYC activity. We used GCB-4 and MycUp-4 to represent these phenotypes, given their strong association with DHIT by gene set enrichment analysis (Figure 5C). A linear model combining these signatures was significantly correlated with DHIT (Figure 5D) and accounted for 60.2% of DHIT variance among EZB cases within GCB.
GCB patients with DHIT− tumors had a better survival than those with DHIT+ tumors (Figure S6A), in part reflecting the enrichment among DHIT− cases of the prognostically favorable ST2, BN2, and A53 subtypes. Within the EZB subset of GCB, the survival of DHIT+ was significantly worse than DHIT−, which was not true in the non-EZB subset (Figure 5E), leading us to confine our investigation of DHIT to EZB.
We next explored the association of genetic features with the DHIT+ and DHIT− subsets of EZB GCB cases (Figure 5F). The majority of EZB-defining genetic features were observed comparably in these two subsets with the exception of GNA13 mutations, which were more prevalent among DHIT+ than DHIT− cases (p = 0.025). In keeping with a role for MYC in DHIT+ cases, MYC rearrangements, amplifications, and mutations were significantly enriched in these tumors (p = 0.0079). Mutations or homozygous deletions of TP53 were more than twice as prevalent in DHIT+ than DHIT− cases, while the tumor suppressor DDX3X was mutated in one-third of DHIT+ tumors but never in DHIT− tumors. FOXO1, a transcription factor (TF) that is inactivated by PI3K signaling, was targeted by mutations more than 3 times as often in DHIT+ cases. Conversely, DHIT− cases were significantly enriched in mutations targeting the NF-κB regulators A20 (TNFAIP3) and CARD11, as well as deletions of the tumor suppressor TP73. We were able to use the genetic data to create a probabilistic model of EZB-MYC+ versus EZB-MYC− that could distinguish these subtypes effectively (Figure S6B; permutation p value = 0.004, see STAR Methods). Given the association of MYC abnormalities with DHIT+ EZB cases, we hereafter refer to DHIT+ EZB as “EZB-MYC+” and DHIT− EZB as “EZB-MYC−”.
Genes preferentially mutated in EZB-MYC+ were also frequently mutated in BL whereas those preferentially mutated in EZB-MYC− were not (Figure 5G). However, some genetic aberrations that define BL, such as ID3 and TCF3 mutations (Schmitz et al., 2012), were not observed in EZB-MYC+. Thus, the genetic program adopted by EZB-MYC+ is shared by BL, but these lymphomas are genetically distinct.
Phenotypic Distinctions between Genetic Subtypes
Gene expression signatures offer glimpses into tumor phenotypes that are differentially manifested in DLBCL genetic subtypes (Schmitz et al., 2018). We identified signatures whose average expression was significantly associated with one or more genetic subtypes (Figure 6 and Table S5). The subtypes differed with respect to various malignant attributes, with MCD and EZB-MYC+ highly expressing signatures of proliferation and MYC activity, while N1 instead expressed a signature of quiescence. MYC induces ribosome biogenesis (Dang, 2013) and, accordingly, EZB-MYC+ tumors highly expressed a ribosomal protein signature. Metabolic distinctions between the subtypes included high expression of glycolytic pathway enzymes in ST2, consistent with a Warburg effect, and high expression of lipid synthetic enzymes in EZB-MYC+.
Figure 6. Gene Expression Signature Expression in DLBCL Subtypes.
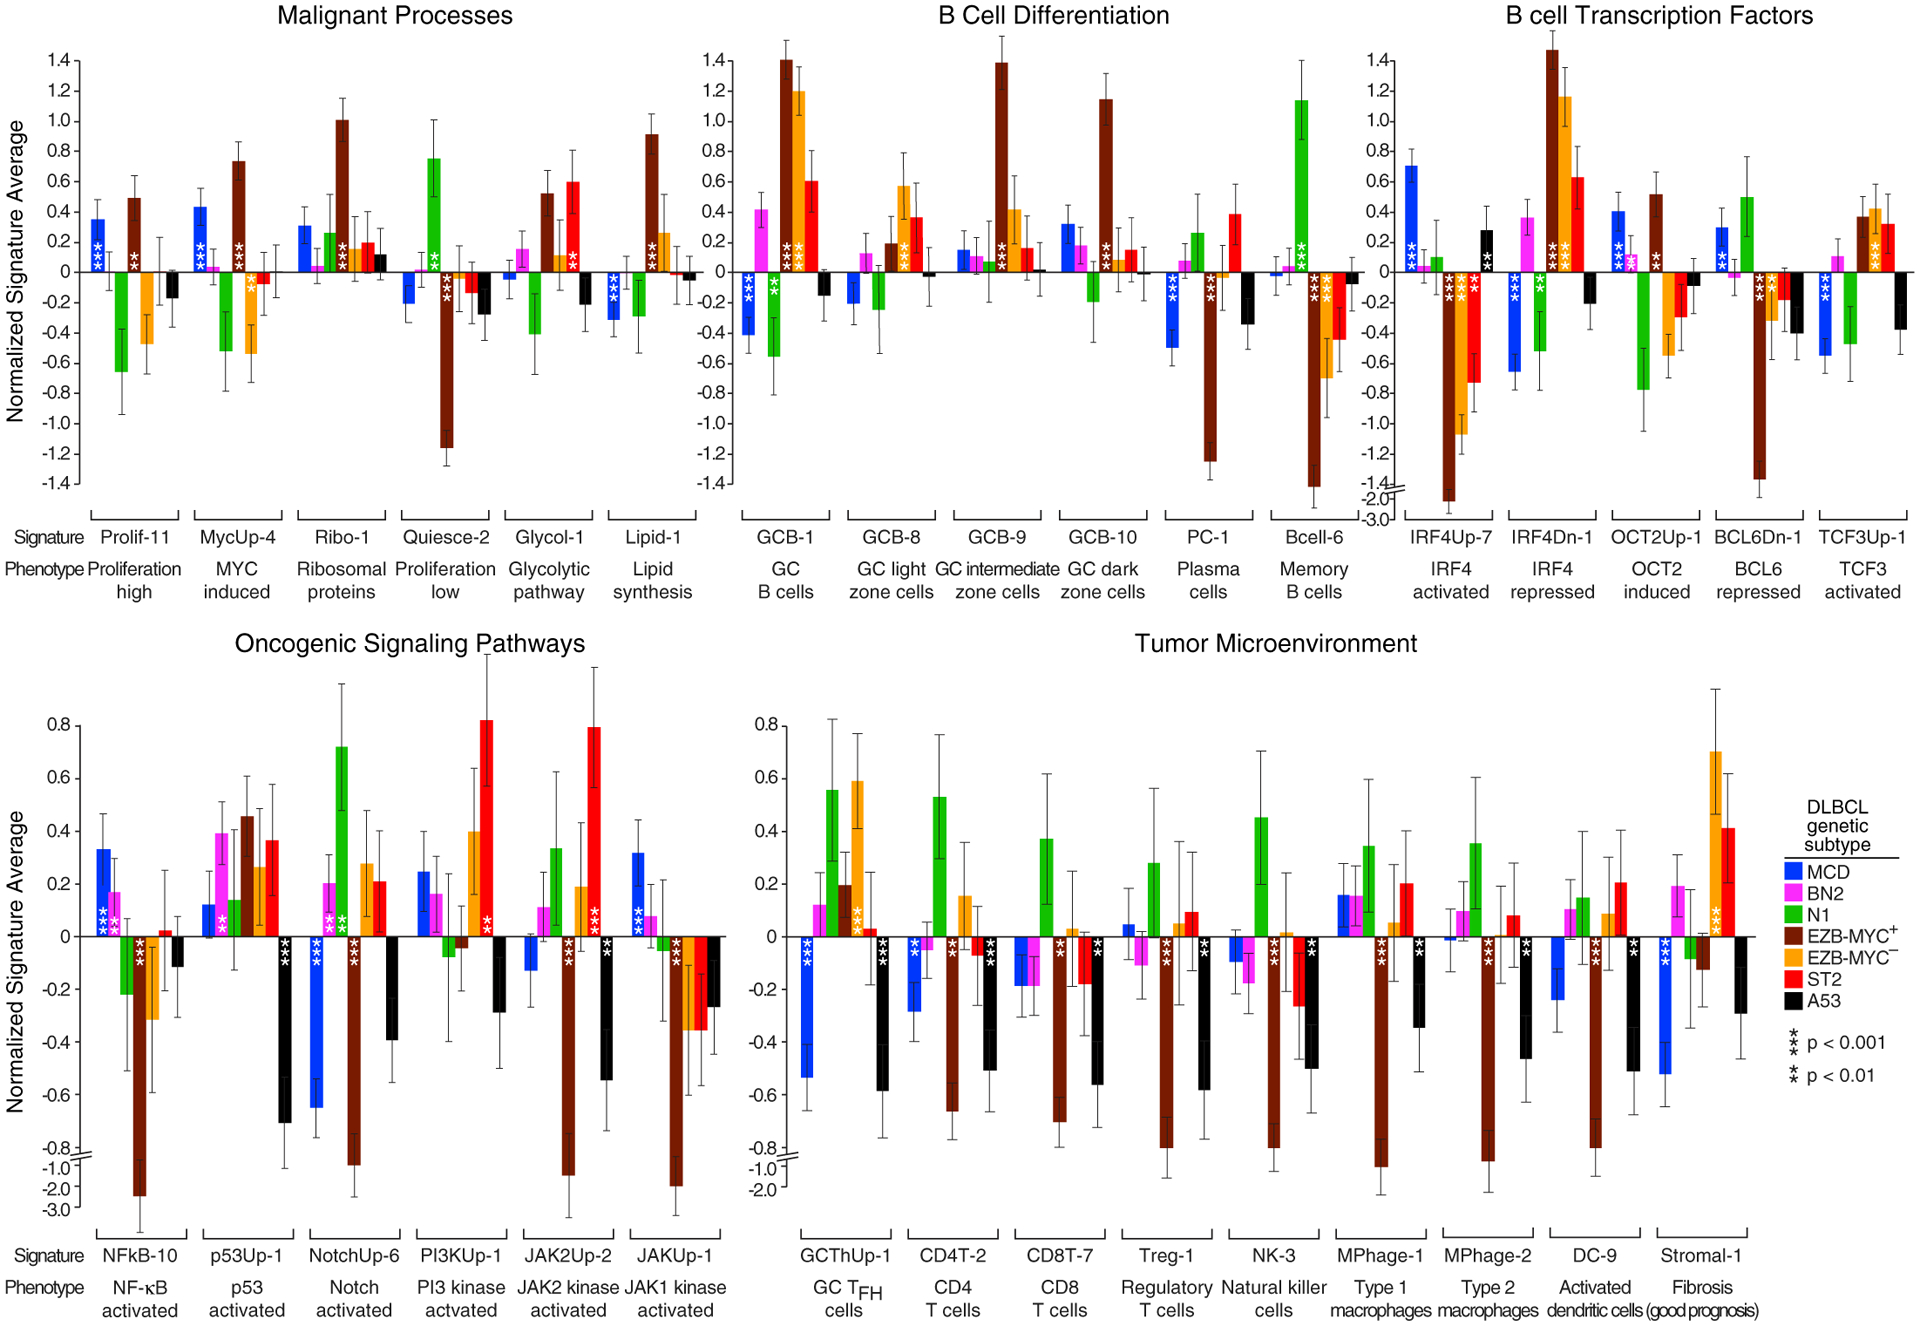
Shown is average log2 expression of signature genes in each subtype versus other DLBCL samples in the NCI cohort. Error bars denote SEM. See also Table S5.
The subtypes appeared to derive from distinct B cell differentiation stages, with a signature of GC B cells characterizing EZB and ST2. EZB-MYC− tumors resembled GC light-zone cells whereas EZB-MYC+ tumors resembled intermediate-zone cells (Milpied et al., 2018), which are likely generated from light-zone cells by MYC expression (Dominguez-Sola et al., 2012). Genes repressed by BCL6 in the GC were lowest in EZB-MYC+ tumors, and genes transactivated by another GC TF, TCF3, were highest in EZB and ST2 tumors.
MCD and N1 lacked GC signature expression, with N1 instead expressing a memory B cell signature (Suan et al., 2017), suggesting a post-GC origin. MCD tumors had high expression of the TFs IRF4 (p = 5.1 × 10⁻⁷) and OCT2 (POU2F2) (p = 1.3 × 10⁻⁴) and their respective target genes. Although both IRF4 and OCT2 promote GC B cell differentiation to plasma cells (Hodson et al., 2016; Sciammas et al., 2006), MCD had low expression of a plasma cell signature, likely due to inactivation of Blimp-1 (PRDM1), which is required for plasma cell differentiation.
NF-κB target genes were highly expressed in MCD but not EZB, as expected (Davis et al., 2001), but were also high in BN2 and ST2. As expected, p53 target genes were lowest in A53 tumors, and NOTCH target genes were significantly upregulated in N1 and BN2. ST2 expressed a signature of PI3K signaling highly, potentially due to SGK1 inactivation, as well as a signature of JAK2 signaling, consistent with SOCS1 and DUSP2 inactivation.
The tumor microenvironments of the subtypes were strikingly discordant: N1 expressed signatures of multiple immune cell types while A53 and EZB-MYC+ tumors were relatively low for all immune signatures. T cell signatures were selectively low in MCD, potentially stemming from defective antigen presentation due to genetic abnormalities or to their high IL10 expression relative to other DLBCLs (p = 1.7 × 10⁻¹¹) (Mittal and Roche, 2015). A GC TFH signature was highest in EZB-MYC− tumors, consistent with their similarity to GC light-zone cells, but was lower in EZB-MYC+ and ST2, despite their GC derivation. The stromal-1 signature, which is prognostically favorable and reflects a fibrotic, macrophage-rich microenvironment (Lenz et al., 2008a), was upregulated in EZB-MYC− and ST2 tumors, befitting their relatively favorable outcomes.
Functional Genomics of DLBCL Genetic Subtypes
We next considered whether the DLBCL genetic subtypes might offer insights into the response to targeted therapy. Many lymphoid malignancies, including DLBCL, respond to BTK inhibitors, which block the transmission of signals from the BCR to NF-κB (Davis et al., 2010). Genetic lesions targeting the BCR pathway are prevalent in DLBCL but are differentially enriched in the genetic subtypes (Figures 7A and 7B). Mutations that activate the BCR subunit CD79B were confined to MCD, BN2, and A53, whereas mutations targeting the CD79A BCR subunit were enriched in EZB, suggesting qualitatively distinct roles of CD79A and CD79B mutations in lymphomagenesis. MCD tumors were enriched in the MYD88L265P mutation, a hallmark of tumors in which the My-T-BCR protein supercomplex activates NF-κB (Phelan et al., 2018). By contrast, BN2 tumors acquired PRKCB, BCL10, and TRAF6 mutations that may promote the formation or function of the CARD11-BCL10-MALT1 (CBM) protein complex, and also frequently acquired mutations inactivating TNFAIP3 (A20) and TNIP, thereby promoting IκB kinase activity. In aggregate, BN2 and MCD had the highest prevalence of genetic lesions altering BCR-dependent NF-κB signaling, while N1 and EZB had the lowest prevalence (Figure 7B). Finally, it is notable that each genetic subtype acquired lesions targeting known negative regulators of proximal BCR signaling, suggesting that BCR signaling has a pervasive influence on lymphomagenesis (Figure 7B).
Figure 7. Functional Genomics Using Models of DLBCL Genetic Subtypes.
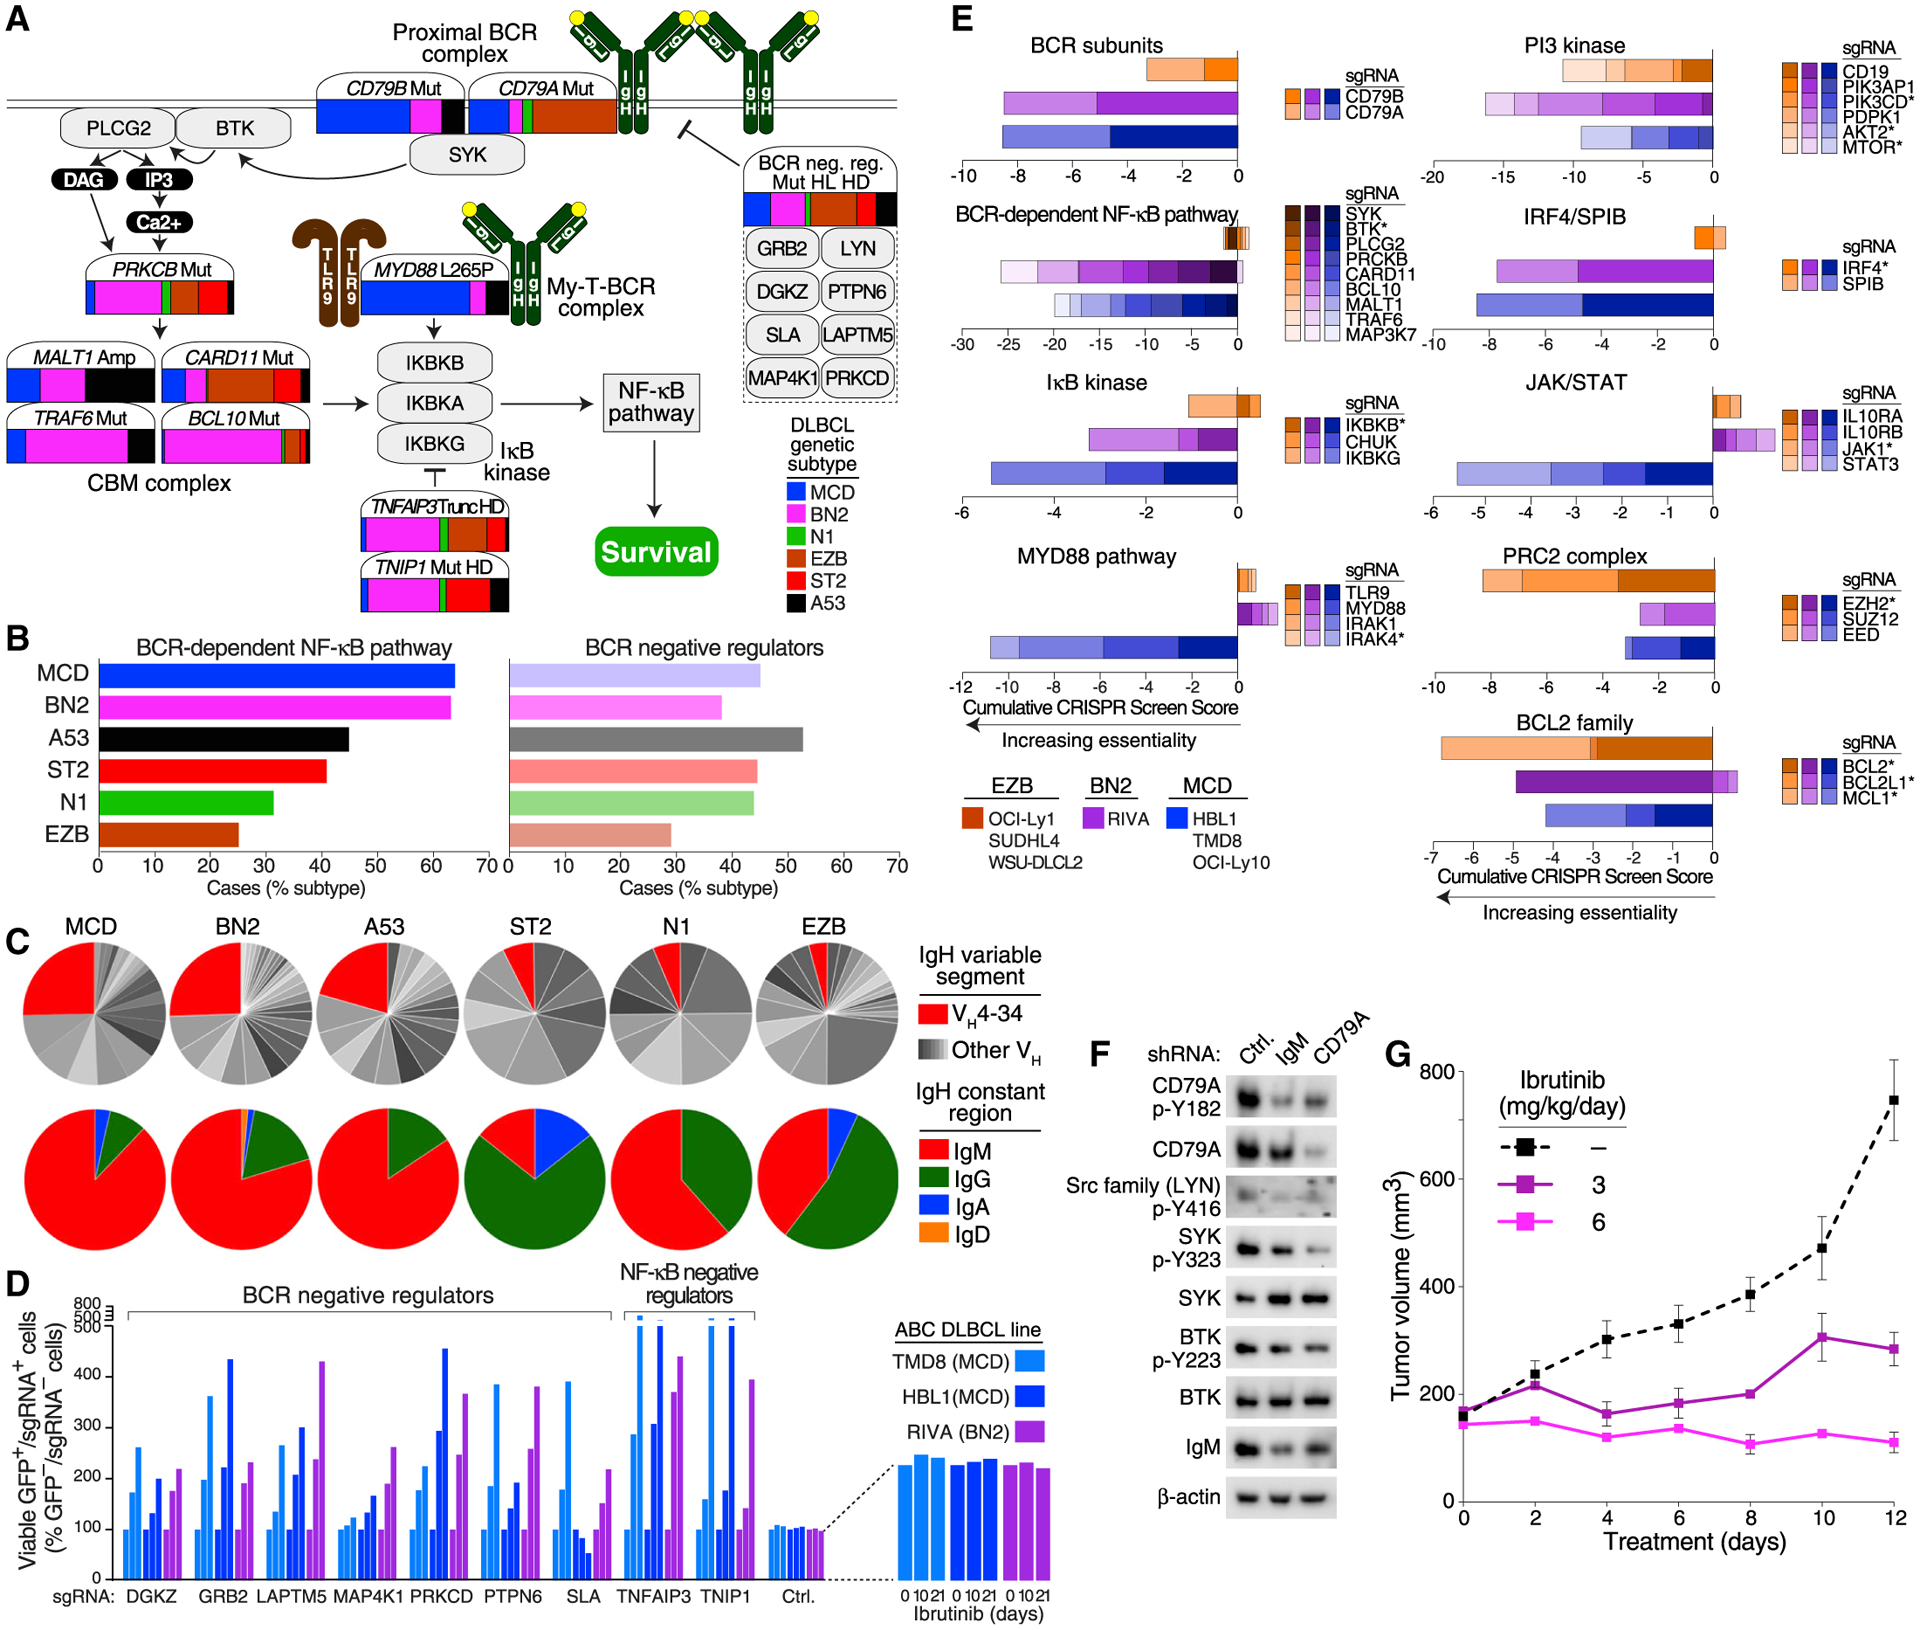
(A) Contribution of each genetic subtype to the indicated genetic aberrations in the BCR-dependent NF-κB pathway. The color bar associated with each gene illustrates the prevalences of each subtype, as indicated, estimated using the NCI cohort and adjusting for a population-based distribution of COO subgroups (see STAR Methods).
(B) Fraction of DLBCL subtype cases with genetic alterations targeting the BCR-dependent NF-κB pathway or negative regulators of proximal BCR signaling.
(C) Top: fraction of cases expressing the IgVH4–34 variable region or other IgVH regions. Bottom: fraction of cases expressing the indicated Ig heavy chain (IgH) constant regions.
(D) CRISPR-mediated knockout of BCR and NF-κB-negative regulators promotes survival in models of MCD and BN2 DLBCL. Cas9+ cells expressing the indicated sgRNAs with GFP were cocultured with parental (GFP−) cells for the indicated times in ibrutinib. Increasing values indicate relative ibrutinib resistance of the sgRNA+ cells.
(E) Genome-wide CRISPR loss-of-function screens. The indicated Cas9+ models of MCD, BN2, and EZB were transduced with a genome-wide sgRNA library, and the sgRNA abundance was quantified before and after 3 weeks in culture. Asterisk: targeted by approved or investigational drugs.
(F) Effect of BCR knockdown on signaling in a BN2 model. Riva cells were transduced with the indicated small hairpin RNAs (shRNA) and the effect on BCR signaling was assessed by immunoblotting for the indicated proteins. Ctrl, control.
(G) Effect of ibrutinib on Riva xenograft growth. Following tumor establishment, mice (n = 5/group) were treated with the indicated ibrutinib doses or vehicle control.
The survival of ABC cell lines relies on engagement of autoreactive BCRs by self-antigens, whereas GCB models rely on an antigen-independent, “toncogenic” form of BCR signaling (Havranek et al., 2017; Young et al., 2015, 2019). Consistent with this model, self-reactive BCRs with the VH4–34 immunoglobulin (Ig) heavy-chain variable (VH) region are enriched among ABC tumors (Young et al., 2015). We assembled the expressed IgVH regions in tumors in the NCI cohort using RNA-sequencing data and observed that VH4–34 was the dominant IgVH region in MCD, BN2, and A53, suggesting that these subtypes may rely upon self-antigen-dependent chronic active BCR signaling (Figure 7C). These subtypes were also distinctive in their use of IgM BCRs, which in normal B cells promote proliferation rather than differentiation (Dogan et al., 2009).
To functionally evaluate the BCR pathway in DLBCL, we used cell lines that bear genetic hallmarks of the genetic subtypes (Table S6). We first investigated whether the negative regulators of proximal BCR signaling that are genetically inactivated in DLBCL modulate chronic active BCR signaling in DLBCL models. We assayed the relative ability of cells to survive in the presence of submaximal concentrations of the BTK inhibitor ibrutinib as an effective proxy for BCR signaling strength (Wilson et al., 2015b). In Cas9-expressing models of MCD and BN2, we knocked out various BCR-negative regulators by expressing short guide RNAs (sgRNAs) together with GFP and quantified the relative numbers of live, GFP+/sgRNA+ cells in the presence of ibrutinib compared with DMSO-treated cultures. Knockout of each BCR-negative regulator promoted survival in ibrutinib, as did knockout of the NF-κB negative regulators A20 (TNFAIP3) and TNIP1, whereas a control sgRNA had no effect (Figure 7D).
To investigate essential pathways in the genetic subtypes, we performed whole-genome loss-of-function CRISPR screens in Cas9-expressing models of MCD (TMD8, HBL1, OCI-Ly10), BN2 (Riva), and EZB (OCI-Ly1, SUDHL4, WSU-DLCL2) (Phelan et al., 2018). For each gene targeted by the sgRNA library, we calculated a CRISPR screen score (see STAR Methods), with negative scores indicating an essential gene (Table S7). Based on this metric, all three subtypes depended on the BCR subunits CD79A and CD79B (Figure 7E), whereas only MCD and BN2 models depended on signaling proteins downstream of the BCR that activate NF-κB. Of particular note, BTK was essential in the MCD and BN2 models but not in the EZB models (Figure 7E). Previous studies have focused on the intense addiction of MCD models to BCR-dependent NF-κB signaling (Davis et al., 2010; Phelan et al., 2018), but the contribution of BCR signaling in BN2 was not anticipated. Constitutive BCR signaling in the BN2 model was confirmed by knockdown of IgM or CD79A, which decreased phosphorylation of LYN, SYK, and BTK (Figure 7F). Accordingly, the growth of Riva xenografts was strongly suppressed by low doses of ibrutinib (Figure 7G), whereas similar doses of ibrutinib only modestly suppressed the growth of MCD xenografts (Figure S7).
We further used the whole-genome CRISPR data to predict the dependency of MCD, BN2, and EZB on other signaling and regulatory pathways that can by targeted by clinically available drugs (Figure 7E). Two master regulatory TFs in ABC DLBCL, IRF4 and SPIB, were selectively essential in the MCD and BN2 but not EZB models, which is notable since they can be downregulated by lenalidomide (Yang et al., 2012). MCD models depended on the IL-10 receptor α and β subunits, JAK1 and STAT3, consistent with autocrine IL-10 signaling in this subtype (Lam et al., 2008; Rui et al., 2016). The PRC2 chromatin repressor complex was especially essential in the EZB models, all of which had gain-of-function EZH2 mutations. The PI3K pathway, which can be activated by BCR signaling in ABC and GCB subtypes (Young et al., 2019), was essential in models of all three subtypes. BCL2 was also pan-essential, whereas BCL-XL (BCL2L1) was selectively required in the MCD models.
DISCUSSION
The extreme genetic and phenotypic heterogeneity of DLBCL presents a challenge to the development of precision therapies. Here, we provide a genetic framework from which to understand therapeutic responses in subsets of DLBCL tumors defined by shared pathogenesis. The DLBCL taxonomy defined by the LymphGen algorithm unifies two recent genetic profiling studies (Chapuy et al., 2018; Schmitz et al., 2018) and was also evident in the independent BCC cohort. This classification breaks DLBCL into seven genetic subtypes that differ with respect to oncogenic pathway engagement, gene expression phenotype, tumor microenvironment, survival rates, and potential therapeutic targets (Figure 8A). As such, this taxonomy provides a roadmap for understanding the biological diversity encompassed within the pathological diagnosis of DLBCL and will likely shed light on the heterogeneous responses of DLBCL to cytotoxic and molecularly targeted therapies.
Figure 8. Implications of the DLBCL Genetic Subtypes for Pathogenesis and Therapy.
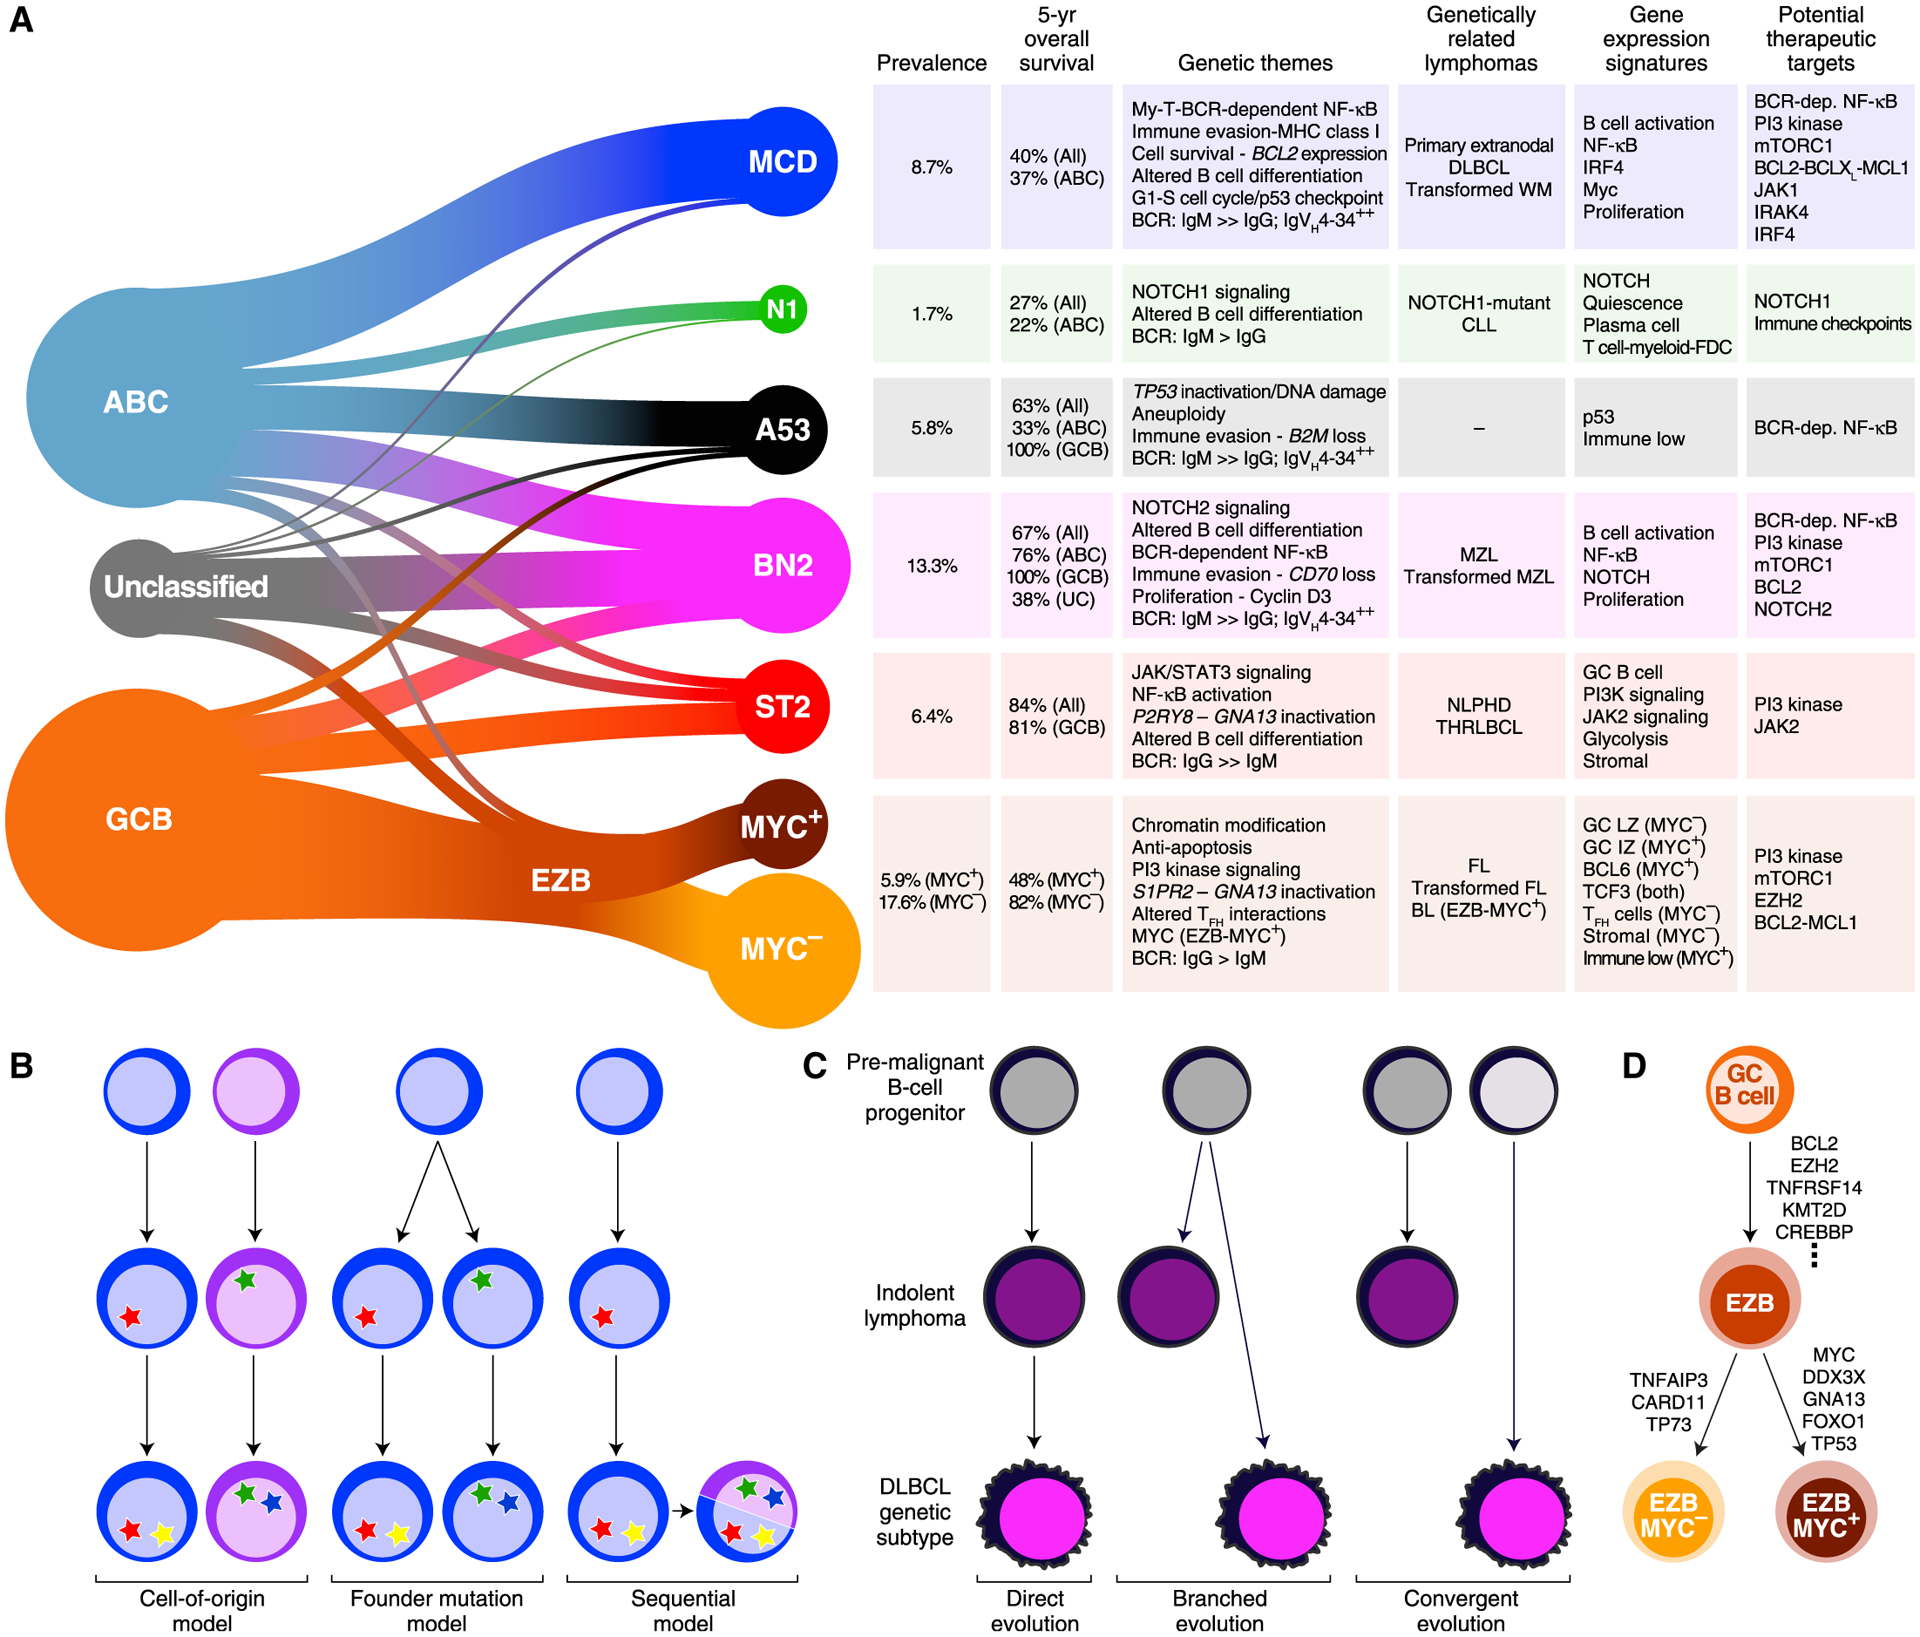
(A) Summary of the relationship between DLBCL COO subgroups and the genetic subtypes (left). The genetic themes, phenotypic attributes, clinical correlates, and treatment implications of each subtype are shown at right. Prevalences were estimated using the NCI cohort, adjusting for a population-based distribution of COO subgroups (see STAR Methods). dep., dependent; FDC, follicular dendritic cell; LZ, light zone; IZ, intermediate zone.
(B) Models of selection for shared genetic features in DLBCL subtypes.
(C) Models accounting for genetic attributes shared by DLBCL genetic subtypes and indolent NHLs.
(D) Model of EZB-MYC+ and EZB-MYC− evolution.
Our investigation provides insight into the mechanisms by which tumors in a DLBCL genetic subtype acquire a shared genetic program (Figure 8B). In one model, the epigenetic nature of a subtype’s cell of origin necessitates certain oncogenic events that endow the B cell precursor with the hallmarks of cancer. Support for this model comes from the observation that the genetic subtypes differ in the expression of B cell differentiation signatures. Alternatively, a precursor B cell may randomly acquire a “founder” genetic lesion, the nature of which dictates the subsequent selection of secondary genetic lesions. For example, MYC overexpression kills normal cells unless they also have lesions that prevent cell death, such as the BCL2 translocations that occur in the EZB-MYC+ subtype (Evan et al., 1992). Our probabilistic approach raises a third, hybrid possibility. A substantial subset of DLBCL tumors (5.7%) had a high probability of belonging to more than one genetic subtype. This suggests a model in which one genetic program is adopted by a tumor initially and a second is subsequently acquired because it confers an additional selective advantage (Figure 8B). Future work will be needed to understand whether therapeutic sensitivity or resistance of such genetically composite lymphomas is dictated largely by one of its genetic programs or is influenced by each program.
Several of the DLBCL genetic subtypes have intriguing similarities to more indolent lymphoma types: BN2 resembles MZLs, EZB resembles FL, and ST2 resembles both NLPHL and THRLBCL. Three models could account for these genetic relationships (Figure 8C). A “direct evolution” model suggests that some DLBCL patients have a concurrent but undiagnosed low-grade malignancy that acquires additional genetic lesions, transforming it into DLBCL. Consistent with this model, pathologists recognize histologically “composite lymphomas” that have, at diagnosis of DLBCL, evidence of a concurrent low-grade lymphoma in the same biopsy (Kuppers et al., 2014). For example, in composite lymphomas with both marginal zone and large cell components, the large cells frequently acquire BCL6 translocations, as is typical of BN2 (Flossbach et al., 2011). A “branched evolution” model posits the existence of a premalignant B cell clone that can become an indolent lymphoma or a DLBCL, depending on the nature of additional genetic alterations it acquires. In some cases of transformed FL, for example, the transformed lymphoma shares some of the genetic features with the antecedent FL, but each lymphoma type has genetic attributes not shared by the other (Green et al., 2013). Recent studies of patients with autoimmune diseases uncovered B cell clones that expand pathogenically with the acquisition of mutations characteristic of DLBCL genetic subtypes, suggesting that such cells could serve as a reservoir that can readily evolve into either an indolent or aggressive lymphoma (Malecka et al., 2018; Singh et al., 2020). In a final “convergent evolution” model, it is formally possible that indolent lymphomas and DLBCL subtypes separately select the same genetic programs to acquire a particular oncogenic phenotype while differing in other attributes. Future genetic studies of composite and transformed lymphomas may shed light on these evolutionary models.
The sequential tumor evolution model most likely accounts for the genetic relationship between EZB-MYC+ and EZB-MYC−, which emerged from our study of the DHIT signature (Ennishi et al., 2019a). The relatively inferior outcome of DHIT+ DLBCL is not only due to the association of EZB-MYC+ with adverse survival but also to the enrichment of DHIT− cases in ST2, BN2, and A53, all of which have good outcomes among GCB cases. While EZB-MYC− and EZB-MYC+ share a substantial genetic program, EZB-MYC+ is enriched in aberrations in MYC and four other genes that are frequently mutated in BL. These tumors also expressed the subset of genes expressed by normal GC B cells that are at higher levels in BL than DLBCL (Dave et al., 2006). These genetic and phenotypic associations suggest that EZB-MYC+ should be considered a genetic subtype of DLBCL that arises from EZB-MYC− tumors with the acquisition of these genetic lesions (Figures 8A and 8D).
“Double-hit” lymphomas harboring translocations of MYC and BCL2 have been associated with inferior survival in most series. Importantly, not all EZB-MYC+ cases are “double hit:” only 38% of these cases had a MYC abnormality while 78% had a BCL2 translocation. Nonetheless, EZB-MYC+ cases expressed genes that are direct targets of MYC (Zeller et al., 2006), suggesting either that they have cryptic genetic abnormalities that deregulate MYC, as described by Hilton et al. (2019), or have other mechanisms to enhance MYC function. The EZB-MYC+ subtype thus expands the concept of “double-hit” lymphoma while still identifying DLBCL patients with relatively adverse outcomes. Of note, among non-EZB GCB cases, the DHIT signature was not associated with adverse outcome. Hence, the EZB-MYC+ and EZB-MYC− distinction refines the DHIT signature to focus on GCB cases with an inferior prognosis.
Another intriguing genetic relationship links the MCD subtype to primary extranodal lymphomas, including those involving immune-privileged sites. Mutations in MCD-defining genes are also characteristic of primary skin, breast, uterus, adrenal, and intravascular lymphomas, supporting the hypothesis that these tissues confer “relative” immune privilege (Shechter et al., 2013). Notably, MCD tumors arising primarily in lymph nodes often secondarily involved immune-privileged sites. Moreover, MCD genomes are extensively modified by immunoediting (Matsushita et al., 2012), characterized by one or more lesions impairing MHC class I antigen presentation or the activation of T and NK cells. Primary central nervous system lymphomas (PCNSLs) also genetically abrogate immune responsiveness despite arising in an immune-privileged site (Chapuy et al., 2016). These observations suggest a quantitative, not qualitative, model for immune evasion by MCD-like aggressive lymphomas in which these tumors must acquire multiple lesions affecting immune recognition and/or grow in relatively (but not absolutely) immune-privileged sites to become “invisible” to immune surveillance.
Our combined genetic, phenotypic, functional, and clinical data demonstrate that the DLBCL genetic subtypes differ strikingly in their response to standard immunochemotherapy and may also respond differentially to targeted therapies (Figure 8A). Genetic lesions targeting the BCR-dependent NF-κB pathway were most frequent in the BN2, MCD, and A53 subtypes as was the autoreactive VH4–34 variable region, suggesting that these subtypes may be sensitive to BTK inhibitors. Indeed, MCD-like tumors with MYD88L265P and CD79B mutations have been associated with a high rate of response to ibrutinib (≥80%) in relapsed DLBCL and in PCNSL (Grommes et al., 2017; Lionakis et al., 2017; Wilson et al., 2015b). Among the genetic subtypes, BN2 had the highest prevalence of lesions affecting the BCR-dependent NF-κB pathway. Moreover, a BN2 model was highly sensitive to ibrutinib. These considerations support the clinical evaluation of BTK inhibitors in BN2.
The PI3K pathway was essential in MCD, BN2, and EZB models, likely for different mechanistic reasons. Other molecular targets in MCD and BN2 include the master regulatory TFs IRF4 and SPIB, which are both downregulated in expression by lenalidomide, a drug that has shown promise in combination with other agents in DLBCL (Goy et al., 2019; Wilson et al., 2015a; Yang et al., 2012). IκB kinase activity, which is required in MCD and BN2 models, can be attenuated by BET inhibitors targeting BRD4 (Ceribelli et al., 2014). MCD models rely on autocrine IL-10 receptor signaling to activate JAK1 and STAT3 (Rui et al., 2016), and a selective JAK1 inhibitor, INCB040093, has shown activity in combination with a PI3Kδ inhibitor in non-GCB DLBCL (Phillips et al., 2018). The MYD88L265P isoform in MCD models spontaneously coordinates a signaling complex involving IRAK1 and IRAK4 (Ngo et al., 2011) supporting the evaluation of IRAK4 inhibitors in MCD, especially in combination with a BTK inhibitor (Kelly et al., 2015). EZB models bearing an EZH2 mutation were preferentially reliant on the PRC2 repressor complex and thus may respond preferentially to EZH2 inhibitors. BCL2 was required in MCD, BN2, and EZB models while BCL-XL was additionally essential in MCD, suggesting that agents such as venetoclax or navitoclax may provide benefit (Mathews Griner et al., 2014).
Given the above evidence that R-CHOP chemotherapy and targeted therapies may be differentially active in particular genetic subtypes, we feel that the LymphGen algorithm will be a useful tool in DLBCL clinical trials that extends the utility of gene expression-based assays. We speculate that the LymphGen classification will find initial utility in the retrospective analysis of clinical trials. Faced with the genetic complexity of DLBCL, it is challenging to identify and statistically verify the association of individual genetic alterations with clinical outcome, given the problem of multiple hypothesis testing. This problem is mitigated by the fact that there are only seven DLBCL genetic subtypes. Because these subtypes differentially acquire mutations in particular signaling and regulatory pathways and have distinct microenvironmental compositions, we anticipate that they may differ in response to therapies targeting oncogenic signaling pathways as well as immunotherapies. Ultimately, if a DLBCL genetic subtype is enriched for therapeutic responses, it could be used as a selection criterion for an expansion cohort in a subsequent clinical trial. We have made the LymphGen algorithm publicly accessible at https://llmpp.nih.gov/lymphgen/index.php in order facilitate its use in DLBCL clinical trials and accelerate the development of improved therapies for these aggressive cancers.
STAR★METHODS
LEAD CONTACT AND MATERIALS AVAILABILITY
Correspondence and requests regarding this manuscript should be sent to and will be fulfilled by the lead investigator Dr. Louis Staudt (lstaudt@mail.nih.gov). This study did not generate any new unique reagents.
EXPERIMENTAL MODEL AND SUBJECT DETAILS
Cell Lines
All cell lines were obtained from the sources indicated in the Key Resources Table. Cell lines were cultured 37°C with 5% CO2 and maintained in Advanced RPMI (GIBCO) supplemented with fetal bovine serum (Tet tested, Atlanta Biologics,) and 1% pen/strep and 1% L-glutamine (GIBCO). Cell line identity was validated with a custom 16 primer PCR DNA fingerprinting assay and compared to historical DNA controls obtained from the source of the material and regularly tested for mycoplasma using the MycoAlert Mycoplasma Detection Kit (Lonza). 293FT cells were ordered from ThermoFisher and maintained in DMEM media supplemented with 1% pen/strep and 1% L-glutamine (GIBCO) supplemented with 10% FBS.
KEY RESOURCES TABLE
| REAGENT or RESOURCE | SOURCE | IDENTIFIER |
|---|---|---|
| Antibodies | ||
| anti-pY182-CD79A | Cell Signaling Technologies | Cat. #5173 |
| anti-CD79A | Cell Signaling Technologies | Cat #3351 |
| anti-pY416-Src family | Cell Signaling Technologies | Cat #2101 |
| anti-pY323-SYK | Cell Signaling Technologies | Cat. #2715 |
| anti-SYK | Cell Signaling Technologies | Cat. #13198 |
| anti-pY223-BTK | Cell Signaling Technologies | Cat. # 5082 |
| anti-BTK | Cell Signaling Technologies | Cat. # 8547 |
| anti-IgM-HRP | Bethyl | Cat. #A80–100P |
| anti-Actin | Santa Cruz Biotechnologies | Cat. #sc-1615 |
| Chemicals, Peptides, and Recombinant Proteins | ||
| Ibrutinib PCI-32765 | MedChemExpress | Cat. #HY-10997 |
| pMD2.G | Addgene | Cat. #12259 |
| Trans-IT 293T | Mirus | Cat. #6603 |
| psPAX2 | Addgene | Cat. #12260 |
| Ex Taq | TaKaRa | Cat. #RR006 |
| Lenti-X concentrator | CloneTech | Cat. #631231 |
| Critical Commercial Assays | ||
| Brunello pooled two-vector sgRNA library | Addgene | Cat. #73178 |
| Blood and Cell Culture DNA Maxi kits | Qiagen | Cat. #13362 |
| 4–15% gradient polyacrylamide gel | BioRad | Cat. #4561083EDU |
| Immobilon-p PVDF membrane | Millipore | Cat. #IPVH00010 |
| Qubit dsDNA HS Assay | ThermoFisher | Cat. #Q32851 |
| E-Gel SizeSelect II Agarose 2% gel | Invitrogen | Cat. #G661012 |
| Deposited Data | ||
| NCI cohort | (Schmitz et al., 2018) | dbGaP: phs001444.v2.p1 |
| Harvard cohort | (Chapuy et al., 2018) | dbGaP: phs000450.v1.p1 |
| BCCA cohort | (Ennishi et al., 2019a, 2019b) | EGA EGAS00001002199 |
| Experimental Models: Cell Lines | ||
| HBL1 | Lab of Martin Dyer | CelloSaurus CVCL_4213 |
| TMD8 | Lab of Shuji Tohda | CelloSaurus CVCL_A442 |
| OCI-LY10 | Lab of OCI/Hans Messner | CelloSaurus CVCL_8795 |
| RIVA | Lab of Martin Dyer | CelloSaurus CVCL_1885 |
| SUDHL4 | Lab of Mark Raffeld | CelloSaurus CVCL_0539 |
| WSU-DLCL2 | Lab of DSMZ | CelloSaurus CVCL_1902 |
| OCI-LY1 | Lab of OCI/Hans Messner | CelloSaurus CVCL_1879 |
| Experimental Models: Organisms/Strains | ||
| Mouse Models | NCI Fredrick Biological Testing Branch | (non-obese diabetic (NOD)/ severe combined immunodeficient (SCID)/II2rg−/−) |
| Software and Algorithms | ||
| STAR | NA | https://github.com/alexdobin/STAR |
| SAMTools | NA | https://sourceforge.net/projects/samtools/ |
| VarScan | NA | https://sourceforge.net/projects/varscan/files/ |
| ANNOVAR | NA | http://annovar.openbioinformatics.org/en/latest/user-guide/download/ |
| TIBCO Spotfire S+ 8.2 for Windows | NA | https://edelivery.tibco.com/storefront/eval/tibco-spotfire-s-/prod10222.html |
| Basespace | NA | https://www.illumina.com/products/by-type/informatics-products/basespace-sequence-hub/apps.html |
| Bowtie 2 version 2.2.9 | NA | https://bioweb.pasteur.fr/packages/pack@bowtie2@2.2.9 |
| LymphGen R code | This paper | https://doi.org/10.5281/zenodo.3700087 |
| LymphGen Web application | This paper | https://llmpp.nih.gov/lymphgen/index.php |
Mice
All mouse experiments were approved by the National Cancer Institute Animal Care and Use Committee (NCI-ACUC) and were performed in accordance with NCI-ACUC guidelines and under approved protocol (MB-086). Female NSG (non-obese diabetic (NOD)/severe combined immunodeficient (SCID)/Il2rg−/−) mice were obtained from NCI Fredrick Biological Testing Branch and used for the xenograft experiments between 6 and 8 weeks of age.
METHOD DETAILS
LymphGen Algorithm Development
Overview
Our goal was to design an algorithm that would calculate the probability of a given DLBCL sample belonging to one of 6 defined genetic subtypes, and to assign the sample to a subtype(s) based on these probabilities. Because genome analysis of patient samples is not always comprehensive, we designed LymphGen to use as input any combination of mutational data, copy number data, and BCL2/BCL6 rearrangement data, allowing for any platform besides mutational data to be omitted. Mutational data can be derived from whole exome/genome sequencing or from targeted panel resequencing. Copy number data can be binned to 4 classes (amplification, gain, heterozygous deletion, homozygous deletion) or can be binned into just 2 classes (increased or decreased). For analyses in which copy number data are not available, LymphGen operates in a 5-subtype mode, omitting A53 since it is defined predominantly by copy number abnormalities. We used data from the NCI cohort (Schmitz et al., 2018) to model the performance of LymphGen given various types of input data and calculated the sensitivity, specificity and precision (positive predictive value) for the subtype assignments compared with the assignments using all data types optimally (Figure S4B). As expected, models lacking BCL2 rearrangements suffered in predicting EZB and models lacking BCL6 rearrangements data suffered in predicting BN2. A lack of copy number data primarily affected prediction of EZB, MCD and ST2. Nonetheless, models constructed only from mutational data performed acceptably, with sensitivity above 81%, specificity above 98%, and precision above 79%. A web-based implementation of the LymphGen algorithm is available for public research use at https://llmpp.nih.gov/lymphgen/index.php.
Revision of Genclass Procedure
Much of the hierarchical modeling methodology used by LymphGen, particularly as it relates to the definition of features, relies on the methods defined in the statistical supplement of ref. (Schmitz et al., 2018).
As a first step towards developing a classifier, we used an expanded version of our previous Genclass iterative prediction method. This expansion added two new classes (A53 and ST2) and incorporated synonymous mutations into the predictor. Other than the modifications listed below, the Genclass algorithm was implemented as previously described (Schmitz et al., 2018).
With the addition of ST2 and A53, the number of possible classifications (including “Other”) was expanded from 5 to 7.
We used the final Genclass classification from the Schmitz paper as a starting seed for the BN2, EZB, MCD, and N1 groups.
Samples previously classified as “Other” and with SGK1 truncations, P2RY8 mutations, or TET2 mutations were set to ST2 in the initial seed.
Samples previously classified as “Other” and not part of the ST2 core that had either a) both a TP53 mutation and a single-copy TP53 loss, or b) a homozygous TP53 deletion were set to A53 in the initial seed.
To account for the fact that synonymous and non-coding mutations may be useful in identifying the presence of somatic hypermutation, a “Synon” feature is considered for each gene. These features, in additional to all of the mutations that affect protein coding, include all synonymous mutations within 4kb of the transcription start site, whether in the coding region or in the 5’ UTR.
When identifying features associated with the A53 subgroup, focal single-copy losses were included as potential copy-number features, even when not combined with mutations.
When identifying features associated with the A53 subgroup, “GAIN” features—consisting of samples for which the gene was covered by a segment of 30MB or less, which indicated a copy-number increase of one or more copies— were included as potential copy-number features. These were distinct from the Amplification (AMP) features, which required an increase of at least two copies. Also, combinations of gains with mutations or truncations were considered as potentially associated with A53.
When identifying features associated with the A53 subgroup, features indicating gains, amplifications, heterozygous deletions, or homozygous deletions of chromosome arms were identified as those samples that had at least 80% of a chromosomal arm having a given copy-number change. Whole chromosome features were identified as those samples which had the same copy-number feature for both arms of a chromosome.
As before, combination features which combine mutation and copy-number change features are used, provided these sub-features each include at least four samples, with at least one-half of the samples of the resulting combination having the associated mutation and one-fourth of the samples of the resulting combination having the copy-number change.
A summary of the feature definitions, and the models for which they can be used, are indicated below.
Mutation Features
| Feature | Mutation Type | Mutation cutoff | Used in |
|---|---|---|---|
| MUTATION | Nonsense, Missense, Frame Shift | Mutations at least 10% of Total reads (EXON, RNAseq, Haloplex) | All Models |
| TRUNC | Nonsense | Mutations at least 10% of Total reads (EXON, RNAseq, Haloplex) | All Models |
| Synon | Nonsense Missense, Frame Shift, Synonymous, 3’UTR | Mutations at least 10% of Total reads (EXON, RNAseq, Haloplex) | All Models |
| SubMUTATION | Nonsense, Missense, Frame Shift | Mutations at least 10% of Total reads (EXON, RNAseq) or 2% of Haloplex | All Models |
| SubTRUNC | Nonsense | Mutations at least 10% of Total reads (EXON, RNAseq) or 2% of Haloplex | All Models |
| SubSynon | Nonsense Missense, Frame Shift, Synonymous, 3’UTR | Mutations at least 10% of Total reads (EXON, RNAseq) or 2% of Haloplex | All Models |
Copy Number Features
| Feature | Copy Number | Region | Used in |
|---|---|---|---|
| GAIN | 3 or more | Segment 30MB or shorter | A53 model only |
| LOSS | 1 or fewer | Segment 30MB or shorter | A53 model only |
| AMP | 4 or more | Segment 30MB or shorter | All Models |
| HOMDEL | 0 | Segment 30MB or shorter | All Models |
| Arm GAIN | 3 or more | 80% or more of Chromsome Arm | A53 model only |
| Arm LOSS | 1 or fewer | 80% or more of Chromsome Arm | A53 model only |
| Arm AMP | 4 or more | 80% or more of Chromsome Arm | A53 model only |
| Arm HOMDEL | 0 | 80% or more of Chromsome Arm | A53 model only |
| Chrom GAIN | 3 or more | 80% or more of Both Chromsome Arms | A53 model only |
| Chrom LOSS | 1 or fewer | 80% or more of Both Chromsome Arms | A53 model only |
| Chrom AMP | 4 or more | 80% or more of Both Chromsome Arms | A53 model only |
| Chrom HOMDEL | 0 | 80% or more of Both Chromsome Arms | A53 model only |
Combination Features
| Feature | Used in |
|---|---|
| Gain MUTATION | A53 model only |
| Gain TRUNC | A53 model only |
| Gain Synon | A53 model only |
| Gain SubMutation | A53 model only |
| Gain SubTrunc | A53 model only |
| Gain SubSynon | A53 model only |
| Loss MUTATION | All Models |
| Loss TRUNC | All Models |
| Loss Synon | All Models |
| Loss SubMutation | All Models |
| Loss SubTrunc | All Models |
| Loss SubSynon | All Models |
| Amp MUTATION | All Models |
| Amp TRUNC | All Models |
| Amp Synon | All Models |
| Amp SubMutation | All Models |
| Amp SubTrunc | All Models |
| Amp SubSynon | All Models |
| HOMDEL MUTATION | All Models |
| HOMDEL TRUNC | All Models |
| HOMDEL Synon | All Models |
| HOMDEL SubMutation | All Models |
| HOMDEL SubTrunc | All Models |
| HOMDEL SubSynon | All Models |
With the new seeds and the revised feature set, the Genclass algorithm was run on the Schmitz data set, resulting in 31 samples classified as A53, 93 samples classified as BN2, 73 samples classified as EZB, 74 samples classified as MCD, 19 samples classified as N1, 20 samples classified as ST2, and 264 samples classified as Other. This revised Genclass classification was used as the starting point for our new LymphGen classifier.
LymphGen Methodology
The new LymphGen classifier includes several improvements. First, while previously only a single feature was allowed to be included for each gene, the new modeling allows for multiple features for a gene to be included in a hierarchical fashion with different weights. So, for example, both truncating and non-truncating mutations may be suggestive of a particular class, but it may be that truncating mutations are more predictive and so are given more weight. Second, unlike Genclass, the LymphGen predictor is probabilistic, which allows us to report the confidence of our prediction and allows a sample to share characteristics of multiple classes.
The LymphGen algorithm creates separate naïve Bayes predictors for each of the six primary classes (BN2, EZB, MCD, N1, ST2, A53), as has been done for genetic predictors of COO subgroups (Scherer et al., 2016). Each predictor will have its own set of features and its own weights given to those features. The set of features considered for possible association with a class are the same as those used in the Genclass prediction, with the exception that, under certain circumstances detailed below, LOSS features are allowed to be associated with non-A53 classes. In detailing our methodology, we will begin by describing which features for a given gene are selected in a given model. Then we will describe how those features are combined into a model of that class; and finally, we will describe how the multiple models are combined to give a final prediction for a sample.
Measures of Feature Significance
In our prediction algorithm, we make use of two measures of significance for the relationship between a given class C and feature F.
Consider the following 2×2 table, where the entries in each cell represent the number of samples that do or do not have a given feature and were or were not classified as a given class according to the revised Genclass prediction described above.
| Class C | Not Class C | |
|---|---|---|
| Has feature F | n 11 | n 10 |
| Doesn’t have feature F | n 01 | n 00 |
The first measure of significance we use is “Statistical Significance,” defined to be the Fisher exact p value associated with the above 2×2 table.
The second measure we use is “Effect Size,” as defined in terms of the log odds ratio:
We found that using the log odds ratio itself was too sensitive in the case of low-frequency features, so we shrank the significance by subtracting its standard error.
So that the final measure of Effect Size is given by
This value is undefined for cases in which one of the cells of the 2×2 matrix is equal to zero. We handle this by setting all 0 cells to be equal to ¼, which is the value that maximizes the Effect Size as defined above.
Gene List Selection
Separate gene lists were defined for each class according to the following rules:
Genes are included in the model of a given class in the order of the Statistical Significance of their most statistically significant feature.
If a copy-number feature of a gene/arm is included in the model, all copy-number features within 15MB are excluded from further consideration.
Only those genes with at least one feature that was found in at least 20% of the class and had a statistical significance (p<0.001) were considered.
Feature Selection within a Gene
The set of features for the LymphGen model separately considered mutations that either included or excluded subclonal events, and either included or excluded synonymous mutations. These subclonal and synonymous mutations generally made up a small fraction of the mutations in a given gene; so, although their inclusion or exclusion may improve model performance, there were insufficient examples to accurately estimate weights for the different mutation types. It therefore made sense to select one of the MUTATION, Synon, SubMUTATION or SubSynon features without further division. So, for each gene/class combination, we selected the one that had the strongest statistical association with the subtype to use as the “mutation” feature. Similarly, we chose the strongest statistical association from among TRUNC and SubTRUNC to represent the “TRUNC” feature for that gene/subtype combination. This same methodology was applied to the combination features as well; so that, for example, only one of “AMP TRUNC” or “AMP SubTRUNC” would be chosen.
Within the copy-number features, we found it simplest and most biologically believable to assume that either increases in copy number or decreases in copy number for a given gene or arm will be associated with a given subtype, but not both. Therefore, for each gene/class combination, we identified the most statistically significant (non-combination) copy-number feature. If this feature indicated an increase in copy number, then AMPs (and GAINs for the class being A53) along with their associated combination features were retained, while any features or combinations representing a loss of copy number for that gene were eliminated. If the most significant copy-number feature indicated a loss of copy number, then the reverse is true.
Given that the changes in copy number occurred over segments that often contained multiple genes, it is not possible to distinguish computationally which one of several adjacent genes was responsible for an observed effect, while on the basis of known biology the effective gene is clearly identifiable. In our initial run of the algorithm, there were several instances of such a confusion occurring, and the incorrect gene was chosen. To prevent this, we excluded copy-number features from any other gene that was within 1MB of any of the following genes: CDKN2A, NOTCH2, REL, SPIB, USP7.
BCL2 and BCL6 fusions were also included as separate features, and if found to be significant (p<0.001) would be used as the sole feature to represent their respective genes.
Hierarchical Feature Selection within a Gene
In our previous Genclass prediction, we restricted ourselves so that only the most significant feature would represent each gene, and that each gene would only be associated with the modeling of a single class. In this new version, we wished to expand the possibilities so that different gene features could be included in the same gene model and influence that model to different degrees. It may be, for example, that truncations are more indicative of a class. To this end, we ordered our set of features for a given gene in the hierarchical manner such that a Level 2 feature (TRUNC, AMP, HOMDEL) is a subset of a related Level 1 feature (MUTATION, GAIN, LOSS) i.e TRUNC is a subset of MUTATION, AMP is a subset of GAIN, and HOMDEL is a subset of LOSS (Figure S8).
As stated above, GAIN and LOSS features are only included in the A53 model. For a given gene/class combination, features were selected in line with the following rules:
Only features that are individually statistically significant (p<0.05) are selected.
If both mutation features and copy-number features are included, then combination features are excluded.
- Level 1 features should be separated from the Level 2 features (e.g., truncations being considered distinct from non-truncating mutations) if:
- Both the number of samples in the class that were in the Level 2 feature but were not in the Level 1 feature, and the number of samples that were in the Level 1 feature but not the Level 2 feature, were at least 3.
- Even excluding those samples that had the Level 1 feature, the Level 2 feature still had an association with the class that was statistically significant at p<0.05.
- The Effect Size for the Level 2 feature is larger than the Effect Size for the Level 1 feature. (Biologically, we should expect a more disruptive change to be more predictive of subtype).
If the Level 1 and Level 2 features are not considered distinct, then the most statistically significant one is selected and the other excluded.
If only the copy number or mutation arm of the hierarchy has features selected according to the above criterion, and if the statistical significance of the most statistically significant combination feature is greater than the statistical significance of the highest-level feature in the remaining arm, then that combination feature replaces the highest-level feature in the arm, with any lower feature being considered as a distinct subset of the combination feature.
Example 1: ETV6 in MCD
Considering the MCD subtype and the Synon feature produced the following 2×2 table, which has an Effect Size of 2.25 and a Statistical Significance, according to the Fisher’s exact test, of 3.25×10¹⁶.
| ETV6 Mutation (including synonymous) | No ETV6 mutation | |
|---|---|---|
| Genclass MCD | 32 | 42 |
| Genclass Non-MCD | 38 | 472 |
This was more significant than the results of similar 2×2 tables based on MUTATION, SubMUTATION or SubSynon features, so the Synon feature was used to represent mutations going forward.
Since this model was not for the A53 subtype, the LOSS and GAIN features were removed from consideration. The HOMDEL feature was the next most significant copy-number feature. It produced the following 2×2 table (samples without copy-number data are excluded) with an Effect Size of 1.24 and a p value of 0.0033.
| ETV6 HOMDEL | No ETV6 HOMDEL | |
|---|---|---|
| Genclass MCD | 6 | 67 |
| Genclass Non-MCD | 7 | 480 |
Since there were both copy-number and mutation features that were significant with p<0.05, these features were treated separately rather than merged into a combination feature.
The TRUNC feature resulted in the following 2×2 table, which had an Effect Size of 2.57 and a Statistical Significance of 2.2×10⁻¹¹.
| ETV6 Truncation | No ETV6 Truncation | |
|---|---|---|
| Genclass MCD | 17 | 57 |
| Genclass Non-MCD | 7 | 493 |
This was more significant that the SubTRUNC feature, so the SubTRUNC feature was not used. Since it was significant with p<0.05, had a higher Effect Size than the Synon feature, and included 7 MCD samples (3 or more), we considered the possibility of separating the truncations from the other mutations. Excluding the truncations resulted in the following table, which had a p value of 9.9×10⁻⁶:
| Non-Truncating ETV6 mutation | No Mutation | |
|---|---|---|
| Genclass MCD | 15 | 42 |
| Genclass Non-MCD | 21 | 472 |
Since this significance is also less than 0.05, and there were 15 MCD samples (3 or more) with non-truncating mutations, we confirm that the TRUNC feature should be separated from the Synon feature. If this had not resulted in a significant p value, then only the Synon feature would have been used, since it had a better statistical significance than the TRUNC feature.
So, as a final result, we divide the samples into 4 groups according to aberrations of ETV6:
| Non-Truncating ETV6 mutation (Including synonymous) | Truncating ETV6 mutation | ETV6 HOMDEL> | Non-mutant Non-HOMDEL | |
|---|---|---|---|---|
| Genclass MCD | 15 | 17 | 6 | 36 |
| Genclass Non-MCD | 21 | 7 | 7 | 465 |
Example 2: IRF4 in MCD
The most significant feature for MCD associated with the IRF4 gene was the combination feature, including SubSynon and LOSS. It can be represented by the following 2×2 table, which has an Effect Size of 0.77 and a Statistical Significance of 7.3×10⁻⁴:
| IRF4 Loss or Mutation (Including synonymous or subclonal) | No Mutation or Loss | |
|---|---|---|
| Genclass MCD | 20 | 53 |
| Genclass Non-MCD | 56 | 432 |
Since the p value was less than 0.001, and the 20 MCD samples with this feature represented greater than 20% of the total set of MCD samples, the IRF4 gene was considered for inclusion in the model. This feature was more significant than any of the mutation features, and we found no copy-number feature that had a significance p value less than 0.05. Therefore, this combination feature was chosen as the top of the hierarchy. However, the TRUNC feature produced the following 2×2 table with a Statistical Significance of 0.0491 (<0.05) and an Effect Size of 0.88:
| IRF4 Truncation | No IRF4 Truncation | |
|---|---|---|
| Genclass MCD | 3 | 71 |
| Genclass Non-MCD | 4 | 496 |
So IRF4 TRUNC was included as a sub-feature of the IRF4 Synon-LOSS combination feature.
Thus, the final result would be to divide the samples into three groups according to aberrations of IRF4:
| IRF4 Loss or non-Truncating Mutation (including synonymous or subclonal) | Truncating IRF4 mutation | Non-mutant Non-Loss | |
|---|---|---|---|
| Genclass MCD | 17 | 3 | 53 |
| Genclass Non-MCD | 52 | 4 | 432 |
Single-Class Sample Prediction
In this section, we describe how we identify the likelihood that a sample is part of a particular class. Our methodology is based on a categorical naive Bayes. According to naive Bayes, given a set of observations and a condition M we can estimate the probability of having that condition as
where P0 indicates a prior probability and represents “not M.” If we “naively” assume that [x1, …, xn] are independent, and further assume a flat prior, then this can be rewritten as
If we define
then this reduces to
Now suppose for a given feature, we have the following 2×2 table:
| Has feature | Doesn’t have feature | Total | |
|---|---|---|---|
| Class | n 1 | n 2 | N |
| Not Class | m 1 | m 2 | M |
We can empirically estimate the likelihood of having a feature as
So that
However, as before, we find that not accounting for the degree of uncertainty in our empirical estimates resulted in an over-emphasis of features with few examples. We therefore estimate the standard error of this value:
and in practice we use
If n1 or m1is equal to 0, then we set them to ¼, the value that maximizes the .
We then calculate the confidence that a sample is in class c as
where the sum is over all genes associated with the class, and the ’s are calculated based on the observed status for that sample in gene i. If a sample matches more than one category (say for example, both a HOMDEL and a TRUNCATION for ETV6), the category associated with the largest is used.
Example 1b: ETV6 in MCD
Returning to Example 1 above, we can define an for a given sample depending on what (if any) abnormality that sample had in ETV6. The total number of MCD samples (N) is 74, and the total number of non-MCD samples (M) is 500. So, if sample j had a HOMDEL for ETV6, then for that sample the following is true:
If instead that sample had a truncating mutation in ETV6, then
Since both of these values are positive, having either indicates an increased likelihood of a sample being MCD. If a sample had both a HOMDEL and a truncating mutation, then the larger value (2.37) would be used.
On the other hand, if the sample was wild type for ETV6, then
which as a negative value indicates increased likelihood that the sample is not MCD.
EXAMPLE 2B: IRF4 IN MCD
Looking back to Example 2 in the previous section, if sample j had a loss of IRF4, then
If the sample had wild-type IRF4, then
Suppose (counterfactually) that IRF4 and ETV6 were the only genes associated with MCD. Then we would calculate the confidence value for MCD as
So, if a sample had a truncating mutation of ETV6, but was wild type for IRF4, the confidence value would be
Alternatively, for a sample that was wild type for ETV6 but had a loss of IRF4, it would have a confidence value of MCD equal to
Combining Models to Generate Final Sample Call
Following the methods described above will result in each sample having confidence values between 0 and 1 for each of the 6 classes. If a sample had a confidence value between 0.5 and 0.9 in one class and less than 0.5 in all the 5 remaining classes, then the sample is called “adjacent” to that first class. If a sample has a confidence value of greater than 0.9 for one class and less than 0.9 for the 5 other remaining classes, then it is called “core” for that class. If a sample had a confidence value of greater than 0.9 in multiple classes, then it is called a “composite” sample that has qualities of all classes for which it had a confidence value greater than 0.9. For example, a sample may be called “composite EZB/A53”. If a sample had no class with a confidence level greater than 0.5, or had multiple classes with a confidence level between 0.5 and 0.9 but no classes with a confidence level greater than 0.9, then it was called “Other”. Note that in the majority of samples, either no class had a confidence level greater than 0.5, or there would be a single class with a confidence level greater than 0.9. So, the side cases discussed above were relatively rare.
Application of LymphGen to Imperfect Data
The data on which the LymphGen algorithm was trained included whole-exome data for all genes, complete copy-number data, and information regarding the fusion status of BCL6 and BCL2. It further included high-coverage Haloplex data, which allowed for the identification of subclonal events. We recognize that those who wish to use our method to predict their samples may not have all of the features indicated in our model. For example, they may only have a limited gene panel, lack information on fusions, or lack copy-number information. Alternatively, they may have copy-number information but lack the ability to distinguish single-copy gains from amplifications, or perhaps they only detect high-level amplifications.
If we were to attempt to use our model as originally defined on such samples, their confidence values would be penalized for not having features that were not tested for. Therefore, when presented with a new data set, we customize our model to match the available data on that sample. To do this, we alter the gene and hierarchical feature selection of the LymphGen algorithm (as defined above) to exclude any feature that was not available on the data set. So for example, we would exclude features from all genes that were not available on the tested set’s gene panel: if copy-number data were unavailable, all copy-number features would be excluded; if BCL2 fusion information were unavailable, then that feature would be excluded (but this may result in the inclusion of BCL2 mutations if that information was available), etc. This reduction of the set of allowable features only extends to the final development of the naïve Bayes predictor. The initial Genclass results that were used as the basis to train the model remain unchanged.
We also placed the following additional restrictions on class prediction in the case of incomplete data:
Since the most prominent attribute of A53 is extensive copy-number changes, if a sample lacks copy-number information, the A53 subclass is excluded from consideration and no A53 confidence is calculated.
Since the prediction of the N1 subtype relies exclusively on mutations of NOTCH1, if information regarding NOTCH1 mutations is not available, then the N1 subclass is excluded from consideration and no N1 confidence is calculated.
With the exception of the prediction of N1 (which as stated relies solely on the N1 gene), in order for a sample to be predicted as a particular class (or as a composite including that class), that sample must include predictive features from at least two genes that were part of the predictive model.
Evaluation of Model Performance on Subclasses of Features
Although when using the methods described above, it is possible to predict samples using only a subset of features, this will likely result in reduced predictive accuracy. The degree of degradation depends on which features are missing. It may be that the missing features are of little importance and there is little change in the prediction, or it may be that crucial information is not available and the classification of a given subtype is heavily compromised.
It is therefore important to evaluate how much the loss of features affects predictor performance. We do so by assuming that the class prediction of the training-set samples on the complete set of features represents the gold standard, and then we compare the results to a prediction of the training-set samples with a model based on the subset of features. Since, depending on which features are missing, the prediction of some subtypes may degrade more than others, we evaluate the performance on each class separately. We compare the set of samples predicted by the full model as being of the given class (such as BN2) or a composite including that class (such as BN2/EZB) with the set of samples predicted as that class (including composites) under the subset model, and report standard accuracy statistics such as sensitivity, specificity, and precision.
Prediction on Validation Sets
The BCCA cohort (Ennishi et al., 2019a) did not have whole-exome data available, but instead had sequencing data on a select gene panel. All mutation, truncation, and composite features for genes not included in the gene panel were excluded when training the model for this data set. Copy-number calls were generated from the Affymetrix SNP6.0 array through the use of the PennCNV and OncoSNP algorithms. We observed that this produced significantly fewer homozygous deletions than were observed on the training set, suggesting that this method had reduced sensitivity in distinguishing homozygous deletions from heterozygous losses. Therefore, we removed all HOMDEL features and their associated composite features when training the predictor for this data.
The Harvard cohort (Chapuy et al., 2018) included full-exome data on all samples; however, it was not clear what sort of mutation blacklist or gene annotation was used to develop their list of mutations. Since they provided a large set of samples, and the features used in our model were generally prevalent, we included mutation and truncation features (along with their composites) only for those genes for which there was at least one mutation found in the Harvard data. The copy-number data for the Harvard samples was generated from the exome data, which resulted in 65 regions of suspected copy-number change that applied to all samples. Further, only the direction of copy-number change was indicated for these samples, with no indication of their magnitude. We decided, therefore, to exclude all copy-number and composite features from the predictors of every class except A53. For A53, we only included GAIN and LOSS features based on genes or arms that were included among the 65 regions, and we only allowed the inclusion of the most significant feature for each region regardless of size.
Model Verification via Gene Cross-Validation
Given that there was no gold standard against which to compare our prediction results on the validation set, we needed to develop an alternative way to demonstrate that the classes we found on the training data were also found on the validation cohorts. To do this, we considered that (with the exception of N1) our classes were defined by sets of features that frequently co-occurred. It was theoretically possible that the classes we identified did not in fact represent distinct biology and only represented coincidental co-occurrence of various features; but if that were the case, we would not expect to see a similar co-occurrence on our independent validation cohorts.
For the BN2, EZB, MCD and STD subtypes, we tested for co-occurrence by looking at the relationship between the presence or absence of features for a gene and the model score with that gene excluded. If a class was defined based on a purely coincidentally co-occurring set of features, then on an independent cohort there would be no relationship between the features for a gene and the model score based on all of the other predictive features. If instead the relationship was not coincidental, then we would expect that those samples that had predictive features for that gene would tend to have additional features associated with that class, and so have a higher predictor score than those without that feature.
Consider the example of ETV6 within MCD. We begin by calculating the predictive score for MCD, excluding the ETV6 features, and calculate their ranks.
The score for ETV6 is then calculated as the sum of ranks for those samples with an ETV6 feature.
If we assume that each sample was equally likely to have an ETV6 feature, this would reduce to the standard Mann-Whitney U test. However, we recognize that the features are not uniformly distributed among our samples. Some samples have more reported mutations of all types than other samples, either due to genomic instability or differences between samples in assay sensitivity. This will result in increased co-occurrence of all features (whether predictive or not) beyond what one would expect by chance. Therefore, we need to demonstrate that the relationship between ETV6 (in this example) and the MCD score is greater than the relationship between the score and randomly occurring features. To do so, we generate random sets of patients S1, …, S10,000, each with size equal to the number of samples with ETV6, and with the probability of a sample being selected weighted according to the number of mutations reported for that patient. We then calculate a U score for each of these selections.
We then report the following Monte Carlo p value for the association between the gene and the subtype, where I is the indicator function.
A global p value for a given class can be calculated by using Fisher’s method to combine the p values of the individual predicative genes associated with that class.
The A53 subtype was characterized by an overall increase in copy-number changes associated with TP53 alterations. To test the validity of this subtype, we simply used a standard Mann-Whitney U test to check whether the total number of copy-number changes was higher in samples with TP53 alterations than in those without such alterations.
Genetic Prediction of EZB-MYC+ and EZB-MYC−
After observing the connection between the EZB subtype and the DHIT+ class, we considered creating a genetically-based classification of the EZB-MYC+ and EZB-MYC− groups. This was done in a similar manner to the development of the other binary naïve Bayes sub-models of the LymphGen algorithm but with a few modifications. First, the prediction was only done within the samples that were classified as EZB by the LymphGen algorithm, with the gene expression classification of DHIT cases being used as the starting point. Second, given the much smaller set of training data, we were forced to reduce the stringency of the feature selection criteria, requiring statistical significance p<0.01 where previously we had required p<0.001. This resulted in a predictor that included three composite features.
Since the Harvard data lacked classification calls for the DHIT subtype, and the BCC samples lacked the complete genomic data required to make the genomic prediction, we were unable to evaluate our finding on a completely independent data set. Instead, we used a permutation test to demonstrate that our genomic predictor of EZB-MYC+ had greater association with the DHIT classification than one would expect by chance, even taking into account the possibility of overfitting. To this end, we randomly permuted the DHIT class labels among the EZB samples and repeated our prediction algorithm, and then tested the agreement between the permuted class labels and the predictor score, according to a Wilcoxon test. This was repeated 1,000 times. In only three of those times was the agreement between the permuted class labels and predictor score more significant than what was observed for the unpermuted DHIT labels, resulting in a permutation p value of 0.004.
Phosphoprotein Analysis of BCR Signaling
Samples were separated on a 4–15% gradient polyacrylamide gel (BioRad) and transferred to Immobilon-p PVDF membrane (Millipore) for western blot analysis. Membranes were blocked with 5% milk in TBST and probed with: rabbit anti-pY182-CD79A (Cell Signaling Technologies, Cat. # 5173), anti-CD79A (Cell Signaling Technologies, Cat. # 13333), anti-pY416-Src family (Cell Signaling Technologies, Cat. # 2101), anti-pY323-SYK (Cell Signaling Technologies, Cat. # 2715), anti-SYK (Cell Signaling Technologies, Cat. # 13198), anti-pY223-BTK (Cell Signaling Technologies, Cat. # 5082), anti-BTK (Cell Signaling Technologies, Cat. # 8547), goat anti-IgM-HRP (Bethyl) and mouse anti-Actin (Santa Cruz Biotechnologies, Cat. #sc-1615). Blots were stripped with 0.2N NaOH for 5 minutes at room temperature between antibodies.
CRISPR Screens
CRISPR screens were performed as previously described (Phelan et al., 2018). Briefly, the Brunello pooled two-vector sgRNA library was purchased from Addgene (73178) and transformed in Stbl4 bacteria (Invitrogen). Eight individual transformations were pooled and grown at 30°C overnight on 24.5 cm2 bioassay plates maintaining at least 100× total coverage. Colonies were scrapped, spun and DNA was isolated with Blood and Cell Culture DNA Maxi kits (Qiagen). Lentivirus was prepared in 293FT cells by transfecting Brunello with packaging vectors psPAX2 (Addgene 12260) and pMD2.G (Addgene 12259) in a 4:3:1 ratio in serum-free Opti-MEM withTrans-IT 293T (Mirus). Viral supernatants were harvested 24, 48 and 72 hours after transfection, spun at 1,000 g for 5 minutes and then incubated with Lenti-X concentrator (CloneTech). For genome-wide screening, two individual biological replicates were transduced at a low MOI (<0.3) such that 500 copies of each sgRNA were theoretically present and selected in puromycin three days after infection. Transduced cells were then harvested for a day 0 time point and doxycycline was added to the culture media at 200 ng ml−1 final concentration. Cells were counted and passaged every two days maintaining an average cell number equivalent to maintain 500x coverage. After 21 days in culture, cell pellets were again collected. DNA was extracted from frozen cell pellets using Qiagen QIAmp DNA Blood Maxi kits.
Nextgen libraries were prepared using a nested PCR approach to isolate sgRNA sequences from genomic DNA with primers U6-F1 and Tracer-R1 (see below sequences,) and then to add sequencing adapters compatible with the NextSeq500 (Illumina) and a dual indexing approach (D501-D508-F, D701-D712-R) as previously described (Webster et al., 2019).Products were amplified with ExTaq (Takara) for 18 cycles and isolated using an E-Gel SizeSelect II Agarose 2% gel (Invitrogen). Libraries were individually quantitated using a Qubit dsDNA HS Assay (ThermoFisher) and diluted to 1nM before pooling equal ratios. Libraries were sequenced using a single-read 75 cycle high output flow cell (Illumina) on a NextSeq500 to an average depth of 474 (Inter quartile range 169–586). Basespace software was used to demultiplex samples and evaluate sample quality. Individual sgRNA counts were extracted using BASIC.pl (Phelan et al., 2018) and aligned to the Brunello sgRNA reference library using Bowtie 2 version 2.2.9 with the following parameters: -p 16 -f–local -k 10–very-sensitive-local -L 9 -N 1.
Analysis of Tumor Suppressor Genes
Cas9-expressing TMD8, Riva, and HBL1 cells were infected with lentiviruses co-expressing an sgRNA and a puromycin resistance-GFP fusion gene. 3 days after infection cells were selected with puromycin and Cas9 expression was induced by addition of doxycycline. After 7 days, selected cells were washed with media and mixed at a ratio of 1:10 with uninfected cells of the respective cell lines. Cell mixtures were treated with Ibrutinib (Selleckchem) or DMSO (Sigma) for a period of 21 days. Based on the overall viability of the cultures, ibrutinib doses were increased in the first 10 days of treatment to a final concentration of 2.5 ng/mL (TMD8) and 10 ng/mL (HBL1 and Riva) and kept constant thereafter. Relative growth of cells co-expressing GFP and sgRNAs was monitored by FACS. Cell proliferation and survival of these cells was determined proportional to day 0 of the drug treatment. Growth differences of ibrutinib treated cells were normalized to DMSO treated control cells.
Mouse Xenograft Experiments
Murine xenograft models of the MCD genetic subtype were established using the TMD8 and HBL1 cell lines, and a model of the BN2 subtype was established using the Riva cell lines. Tumors were established by subcutaneous injection of 1×10⁷ Riva, TMD8 or HBL1 cells into the right flank of female non-obese diabetic/severe combined immunodeficient/common gamma chain deficient (NSG) mice (Jackson Laboratory). Tumor growth was monitored by measuring tumor size in two orthogonal dimensions. Tumor volume was calculated by using the formula ½(long dimension)*(short dimension)2. Eleven days after injection of the tumor cells, the average tumor volume reached 200 mm3 and drug therapy was started. The Riva tumor bearing NSG mice were divided into three groups of 5 mice each, with comparable tumor burden between groups as evaluated by tumor volume. Ibrutinib (MedChemExpress) was dissolved in 50% DMSO and given by intraperitoneal (i.p.) injection daily at 3 or 6 mg/kg/day for 12 days. Control mice received the same amount of 50% DMSO by i.p. injection. Mice with TMD8 or HBL1 xenografts were divided into 2 groups of 5 mice, with the treatment group receiving ibrutinib at 5 mg/kg/day for 12 days and the control group receiving 50% DMSO. Tumor volume was monitored during this time. At day 12 after initiation of the therapy, all of the mice were euthanized. All animal experiments were approved by the National Cancer Institute Animal Care and Use Committee (NCI ACUC) and were performed in accordance with NCI ACUC guidelines.
Publicly Available Data Used in Study
Training Data
NCI cohort (Schmitz et al., 2018):
Validation Data
Harvard cohort: (Chapuy et al., 2018)
BCC cohort: (Ennishi et al., 2019a, 2020)
Non-Hodgkin Lymphomas for Comparison in Figure 3
BL (Bouska et al., 2017a; Love et al., 2012; Richter et al., 2012).
Chronic lymphocytic leukemia (Amin et al., 2016; Landau et al., 2015, 2017; Ljungstrom et al., 2016; Puente et al., 2015; Quesada et al., 2011; Wang et al., 2011).
FL (Bouska et al., 2017a; Green et al., 2013, 2015; Hellmuth et al., 2018; Krysiak et al., 2017; Okosun et al., 2016; Pasqualucci et al., 2014; Tsukamoto et al., 2017; Zamo et al., 2018).
Mantle cell lymphoma (Agarwal et al., 2019; Bea et al., 2013; Wu et al., 2016; Zhang et al., 2014).
Primary Extranodal Lymphomas for Comparison in Figure 3
Primary CNS lymphoma (Braggio et al., 2015; Bruno et al., 2014; Chapuy et al., 2016; Fontanilles et al., 2017; Fukumura et al., 2016; Hattori et al., 2017, 2019; Hickmann et al., 2019; Nakamura et al., 2016; Vater et al., 2015; Zhou et al., 2018b).
Primary cutaneous lymphoma (Ducharme et al., 2019; Mareschal et al., 2017; Zhou et al., 2018a).
Primary vitreoretinal lymphoma (Yonese et al., 2019).
Primary testicular lymphoma (Chapuy et al., 2016; Kraan et al., 2014).
Primary breast lymphoma (Cao et al., 2017; Franco et al., 2017).
Primary intravascular lymphoma (Schrader et al., 2018; Shin et al., 2019; Suehara et al., 2018).
Primary uterine lymphoma (Cao et al., 2017).
Marginal Zone Lymphoma for Comparison in Figure 3
(Clipson et al., 2015; Ganapathi et al., 2016; Hyeon et al., 2018; Johansson et al., 2016; Kiel et al., 2012; Martinez et al., 2014; Parry et al., 2013, 2015; Pillonel et al., 2018; Rossi et al., 2012; Spina et al., 2016).
FL and Transformed FL for Comparison in Figure 3
(Bouska et al., 2017b; Green et al., 2013, 2015; Hellmuth et al., 2018; Krysiak et al., 2017; Okosun et al., 2014, 2016; Pasqualucci et al., 2014; Tsukamoto et al., 2017; Zamo et al., 2018).
NLPHL and THRLBCL for Comparison in Figure 3
QUANTIFICATION AND STATISTICAL ANALYSIS
Estimation of DLBCL Genetic Subtype Prevalence
Since the NCI DLBCL was deliberated enriched for ABC and Unclassified cases, we estimated what the prevalence of these subtypes would be in a population-based cohort of DLBCL cases. Using the published prevalence of COO subgroups within a population-based cohort (Scott et al., 2015), we adjusted the prevalences of each genetic subtype within the NCI cohort based on the percentages of the ABC, GCB and Unclassified subgroups within each genetic subtype. The assumption behind this normalization is that the relationship between COO subgroup and DLBCL genetic subtype is relatively invariant, as we observed to be the case in the three cohorts analyzed in the present study (Figure 4B).
RNA-seq Analysis
The gene expression signature database was first described in ref. (Shaffer et al., 2006) and are available at https://api.gdc.cancer.gov/data/cf7cd89e-da75-45fe-a4d5-e89e491f45d6. Expressed immunoglobulin heavy chain genes were assembled from the RNA-seq data as described (Bolotin et al., 2017).
CRISPR Screen Data Analysis
Raw read counts were normalized to 40e6 per sample and increased by 1 before calculating a CRISPR screen score as follows:
All sgRNAs with an average normalized read count below 50 at day 0 were removed due to low coverage.
The average log2 fold change was computed between day 21 and day 0 for each replicate.
A Z-score was calculated from the average log2 fold change of all sgRNAs per gene.
The average CSS of two biological replicates was averaged.
The CSS for a given gene from each cell line within a genetic class was averaged and depicted in Figure 7E.
Prevalence of Genetic Alterations in Other Lymphomas
Prevalence of lymphoma cases with mutations in genes that characterize particular genetic subtypes of DLBCL were derived from ref. (Schmitz et al., 2018). Prevalence of mutations in other types of non-Hodgkin lymphoma (NHL) presented in Figures 3B, 3D–3G and 5G were calculated using published datasets derived whole exome, whole genome, whole transcriptome, or targeted resequencing. As a negative control, the prevalence of cases with mutations were determined from whole exome sequencing data in a non-Hodgkin lymphoma cohort consisting of BL, FL, chronic lymphocytic leukemia and mantle cell lymphoma
General Statistical Methods
Digital gene expression values, copy number, and mutation calls were generated as previously described (Chapuy et al., 2018; Ennishi et al., 2019a; Schmitz et al., 2018). The DHIT score was generated from the digital gene expression as previously described (Ennishi et al., 2019a). All remaining signature averages were calculated as the mean of the normalized, log2-transformed digital gene expression values for all genes in the signature. These values were then linearly transformed, such that across all samples the resulting normalized averages had a median of zero and an interquartile range of 1.35 (the interquartile range of a standard normal distribution). For Figure 5C, a multivariate regression of the GCB4 and MYCUp-4 signature averages was fit to the DHIT score for all EZB cases (including composite EZB cases). The results of this fit for each EZB sample was plotted against the observed DHIT score for that sample. The reported p value was based on an F-test for the total significance of the model.
Within the BCCA cohort, disease-specific survival was used as the endpoint, while overall survival was used within the training and Harvard cohorts. The hazard ratios and confidence intervals for survival differences between subtypes indicated in Figure 4E were calculated according to the Cox proportional hazard model, based on all samples of the types being compared within the specified cohort. Models, including a single binary variable indicating class, were used to generate the within-study estimates, with p values generated according to a log-rank test. For the combined estimates, a multivariate model was used, which included, in addition to the binary class variable, a categorical co-variate indicating the cohort. For these models, the p value was generated from a score test.
All reported p values are two-sided. The statistical significances for differential prevalence of features between classes were calculated with a Fisher’s exact test.
DATA AND CODE AVAILABILITY
Targeted resequencing data from the BCC cohort are available at the European Genome-Phenome Archive (EGA; https://ega-archive.org/) under accession EGAS00001002657. LymphGen code is available at https://doi.org/10.5281/zenodo.3700087.
ADDITIONAL RESOURCES
A web-based implementation of the LymphGen predictor has been made available at https://llmpp.nih.gov/lymphgen/index.php, that allows users to upload a set mutations and copy number alterations found on a set of samples, and returns the LymphGen predicted classification for those samples.
Supplementary Material
Significance.
We describe a taxonomy of diffuse large B cell lymphoma (DLBCL) consisting of seven genetic subtypes and provide a probabilistic method to classify a patient’s tumor within this taxonomy. Several DLBCL subtypes are genetically related to distinct indolent lymphoma types, suggesting that these subtypes may arise from clinically occult precursors. We infer oncogenic pathway activity and therapeutic vulnerabilities of the DLBCL subtypes using their genetic and gene expression profiles supplemented by functional identification of essential genes using loss-of-function CRISPR/Cas9 screens of cell-line models of the subtypes. To foster precision medicine studies of DLBCL, we have implemented our probabilistic algorithm on a publicly accessible server.
ACKNOWLEDGMENTS
Supported by the Intramural Research Program of the NIH, National Cancer Institute, Center for Cancer Research, grant 1P01CA229100 from the National Cancer Institute, and by grants from the Terry Fox Research Institute (1061, 1043). We wish to acknowledge the NIH Biowulf high-performance computing system for help with data analysis and the Frederick National Laboratory for Cancer Research Sequencing Facility managed by Bao Tran.
DECLARATION OF INTERESTS
G.W.W., D.W.H., and L.M.S. are inventors on an NIH patent application that is based on the work presented herein. D.W.S. was a consultant for Abbvie, Celgene, and Janssen; received research funding from NanoString Technologies, Janssen, and Roche/Genentech. Authors are included on additional patents, some of which are licensed by NanoString Technologies.
Footnotes
SUPPLEMENTAL INFORMATION
Supplemental Information can be found online at https://doi.org/10.1016/j.ccell.2020.03.015.
REFERENCES
- Agarwal R, Chan YC, Tam CS, Hunter T, Vassiliadis D, Teh CE, Thijssen R, Yeh P, Wong SQ, Ftouni S, et al. (2019). Dynamic molecular monitoring reveals that SWI-SNF mutations mediate resistance to ibrutinib plus venetoclax in mantle cell lymphoma. Nat. Med 25, 119–129. [DOI] [PubMed] [Google Scholar]
- Alizadeh AA, Eisen MB, Davis RE, Ma C, Lossos IS, Rosenwald A, Boldrick JC, Sabet H, Tran T, Yu X, et al. (2000). Distinct types of diffuse large B cell lymphoma identified by gene expression profiling. Nature 403, 503–511. [DOI] [PubMed] [Google Scholar]
- Amin NA, Seymour E, Saiya-Cork K, Parkin B, Shedden K, and Malek SN (2016). A quantitative analysis of subclonal and clonal gene mutations before and after therapy in chronic lymphocytic leukemia. Clin. Cancer Res 22, 4525–4535. [DOI] [PMC free article] [PubMed] [Google Scholar]
- Baeuerle PA, and Baltimore D (1988). I kappa B: a specific inhibitor of the NF-kappa B transcription factor. Science 242, 540–546. [DOI] [PubMed] [Google Scholar]
- Bea S, Colomo L, Lopez-Guillermo A, Salaverria I, Puig X, Pinyol M, Rives S, Montserrat E, and Campo E (2004). Clinicopathologic significance and prognostic value of chromosomal imbalances in diffuse large B cell lymphomas. J. Clin. Oncol 22, 3498–3506. [DOI] [PubMed] [Google Scholar]
- Bea S, Valdes-Mas R, Navarro A, Salaverria I, Martin-Garcia D, Jares P, Gine E, Pinyol M, Royo C, Nadeu F, et al. (2013). Landscape of somatic mutations and clonal evolution in mantle cell lymphoma. Proc. Natl. Acad. Sci. U S A 110, 18250–18255. [DOI] [PMC free article] [PubMed] [Google Scholar]
- Bolotin DA, Poslavsky S, Davydov AN, Frenkel FE, Fanchi L, Zolotareva OI, Hemmers S, Putintseva EV, Obraztsova AS, Shugay M, et al. (2017). Antigen receptor repertoire profiling from RNA-seq data. Nat. Biotechnol 35, 908–911. [DOI] [PMC free article] [PubMed] [Google Scholar]
- Bouska A, Bi C, Lone W, Zhang W, Kedwaii A, Heavican T, Lachel CM, Yu J, Ferro R, Eldorghamy N, et al. (2017a). Adult high-grade B cell lymphoma with Burkitt lymphoma signature: genomic features and potential therapeutic targets. Blood 130, 1819–1831. [DOI] [PMC free article] [PubMed] [Google Scholar]
- Bouska A, Zhang W, Gong Q, Iqbal J, Scuto A, Vose J, Ludvigsen M, Fu K, Weisenburger DD, Greiner TC, et al. (2017b). Combined copy number and mutation analysis identifies oncogenic pathways associated with transformation of follicular lymphoma. Leukemia 31, 83–91. [DOI] [PMC free article] [PubMed] [Google Scholar]
- Braggio E, Van Wier S, Ojha J, McPhail E, Asmann YW, Egan J, da Silva JA, Schiff D, Lopes MB, Decker PA, et al. (2015). Genome-wide analysis uncovers novel recurrent alterations in primary central nervous system lymphomas. Clin. Cancer Res 21, 3986–3994. [DOI] [PMC free article] [PubMed] [Google Scholar]
- Bruno A, Boisselier B, Labreche K, Marie Y, Polivka M, Jouvet A, Adam C, Figarella-Branger D, Miquel C, Eimer S, et al. (2014). Mutational analysis of primary central nervous system lymphoma. Oncotarget 5, 5065–5075. [DOI] [PMC free article] [PubMed] [Google Scholar]
- Cao XX, Li J, Cai H, Zhang W, Duan MH, and Zhou DB (2017). Patients with primary breast and primary female genital tract diffuse large B cell lymphoma have a high frequency of MYD88 and CD79B mutations. Ann. Hematol 96, 1867–1871. [DOI] [PubMed] [Google Scholar]
- Cardinez C, Miraghazadeh B, Tanita K, da Silva E, Hoshino A, Okada S, Chand R, Asano T, Tsumura M, Yoshida K, et al. (2018). Gain-of-function IKBKB mutation causes human combined immune deficiency. J. Exp. Med 215, 2715–2724. [DOI] [PMC free article] [PubMed] [Google Scholar]
- Celeste A, Petersen S, Romanienko PJ, Fernandez-Capetillo O, Chen HT, Sedelnikova OA, Reina-San-Martin B, Coppola V, Meffre E, Difilippantonio MJ, et al. (2002). Genomic instability in mice lacking histone H2AX. Science 296, 922–927. [DOI] [PMC free article] [PubMed] [Google Scholar]
- Ceribelli M, Kelly PN, Shaffer AL, Wright GW, Xiao W, Yang Y, Mathews Griner LA, Guha R, Shinn P, Keller JM, et al. (2014). Blockade of oncogenic IkappaB kinase activity in diffuse large B cell lymphoma by bromodomain and extraterminal domain protein inhibitors. Proc. Natl. Acad. Sci. U S A 111, 11365–11370. [DOI] [PMC free article] [PubMed] [Google Scholar]
- Challa-Malladi M, Lieu YK, Califano O, Holmes AB, Bhagat G, Murty VV, Dominguez-Sola D, Pasqualucci L, and Dalla-Favera R (2011). Combined genetic inactivation of beta2-Microglobulin and CD58 reveals frequent escape from immune recognition in diffuse large B cell lymphoma. Cancer Cell 20, 728–740. [DOI] [PMC free article] [PubMed] [Google Scholar]
- Chapuy B, Roemer MG, Stewart C, Tan Y, Abo RP, Zhang L, Dunford AJ, Meredith DM, Thorner AR, Jordanova ES, et al. (2016). Targetable genetic features of primary testicular and primary central nervous system lymphomas. Blood 127, 869–881. [DOI] [PMC free article] [PubMed] [Google Scholar]
- Chapuy B, Stewart C, Dunford AJ, Kim J, Kamburov A, Redd RA, Lawrence MS, Roemer MGM, Li AJ, Ziepert M, et al. (2018). Molecular subtypes of diffuse large B cell lymphoma are associated with distinct pathogenic mechanisms and outcomes. Nat. Med 24, 679–690. [DOI] [PMC free article] [PubMed] [Google Scholar]
- Clipson A, Wang M, de Leval L, Ashton-Key M, Wotherspoon A, Vassiliou G, Bolli N, Grove C, Moody S, Escudero-Ibarz L, et al. (2015). KLF2 mutation is the most frequent somatic change in splenic marginal zone lymphoma and identifies a subset with distinct genotype. Leukemia 29, 1177–1185. [DOI] [PubMed] [Google Scholar]
- Crescenzo R, Abate F, Lasorsa E, Tabbo F, Gaudiano M, Chiesa N, Di Giacomo F, Spaccarotella E, Barbarossa L, Ercole E, et al. (2015). Convergent mutations and kinase fusions lead to oncogenic STAT3 activation in anaplastic large cell lymphoma. Cancer Cell 27, 516–532. [DOI] [PMC free article] [PubMed] [Google Scholar]
- Dang CV (2013). MYC, metabolism, cell growth, and tumorigenesis. Cold Spring Harbor Perspect. Med. 3, 10.1101/cshperspect.a014217. [DOI] [PMC free article] [PubMed] [Google Scholar]
- Dave SS, Fu K, Wright GW, Lam LT, Kluin P, Boerma EJ, Greiner TC, Weisenburger DD, Rosenwald A, Ott G, et al. (2006). Molecular diagnosis of Burkitt’s lymphoma. N. Engl. J. Med 354, 2431–2442. [DOI] [PubMed] [Google Scholar]
- Davis RE, Brown KD, Siebenlist U, and Staudt LM (2001). Constitutive nuclear factor kappa B activity is required for survival of activated B cell-like diffuse large B cell lymphoma cells. J. Exp. Med 194, 1861–1874. [DOI] [PMC free article] [PubMed] [Google Scholar]
- Davis RE, Ngo VN, Lenz G, Tolar P, Young RM, Romesser PB, Kohlhammer H, Lamy L, Zhao H, Yang Y, et al. (2010). Chronic active B cell-receptor signalling in diffuse large B cell lymphoma. Nature 463, 88–92. [DOI] [PMC free article] [PubMed] [Google Scholar]
- Denzin LK, and Cresswell P (1995). HLA-DM induces CLIP dissociation from MHC class II alpha beta dimers and facilitates peptide loading. Cell 82, 155–165. [DOI] [PubMed] [Google Scholar]
- Di Cristofano A (2017). SGK1: the dark side of PI3K signaling. Curr. Top. Dev. Biol 123, 49–71. [DOI] [PMC free article] [PubMed] [Google Scholar]
- Dogan I, Bertocci B, Vilmont V, Delbos F, Megret J, Storck S, Reynaud CA, and Weill JC (2009). Multiple layers of B cell memory with different effector functions. Nat. Immunol 10, 1292–1299. [DOI] [PubMed] [Google Scholar]
- Dominguez PM, Ghamlouch H, Rosikiewicz W, Kumar P, Beguelin W, Fontan L, Rivas MA, Pawlikowska P, Armand M, Mouly E, et al. (2018). TET2 deficiency causes germinal center hyperplasia, impairs plasma cell differentiation, and promotes B cell lymphomagenesis. Cancer Discov. 8, 1632–1653. [DOI] [PMC free article] [PubMed] [Google Scholar]
- Dominguez-Sola D, Victora GD, Ying CY, Phan RT, Saito M, Nussenzweig MC, and Dalla-Favera R (2012). The proto-oncogene MYC is required for selection in the germinal center and cyclic reentry. Nat. Immunol 13, 1083–1091. [DOI] [PMC free article] [PubMed] [Google Scholar]
- Ducharme O, Beylot-Barry M, Pham-Ledard A, Bohers E, Viailly PJ, Bandres T, Faur N, Frison E, Vergier B, Jardin F, et al. (2019). Mutations of the B cell receptor pathway confer chemoresistance in primary cutaneous diffuse large B cell lymphoma leg-type. J. Invest. Dermatol 139, 2334–2342.e8. [DOI] [PubMed] [Google Scholar]
- Ennishi D, Healy S, Bashashati A, Saberi S, Hother C, Mottok A, Chan FC, Chong L, Abraham L, Kridel R, et al. (2020). TMEM30A loss-of-function mutations drive lymphomagenesis and confer therapeutically exploitable vulnerability in B cell lymphoma. Nat. Med 10.1038/s41591-020-0757-z. [DOI] [PMC free article] [PubMed] [Google Scholar]
- Ennishi D, Jiang A, Boyle M, Collinge B, Grande BM, Ben-Neriah S, Rushton C, Tang J, Thomas N, Slack GW, et al. (2019a). Double-hit gene expression signature defines a distinct subgroup of germinal center B cell-like diffuse large B cell lymphoma. J. Clin. Oncol 37, 190–201. [DOI] [PMC free article] [PubMed] [Google Scholar]
- Ennishi D, Takata K, Beguelin W, Duns G, Mottok A, Farinha P, Bashashati A, Saberi S, Boyle M, Meissner B, et al. (2019b). Molecular and genetic characterization of MHC deficiency identifies EZH2 as therapeutic target for enhancing immune recognition. Cancer Discov. 9, 546–563. [DOI] [PubMed] [Google Scholar]
- Evan GI, Wyllie AH, Gilbert CS, Littlewood TD, Land H, Brooks M, Waters CM, Penn LZ, and Hancock DC (1992). Induction of apoptosis in fibroblasts by c-myc protein. Cell 69, 119–128. [DOI] [PubMed] [Google Scholar]
- Flossbach L, Antoneag E, Buck M, Siebert R, Mattfeldt T, Moller P, and Barth TF (2011). BCL6 gene rearrangement and protein expression are associated with large cell presentation of extranodal marginal zone B cell lymphoma of mucosa-associated lymphoid tissue. Int. J. Cancer 129, 70–77. [DOI] [PubMed] [Google Scholar]
- Fontanilles M, Marguet F, Bohers E, Viailly PJ, Dubois S, Bertrand P, Camus V, Mareschal S, Ruminy P, Maingonnat C, et al. (2017). Non-invasive detection of somatic mutations using next-generation sequencing in primary central nervous system lymphoma. Oncotarget 8, 48157–48168. [DOI] [PMC free article] [PubMed] [Google Scholar]
- Franco F, Gonzalez-Rincon J, Lavernia J, Garcia JF, Martin P, Bellas C, Piris MA, Pedrosa L, Miramon J, Gomez-Codina J, et al. (2017). Mutational profile of primary breast diffuse large B cell lymphoma. Oncotarget 8, 102888–102897. [DOI] [PMC free article] [PubMed] [Google Scholar]
- Fukumura K, Kawazu M, Kojima S, Ueno T, Sai E, Soda M, Ueda H, Yasuda T, Yamaguchi H, Lee J, et al. (2016). Genomic characterization of primary central nervous system lymphoma. Acta Neuropathol. 131, 865–875. [DOI] [PubMed] [Google Scholar]
- Ganapathi KA, Jobanputra V, Iwamoto F, Jain P, Chen J, Cascione L, Nahum O, Levy B, Xie Y, Khattar P, et al. (2016). The genetic landscape of dural marginal zone lymphomas. Oncotarget 7, 43052–43061. [DOI] [PMC free article] [PubMed] [Google Scholar]
- Goy A, Ramchandren R, Ghosh N, Munoz J, Morgan DS, Dang NH, Knapp M, Delioukina M, Kingsley E, Ping J, et al. (2019). Ibrutinib plus lenalidomide and rituximab has promising activity in relapsed/refractory non-germinal center B cell-like DLBCL. Blood 134, 1024–1036. [DOI] [PMC free article] [PubMed] [Google Scholar]
- Green MR, Gentles AJ, Nair RV, Irish JM, Kihira S, Liu CL, Kela I, Hopmans ES, Myklebust JH, Ji H, et al. (2013). Hierarchy in somatic mutations arising during genomic evolution and progression of follicular lymphoma. Blood 121, 1604–1611. [DOI] [PMC free article] [PubMed] [Google Scholar]
- Green MR, Kihira S, Liu CL, Nair RV, Salari R, Gentles AJ, Irish J, Stehr H, Vicente-Duenas C, Romero-Camarero I, et al. (2015). Mutations in early follicular lymphoma progenitors are associated with suppressed antigen presentation. Proc. Natl. Acad. Sci. U S A 112, E1116–E1125. [DOI] [PMC free article] [PubMed] [Google Scholar]
- Grommes C, Pastore A, Palaskas N, Tang SS, Campos C, Schartz D, Codega P, Nichol D, Clark O, Hsieh WY, et al. (2017). Ibrutinib unmasks critical role of bruton tyrosine kinase in primary CNS lymphoma. Cancer Discov. 7, 1018–1029. [DOI] [PMC free article] [PubMed] [Google Scholar]
- Hartmann S, Schuhmacher B, Rausch T, Fuller L, Doring C, Weniger M, Lollies A, Weiser C, Thurner L, Rengstl B, et al. (2016). Highly recurrent mutations of SGK1, DUSP2 and JUNB in nodular lymphocyte predominant Hodgkin lymphoma. Leukemia 30, 844–853. [DOI] [PubMed] [Google Scholar]
- Hattori K, Sakata-Yanagimoto M, Kusakabe M, Nanmoku T, Suehara Y, Matsuoka R, Noguchi M, Yokoyama Y, Kato T, Kurita N, et al. (2019). Genetic evidence implies that primary and relapsed tumors arise from common precursor cells in primary central nervous system lymphoma. Cancer Sci. 110, 401–407. [DOI] [PMC free article] [PubMed] [Google Scholar]
- Hattori K, Sakata-Yanagimoto M, Okoshi Y, Goshima Y, Yanagimoto S, Nakamoto-Matsubara R, Sato T, Noguchi M, Takano S, Ishikawa E, et al. (2017). MYD88 (L265P) mutation is associated with an unfavourable outcome of primary central nervous system lymphoma. Br. J. Haematol 177, 492–494. [DOI] [PubMed] [Google Scholar]
- Havranek O, Xu J, Kohrer S, Wang Z, Becker L, Comer JM, Henderson J, Ma W, Man Chun Ma J, Westin JR, et al. (2017). Tonic B cell receptor signaling in diffuse large B cell lymphoma. Blood 130, 995–1006. [DOI] [PMC free article] [PubMed] [Google Scholar]
- Heise N, De Silva NS, Silva K, Carette A, Simonetti G, Pasparakis M, and Klein U. (2014). Germinal center B cell maintenance and differentiation are controlled by distinct NF-kappaB transcription factor subunits. J. Exp. Med 211, 2103–2118. [DOI] [PMC free article] [PubMed] [Google Scholar]
- Hellmuth JC, Louissaint A Jr., Szczepanowski M, Haebe S, Pastore A, Alig S, Staiger AM, Hartmann S, Kridel R, Ducar MD, et al. (2018). Duodenal-type and nodal follicular lymphomas differ by their immune microenvironment rather than their mutation profiles. Blood 132, 1695–1702. [DOI] [PubMed] [Google Scholar]
- Hickmann AK, Frick M, Hadaschik D, Battke F, Bittl M, Ganslandt O, Biskup S, and Docker D (2019). Molecular tumor analysis and liquid biopsy: a feasibility investigation analyzing circulating tumor DNA in patients with central nervous system lymphomas. BMC Cancer 19, 192. [DOI] [PMC free article] [PubMed] [Google Scholar]
- Hilton L, Tang J, Ben-Neriah S, Alcaide M, Jiang A, Grande BM, Rushton C, Boyle M, Meissner B, Scott D, and Morin RD (2019). The double hit signature identifies double-hit diffuse large B cell lymphoma with genetic events cryptic to FISH. Blood 134, 1528–1532. [DOI] [PMC free article] [PubMed] [Google Scholar]
- Hodson DJ, Shaffer AL, Xiao W, Wright GW, Schmitz R, Phelan JD, Yang Y, Webster DE, Rui L, Kohlhammer H, et al. (2016). Regulation of normal B cell differentiation and malignant B cell survival by OCT2. Proc. Natl. Acad. Sci. U S A 113, E2039–E2046. [DOI] [PMC free article] [PubMed] [Google Scholar]
- Hyeon J, Lee B, Shin SH, Yoo HY, Kim SJ, Kim WS, Park WY, and Ko YH (2018). Targeted deep sequencing of gastric marginal zone lymphoma identified alterations of TRAF3 and TNFAIP3 that were mutually exclusive for MALT1 rearrangement. Mod. Pathol 31, 1418–1428. [DOI] [PubMed] [Google Scholar]
- Johansson P, Klein-Hitpass L, Grabellus F, Arnold G, Klapper W, Pfortner R, Duhrsen U, Eckstein A, Durig J, and Kuppers R (2016). Recurrent mutations in NF-kappaB pathway components, KMT2D, and NOTCH1/2 in ocular adnexal MALT-type marginal zone lymphomas. Oncotarget 7, 62627–62639. [DOI] [PMC free article] [PubMed] [Google Scholar]
- Kelly PN, Romero DL, Yang Y, Shaffer AL 3rd, Chaudhary D, Robinson S, Miao W, Rui L, Westlin WF, Kapeller R, and Staudt LM (2015). Selective interleukin-1 receptor-associated kinase 4 inhibitors for the treatment of autoimmune disorders and lymphoid malignancy. J. Exp. Med 212, 2189–2201. [DOI] [PMC free article] [PubMed] [Google Scholar]
- Kiel MJ, Velusamy T, Betz BL, Zhao L, Weigelin HG, Chiang MY, Huebner-Chan DR, Bailey NG, Yang DT, Bhagat G, et al. (2012). Whole-genome sequencing identifies recurrent somatic NOTCH2 mutations in splenic marginal zone lymphoma. J. Exp. Med 209, 1553–1565. [DOI] [PMC free article] [PubMed] [Google Scholar]
- Kraan W, van Keimpema M, Horlings HM, Schilder-Tol EJ, Oud ME, Noorduyn LA, Kluin PM, Kersten MJ, Spaargaren M, and Pals ST (2014). High prevalence of oncogenic MYD88 and CD79B mutations in primary testicular diffuse large B cell lymphoma. Leukemia 28, 719–720. [DOI] [PubMed] [Google Scholar]
- Krysiak K, Gomez F, White BS, Matlock M, Miller CA, Trani L, Fronick CC, Fulton RS, Kreisel F, Cashen AF, et al. (2017). Recurrent somatic mutations affecting B cell receptor signaling pathway genes in follicular lymphoma. Blood 129, 473–483. [DOI] [PMC free article] [PubMed] [Google Scholar]
- Kuppers R, Duhrsen U, and Hansmann ML (2014). Pathogenesis, diagnosis, and treatment of composite lymphomas. Lancet Oncol. 15, e435–e446. [DOI] [PubMed] [Google Scholar]
- Lam LT, Wright G, Davis RE, Lenz G, Farinha P, Dang L, Chan JW, Rosenwald A, Gascoyne RD, and Staudt LM (2008). Cooperative signaling through the signal transducer and activator of transcription 3 and nuclear factor-{kappa}B pathways in subtypes of diffuse large B cell lymphoma. Blood 111, 3701–3713. [DOI] [PMC free article] [PubMed] [Google Scholar]
- Landau DA, Sun C, Rosebrock D, Herman SEM, Fein J, Sivina M, Underbayev C, Liu D, Hoellenriegel J, Ravichandran S, et al. (2017). The evolutionary landscape of chronic lymphocytic leukemia treated with ibrutinib targeted therapy. Nat. Commun 8, 2185. [DOI] [PMC free article] [PubMed] [Google Scholar]
- Landau DA, Tausch E, Taylor-Weiner AN, Stewart C, Reiter JG, Bahlo J, Kluth S, Bozic I, Lawrence M, Bottcher S, et al. (2015). Mutations driving CLL and their evolution in progression and relapse. Nature 526, 525–530. [DOI] [PMC free article] [PubMed] [Google Scholar]
- Lenz G, Wright G, Dave SS, Xiao W, Powell J, Zhao H, Xu W, Tan B, Goldschmidt N, Iqbal J, et al. (2008a). Stromal gene signatures in large-B cell lymphomas. N. Engl. J. Med 359, 2313–2323. [DOI] [PMC free article] [PubMed] [Google Scholar]
- Lenz G, Wright GW, Emre NC, Kohlhammer H, Dave SS, Davis RE, Carty S, Lam LT, Shaffer AL, Xiao W, et al. (2008b). Molecular subtypes of diffuse large B cell lymphoma arise by distinct genetic pathways. Proc. Natl. Acad. Sci. U S A 105, 13520–13525. [DOI] [PMC free article] [PubMed] [Google Scholar]
- Linossi EM, and Nicholson SE (2015). Kinase inhibition, competitive binding and proteasomal degradation: resolving the molecular function of the suppressor of cytokine signaling (SOCS) proteins. Immunol. Rev 266, 123–133. [DOI] [PubMed] [Google Scholar]
- Lionakis MS, Dunleavy K, Roschewski M, Widemann BC, Butman JA, Schmitz R, Yang Y, Cole DE, Melani C, Higham CS, et al. (2017). Inhibition of B cell receptor signaling by ibrutinib in primary CNS lymphoma. Cancer Cell 31, 833–843 e5. [DOI] [PMC free article] [PubMed] [Google Scholar]
- Ljungstrom V, Cortese D, Young E, Pandzic T, Mansouri L, Plevova K, Ntoufa S, Baliakas P, Clifford R, Sutton LA, et al. (2016). Whole-exome sequencing in relapsing chronic lymphocytic leukemia: clinical impact of recurrent RPS15 mutations. Blood 127, 1007–1016. [DOI] [PMC free article] [PubMed] [Google Scholar]
- Love C, Sun Z, Jima D, Li G, Zhang J, Miles R, Richards KL, Dunphy CH, Choi WW, Srivastava G, et al. (2012). The genetic landscape of mutations in Burkitt lymphoma. Nat. Genet 44, 1321–1325. [DOI] [PMC free article] [PubMed] [Google Scholar]
- Lu D, Liu L, Ji X, Gao Y, Chen X, Liu Y, Liu Y, Zhao X, Li Y, Li Y, et al. (2015). The phosphatase DUSP2 controls the activity of the transcription activator STAT3 and regulates TH17 differentiation. Nat. Immunol 16, 1263–1273. [DOI] [PubMed] [Google Scholar]
- Lu E, Wolfreys FD, Muppidi JR, Xu Y, and Cyster JG (2019). S-Geranylgeranyl-L-glutathione is a ligand for human B cell-confinement receptor P2RY8. Nature 567, 244–248. [DOI] [PMC free article] [PubMed] [Google Scholar]
- Malecka A, Troen G, Tierens A, Ostlie I, Malecki J, Randen U, Wang J, Berentsen S, Tjonnfjord GE, and Delabie JMA (2018). Frequent somatic mutations of KMT2D (MLL2) and CARD11 genes in primary cold agglutinin disease. Br. J. Haematol 183, 838–842. [DOI] [PubMed] [Google Scholar]
- Mareschal S, Pham-Ledard A, Viailly PJ, Dubois S, Bertrand P, Maingonnat C, Fontanilles M, Bohers E, Ruminy P, Tournier I, et al. (2017). Identification of somatic mutations in primary cutaneous diffuse large B cell lymphoma, leg type by massive parallel sequencing. J. Invest. Dermatol 137, 1984–1994. [DOI] [PubMed] [Google Scholar]
- Martinez N, Almaraz C, Vaque JP, Varela I, Derdak S, Beltran S, Mollejo M, Campos-Martin Y, Agueda L, Rinaldi A, et al. (2014). Whole-exome sequencing in splenic marginal zone lymphoma reveals mutations in genes involved in marginal zone differentiation. Leukemia 28, 1334–1340. [DOI] [PubMed] [Google Scholar]
- Mathews Griner LA, Guha R, Shinn P, Young RM, Keller JM, Liu D, Goldlust IS, Yasgar A, McKnight C, Boxer MB, et al. (2014). High-throughput combinatorial screening identifies drugs that cooperate with ibrutinib to kill activated B cell-like diffuse large B cell lymphoma cells. Proc. Natl. Acad. Sci. U S A 111, 2349–2354. [DOI] [PMC free article] [PubMed] [Google Scholar]
- Matsushita H, Vesely MD, Koboldt DC, Rickert CG, Uppaluri R, Magrini VJ, Arthur CD, White JM, Chen YS, Shea LK, et al. (2012). Cancer exome analysis reveals a T cell-dependent mechanism of cancer immunoediting. Nature 482, 400–404. [DOI] [PMC free article] [PubMed] [Google Scholar]
- Milpied P, Cervera-Marzal I, Mollichella ML, Tesson B, Brisou G, Traverse-Glehen A, Salles G, Spinelli L, and Nadel B (2018). Human germinal center transcriptional programs are de-synchronized in B cell lymphoma. Nat. Immunol 19, 1013–1024. [DOI] [PubMed] [Google Scholar]
- Mintz MA, Felce JH, Chou MY, Mayya V, Xu Y, Shui JW, An J, Li Z, Marson A, Okada T, et al. (2019). The HVEM-BTLA axis restrains T cell help to germinal center B cells and functions as a cell-extrinsic suppressor in lymphomagenesis. Immunity 51, 310–323.e7. [DOI] [PMC free article] [PubMed] [Google Scholar]
- Mittal SK, and Roche PA (2015). Suppression of antigen presentation by IL-10. Curr. Opin. Immunol 34, 22–27. [DOI] [PMC free article] [PubMed] [Google Scholar]
- Mlynarczyk C, Fontan L, and Melnick A (2019). Germinal center-derived lymphomas: the darkest side of humoral immunity. Immunol. Rev 288, 214–239. [DOI] [PMC free article] [PubMed] [Google Scholar]
- Monti S, Chapuy B, Takeyama K, Rodig SJ, Hao Y, Yeda KT, Inguilizian H, Mermel C, Currie T, Dogan A, et al. (2012). Integrative analysis reveals an outcome-associated and targetable pattern of p53 and cell cycle deregulation in diffuse large B cell lymphoma. Cancer Cell 22, 359–372. [DOI] [PMC free article] [PubMed] [Google Scholar]
- Muppidi JR, Schmitz R, Green JA, Xiao W, Larsen AB, Braun SE, An J, Xu Y, Rosenwald A, Ott G, et al. (2014). Loss of signalling via Galpha13 in germinal centre B cell-derived lymphoma. Nature 516, 254–258. [DOI] [PMC free article] [PubMed] [Google Scholar]
- Nakamura T, Tateishi K, Niwa T, Matsushita Y, Tamura K, Kinoshita M, Tanaka K, Fukushima S, Takami H, Arita H, et al. (2016). Recurrent mutations of CD79B and MYD88 are the hallmark of primary central nervous system lymphomas. Neuropathol. Appl. Neurobiol 42, 279–290. [DOI] [PubMed] [Google Scholar]
- Ngo VN, Young RM, Schmitz R, Jhavar S, Xiao W, Lim KH, Kohlhammer H, Xu W, Yang Y, Zhao H, et al. (2011). Oncogenically active MYD88 mutations in human lymphoma. Nature 470, 115–119. [DOI] [PMC free article] [PubMed] [Google Scholar]
- Nogai H, Wenzel SS, Hailfinger S, Grau M, Kaergel E, Seitz V, Wollert-Wulf B, Pfeifer M, Wolf A, Frick M, et al. (2013). IkappaB-zeta controls the constitutive NF-kappaB target gene network and survival of ABC DLBCL. Blood 122, 2242–2250. [DOI] [PubMed] [Google Scholar]
- Okosun J, Bodor C, Wang J, Araf S, Yang CY, Pan C, Boller S, Cittaro D, Bozek M, Iqbal S, et al. (2014). Integrated genomic analysis identifies recurrent mutations and evolution patterns driving the initiation and progression of follicular lymphoma. Nat. Genet 46, 176–181. [DOI] [PMC free article] [PubMed] [Google Scholar]
- Okosun J, Wolfson RL, Wang J, Araf S, Wilkins L, Castellano BM, Escudero-Ibarz L, Al Seraihi AF, Richter J, Bernhart SH, et al. (2016). Recurrent mTORC1-activating RRAGC mutations in follicular lymphoma. Nat. Genet 48, 183–188. [DOI] [PMC free article] [PubMed] [Google Scholar]
- Parry M, Rose-Zerilli MJ, Gibson J, Ennis S, Walewska R, Forster J, Parker H, Davis Z, Gardiner A, Collins A, et al. (2013). Whole exome sequencing identifies novel recurrently mutated genes in patients with splenic marginal zone lymphoma. PLoS One 8, e83244. [DOI] [PMC free article] [PubMed] [Google Scholar]
- Parry M, Rose-Zerilli MJ, Ljungstrom V, Gibson J, Wang J, Walewska R, Parker H, Parker A, Davis Z, Gardiner A, et al. (2015). Genetics and prognostication in splenic marginal zone lymphoma: revelations from deep sequencing. Clin. Cancer Res 21, 4174–4183. [DOI] [PMC free article] [PubMed] [Google Scholar]
- Pasqualucci L, and Dalla-Favera R (2018). Genetics of diffuse large B cell lymphoma. Blood 131, 2307–2319. [DOI] [PMC free article] [PubMed] [Google Scholar]
- Pasqualucci L, Khiabanian H, Fangazio M, Vasishtha M, Messina M, Holmes AB, Ouillette P, Trifonov V, Rossi D, Tabbo F, et al. (2014). Genetics of follicular lymphoma transformation. Cell Rep. 6, 130–140. [DOI] [PMC free article] [PubMed] [Google Scholar]
- Pfeifer M, Grau M, Lenze D, Wenzel SS, Wolf A, Wollert-Wulf B, Dietze K, Nogai H, Storek B, Madle H, et al. (2013). PTEN loss defines a PI3K/AKT pathway-dependent germinal center subtype of diffuse large B cell lymphoma. Proc. Natl. Acad. Sci. U S A 110, 12420–12425. [DOI] [PMC free article] [PubMed] [Google Scholar]
- Phelan JD, Young RM, Webster DE, Roulland S, Wright GW, Kasbekar M, Shaffer AL 3rd, Ceribelli M, Wang JQ, Schmitz R, et al. (2018). A multiprotein supercomplex controlling oncogenic signalling in lymphoma. Nature 560, 387–391. [DOI] [PMC free article] [PubMed] [Google Scholar]
- Phillips TJ, Forero-Torres A, Sher T, Diefenbach CS, Johnston P, Talpaz M, Pulini J, Zhou L, Scherle P, Chen X, and Barr PM (2018). Phase 1 study of the PI3Kdelta inhibitor INCB040093 +/− JAK1 inhibitor itacitinib in relapsed/refractory B cell lymphoma. Blood 132, 293–306. [DOI] [PMC free article] [PubMed] [Google Scholar]
- Pillonel V, Juskevicius D, Ng CKY, Bodmer A, Zettl A, Jucker D, Dirnhofer S, and Tzankov A (2018). High-throughput sequencing of nodal marginal zone lymphomas identifies recurrent BRAF mutations. Leukemia 32, 2412–2426. [DOI] [PMC free article] [PubMed] [Google Scholar]
- Puente XS, Bea S, Valdes-Mas R, Villamor N, Gutierrez-Abril J, Martin-Subero JI, Munar M, Rubio-Perez C, Jares P, Aymerich M, et al. (2015). Non-coding recurrent mutations in chronic lymphocytic leukaemia. Nature 526, 519–524. [DOI] [PubMed] [Google Scholar]
- Quesada V, Conde L, Villamor N, Ordonez GR, Jares P, Bassaganyas L, Ramsay AJ, Bea S, Pinyol M, Martinez-Trillos A, et al. (2011). Exome sequencing identifies recurrent mutations of the splicing factor SF3B1 gene in chronic lymphocytic leukemia. Nat. Genet 44, 47–52. [DOI] [PubMed] [Google Scholar]
- Richter J, Schlesner M, Hoffmann S, Kreuz M, Leich E, Burkhardt B, Rosolowski M, Ammerpohl O, Wagener R, Bernhart SH, et al. (2012). Recurrent mutation of the ID3 gene in Burkitt lymphoma identified by integrated genome, exome and transcriptome sequencing. Nat. Genet 44, 1316–1320. [DOI] [PubMed] [Google Scholar]
- Rosenwald A, Wright G, Chan WC, Connors JM, Campo E, Fisher RI, Gascoyne RD, Muller-Hermelink HK, Smeland EB, Giltnane JM, et al. (2002). The use of molecular profiling to predict survival after chemotherapy for diffuse large-B cell lymphoma. N. Engl. J. Med 346, 1937–1947. [DOI] [PubMed] [Google Scholar]
- Rossi D, Trifonov V, Fangazio M, Bruscaggin A, Rasi S, Spina V, Monti S, Vaisitti T, Arruga F, Fama R, et al. (2012). The coding genome of splenic marginal zone lymphoma: activation of NOTCH2 and other pathways regulating marginal zone development. J. Exp. Med 209, 1537–1551. [DOI] [PMC free article] [PubMed] [Google Scholar]
- Rui L, Drennan AC, Ceribelli M, Zhu F, Wright GW, Huang DW, Xiao W, Li Y, Grindle KM, Lu L, et al. (2016). Epigenetic gene regulation by Janus kinase 1 in diffuse large B cell lymphoma. Proc. Natl. Acad. Sci. U S A 113, E7260–E7267. [DOI] [PMC free article] [PubMed] [Google Scholar]
- Saito T, Chiba S, Ichikawa M, Kunisato A, Asai T, Shimizu K, Yamaguchi T, Yamamoto G, Seo S, Kumano K, et al. (2003). Notch2 is preferentially expressed in mature B cells and indispensable for marginal zone B lineage development. Immunity 18, 675–685. [DOI] [PubMed] [Google Scholar]
- Scherer F, Kurtz DM, Newman AM, Stehr H, Craig AF, Esfahani MS, Lovejoy AF, Chabon JJ, Klass DM, Liu CL, et al. (2016). Distinct biological subtypes and patterns of genome evolution in lymphoma revealed by circulating tumor DNA. Sci. Transl. Med 8, 364ra155. [DOI] [PMC free article] [PubMed] [Google Scholar]
- Schmitz R, Wright GW, Huang DW, Johnson CA, Phelan JD, Wang JQ, Roulland S, Kasbekar M, Young RM, Shaffer AL, et al. (2018). Genetics and pathogenesis of diffuse large B cell lymphoma. N. Engl. J. Med 378, 1396–1407. [DOI] [PMC free article] [PubMed] [Google Scholar]
- Schmitz R, Young RM, Ceribelli M, Jhavar S, Xiao W, Zhang M, Wright G, Shaffer AL, Hodson DJ, Buras E, et al. (2012). Burkitt lymphoma pathogenesis and therapeutic targets from structural and functional genomics. Nature 490, 116–120. [DOI] [PMC free article] [PubMed] [Google Scholar]
- Schrader AMR, Jansen PM, Willemze R, Vermeer MH, Cleton-Jansen AM, Somers SF, Veelken H, van Eijk R, Kraan W, Kersten MJ, et al. (2018). High prevalence of MYD88 and CD79B mutations in intravascular large B cell lymphoma. Blood 131, 2086–2089. [DOI] [PubMed] [Google Scholar]
- Schuhmacher B, Bein J, Rausch T, Benes V, Tousseyn T, Vornanen M, Ponzoni M, Thurner L, Gascoyne R, Steidl C, et al. (2019). JUNB, DUSP2, SGK1, SOCS1 and CREBBP are frequently mutated in T cell/histiocyte-rich large B cell lymphoma. Haematologica 104, 330–337. [DOI] [PMC free article] [PubMed] [Google Scholar]
- Sciammas R, Shaffer AL, Schatz JH, Zhao H, Staudt LM, and Singh H (2006). Graded expression of interferon regulatory factor-4 coordinates iso-type switching with plasma cell differentiation. Immunity 25, 225–236. [DOI] [PubMed] [Google Scholar]
- Scott DW, Mottok A, Ennishi D, Wright GW, Farinha P, Ben-Neriah S, Kridel R, Barry GS, Hother C, Abrisqueta P, et al. (2015). Prognostic significance of diffuse large B cell lymphoma cell of origin determined by digital gene expression in formalin-fixed paraffin-embedded tissue biopsies. J. Clin. Oncol 33, 2848–2856. [DOI] [PMC free article] [PubMed] [Google Scholar]
- Sha C, Barrans S, Cucco F, Bentley MA, Care MA, Cummin T, Kennedy H, Thompson JS, Uddin R, Worrillow L, et al. (2019). Molecular high-grade B cell lymphoma: defining a poor-risk group that requires different approaches to therapy. J. Clin. Oncol 37, 202–212. [DOI] [PMC free article] [PubMed] [Google Scholar]
- Shaffer AL, Wright G, Yang L, Powell J, Ngo V, Lamy L, Lam LT, Davis RE, and Staudt LM (2006). A library of gene expression signatures to illuminate normal and pathological lymphoid biology. Immunological Rev. 210, 67–85. [DOI] [PubMed] [Google Scholar]
- Shechter R, London A, and Schwartz M (2013). Orchestrated leukocyte recruitment to immune-privileged sites: absolute barriers versus educational gates. Nat. Rev. Immunol 13, 206–218. [DOI] [PubMed] [Google Scholar]
- Shin SH, Kim YJ, Lee D, Cho D, Ko YH, Cho J, Park WY, Park D, Kim SJ, and Kim WS (2019). Analysis of circulating tumor DNA by targeted ultra-deep sequencing across various non-Hodgkin lymphoma subtypes. Leuk. Lymphoma 60, 2237–2246. [DOI] [PubMed] [Google Scholar]
- Singh M, Jackson KJL, Wang JJ, Schofield P, Field MA, Koppstein D, Peters TJ, Burnett DL, Rizzetto S, Nevoltris D, et al. (2020). Lymphoma driver mutations in the pathogenic evolution of an iconic human autoantibody. Cell 180, 878–894.e19. [DOI] [PubMed] [Google Scholar]
- Spina V, Khiabanian H, Messina M, Monti S, Cascione L, Bruscaggin A, Spaccarotella E, Holmes AB, Arcaini L, Lucioni M, et al. (2016). The genetics of nodal marginal zone lymphoma. Blood 128, 1362–1373. [DOI] [PMC free article] [PubMed] [Google Scholar]
- Steidl C, Shah SP, Woolcock BW, Rui L, Kawahara M, Farinha P, Johnson NA, Zhao Y, Telenius A, Neriah SB, et al. (2011). MHC class II transactivator CIITA is a recurrent gene fusion partner in lymphoid cancers. Nature 471, 377–381. [DOI] [PMC free article] [PubMed] [Google Scholar]
- Suan D, Krautler NJ, Maag JLV, Butt D, Bourne K, Hermes JR, Avery DT, Young C, Statham A, Elliott M, et al. (2017). CCR6 defines memory B cell precursors in mouse and human germinal centers, revealing light-zone location and predominant low antigen affinity. Immunity 47, 1142–1153.e4. [DOI] [PubMed] [Google Scholar]
- Suehara Y, Sakata-Yanagimoto M, Hattori K, Nanmoku T, Itoh T, Kaji D, Yamamoto G, Abe Y, Narita K, Takeuchi M, et al. (2018). Liquid biopsy for the identification of intravascular large B cell lymphoma. Haematologica 103, e241–e244. [DOI] [PMC free article] [PubMed] [Google Scholar]
- Tallen G, and Riabowol K (2014). Keep-ING balance: tumor suppression by epigenetic regulation. FEBS Lett. 588, 2728–2742. [DOI] [PubMed] [Google Scholar]
- Timens W, Visser L, and Poppema S (1986). Nodular lymphocyte predominance type of Hodgkin’s disease is a germinal center lymphoma. Lab. Invest 54, 457–461. [PubMed] [Google Scholar]
- Tsukamoto T, Nakano M, Sato R, Adachi H, Kiyota M, Kawata E, Uoshima N, Yasukawa S, Chinen Y, Mizutani S, et al. (2017). High-risk follicular lymphomas harbour more somatic mutations including those in the AID-motif. Sci. Rep 7, 14039. [DOI] [PMC free article] [PubMed] [Google Scholar]
- Vater I, Montesinos-Rongen M, Schlesner M, Haake A, Purschke F, Sprute R, Mettenmeyer N, Nazzal I, Nagel I, Gutwein J, et al. (2015). The mutational pattern of primary lymphoma of the central nervous system determined by whole-exome sequencing. Leukemia 29, 677–685. [DOI] [PubMed] [Google Scholar]
- Wang L, Lawrence MS, Wan Y, Stojanov P, Sougnez C, Stevenson K, Werner L, Sivachenko A, DeLuca DS, Zhang L, et al. (2011). SF3B1 and other novel cancer genes in chronic lymphocytic leukemia. N. Engl. J. Med 365, 2497–2506. [DOI] [PMC free article] [PubMed] [Google Scholar]
- Webster DE, Roulland S, and Phelan JD (2019). Protocols for CRISPR-cas9 screening in lymphoma cell lines. Methods Mol. Biol 1956, 337–350. [DOI] [PubMed] [Google Scholar]
- Weinstein JS, Herman EI, Lainez B, Licona-Limon P, Esplugues E, Flavell R, and Craft J (2016). TFH cells progressively differentiate to regulate the germinal center response. Nat. Immunol 17, 1197–1205. [DOI] [PMC free article] [PubMed] [Google Scholar]
- Wilson WH, Popplewell LL, Phillips T, Kimball AS, Chhabra S, Ping J, Neuenburg J, Cavazos N, Staudt LM, and de Vos S (2015a). Multicenter phase 1b dose-escalation study of ibrutinib and lenalidomide combined with dose-adjusted EPOCH-R in patients with relapsed/refractory DLBCL. Blood 126, 1527.26224645 [Google Scholar]
- Wilson WH, Young RM, Schmitz R, Yang Y, Pittaluga S, Wright G, Lih CJ, Williams PM, Shaffer AL, Gerecitano J, et al. (2015b). Targeting B cell receptor signaling with ibrutinib in diffuse large B cell lymphoma. Nat. Med 21, 922–926. [DOI] [PMC free article] [PubMed] [Google Scholar]
- Wu C, de Miranda NF, Chen L, Wasik AM, Mansouri L, Jurczak W, Galazka K, Dlugosz-Danecka M, Machaczka M, Zhang H, et al. (2016). Genetic heterogeneity in primary and relapsed mantle cell lymphomas: impact of recurrent CARD11 mutations. Oncotarget 7, 38180–38190. [DOI] [PMC free article] [PubMed] [Google Scholar]
- Yang Y, Shaffer AL 3rd, Emre NC, Ceribelli M, Zhang M, Wright G, Xiao W, Powell J, Platig J, Kohlhammer H, et al. (2012). Exploiting synthetic lethality for the therapy of ABC diffuse large B cell lymphoma. Cancer Cell 21, 723–737. [DOI] [PMC free article] [PubMed] [Google Scholar]
- Ye H, Remstein ED, Bacon CM, Nicholson AG, Dogan A, and Du MQ (2008). Chromosomal translocations involving BCL6 in MALT lymphoma. Haematologica 93, 145–146. [DOI] [PubMed] [Google Scholar]
- Yonese I, Takase H, Yoshimori M, Onozawa E, Tsuzura A, Miki T, Mochizuki M, Miura O, and Arai A (2019). CD79B mutations in primary vitreoretinal lymphoma: diagnostic and prognostic potential. Eur. J. Haematol 102, 191–196. [DOI] [PubMed] [Google Scholar]
- Young RM, Phelan JD, Wilson WH, and Staudt LM (2019). Pathogenic B cell receptor signaling in lymphoid malignancies: new insights to improve treatment. Immunological Rev. 291, 190–213. [DOI] [PMC free article] [PubMed] [Google Scholar]
- Young RM, Wu T, Schmitz R, Dawood M, Xiao W, Phelan JD, Xu W, Menard L, Meffre E, Chan WC, et al. (2015). Survival of human lymphoma cells requires B cell receptor engagement by self-antigens. Proc. Natl. Acad. Sci. U S A 112, 13447–13454. [DOI] [PMC free article] [PubMed] [Google Scholar]
- Zamo A, Pischimarov J, Schlesner M, Rosenstiel P, Bomben R, Horn H, Grieb T, Nedeva T, Lopez C, Haake A, et al. (2018). Differences between BCL2-break positive and negative follicular lymphoma unraveled by whole-exome sequencing. Leukemia 32, 685–693. [DOI] [PubMed] [Google Scholar]
- Zeller KI, Zhao X, Lee CW, Chiu KP, Yao F, Yustein JT, Ooi HS, Orlov YL, Shahab A, Yong HC, et al. (2006). Global mapping of c-Myc binding sites and target gene networks in human B cells. Proc. Natl. Acad. Sci. U S A 103, 17834–17839. [DOI] [PMC free article] [PubMed] [Google Scholar]
- Zhang J, Jima D, Moffitt AB, Liu Q, Czader M, Hsi ED, Fedoriw Y, Dunphy CH, Richards KL, Gill JI, et al. (2014). The genomic landscape of mantle cell lymphoma is related to the epigenetically determined chromatin state of normal B cells. Blood 123, 2988–2996. [DOI] [PMC free article] [PubMed] [Google Scholar]
- Zhou XA, Louissaint A Jr., Wenzel A, Yang J, Martinez-Escala ME, Moy AP, Morgan EA, Paxton CN, Hong B, Andersen EF, et al. (2018a). Genomic analyses identify recurrent alterations in immune evasion genes in diffuse large B cell lymphoma, leg type. J. Invest. Dermatol 138, 2365–2376. [DOI] [PMC free article] [PubMed] [Google Scholar]
- Zhou Y, Liu W, Xu Z, Zhu H, Xiao D, Su W, Zeng R, Feng Y, Duan Y, Zhou J, and Zhong M (2018b). Analysis of genomic alteration in primary central nervous system lymphoma and the expression of some related genes. Neoplasia 20, 1059–1069. [DOI] [PMC free article] [PubMed] [Google Scholar]
Associated Data
This section collects any data citations, data availability statements, or supplementary materials included in this article.
Supplementary Materials
Data Availability Statement
Targeted resequencing data from the BCC cohort are available at the European Genome-Phenome Archive (EGA; https://ega-archive.org/) under accession EGAS00001002657. LymphGen code is available at https://doi.org/10.5281/zenodo.3700087.