

Abstract
Background
Physical activity among children and adolescents is associated with lower adiposity, improved cardio‐metabolic health, and improved fitness. Worldwide, fewer than 30% of children and adolescents meet global physical activity recommendations of at least 60 minutes of moderate to vigorous physical activity per day. Schools may be ideal sites for interventions given that children and adolescents in most parts of the world spend a substantial amount of time in transit to and from school or attending school.
Objectives
The purpose of this review update is to summarise the evidence on effectiveness of school‐based interventions in increasing moderate to vigorous physical activity and improving fitness among children and adolescents 6 to 18 years of age.
Specific objectives are:
• to evaluate the effects of school‐based interventions on increasing physical activity and improving fitness among children and adolescents;
• to evaluate the effects of school‐based interventions on improving body composition; and
• to determine whether certain combinations or components (or both) of school‐based interventions are more effective than others in promoting physical activity and fitness in this target population.
Search methods
We searched CENTRAL, MEDLINE, Embase, CINAHL, PsycINFO, BIOSIS, SPORTDiscus, and Sociological Abstracts to 1 June 2020, without language restrictions. We screened reference lists of included articles and relevant systematic reviews. We contacted primary authors of studies to ask for additional information.
Selection criteria
Eligible interventions were relevant to public health practice (i.e. were not delivered by a clinician), were implemented in the school setting, and aimed to increase physical activity among all school‐attending children and adolescents (aged 6 to 18) for at least 12 weeks. The review was limited to randomised controlled trials. For this update, we have added two new criteria: the primary aim of the study was to increase physical activity or fitness, and the study used an objective measure of physical activity or fitness. Primary outcomes included proportion of participants meeting physical activity guidelines and duration of moderate to vigorous physical activity and sedentary time (new to this update). Secondary outcomes included measured body mass index (BMI), physical fitness, health‐related quality of life (new to this update), and adverse events (new to this update). Television viewing time, blood cholesterol, and blood pressure have been removed from this update.
Data collection and analysis
Two independent review authors used standardised forms to assess each study for relevance, to extract data, and to assess risk of bias. When discrepancies existed, discussion occurred until consensus was reached. Certainty of evidence was assessed according to GRADE. A random‐effects meta‐analysis based on the inverse variance method was conducted with participants stratified by age (children versus adolescents) when sufficient data were reported. Subgroup analyses explored effects by intervention type.
Main results
Based on the three new inclusion criteria, we excluded 16 of the 44 studies included in the previous version of this review. We screened an additional 9968 titles (search October 2011 to June 2020), of which 978 unique studies were potentially relevant and 61 met all criteria for this update. We included a total of 89 studies representing complete data for 66,752 study participants. Most studies included children only (n = 56), followed by adolescents only (n = 22), and both (n = 10); one study did not report student age. Multi‐component interventions were most common (n = 40), followed by schooltime physical activity (n = 19), enhanced physical education (n = 15), and before and after school programmes (n = 14); one study explored both enhanced physical education and an after school programme. Lack of blinding of participants, personnel, and outcome assessors and loss to follow‐up were the most common sources of bias.
Results show that school‐based physical activity interventions probably result in little to no increase in time engaged in moderate to vigorous physical activity (mean difference (MD) 0.73 minutes/d, 95% confidence interval (CI) 0.16 to 1.30; 33 studies; moderate‐certainty evidence) and may lead to little to no decrease in sedentary time (MD ‐3.78 minutes/d, 95% CI ‐7.80 to 0.24; 16 studies; low‐certainty evidence). School‐based physical activity interventions may improve physical fitness reported as maximal oxygen uptake (VO₂max) (MD 1.19 mL/kg/min, 95% CI 0.57 to 1.82; 13 studies; low‐certainty evidence). School‐based physical activity interventions may result in a very small decrease in BMI z‐scores (MD ‐0.06, 95% CI ‐0.09 to ‐0.02; 21 studies; low‐certainty evidence) and may not impact BMI expressed as kg/m² (MD ‐0.07, 95% CI ‐0.15 to 0.01; 50 studies; low‐certainty evidence). We are very uncertain whether school‐based physical activity interventions impact health‐related quality of life or adverse events.
Authors' conclusions
Given the variability of results and the overall small effects, school staff and public health professionals must give the matter considerable thought before implementing school‐based physical activity interventions. Given the heterogeneity of effects, the risk of bias, and findings that the magnitude of effect is generally small, results should be interpreted cautiously.
Keywords: Adolescent, Child, Humans, Exercise, Physical Fitness, Quality of Life, Randomized Controlled Trials as Topic, Schools, Sedentary Behavior
Plain language summary
Do school‐based physical activity interventions increase moderate to vigorous physical activity and improve physical fitness among children and adolescents?
Key messages
School‐based interventions may improve physical fitness but may have little to no impact on body mass index (which is used to assess whether body weight is in a healthy range), although we do not have confidence in the evidence.
Very few studies have reported on any potential harmful effects.
Careful consideration is needed about the type of school‐based physical activity programme to be implemented, and future studies should seek to identify the best types of physical activity interventions for school settings.
Why is it important to promote physical activity in children?
It is estimated that as many as 5.3 million deaths worldwide are caused by not getting enough exercise (physical inactivity), and this is a big risk factor leading to most long‐lasting diseases and cancers. This is a topic of concern, particularly because it is known that physical activity patterns in childhood can lead to similar patterns in adulthood. Programmes that encourage children to exercise while at school are thought to be a way to increase activity levels of all children, regardless of other factors such as parent behaviours and social or financial factors of a child’s early lifetime.
What did we find?
We found 89 studies that looked at the effects of programmes in schools that focused on increasing physical activity, which included 66,752 children and adolescents (between the ages of 6 and 18) from around the world. The length of programme time varied from 12 weeks to 6 years. No two school‐based physical activity programmes used the same combination of intervention parts. How often and how long each part of a programme was run varied a lot across studies.
Across all included studies, only very small changes were noted in the number of students undertaking physical activity or in minutes per day of moderate to vigorous physical activity or sedentary time, although these programmes were found to improve students’ physical fitness. These programmes were found to have little to no impact on measurements used to assess whether body weight is in a healthy range. Not many studies reported on any potential harmful effects, such as injury or psychological harm.
What are the limitations of the evidence?
We have little confidence in the evidence because studies were done in different ways and interventions were delivered and assessed in different ways. Also, people in the studies may have been aware of which interventions they were getting, and this can sometimes affect the outcomes reported. In addition, not all studies provided data about everything we were interested in.
How up‐to‐date is the evidence?
The evidence is up‐to‐date to June 2020 (although we did run a new search for studies in February 2021 and found studies that may be included in a future update and are now described in the “Studies awaiting classification” table).
Summary of findings
Summary of findings 1. School‐based physical activity programmes for promoting physical activity and fitness in children and adolescents aged 6 to 18 years.
| School‐based physical activity programmes for promoting physical activity and fitness in children and adolescents aged 6 to 18 years | ||||
|
Population: children and adolescents aged 6 to 18 years Settings: primarily within the school setting Intervention: educational, health promotion, counselling, and management strategies focused on promotion of physical activity and fitness Comparison: standard, currently existing physical education programmes in schools | ||||
| Outcomes | Anticipated effects (95% CI) | No. of participants (trials) | Certainty of the evidence (GRADE) | |
| Risk with control | Risk with intervention | |||
|
% of participants physically active
[follow‐up: 12 weeks to 12 months] |
% physically active ranged from 2% to 50% | % physically active ranged from 1.11% lower to 12.22% higher. | 6,068 (5) |
⊕⊝⊝⊝ very lowa |
|
Moderate to vigorous physical activity (minutes/d) [follow‐up: 12 weeks to 3 years] |
‐3.63 (‐5.03 to ‐2.23) | MD 0.73, 95% CI 0.16 to 1.30 | 20,614 (33) |
⊕⊕⊕⊝ moderateb |
| Sedentary time (minutes/d) [follow‐up: 12 weeks to 28 months] | 27.77 (‐21.34 to 76.88) | MD ‐3.78, 95% CI ‐7.80 to 0.24 | 11,914 (16) |
⊕⊕⊝⊝ lowc |
| Physical fitness (VO₂ max, mL/kg/min) [follow‐up: 12 weeks to 1 year] | ‐1.00 (‐1.59 to ‐0.41) | MD 1.19, 95% CI 0.57 to 1.82 | 3,980 (13) |
⊕⊕⊝⊝ lowd |
| BMI (z‐score) [follow‐up: 12 weeks to 4 years] | ‐0.01 (‐0.08 to 0.06) | MD ‐0.06, 95% CI ‐0.09 to ‐0.02 | 22,948 (21) |
⊕⊕⊝⊝ lowe |
| BMI (kg/m²) [follow‐up: 12 weeks to 4 years] | ‐0.35 (‐1.06 to 0.36) | MD ‐0.07, 95% CI ‐0.15 to 0.01 | 34,337 (50) |
|
|
Health‐related quality of life [follow‐up: 15 weeks to 12 months] |
Not estimable; insufficient data reported within studies | 4,687 (7) |
⊕⊝⊝⊝ very lowf |
|
|
Adverse events [follow‐up: 12 weeks to 3 years] |
Not estimable; only 3 studies reported any adverse events | 11,698 (16) |
⊕⊝⊝⊝ very lowg |
|
| BMI: body mass index; CI: confidence interval; MD: mean difference; min/d: minutes per day; VO₂max: maximal oxygen uptake. | ||||
| GRADE Working Group grades of evidence. High quality: we are very confident that the true effect lies close to that of the effect estimate. Moderate quality: we are moderately confident in the effect estimate. The true effect is likely to be close to the estimate of effect, but there is a possibility that it is substantially different. Low quality: our confidence in the effect estimate is limited. The true effect may be substantially different from the estimate of the effect. Very low quality: we have very little confidence in the effect estimate. The true effect is likely to be substantially different from the estimate of the effect. | ||||
aDowngraded by one level each for inconsistency (large variation in effects across studies), imprecision (wide confidence intervals), and risk of bias (high or unclear in most studies).
bDowngraded by one level for inconsistency (visual inspection of forest plots and I² value from meta‐analysis).
cDowngraded by one level for imprecision of results (wide confidence intervals) and risk of bias (high or unclear in many studies).
dDowngraded by one level for inconsistency (visual inspection of forest plots and I² value from meta‐analysis) and indirectness (estimated vs measured VO₂ peak).
eDowngraded by one level for inconsistency (visual inspection of forest plots and I² value from meta‐analysis), risk of bias (high or unclear in most studies).
fDowngraded by one level for inconsistency (large variation across studies), risk of bias (high or unclear in most studies), publication bias (most studies not reporting on health‐related quality of life or describing full results).
gDowngraded by one level for inconsistency (large variation across studies), publication bias (most studies not reporting on adverse events or methods for monitoring), risk of bias (high or unclear in most studies).
Background
Description of the condition
International public health and health promotion organisations have identified health risks across the lifespan associated with physical inactivity. Recent estimates suggest that 5.3 million deaths per year throughout the world are attributable to physical inactivity (Lee 2012a). Globally, physical inactivity has been identified as the fourth leading risk factor for global mortality (6% of all deaths), following high blood pressure, tobacco use, and high blood glucose, and overweight and obesity are responsible for 5% of deaths globally (Warburton 2017; WHO 2008). Physical inactivity is estimated to cause 10% of the burden of disease from breast cancer and colon cancer, as well as 7% from type 2 diabetes, and 6% from coronary heart disease (Lee 2012a). The burden of these and other chronic diseases has rapidly increased in recent decades (WHO 2008). In fact, physical activity was labelled as “today's best buy in public health” almost three decades ago (Morris 1994). Recent estimates suggest that physical inactivity cost healthcare systems $ (INT$) 53.8 billion worldwide in 2013 (Ding Ding 2016). In addition, the literature indicates that an elevated body mass index (BMI) places children and adolescents at greater risk for cardiovascular disease as adults, and that diet and physical activity are important factors in maintaining a healthy BMI range (Hills 2011). Longitudinal data have shown that for each weekday that adolescents of normal weight participated in physical education (PE), the odds of becoming overweight in adulthood decreased by 5% (Menschik 2008).
Previous reports have concluded that the intensity, frequency, and duration of physical activity contribute to overall physical health status and suggest that a 'threshold' must be maintained to produce positive health effects (CDC 1999; Shephard 1997; Tolfrey 2000). In fact, a positive linear association between duration of physical activity and positive health effects has been established, with longer duration associated with improved physical health (Carson 2017; Janssen 2010; Shephard 1997). Maximal oxygen uptake (VO₂max) is a standard measure associated with fitness levels, with increasing values expected as fitness level improves, and is an important indicator of successful physical activity interventions. Recent analyses have shown a dose‐response relationship between physical activity behaviours (minutes/week of moderate to vigorous physical activity (MVPA)) and fitness levels (measured by VO₂max) and measures of cardio‐metabolic health, including measures of body composition, blood pressure, and blood cholesterol (Nevill 2020; Sriram 2021).
Current guidelines suggest that children and adolescents should engage in at least 60 minutes of MVPA per day, along with muscle and bone strengthening activities at least 3 days per week (Chaput 2020). Examples of moderate to vigorous activities include brisk walking, jogging, stair climbing, basketball, racquet sports, soccer, dance, lap swimming, skating, strength training, cross‐country skiing, and cycling. In the most recently released global physical activity guidelines, evidence suggests that time spent in sedentary behaviour is associated with poorer health outcomes in both children and adolescents, and it is recommended that children and adolescents limit sedentary time, especially when sedentary time is combined with recreational screen time (Chaput 2020). Research suggests that the best primary strategy for improving the long‐term health of children and adolescents through exercise may involve creating a lifestyle pattern of regular MVPA that will carry over to the adult years (Freedson 1992; Telama 2005; Twisk 2000). Despite this, the Global Matrix 3.0 Physical Activity Report Card Grades for Children and Youth on physical levels of children and youth from 49 countries revealed a mean letter grade of C for the percentage of children and youth meeting the physical activity recommendation of 60 minutes of MVPA per day, representing 27% to 33% of children and youth (Aubert 2018). Therefore it is of primary importance to identify approaches that will be effective in increasing and sustaining activity levels of children and adolescents in places where they spend long periods of time, such as schools.
Description of the intervention
To ensure sustained progress towards major improvements in chronic disease prevention, the World Health Organization (WHO) has called on public health organisations within and between countries to work collaboratively with key partners, including educators and health professional bodies, educational institutions, consumer groups, researchers, and the private sector, to provide a comprehensive strategy to promote physical activity among children and adolescents (WHO 2008). The school setting is an ideal environment for population‐based physical activity interventions, as no other institution has as much influence on children during their first two decades of life (Naylor 2009; Story 2009). Recognising the unique opportunity that exists to formulate and implement an effective strategy to substantially reduce deaths and disease burden worldwide by improving diet and promoting physical activity, the WHO has adopted the Health Promoting School (HPS) framework to promote healthy living, learning, and working conditions. An HPS encourages moving beyond individual behaviour change and considering and addressing the whole‐school environment (IUHPE 2010). The WHO specifically identified schools as a target setting for promotion of physical activity among children and youth and suggested that schools implement opportunities and programming for physical activity and provide safe and appropriate spaces that facilitate participation in physical activity (WHO 2008).
Schools are considered an ideal setting for promoting physical activity among children due to their broad reach and multiple opportunities to promote physical activity over the course of the school week, including physical education classes, before and after school programmes, recess programming, active school travel, and classroom‐based physical activity (Singh 2017; Watson 2017a). To effectively promote MVPA, the Centers for Disease Control and Prevention suggests that schools engage in comprehensive approaches to develop, implement, and evaluate physical activity policies and practices; establish school environments that support physical activity; implement a quality physical activity programme with quality physical education as a cornerstone; implement health education that provides students with the knowledge, attitudes, and skills needed for physical activity; provide students with health, mental health, and social services to promote physical activity and prevent chronic disease; partner with families and community members in development and implementation of physical activity policies; provide a school employee wellness programme that includes physical activity services for all school staff members; and employ qualified persons and provide professional development opportunities for physical education and physical activity (CDC 2011).
Studies conducted to date have generally utilised different combinations of physical activity promotion interventions in schools, including before and after school programmes, multi‐component physical activity interventions, enhanced PE, and schooltime physical activity, such as physically active lessons. Generally, interventions focused on providing students with information about the benefits of physical activity and healthy nutrition, the risks associated with inactivity and unhealthy food choices, and the importance of increasing the amount of time students were engaged in MVPA during the school day, as well as ensuring that they expend greater amounts of energy during physical activity sessions. Interventions targeted the school curriculum (related to PE classes specifically and to the whole curriculum generally), teacher training, educational materials, changes in the format of the school day, and accessibility to exercise equipment. Interventions included training sessions for teachers (to learn more effective ways to promote physical activity and to incorporate it into curricula) and training materials including kits, packages of materials to be used in curricula, and materials to be given to students and parents. Packages included teaching notes on exercise, how the body works, and healthy eating and nutrition. Interventions also targeted PE classes by increasing the level of activity students engaged in during these classes, introducing activities geared to the age and level of development of the child, and putting greater emphasis on games. Students were encouraged to be more active outside of school during leisure time. The curriculum focused on creating a positive self‐image through awareness of physical activity benefits. Curriculum changes were implemented in other courses as well, such as science courses, which incorporated discussions of healthy eating and physical activity. Some interventions included changes in the food provided in school cafeterias, so as to increase the number of healthy food choices. Other strategies included a risk factor assessment of students to identify students with established risk factors and development of a plan to reduce student risk through increased physical activity, healthy nutrition, and goal attainment.
How the intervention might work
Given that school‐aged children spend a significant amount of their wakeful time in transit to or in the school setting, and that almost all children in many countries attend school until they reach adolescence, school‐based physical activity promotion interventions have the potential to reduce population‐wide chronic disease (Macnab 2014). In fact, several published systematic reviews have highlighted the benefits of physical activity among healthy children (Brown 2009; Cesa 2014; Granger 2017; Janssen 2010; Kriemler 2011a; Marker 2016; Poitras 2016). School‐based interventions can target simultaneously children at risk and children not at risk for future chronic disease and can increase both knowledge and behaviour conducive to healthier lifestyles. School‐based strategies targeting all students through curriculum ensure that 100% of students are exposed to the intervention, thereby increasing the reach of these interventions. Increased physical activity is an essential public health and health promotion strategy to improve child health (WHO 2008).
The intent of school‐based physical activity interventions is to increase the overall percentage of children and adolescents engaged in MVPA each day while increasing the duration of MVPA engaged in on a weekly basis. The aim of these interventions is to create a school environment that is conducive to achieving a greater proportion of children and adolescents who meet physical activity guidelines, while increasing time spent engaged in MVPA. Generally, this means that significant changes to the school curriculum are needed to support increased time for physical activity as well as increased levels of activity during this time. School‐based interventions offer an important opportunity to improve knowledge of how to prevent non‐communicable disease, and to provide both knowledge about the importance of physical activity and the opportunity for students to be more active before, during, and after school hours, thereby helping them develop healthier behaviours that may track into adulthood (Hayes 2019).
Why it is important to do this review
This systematic review was first published in 2009, with an update provided in 2013. Although the benefits of physical activity for healthy children have been documented, at the time the original review was conducted no other reviews had systematically examined the effectiveness of various combinations of school‐based interventions in promoting physical activity and fitness among children. Since that time, several new trials have been published (and are included in this update) and methodological advances have been made (e.g. using accelerometers rather than relying on self‐report data). The purpose of this update is to synthesise new data on the effectiveness of school‐based physical activity interventions with data included in the original review. This update includes evaluations of published studies indexed up to and including 1 June 2020.
Given that school‐aged children spend a significant amount of time in the school setting, and that many barriers prevent participation in physical activity outside of the school setting (e.g. resources, availability, cost), it is particularly important to understand the extent to which school‐based physical activity promotion interventions are effective in increasing activity and improving fitness levels. It is important to evaluate how these types of interventions may impact (positively or negatively) students' overall well‐being and health‐related quality of life and to discern any potential adverse events or harms. When school‐based interventions are combined with broader community‐based interventions, it is difficult to ascertain the impact of school‐based strategies. However, in developing comprehensive physical activity or chronic disease prevention strategies, it is crucial to incorporate effective school‐based strategies. Therefore, it is timely, given low worldwide participation in regular physical activity, that a review focused solely on the effectiveness of school‐based physical activity interventions be conducted and regularly updated.
Objectives
The purpose of this review update is to summarise the evidence on effectiveness of school‐based interventions in increasing moderate to vigorous physical activity and improving fitness among children and adolescents 6 to 18 years of age.
Specific objectives are:
to evaluate the effects of school‐based interventions on increasing physical activity and improving fitness among children and adolescents;
to evaluate the effects of school‐based interventions on improving body composition; and
to determine whether certain combinations or components (or both) of school‐based interventions are more effective than others in promoting physical activity and fitness in this target population.
Methods
Criteria for considering studies for this review
Types of studies
In accordance with the last update, we included randomised controlled trials (RCTs) or cluster‐RCTs with a minimum intervention duration of 12 weeks. There are four unique departures from the protocol of this update in comparison to the original review.
Due to growing availability and use of technology‐based assessments of physical activity and sedentary time via accelerometers, and known limitations of self‐report physical activity data for children in particular, we limited this review to studies that included a device‐based measure of physical activity or sedentary time (e.g. with accelerometers). This resulted in exclusion of measures related to TV watching time from the review, replaced by overall measures of sedentary time. This change in inclusion criteria resulted in exclusion from this update of several studies that included only self‐report measures that were included in the original review.
Studies not primarily aimed at increasing levels of physical activity were excluded from this update. This resulted in exclusion of some studies that were primarily focused on nutrition or reducing/preventing obesity.
Outcomes of blood pressure and pulse rate were excluded from this update. Again, this resulted in exclusion of a very small number of studies that included only these outcomes.
For included studies, we extracted outcomes related to health‐related quality of life and adverse events when reported. This did not result in any change to inclusion or exclusion criteria.
The review authors are aware that post hoc questions are susceptible to bias (Higgins 2011); however, in light of the growing body of literature on the effectiveness of school‐based physical activity promotion interventions, we believe the changes in inclusion and exclusion criteria were necessary to ensure inclusion in this update of the most rigorous evidence related to the research question.
Types of participants
Studies that included school‐attending children and adolescents between the ages of 6 and 18 years were included in this review. This included all otherwise healthy children and adolescents, whether they were overweight or obese, or were not. We excluded studies in which participants received a physical activity intervention as part of a treatment regimen for a specific critical illness or comorbidity (e.g. diabetes). Study participants were categorised as children (age 6 to < 12) or adolescents (age 12 to 18) based on Centers for Disease Control and Prevention categories (Centers for Disease Control and Prevention, 2021).
Types of interventions
Interventions
We included any school‐based physical activity programme that aimed to increase physical activity and/or fitness among children and adolescents. We defined school‐based physical activity programmes as any that implemented educational, health promotion, counselling, and/or management strategies focused on promotion of physical activity and/or fitness. The range of interventions included changes to school curriculum, training for teachers about incorporating physical activity into school curriculum and routines, and educational materials for teachers, students, and parents. In some instances, the intervention included strategies to engage parents in the intervention, as well as community‐based strategies, mass media, policy development, and environmental changes. We included studies for which interventions were targeted primarily within the school setting. In some instances, interventions were implemented in the community and in the home, in addition to school‐based interventions, although the primary focus needed to be the school setting. Included studies must have fallen within public health practice (meaning the focus was on health promotion from an individual or population‐wide perspective and was not physician or clinic based) and must have been able to be implemented, facilitated, or promoted by staff in local public health units or by public health professionals.
Comparators
The comparison could be no intervention, usual care, or a concomitant intervention. Concomitant interventions had to be the same in both intervention and comparator groups to establish fair comparisons.
Minimum duration of intervention
The minimum duration of follow‐up was 12 weeks. Given the abundance of literature, this criterion was added during the last update to focus on interventions that were most likely to result in meaningful and sustainable changes in the school setting (Dobbins 2013). We extracted data on extended follow‐up periods. We defined extended follow‐up periods as follow‐up of participants that occurred once the original trial, as specified in the trial protocol, had been terminated (Buch 2011; Megan 2012).
Summary of specific exclusion criteria
We excluded studies in which participants received a physical activity intervention as part of a treatment regimen for a specific critical illness or comorbidity (e.g. diabetes), studies in which the intervention was conducted entirely outside the school setting (e.g. community setting, public place, recreation facility, physician office, camp setting), and studies in which the intervention could be delivered only by a specific health professional (e.g. physician) or fitness expert.
Types of outcome measures
To be included, studies had to report one or more of the following outcomes, presented as post‐intervention measurement and standard deviation or confidence intervals, or as change from baseline with standard deviation or confidence intervals.
Primary outcomes
Proportion of students meeting recommendations for moderate to vigorous physical activity (MVPA)
Duration of MVPA
Sedentary time
Secondary outcomes
Physical fitness
Body mass index (BMI)
Health‐related quality of life
Adverse events
Method and timing of outcome measurement
Outcomes were primarily measured at baseline and immediately post intervention. In a small subset of studies, outcomes were measured at 6 months, at 9 months, and at 12 months, and in one study, up to 4 years post intervention.
MVPA: assessed by accelerometers during school time or non‐school (or both) time. The proportion of students who met physical activity guidelines was presented as reported or calculated by dividing the number of students engaged in 60 minutes/d of MVPA by the total number of students allocated to either the intervention group or the control group; duration of physical activity was measured as total minutes per day or weeks spent engaged in MVPA.
Sedentary time: measured as time spent sedentary in total minutes or hours per day or per week, measured via accelerometers.
BMI (kg/m²or BMI z‐score): measured by trained health professionals using calibrated scales; however, differences existed across studies in terms of which clothes were worn by participants during measurement and whether height and weight were measured during school time.
Physical fitness: measured in different ways by trained professionals. In some instances, actual maximal oxygen uptake (VO₂max) was measured; in many, a field‐based test such as a shuttle run or a step test was used to estimate VO₂max.
Health‐related quality of life: quantified with a validated instrument (e.g. Pediatric Quality of Life Inventory). Assessments completed by both students and parent proxies were eligible.
Adverse events: any as reported by study authors were noted, as were specific statements of no adverse events occurring.
Search methods for identification of studies
Electronic searches
The search for this update was conducted from the date of our last search (October 2011) to 1 June 2020. Some minor changes were made to the search strategy, such as using validated search filters for RCTs that were not available at the time of our last search and adding terms for sedentary time. Validated search filters were used within MEDLINE Ovid (Lefebvre 2019), Embase Ovid (Glanville 2019a), and Cumulative Index to Nursing and Allied Health Literature (CINAHL) (Glanville 2019b). We searched the following databases.
Cochrane Central Register of Controlled Trials (CENTRAL), in the Cochrane Library.
MEDLINE Ovid.
Embase Ovid.
CINAHL EBSCO.
PsycINFO Ovid.
BIOSIS Web of Science.
SPORTDiscus EBSCO.
Sociological Abstracts ProQuest.
For detailed search strategies, see Appendix 1. We placed no restrictions on language of publication when searching electronic databases or reviewing reference lists of identified trials.
Searching other resources
We tried to identify other potentially eligible trials or ancillary publications, including trial registries, by handsearching the reference lists of all included trials and relevant systematic reviews and meta‐analyses and health technology assessment reports that were identified in our search. We contacted authors of included trials to request additional information on retrieved trials and to determine if further trials exist, which we may have missed.
We did not use abstracts or conference proceedings for data extraction because this information source does not fulfil the Consolidated Standards of Reporting Trials (CONSORT) requirements, which call for "an evidence‐based, minimum set of recommendations for reporting randomised trials" (CONSORT 2018 Scherer 2007). However, we specified trial details in the Characteristics of studies awaiting classification table, and we contacted study authors to determine whether further publications exist.
Data collection and analysis
Selection of studies
For this update, two review authors (SNS, HC) independently screened abstract, title, or both, for every record retrieved in the literature searches, to determine which trials should be assessed further. We obtained the full text of all potentially relevant records. We resolved disagreements through consensus or by recourse to a third review author (MD). If we could not resolve a disagreement, we categorised the trial as a 'study awaiting classification' and contacted trial authors for clarification. We prepared an adapted PRISMA flow diagram to show the process of trial selection (Figure 1) (Liberati 2009). We listed all articles excluded after full‐text assessment in the Characteristics of excluded studies table and provided reasons for exclusion.
1.
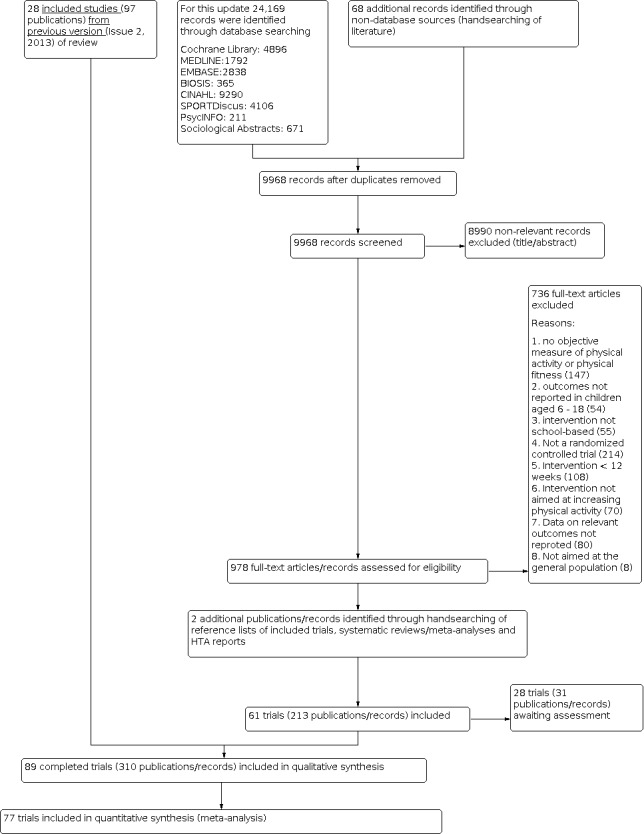
Trial flow diagram.
Data extraction and management
For trials that fulfilled our inclusion criteria, two review authors (SNS, HC) independently extracted key participant and intervention characteristics. We reported data on efficacy outcomes and adverse events using standardised data extraction sheets. We resolved disagreements by discussion, or, if required, we consulted a third review author (MD) (for details, see Characteristics of included studies; Table 2; Appendix 2; Appendix 3). We provided information including trial identifiers for potentially relevant ongoing trials in the Characteristics of ongoing studies table.
1. Overview of study populations.
| Trial ID (design) | Interventions and comparators | Screened/eligible (N) | Randomised (N) | Finishing trial (N) | Randomised finishing trial (%) |
| Breheny 2020 | I: Daily Mile | —/— | 1153 | 1107 | 96.0 |
| C: usual school routine | 1127 | 1070 | 94.9 | ||
| total: | 2280 | 2177 | 95.5 | ||
| Ketelhut 2020 | I: high‐intensity interval training during PE | —/— | — | 22 | — |
| C: usual PE | 24 | ||||
| total: | — | 46 | |||
| — | |||||
| Belton 2019 (cluster‐RCT) | I: multi‐component PE, whole‐school and parent‐targeted intervention | 564/534 | 275 | 123 | 44.7 |
| C: usual care | 259 | 126 | 48.6 | ||
| total: | 534 | 249 | 46.6 | ||
| Corepal 2019 (cluster‐RCT) | I: pedometer challenge | —/— | 142 | 136 | 95.8 |
| C: usual school | 82 | 81 | 98.8 | ||
| total: | 224 | 217 | 96.9 | ||
| Ickovics 2019 (cluster‐RCT) | I1: PA school wellness policy | —/756 | 413 | 330 | 79.9 |
| I2: PA + nutrition school wellness policy | |||||
| C1: nutrition school wellness policy | 305 | 265 | 86.9 | ||
| C2: delayed control | |||||
| total: | 718 | 595 | 82.9 | ||
| Jago 2019 (cluster‐RCT) | I: Action 3:30R after‐school PA club | 1139/1125 | 170 | 113 | 66.5 |
| C: — | 165 | 139 | 84.2 | ||
| total: | 335 | 252 | 75.2 | ||
| Leahy 2019 (cluster‐RCT) | I: Burn2Learn, multi‐component high‐intensity interval training | —/68 | 38 | 32 | 84.2 |
| C: usual school activities | 30 | 29 | 96.7 | ||
| total: | 68 | 61 | 89.7 | ||
| Lonsdale 2019a (cluster‐RCT) | I: teacher PE training | —/1806 | 693 | 630 | 90.9 |
| C: standard teaching | 728 | 628 | 86.3 | ||
| total: | 1421 | 1258 | 88.5 | ||
| Müller 2019 (cluster‐RCT) | I1: PA only | 1009/944 | — | 265 | — |
| I2: PA + health education | |||||
| I3: PA + health education + nutrition | |||||
| C1: health education + nutrition | — | 398 | — | ||
| C2: no PA | |||||
| total: | 944 | 663 | 70.2 | ||
| Ordóñez Dios 2019 | I: 2 x 45‐minute PE sessions per week and daily run | —/— | — | 45 | — |
| C: 2 x 45‐minute PE sessions per week | — | 44 | — | ||
| total: | — | 89 | — | ||
| Seibert 2019 | I: 4 core strategies to increase PA | —/— | 2495 | — | — |
| C: usual PE | 2399 | — | — | ||
| total: | 4894 | — | — | ||
|
Seljebotn 2019
(cluster‐RCT) |
I: physically active lessons, active homework, physically active recess | —/473 | 228 | 224 | 98.2 |
| C: continued normal routine, approximately 135 minutes/week of PA | 219 | 218 | 99.5 | ||
| total: | 447 | 442 | 98.9 | ||
| Zhou 2019 (cluster‐RCT) | I1: modified PE | —/— | 204 | 163 | 79.9 |
| I2: after school PA programme | 200 | 180 | 90.0 | ||
| I3: modified PE and after school PA programme | 178 | 168 | 94.4 | ||
| C: regular PE | 176 | 170 | 96.6 | ||
| total: | 758 | 681 | 89.8 | ||
| Adab 2018 (cluster‐RCT) | I: 30 minutes of additional MVPA on each school day, cooking workshops, a 6‐week healthy eating programme, information sheets for families | —/— | 1134 | 660 | 58.2 |
| C: ongoing Year 2 health‐related activities and education resources, excluding topics related to healthy eating and PA | 1328 | 732 | 55.1 | ||
| total: | 2462 | 1392 | 56.5 | ||
| Carlin 2018 (cluster‐RCT) | I: brisk walking intervention | —/— | 101 | 100 | 99.0 |
| C: continued with normal PA habits | 98 | 97 | 99.0 | ||
| total: | 199 | 197 | 99.0 | ||
| Harrington 2018 (cluster‐RCT) | I: support for PA, PE, and school sport culture and practices with support of the Youth Sport Trust and a hub school | —/1753 | 867 | 735 | 84.8 |
| C: usual practice of PE and sport | 885 | 626 | 70.7 | ||
| total: | 1752 | 1361 | 77.7 | ||
| Have 2018 (cluster‐RCT) | I: active math lessons | —/557 | 294 | 268 | 91.2 |
| C: regular classroom instruction | 211 | 182 | 86.3 | ||
| total: | 505 | 450 | 89.1 | ||
| Pablos 2018 (cluster‐RCT) | I: lunchtime extracurricular PA | —/210 | 100 | 82 | 82.0 |
| C: continued with daily activities | 90 | 76 | 84.4 | ||
| total: | 190 | 158 | 83.2 | ||
| Robbins 2018 (cluster‐RCT) | I: an after school PA club, counselling, interactive Internet‐based sessions | 4192/1543 | 766 | 706 | 92.2 |
| C: no additional after school programming | 777 | 680 | 87.5 | ||
| total: | 1543 | 1386 | 89.8 | ||
| Siegrist 2018 (cluster‐RCT) | I: weekly lifestyle lessons | 792/— | 331 | 243 | 73.4 |
| C: usual activities | 257 | 191 | 74.3 | ||
| total: | 588 | 434 | 73.8 | ||
| Ten Hoor 2018 (cluster‐RCT) | I: strength training and motivational interviewing | —/808 | 353 | 262 | 74.2 |
| C: usual curriculum | 342 | 246 | 71.9 | ||
| total: | 695 | 508 | 73.1 | ||
| Donnelly 2017 (cluster‐RCT) | I: Academic Achievement and Physical Activity Across the Curriculum lessons, 160 minutes/week of MVPA | —/698 | 316 | 244 | 77.2 |
| C: traditional classroom instruction and typical PE schedule | 268 | 204 | 76.1 | ||
| total: | 584 | 448 | 76.7 | ||
| Farmer 2017 (cluster‐RCT) | I: school‐specific playground action plan | —/— | 812 | 344 | 42.4 |
| C: no change to school play spaces | 851 | 325 | 38.2 | ||
| total: | 1663 | 669 | 40.2 | ||
| Sutherland 2017 (cluster‐RCT) | I: modified Supporting Children's Outcomes using Rewards, Exercise and Skills programme | —/1959 | 571 | — | — |
| C: delivered school PA practices according to the curriculum | 568 | — | — | ||
| total: | 1139 | — | — | ||
| Torbeyns 2017 (RCT) | I: cycling desks | —/— | 28 | 21 | 75.0 |
| C: no lifestyle change | 28 | 23 | 82.1 | ||
| total: | 56 | 44 | 78.6 | ||
| Daly 2016 (cluster‐RCT) | I: specialist‐taught PE intervention | —/— | 457 | 273 | 59.7 |
| C: usual PE programme | 396 | 267 | 67.4 | ||
| total: | 853 | 540 | 63.3 | ||
| de Greeff 2016 (cluster‐RCT) | I: physically active mathematics and language lessons | —/— | — | 181 | — |
| C: usual curriculum | — | 195 | — | ||
| total: | 388 | 376 | 96.9 | ||
| Drummy 2016 (cluster‐RCT) | I: teacher‐led activity break | —/150 | — | 54 | — |
| C: normal daily routine | — | 53 | — | ||
| total: | 120 | 107 | 89.2 | ||
| Jarani 2016 (cluster‐RCT) | I1: group circuit training‐based PE | —/767 | 261 | 253 | 96.9 |
| I2: games‐based PE | 251 | 243 | 96.8 | ||
| C: traditional PE school | 255 | 240 | 94.1 | ||
| total: | 767 | 736 | 96.0 | ||
| Kocken 2016 (cluster‐RCT) | I: theory and practical lessons on nutrition and PA | —/— | 615 | 367 | 59.7 |
| C: regular school programme or curriculum on nutrition and PA | 497 | 496 | 99.8 | ||
| total: | 1112 | 863 | 77.6 | ||
| Lau 2016 (RCT) | I: Xbox 260 Kinect gaming sessions after school | 152/84 | 40 | 40 | 100.0 |
| C: regular PA and PE class | 40 | 40 | 100.0 | ||
| total: | 80 | 80 | 100.0 | ||
| Resaland 2016 (cluster‐RCT) | I: physically active Norwegian, mathematics, and English lessons on the playground; PA breaks and PA homework | 1395/1202 | 620 | 593 | 95.6 |
| C: curriculum‐prescribed PE and PA | 582 | 530 | 91.1 | ||
| total: | 1202 | 1123 | 93.4 | ||
| Sutherland 2016 (cluster‐RCT) | I: 7 PA intervention strategies and 6 implementation strategies | —/1468 | 696 | 250 | 35.9 |
| C: only measurement components of the trial: regular PA and PE | 537 | 191 | 35.6 | ||
| total: | 1233 | 441 | 35.8 | ||
| Tarp 2016 (cluster‐RCT) | I: 60 minutes of PA during schooltime, PA homework | 869/855 | 215 | 194 | 90.2 |
| C: normal practice | 490 | 438 | 89.4 | ||
| total: | 705 | 632 | 89.6 | ||
| Cohen 2015 (cluster‐RCT) | I: teacher learning, PA policies, school‐community linkages | —/— | 199 | 166 | 83.4 |
| C: usual PE and school sport programmes | 261 | 217 | 83.1 | ||
| total: | 460 | 383 | 83.3 | ||
| Jago 2015 (cluster‐RCT) | I: after school dance classes | —/663 | 284 | — | — |
| C: provided data only | 287 | — | — | ||
| total: | 571 | 508 | 89.0 | ||
| Madsen 2015 (cluster‐RCT) | I: nutrition education curriculum, Playworks structured recess before or after school activities, PA and games implemented by teachers | —/— | 583 | 446 | 76.5 |
| C: — | 296 | 230 | 77.7 | ||
| total: | 879 | 676 | 76.9 | ||
| Muros 2015 (cluster‐RCT) | I1: extracurricular PA sessions | 242/162 | 28 | 28 | 100.0 |
| I2: PA and nutrition | 21 | 21 | 100.0 | ||
| I3: PA and nutrition and extra virgin olive oil during the final month | 25 | 25 | 100.0 | ||
| C1: nutrition and lifestyle education sessions | 41 | 41 | 100.0 | ||
| C2: usual activities | |||||
| total: | 135 | 135 | 100.0 | ||
| Suchert 2015 (cluster‐RCT) | I: multi‐level intervention targeting students, classrooms, schools, and parents | —/1489 | 790 | 702 | 88.9 |
| C: no intervention | 506 | 460 | 90.9 | ||
| total: | 1296 | 1162 | 89.7 | ||
| Andrade 2014 (cluster‐RCT) | I: ACTIVITAL individual‐ and environment‐based intervention | —/— | 700 | 550 | 78.6 |
| C: standard curriculum | 740 | 533 | 72.0 | ||
| total: | 1440 | 1083 | 75.2 | ||
| Jago 2014 (cluster‐RCT) | I: Action 3:30 activity club | —/— | 284 | 153 | 53.9 |
| C: schools provided data only | 255 | 157 | 61.6 | ||
| total: | 539 | 310 | 57.5 | ||
| Kipping 2014 (cluster‐RCT) | I: PA education intervention | 2242/2221 | 1064 | — | — |
| C: continued standard education provision | 1157 | — | — | ||
| total: | 2221 | 1252 | 56.4 | ||
| Kobel 2014 (cluster‐RCT) | I: teacher training, PA education, active breaks | 3159/1968 | — | — | — |
| C: no intervention | — | — | — | ||
| total: | 1964 | 1724 | 87.8 | ||
| Martinez‐Vizcaino 2014 (cluster‐RCT) | I: MOVI‐2 extracurricular PA programme | —/— | 769 | 420 | 54.6 |
| C: standard PE curriculum | 823 | 492 | 59.8 | ||
| total: | 1592 | 912 | 57.3 | ||
| Nogueira 2014 (cluster‐RCT) | I: high‐intensity capoeira sessions | 341/339 | 185 | 176 | 95.1 |
| C: usual school activities | 154 | 135 | 87.7 | ||
| total: | 339 | 138 | 40.7 | ||
| Santos 2014 (cluster‐RCT) | I: healthy buddies, healthy living lessons, structured aerobic exercise | —/— | 340 | 310 | 91.2 |
| C: standard curriculum | 347 | 273 | 78.7 | ||
| total: | 687 | 583 | 84.9 | ||
| Toftager 2014 (cluster‐RCT) | I: physical and organisational environmental changes | —/— | 623 | 551 | 88.4 |
| C: — | 725 | 608 | 83.9 | ||
| total: | 1348 | 1159 | 86.0 | ||
| Fairclough 2013 (cluster‐RCT) | I: weekly lesson plans, worksheets, homework tasks, lesson resources | 420/318 | 166 | 117 | 70.5 |
| C: normal instruction | 152 | 89 | 58.6 | ||
| total: | 318 | 196 | 61.6 | ||
| Ford 2013 (RCT) | I: accumulated brisk walking programme | —/174 | — | 77 | — |
| C: normal school lessons | — | 75 | — | ||
| total: | 174 | 152 | 87.4 | ||
| Grydeland 2013 (cluster‐RCT) | I: structured lessons, PA breaks, PA promotion | —/— | 784 | 519 | 66.2 |
| C: — | 1381 | 945 | 68.4 | ||
| total: | 2165 | 1464 | 67.6 | ||
| Melnyk 2013 (cluster‐RCT) | I: goal‐setting, education, PA homework | 1560/807 | 374 | 286 | 76.5 |
| C: Healthy Teens attention control curriculum was intended to promote knowledge of common adolescent health topics and health literacy | 433 | 341 | 78.8 | ||
| total: | 807 | 627 | 77.7 | ||
| Sacchetti 2013 (cluster‐RCT) | I: daily PA in schoolyard and classroom | 521/521 | 247 | 212 | 85.8 |
| C: standard programme of PE | 250 | 216 | 86.4 | ||
| total: | 497 | 428 | 86.1 | ||
| Siegrist 2013 (cluster‐RCT) | I: JuvenTUM educational and environmental intervention | —/902 | 486 | 427 | 87.9 |
| C: continued with usual school activities | 340 | 297 | 87.4 | ||
| total: | 826 | 724 | 87.7 | ||
| Aburto 2011 (cluster‐RCT) | I1: basic intervention of environmental and policy‐level changes | —/— | 262 | 241 | 92.0 |
| I2: plus intervention adding additional resources and daily morning exercise | 264 | 242 | 91.7 | ||
| C: no change to standard practices | 338 | 216 | 63.9 | ||
| total: | 864 | 699 | 80.9 | ||
| Ardoy 2011 (cluster‐RCT) | I1: 4 sessions/week of PE | 70/67 | 26 | 25 | 96.2 |
| I2: 4 sessions/week of PE with emphasis on increasing intensity | 23 | 23 | 100.0 | ||
| C: 2 sessions/week of PE | 18 | 18 | 100.0 | ||
| total: | 67 | 66 | 98.5 | ||
| de Heer 2011 (cluster‐RCT) | I: Bienstar intervention of health education and 45 to 60 minutes of after school PA | 1720/901 | 292 | 242 | 82.9 |
| C1: Grade 4 health workbooks and incentives | 251 | 236 | 94.0 | ||
| C2: spillover control group | 354 | 326 | 92.1 | ||
| total: | 897 | 804 | 89.6 | ||
| Jago 2011 (cluster‐RCT) | I: education, social marketing, food environment, PE curriculum, equipment provision | —/11158 | 5571 | 2060 | 37.0 |
| C: recruitment and data collection only | 5587 | 2003 | 35.9 | ||
| total: | 11158 | 4063 | 36.4 | ||
| Jansen 2011 (cluster‐RCT) | I: 3 PE sessions/week, additional after school sport and play, classroom education, parent health promotion | —/— | 1271 | 1149 | 90.4 |
| C: continued with usual curriculum | 1499 | 1267 | 84.5 | ||
| total: | 2770 | 2416 | 87.2 | ||
| Magnusson 2011 (cluster‐RCT) | I: students engaged in PA during PE lessons, during recess, and during classes; schools had access to PA equipment to use in school lessons; teaching materials promoting PA were provided | —/321 | 151 | 138 | 91.4 |
| C: followed the general PA curriculum | 170 | 116 | 68.2 | ||
| total: | 321 | 254 | 79.1 | ||
| Okely 2011 (cluster‐RCT) | I: PA action plan | —/1769 | 771 | 566 | 73.4 |
| C: continuation of usual programmes | 747 | 633 | 84.7 | ||
| total: | 1518 | 1199 | 79.0 | ||
| Thivel 2011 (cluster‐RCT) | I: 120 minutes of additional supervised PE | —/— | 229 | 229 | 100.0 |
| C: habitual 2 hours of PE/week | 228 | 228 | 100.0 | ||
| total: | 457 | 457 | 100.0 | ||
| Wilson 2011 (cluster‐RCT) | I: Active by Choice Today programme, PA homework, in‐school PA, motivational skills training | 729 | 673 | 92.3 | |
| C: General Health Education Programme | 693 | 635 | 91.6 | ||
| total: | 1422 | 1308 | 92.0 | ||
| Kriemler 2010 (cluster‐RCT) | I: 2 additional 45‐minute PE lessons/week, activity breaks, PA homework | 305 | 297 | 97.4 | |
| C: usual mandatory PE lessons | 235 | 205 | 87.2 | ||
| total: | 540 | 502 | 93.0 | ||
| Neumark‐Sztainer 2010 (cluster‐RCT) | I: New Moves curriculum (nutrition and self‐empowerment, motivational interviewing, lunch meetings, parent outreach) | 687 | 182 | 177 | 97.3 |
| C: participation in all‐girls PE class | 174 | 159 | 91.4 | ||
| total: | 356 | 336 | 94.4 | ||
| Angelopoulos 2009 (cluster‐RCT) | I: educational intervention covering self‐esteem, body image, nutrition, PA, fitness, and environmental issues, with motivational methods to increase knowledge, skills, self‐efficacy, self‐monitoring, and social influence | — | 321 | — | |
| C: — | — | 325 | — | ||
| total: | — | 646 | — | ||
| Donnelly 2009 (cluster‐RCT) | I: 90 minutes/week of moderate to vigorous physically active academic lessons | 814 | 792 | 97.3 | |
| C: regular classroom instruction | 713 | 698 | 97.9 | ||
| total: | 1527 | 1490 | 97.6 | ||
| Dorgo 2009 (cluster‐RCT) | I1: PE manual resistance training programme | 141 | 93 | 66.0 | |
| I2: PE manual resistance training plus cardiovascular endurance training | |||||
| C: regular PE programme that followed the usual school curriculum | 232 | 129 | 55.6 | ||
| total: | 373 | 222 | 59.5 | ||
| Gentile 2009 (cluster‐RCT) | I: 'Switch' programme: promoted healthy lifestyles targeting family, school, and community | 670 | — | — | |
| C: no intentional exposure to the Switch programme | 653 | — | — | ||
| total: | 1323 | 1029 | 77.8 | ||
| Neumark‐Sztainer 2009 (cluster‐RCT) | I: after school theatre sessions, booster sessions, family outreach | 56 | 51 | 91.1 | |
| C: a theatre‐based control condition | 52 | 45 | 86.5 | ||
| total: | 108 | 96 | 88.9 | ||
| Peralta 2009 (RCT) | I: curriculum and peer‐facilitated lunchtime PA session, parent newsletters | 16 | 16 | 100.0 | |
| C: PA curriculum | 17 | 16 | 94.1 | ||
| total: | 33 | 32 | 97.0 | ||
| Walther 2009 (cluster‐RCT) | I: 1 unit of physical exercise (45 minutes) with at least 15 minutes of endurance training/school day, plus lessons on healthy lifestyle once/ month | 112 | 109 | 97.3 | |
| C: German standards, 2 units (each 45 minutes) of PE/week, 12 units (45 minutes/ unit) of high‐level endurance exercise training/week plus participation in competitive sporting events | 76 | 73 | 96.1 | ||
| total: | 188 | 182 | 96.8 | ||
| Reed 2008 (cluster‐RCT) | I: Action Schools!BC whole‐school PA approach | 178 | 156 | 87.6 | |
| C: regular programme of PE and school‐based PA | 90 | 81 | 90.0 | ||
| total: | 268 | 237 | 88.4 | ||
| Salmon 2008 (cluster‐RCT) | I: 1, 2, 3 behavioural modification group; fundamental motor skills group; combined behavioural modification and fundamental motor skills group | 233 | 213 | 91.4 | |
| C: usual classroom lessons | 62 | 55 | 88.7 | ||
| total: | 295 | 268 | 90.8 | ||
| Wang 2008 (cluster‐RCT) | I: 'FitKid' after school intervention sessions | 603 | 260 | 43.1 | |
| C: — | 584 | 265 | 45.4 | ||
| total: | 1187 | 525 | 44.2 | ||
| Webber 2008 (cluster‐RCT) | I: health education lessons to enhance behavioural skills known to influence PA participation (self‐monitoring, setting goals for behaviour change) | — | — | — | |
| C: — | — | — | — | ||
| total: | 3502 | 3378 | 96.5 | ||
| Weeks 2008 (RCT) | I: directed jumping activity at the beginning of every PE class | 52 | 43 | 82.7 | |
| C: regular PE warm‐ups and stretching at the beginning of every PE class | 47 | 38 | 80.9 | ||
| total: | 99 | 81 | 81.8 | ||
| Barbeau 2007 (RCT) | I: after school PA programme | — | — | 81 | |
| C: — | — | — | 84 | ||
| total: | — | — | — | ||
| Williamson 2007 (cluster‐RCT) | I: Healthy Eating and Exercise programme to increase PA during the school day and at home | 313 | 282 | 90.1 | |
| C: Alcohol/Drug/Tobacco abuse prevention programme | 348 | 304 | 87.4 | ||
| total: | 661 | 586 | 88.7 | ||
| Haerens 2006 (cluster‐RCT) | I1: a computer‐tailored intervention to increase MVPA to 60 minutes/d, increase fruit consumption, increase water consumption, and reduce fat | 2105 | — | — | |
| I2: group 1 plus parental involvement | |||||
| C: no PA and nutrition intervention | 735 | — | — | ||
| total: | 2840 | 2434 | 85.7 | ||
| Young 2006 (RCT) | I: PE curriculum taught 5 days/week and family | 116 | 111 | 95.7 | |
| C: standard PE class | 105 | 99 | 94.3 | ||
| total: | 221 | 210 | 95.0 | ||
| Bayne‐Smith 2004 (RCT) | I: Physical Activity and Teenage Health programme, education sessions plus 20 to 25 minutes of PA | — | 310 | — | |
| C: same frequency or duration of PE classes, but without lecture or discussion | — | 132 | — | ||
| total: | — | 442 | — | ||
| Simon 2004 (cluster‐RCT) | I: an educational component focusing on PA and sedentary behaviours and new opportunities for PA during and after school hours | — | 475 | — | |
| C: — | — | 479 | — | ||
| total: | 1046 | 954 | 91.2 | ||
| Trevino 2004 (cluster‐RCT) | I: health programming regarding 3 health behaviour messages associated with diabetes mellitus control and goal‐setting | 969 | 619 | 63.9 | |
| C: — | 1024 | 602 | 58.8 | ||
| total: | 1993 | 1221 | 61.3 | ||
| Stone 2003 (cluster‐RCT) | I: food service, skills‐based classroom curricula, family, and PE | 879 | 644 | 73.3 | |
| C: — | 825 | 653 | 79.2 | ||
| total: | 1704 | 1297 | 76.1 | ||
| Burke 1998 (cluster‐RCT) | I1: standard PA and nutrition programme including classroom lessons, fitness sessions daily, and nutrition programme | — | — | — | |
| I2: I1 plus a PA enrichment programme for higher‐risk children | |||||
| C: no programme | — | — | — | ||
| total: | 800 | 720 | 90.0 | ||
| Ewart 1998 (RCT) | I: 50‐minute 'Project Heart' aerobic exercise classes | 45 | 44 | 97.8 | |
| C: 50‐minute standard PE classes | 54 | 44 | 81.5 | ||
| total: | 99 | 88 | 88.9 | ||
| Luepker 1996 (cluster‐RCT) | I1: school food service modifications, PE interventions, and Child and Adolescent Trial for Cardiovascular Health curricula | 3651 | 3297 | 90.3 | |
| I2: I1 plus a family‐based programme | |||||
| C: usual health curricula, PE, and food service programmes | 1455 | 722 | 49.6 | ||
| total: | 5106 | 4019 | 78.7 | ||
| Bush 1989 (cluster‐RCT) | I1: 'Know Your Body' curriculum focusing on nutrition, fitness, prevention of smoking, a personalised health screening, and results on a 'health passport' for parentsg | — | — | — | |
| I2: 'Know Your Body' curriculum and health screening, but students do not receive the results of their screening; only parents receive the results | |||||
| C: health screening only | — | — | — | ||
| total: | 892 | 431 | 48.3 | ||
| Walter 1988 (cluster‐RCT) | I: special curriculum targeting voluntary changes in risk behaviour in the areas of diet, PA, and smoking | — / 3388 | 2075 | 1104 | 53.2 |
| C: — | 1313 | 665 | 50.6 | ||
| total: | 3388 | 1769 | 52.2 | ||
| Grand total | All interventions | 46 073 | 28 089 | ||
| All comparators | 40 566 | 23 639 | |||
| All interventions and comparators b | 96 740 | 66 752 | |||
—: denotes not reported.
aFollow‐up under randomised conditions until end of trial (= duration of intervention + follow‐up post intervention or identical to duration of intervention); extended follow‐up refers to follow‐up of participants once the original trial was terminated as specified in the power calculation.
bNote that numbers from all interventions and all interventions and comparators are greater than the sum of interventions only and comparators only, as some studies reported only the total number of included participants and did not note numbers within each group.
C: comparator; I: intervention; MVPA: moderate to vigorous physical activity; NA: not applicable; PA: physical activity; PE: physical education; RCT: randomised controlled trial.
We emailed all authors of included trials to enquire whether they would be willing to answer questions regarding their trials. We thereafter sought relevant missing information on the trial from the primary trial author(s), if required.
Dealing with duplicate and companion publications
In the event of duplicate publications, companion documents, or multiple reports of a primary trial, we maximised the information yield by collating all available data, and we used the most complete data set aggregated across all known publications. We listed duplicate publications, companion documents, multiple reports of a primary trial, and trial documents of included trials (such as trial registry information) as secondary references under the study identifier (ID) of the included trial. Furthermore, we listed duplicate publications, companion documents, multiple reports of a trial, and trial documents of excluded trials (such as trial registry information) as secondary references under the study ID of the excluded trial.
Assessment of risk of bias in included studies
For this review, all newly included studies were assessed independently for risk of bias by two review authors (SNS, HC) according to six domains (sequence generation, allocation concealment, blinding of participants and personnel, blinding of outcome assessors, incomplete outcome data, and selective reporting) using the ‘Risk of Bias 1’ tool in the Cochrane Handbook for Systematic Reviews of Interventions to assign assessment of low, high, or unclear risk of bias (for details, see Appendix 4) (Higgins 2017). Incomplete outcome data were rated separately for (1) device‐based measures of physical activity and sedentary time, and (2) BMI and fitness, due to the large proportion of missing data that is often seen in studies using accelerometers. For studies that used a cluster‐randomised design, four additional domains (recruitment bias, baseline imbalance, loss of clusters, and incorrect analysis) were assessed. All disagreements were resolved through discussion. If adequate information was unavailable, trial authors were contacted to request missing data on ‘Risk of bias’ items.
Two main changes were made to the assessment of risk of bias for this update. First, due to changes to Cochrane recommendations, blinding is now assessed separately for participants and personnel, and outcome assessors. Previously included studies were re‐assessed for this domain. In this update, we do not include assessment for control for confounders or reliability and validity of data collection methods. Second, previously included studies that utilised a cluster‐randomised design were appraised for the four new cluster‐randomised trial domains. Finally, assessment of 'other' risk of bias has been removed.
Risk of bias for an outcome across trials and across domains
These are the main summary assessments that we incorporated into our judgements about quality of evidence in Table 1. We defined outcomes as at low risk of bias when most weight in the meta‐analysis comes from trials at low risk of bias, unclear risk when most weight in the meta‐analysis comes from trials at low or unclear risk of bias, and high risk when a sufficient proportion of information comes from trials at high risk of bias. We defined single studies as having low risk of bias when all but one domain was assessed to be at low risk of bias, or when all but two domains were assessed at low risk of bias, one of which was 'blinding of participants and personnel', as adequate blinding of study participants is nearly impossible to do well in school‐based physical activity interventions. We defined single studies to be at high risk of bias when at least three domains were assessed as having unclear or high risk of bias, or when four domains were assessed as having unclear or high risk of bias, one of which was 'blinding of participants and personnel'.
Measures of treatment effect
When at least five included trials were available for comparison of a given outcome measured on the same scale (e.g. MVPA in minutes/d), we combined effects into a meta‐analysis. When available, we extracted data on post‐intervention values adjusted for baseline differences, along with confidence intervals or standard deviation. When only changes from baseline were reported, these differences, along with confidence intervals or standard deviations, were extracted. Both were combined in meta‐analyses, with the calculator function in RevMan 5.4 used to calculate adjusted between‐group difference, as outlined in the Cochrane Handbook for Systematic Reviews of Interventions (Deeks 2021).
When possible, we combined multiple study groups into a single pairwise comparison using formulae for combining continuous data from multiple groups as provided in the Cochrane Handbook for Systematic Reviews of Interventions when separate data were presented for each group, or when between‐group comparisons from multiple group had independent control groups (e.g. when results were presented separately for boys and girls or by grade level) (Higgins 2017). When between‐group differences were reported between multiple intervention groups and the same control group, we did not include these data in the meta‐analysis, so as not to double‐count participants in control groups.
Unit of analysis issues
We considered the level at which randomisation occurred, such as cluster‐randomised trials and multiple observations for the same outcome. If more than one comparison from the same trial was eligible for inclusion in the same meta‐analysis, we used the end of intervention comparison.
Standard errors for cluster‐RCTs that were not appropriately adjusted for potential clustering of participants within clusters in analyses were adjusted using the design effect (1 + (M‐1) × ICC), where M is the average cluster size, and ICC is the intraclass correlation coefficient (Higgins 2017). The ICC was estimated at 0.01, as has been previously reported (Murray 2006).
Dealing with missing data
If possible, we obtained missing data from authors of included trials. We carefully evaluated important numerical data such as screened, randomly assigned participants, as well as intention‐to‐treat and as‐treated and per‐protocol populations. We investigated attrition rates (e.g. dropouts, losses to follow‐up, withdrawals), and we critically appraised issues concerning missing data and use of imputation methods (e.g. last observation carried forward). When included trials did not report sufficient data for inclusion in the meta‐analysis (e.g. provided only P values) and we did not receive requested information from trial authors, we did not include these studies in the meta‐analysis; however, we included them in the narrative tables.
Assessment of heterogeneity
We identified heterogeneity (inconsistency) by visually inspecting forest plots and by using a standard Chi² test with a significance level of α = 0.1 (Deeks 2021). In view of the low power of this test, we also considered the I² statistic, which quantifies inconsistency across trials to assess the impact of heterogeneity on the meta‐analysis (Higgins 2002; Higgins 2003). When we found heterogeneity, we attempted to determine possible reasons for this by examining individual trial and subgroup characteristics in the narrative summary.
Assessment of reporting biases
If we included 10 or more trials that investigated a particular outcome, we planned to use funnel plots to assess small‐trial effects. Several explanations may account for funnel plot asymmetry, including true heterogeneity of effect with respect to trial size, poor methodological design (and hence bias of small trials), and publication bias (Sterne 2017).
Data synthesis
We planned to undertake (or display) a meta‐analysis only if we judged participants, interventions, comparisons, and outcomes to be sufficiently similar to ensure an answer that is clinically meaningful. We used random‐effects meta‐analyses to calculate the mean of the effects of included studies (Borenstein 2017a; Borenstein 2017b; Higgins 2009). We performed statistical analyses according to the statistical guidelines presented in the Cochrane Handbook for Systematic Reviews of Interventions (Deeks 2021).
When studies could not be included in the meta‐analysis, for example, because they did not report the required data or they measured the outcome in a format that was incompatible with other studies, we summarised results from each study under Results and in table form. We used vote counting based on the direction of effect to determine whether the majority of studies found a positive or negative effect (McKenzie 2021).
Subgroup analysis and investigation of heterogeneity
Given the differences between children and adolescents with respect to school setting, types of interventions, etc., we explored the effects of interventions on these two age groups separately, using the subgroup function in Review Manager 5.4.
Given the substantial heterogeneity in types of interventions included, we conducted secondary analyses to synthesise results with respect to each outcome type by subcategories of intervention types. For this purpose, we broadly categorised each intervention type as primarily focused on (1) before or after school physical activity programmes, for example, after school dance clubs, walk to school programmes; (2) enhanced PE classes that focused on increasing the frequency, duration, intensity, or types of activities above and beyond the usual PE classes; (3) multi‐component interventions that typically included a whole‐school approach and utilised multiple strategies including environmental changes to increase physical activity, and often promoted healthy eating or healthy weight amongst students; and (4) schooltime physical activity interventions, such as active academic lessons or cycling desk interventions that focused on integrating physical activity throughout the school day itself rather than restricting physical activity to recess or PE classes.
Sensitivity analysis
We performed no sensitivity analyses.
Summary of findings and assessment of the certainty of the evidence
We used the GRADE approach to assess overall certainty of evidence for each of the primary and secondary outcome measures. GRADE takes into account issues related to both internal and external validity to state how confident we are in the effect estimates presented. Two review authors (SNS, HC) independently rated the certainty of evidence for each outcome. We resolved differences in assessment by discussion. For each outcome, we rated evidence certainty as very low, low, moderate, or high based on the GRADE domains as described in Chapter 14 of the Cochrane Handbook for Systematic Reviews of Interventions (Schünemann 2021). As only RCTs were included, the starting point for certainty of evidence was high. Then we considered each GRADE domain to determine whether downgrading of certainty was needed based on:
risk of bias ‐ based on critical appraisal using the Cochrane 'Risk of bias' tool;
inconsistency of results ‐ based on visual inspection of forest plots and I² in meta‐analyses and consistency of effects reported across narrative syntheses;
indirectness ‐ based on the validity of outcome measures used and how directly they measured the outcome of interest, for example, studies that measure VO₂ peak as a direct measure of fitness provide greater certainty than studies that report estimated fitness based on functional tests;
publication bias ‐ based on a small number of studies or indication of publication bias based on funnel plots; and
imprecision ‐ based on width of the confidence intervals, and whether they include the possibility of a small or null effect.
We presented a summary of the evidence in Table 1. This provides key information about the best estimate of the magnitude of effect as absolute differences for each relevant comparison, numbers of participants and trials addressing each important outcome, and a rating of overall confidence in effect estimates for each outcome. We created the 'Summary of findings' table using the methods described in the Cochrane Handbook for Systematic Reviews of Interventions (Schünemann 2021), along with Review Manager (RevMan 5.4) table editor (RevMan 2014). We reported the following outcomes, listed according to priority.
MVPA (proportion meeting guidelines, duration).
Sedentary time.
Physical fitness.
BMI.
Health‐related quality of life.
Adverse events.
Results
Description of studies
For a detailed description of trials, see Table 2, Characteristics of included studies, Characteristics of excluded studies, and Characteristics of ongoing studies sections.
Results of the search
A total of 16,219 records related to physical activity interventions with children and adolescents were identified for the last update. Of these, 587 studies were assessed for eligibility, and 44 were deemed to meet the criteria for inclusion in the review. The most common reasons studies were judged as not relevant were data on relevant outcomes not reported, studies not RCTs, and studies not relevant to public health.
For this update, when the new inclusion and exclusion criteria were applied (i.e. only studies in which the primary aim was to increase levels of physical activity and that included an objective measure of physical activity, physical fitness, or body composition), 16 of the original 44 studies were excluded: 11 included only self‐report measures (Araujo‐Soares 2009a; Colin‐Ramirez 2010; Dishman 2004; Haerens 2006; Jones 2008; Kipping 2008; Lubans 2009; McManus 2008; Petchers 1988; Singhal 2010; Verstraete 2006); three did not include any measure of physical activity or physical fitness (Li 2010; Martinez 2008; Stephens 1998); and two did not have a primary objective to increase physical activity (Robinson 1999; Singh 2009). Therefore, this update includes 28 of the 44 studies included in the last update (Angelopoulos 2009; Barbeau 2007; Bayne‐Smith 2004; Burke 1998; Bush 1989; Donnelly 2009; Dorgo 2009; Ewart 1998; Gentile 2009; Haerens 2006; Kriemler 2010; Luepker 1996; Neumark‐Sztainer 2009; Neumark‐Sztainer 2010; Peralta 2009; Reed 2008; Salmon 2008; Simon 2004; Stone 2003; Trevino 2004; Walter 1988; Walther 2009; Wang 2008; Webber 2008; Weeks 2008; Williamson 2007; Wilson 2011; Young 2006).
The search strategy for this update from October 2011 to June 2020 yielded 9968 records. Of these, 978 unique full texts were assessed for eligibility. A total of 61 studies met all relevance criteria and were included in this update (Aburto 2011; Adab 2018; Andrade 2014; Ardoy 2011; Belton 2019; Breheny 2020; Carlin 2018; Cohen 2015; Corepal 2019; Daly 2016; de Greeff 2016; de Heer 2011; Donnelly 2017; Drummy 2016; Fairclough 2013; Farmer 2017; Ford 2013; Grydeland 2013; Harrington 2018; Have 2018; Ickovics 2019; Jago 2011; Jago 2014; Jago 2015; Jago 2019; Jansen 2011; Jarani 2016; Ketelhut 2020; Kipping 2014; Kobel 2014; Kocken 2016; Lau 2016; Leahy 2019; Lonsdale 2019a; Madsen 2015; Magnusson 2011; Martinez‐Vizcaino 2014; Melnyk 2013; Müller 2019; Muros 2015; Nogueira 2014; Okely 2011; Ordóñez Dios 2019; Pablos 2018; Resaland 2016; Robbins 2018; Sacchetti 2013; Santos 2014; Seibert 2019; Seljebotn 2019; Siegrist 2013; Siegrist 2018; Suchert 2015; Sutherland 2016; Sutherland 2017; Tarp 2016; Ten Hoor 2018; Thivel 2011; Toftager 2014; Torbeyns 2017; Zhou 2019). The most common reasons studies were judged as not relevant were (1) studies were not RCTs; (2) no device‐based measure of physical activity or physical fitness was included; and (3) the intervention lasted < 12 weeks. This update includes 89 studies (28 from the last review and 61 from this update). A flow diagram depicting these results is presented in Figure 1.
A total of 84 authors were contacted for missing information, and 126 responses were received (median 1 response, range 0 to 4). In most cases, study authors were able to provide clarification on risk of bias or study characteristics, but few of them provided updated outcome data.
Included studies
In addition to information included in the Characteristics of included studies table, we have presented greater detail for each study in Table 2 (overview of study populations) and in Appendix 2 (baseline characteristics). The following is a succinct overview.
Trial design
All included studies were RCTs, with nine randomising participants at the level of the individual, and 80 using a cluster design, whereby schools or classrooms were the unit of randomisation. Across comparator groups, a majority of comparator groups (n = 67) specified continuation of usual school curriculum, standard PE, or no intervention; others reported offering a delayed intervention (n = 3). Some comparator groups included an intervention unrelated to physical activity, such as nutrition education, theatre play group, or education about alcohol or tobacco use (n = 10), and 13 of the comparator groups were not clearly described. The number of included schools ranged from 1 to 96. Most trials were multi‐centre (n = 81), and only 8 trials were conducted within a single school. A total of 31 trials were conducted in 2 to 10 schools, 27 trials in 11 to 20 schools, and 23 trials in more than 20 schools. A majority of trials were not double‐blinded; only 9 of 89 trials reported blinding participants, personnel, and outcome assessors; 6 trials reported blinding participants and personnel but not outcome assessors; and 24 trials reported blinding outcome assessors but not participants or personnel; the remaining 50 trials did not report blinding at all. Trials were conducted from 1983 to 2018. Duration of intervention ranged from 12 weeks to 6 years. Trials were most commonly 12 weeks to 6 months in duration (n = 31), followed by longer than 6 months to 1 year (n = 29), 1 to 2 years (n = 17), and longer than 2 years (n = 12). A majority of studies evaluated only outcomes immediately following the intervention (n = 72); others collected additional data during post‐intervention follow‐up (n = 17). Post‐intervention follow‐up ranged from 2 weeks to 1 year. No trials described a run‐in period, and no trials reported that they were terminated before the planned end of study.
Participants
Across all studies, 96,740 participants were randomised, with at least 46,073 individuals in intervention groups and 40,566 in comparator groups, as not all studies reported the exact numbers randomised to each group. A total of 66,752 participants completed the trials and were included in the analyses. The number of participants randomised ranged from 33 to 11,158, and the number of participants completing trials ranged from 32 to 4063. The average percentage of participants completing the trials was 69.0%, ranging from 35.7% to 100%. Within intervention groups, the average percentage of participants completing the trial was 60.9%, and within control groups, 58.3%, when reported.
A majority of studies were conducted in children 12 years of age or younger at baseline (n = 56); others included only adolescents between the ages of 12 and 18 (n = 22), and some included both children and adolescents (n = 10). One study did not report the age of participants. Most included studies were conducted in the USA (n = 26), Australia (n = 12), and the UK (n = 9). Other countries included Germany (n = 6), Spain (n = 5), The Netherlands (n = 4), Denmark (n = 3), Norway (n = 3), Northern Ireland (n = 3), Belgium (n = 2), Canada (n = 2), China (n = 2), and France (n = 2), and one study each from Albania, Ecuador, Greece, Iceland, Ireland, Italy, Mexico, New Zealand, South Africa, and Switzerland. A range of ethnic groups was represented across trials; however, ethnicity was not reported in 40 of the 89 included studies. Most studies included both male and female students and reported a roughly even split between genders; one study included male students only, 11 included female students only, and 4 did not report the breakdown of male and female students.
Interventions
All studies had intervention components that were delivered in the school setting. Some projects provided additional interventions in the home, community, local theatre, or after school programmes, or via the computer. All studies included a control group that represented a school or a group of schools from a different community, city, or state that did not receive the school‐based intervention. However, in some studies, control schools received other physical activity promotion interventions provided through other health organisations or venues or by a standard PE curriculum. The duration of interventions varied greatly from a minimum of 12 weeks to 6 years, with 10 studies reporting intervention periods of 3 years or longer (Bush 1989; Daly 2016; Donnelly 2009; Donnelly 2017; Ickovics 2019; Luepker 1996; Simon 2004; Stone 2003; Walter 1988; Wang 2008). Several theoretical frameworks were used to develop the physical activity interventions, with some studies citing more than one framework. In 36 studies, it is unclear if a theoretical framework had been used to design and/or deliver the intervention. The most commonly cited theoretical models were social cognitive theory (n = 20), a socioecological model (n = 11), self‐determination theory (n = 10), and the theory of planned behaviour (n = 6). Studies reported in this review differed in funding levels, numbers of project staff, and resources available to deliver the programmes. Further, although all projects were primarily school based, no projects used the same combination of interventions with the same intensity, making each programme unique; however, some similarities were observed with respect to the ways in which interventions were delivered. Most commonly, interventions were multi‐component, whole‐school interventions that included a combination of educational materials, changes to the school environment, and/or school curriculum; and they targeted students, teachers, and/or parents (n = 40). Other interventions (n = 19) were focused primarily on providing opportunities for MVPA within school time, such as active academic lessons. All but one of these interventions targeted children rather than adolescents. Also common were interventions that enhanced the usual school PE programme (n = 15) by incorporating high‐intensity activity into PE classes or increasing the frequency or duration of PE classes. Finally, other interventions included additional opportunities for physical activity before school activities (such as walking groups), lunchtime physical activity programmes, or after school programmes within the school environment (n = 14). One study used a factorial design, comparing enhanced PE and/or an after school programme to usual school activities.
Comparisons
Across 89 trials, a total of 93 comparison groups were described, as each of four studies reported two comparison groups. Most often, investigators described the comparison group as continuing with normal school activities or regular school physical activity or PE without specifying what that might include (40 studies). Sixteen studies described what the typical physical activity in a school would be, which ranged from one PE class per week to two hours of PE per week. Thirteen comparison groups were simply described as ‘no intervention’ or participating only in data collection, with no indication of whether physical activity or PE was a part of the regular school setting. Ten studies described alternative or sham interventions, such as an alcohol and drug abuse prevention programme, with health screening only. One study used a spillover group as a second comparator group, which comprised students who were eligible but declined to participate in the intervention. The remaining 13 studies provided no description of the comparator group.
Outcomes
A protocol paper or trial registry was available for 59 of the 89 included trials; for the remaining 30 trials, a trial document was not identified. Within the 59 trial documents, a single primary outcome was specified in 38 trials; 17 trials documented multiple primary outcomes, and 4 trial documents did not specify a primary outcome. When a single primary outcome was stated, 17 were measures of MVPA, 8 were measures of BMI, 4 were measures of fitness, and 9 involved other endpoints, including other measures of body composition, academic achievement, feasibility, executive function, diabetes, and screen time.
Of the 55 studies that specified a primary outcome in their trial documents, 38 reported the same primary outcome in the publication, 12 specified a different primary outcome in the publication, and 5 did not specify a primary outcome in the publication at all.
Physical activity
A total of 38 of the 89 included trials reported some measure of activity using accelerometers. A number of different devices and protocols were used. Participants were asked to wear the accelerometer for anywhere from 3 to 9 days, but most often (n = 21), participants were asked to wear the accelerometer for 7 days. Three studies did not report accelerometer wear time. Most studies had participants wear the accelerometer for both weekday and weekend days (n = 29); however others recorded only weekday activity (n = 3), and 6 did not specify whether weekend days were included.
Five studies reported on the proportion of students who were physically active, and all studies used the criterion of reaching more than 60 minutes of MVPA per day. Each of two studies measured activity using the Actiheart and Actigraph accelerometers, and 1 used the GENEactive. The specific cut points used to classify activity as MVPA were not reported in 2 studies using the Actiheart (Adab 2018; Kobel 2014); different cut points were used in the other 3 studies using Actigraph and GENEactive accelerometers.
Of the 38 studies that reported on duration of MVPA, most used a model of Actigraph accelerometer (n = 26), and 7 did not report the type of accelerometer model used. Other models include the MTI (n = 2), Actiheart (n = 2), Minimeter (n=1), and GENEactive (n=1). The most commonly used cut points for classifying MVPA were Evenson cut points (17 studies), and 12 studies did not report the cut points used to classify MVPA. Across the remaining 9 studies, a variety of different cut points were reported.
Sedentary time
Sedentary time was measured via accelerometer in 20 studies. The most common cut points used to categorise time spent in sedentary behaviour were Evenson cut points of fewer than 100 counts per minute (n = 9); 6 studies did not specify the cut points used, and 5 studies reported other cut points.
Fitness
Objective physical fitness assessments were reported in 42 studies. Field‐based running tests were used most often, with 13 studies using the Progressive Aerobic Cardiovascular Endurance Run (PACER) test by Leger et al, and an additional 10 studies using a 20‐metre shuttle run protocol but not specifying whether it was the PACER protocol. Studies that used a shuttle run reported outcomes as number of laps completed, estimated VO₂max, age, and sex‐specific z‐scores for number of laps, highest level reached, and/or number of stages completed. Six studies reported using the Anderson 10‐minute interval test with distance run and estimated VO₂max as the outcome variable. One study used a 1‐kilometre run, 1 used a mile run, and 1 used a 9‐minute run protocol. Incremental treadmill tests with gas analysis were used in 3 studies, expressed as VO₂max, and 1 employed a peak power test on a cycle ergometer, expressed as Watts per kilogram of body mass. Last, 2 studies used the Queens College Step Test, 1 used the bench‐stepping test, 1 used the Harvard step test, 1 used the British Athletics Linear Track Test, and 1 used a 6‐minute run test.
Body mass index
Seventy‐one studies reported on BMI using objective measures. The most common expression of BMI, reported in 49 studies, was as kg/m². Three studies used country‐specific z‐scores (England and Germany), and 2 studies used German‐specific BMI percentile values. WHO z‐scores were used in 2 studies, Centers for Disease Control and Prevention z‐scores were used in 3 studies, and percentiles were used in an additional 3 studies. One study used the International Obesity Task Force cutoffs for weight status. Twelve studies used z‐scores but did not specify the source, 6 studies did not describe methods, and 1 study reported percentage body fat.
Health‐related quality of life
Only 7 studies reported some aspect of health‐related quality of life; a summary of the instruments used can be found in Appendix 5. Only one tool ‐ the Child Health Utility 9D ‐ was used in more than 1 study (Breheny 2020; Harrington 2018; Jago 2019).
Adverse events
Adverse events were not commonly reported in studies. Only 16 of 89 included studies provided any information about adverse events, most commonly to say that no adverse events were noted. Only 3 studies reported data about the number and nature of adverse events that occurred during the study in the intervention or control group.
Excluded studies
For this update, we excluded a total of 736 studies after full‐text review. The most common reason for exclusion was that trials were not randomised trials or trials did not include an objective measure of physical activity or physical fitness. Reasons for exclusion of studies from this update are available in the Characteristics of excluded studies table.
Risk of bias in included studies
For details on the risk of bias of included trials, see Characteristics of included studies and a summary across trials in Figure 2 and Figure 3.
2.
Risk of bias graph: review authors' judgements about each risk of bias item presented as percentages across all included trials (blank cells indicate that the particular outcome was not measured in some trials).
3.
Risk of bias summary: review authors' judgements about each risk of bias item for each included trial (blank cells indicate that the particular outcome was not measured in some trials).
Allocation
All included studies were RCTs, and a majority of included studies provided an adequate description of the methods used to generate the randomisation sequence (e.g. computer randomisation) and the methods used to conceal allocation from participants and personnel. Sixty‐seven of 89 studies adequately described randomisation sequence, 18 of 89 studies were unclear in their reporting, and 4 of 89 studies did not report an adequate method for creating the randomisation sequence and were described as high risk of bias in this domain. Sixty‐three of 89 studies adequately described allocation concealment, 15 of 89 were unclear or did not describe allocation concealment well, and in 11 of 89 studies, allocation concealment was not performed, introducing high risk of bias in this domain.
Blinding
The most notable methodological weakness of these studies is the lack of blinding of participants and personnel, with only 15 out of 89 studies adequately reporting that participants and study personnel were blinded to group allocation. This was primarily done by not informing participants about the overall goal of the study or the presence of other intervention arms. Blinding of participants and personnel was unclear in 17 of 89 studies, and in 57 of 89 studies, blinding of participants or personnel was not done, introducing high risk of bias in this domain. Adequate blinding of outcome assessors was described in 33 of 89 trials and was unclear in 22 of 89 trials. In 34 of 89 trials, outcome assessors were not blinded, introducing high risk of bias in this domain. All outcomes included in this review were objective measures and did not rely on self‐report, therefore reducing but not eliminating the potential for bias.
Incomplete outcome data
We assessed incomplete outcome data separately for physical activity and sedentary time outcomes and for physical fitness and anthropometric data. Among studies that assessed physical activity participation or duration, risk of bias due to incomplete outcome data was deemed low in 20 out of 40 studies, unclear in 4 of 40 studies, and high in 16 of 40 studies. Among studies that assessed sedentary time, 11 of 20 studies were deemed at low risk of bias for incomplete outcome data, 2 of 20 studies were unclear, and 7 of 20 studies had large quantities of missing data that introduced high risk of bias.
For studies that measured physical fitness, 23 of 42 studies were deemed at low risk of bias, 5 of 42 studies were unclear in their reporting of outcome data completion, and 14 of 42 had large quantities of missing data that introduced high risk of bias. Among studies that measured BMI, 40 of 74 studies were deemed at low risk of bias for completion of outcome assessment, 5 of 74 studies were unclear in the quantity of missing data, and 29 of 74 had large quantities of missing data that introduced high risk of bias.
Selective reporting
Forty‐six of 89 studies were deemed at low risk of bias for selective outcome reporting and reported on all of the outcomes specified in trial protocols or published protocol papers. Twenty‐nine studies were unclear in their selective outcome reporting, often because a protocol paper was not published, and 14 studies were deemed at high risk of bias for selective outcome reporting.
Other potential sources of bias
Cluster‐randomised trials
A total of 80 included trials were cluster‐randomised trials; therefore, risk of bias was appraised within four additional categories (recruitment bias, baseline imbalances, loss of clusters, and incorrect analysis). With respect to recruitment bias, 35 of 80 trials were deemed at low risk of bias, 13 were unclear in the timing of recruitment and randomisation, and 32 were at high risk of bias, often because schools or classes were aware of their intervention status prior to participant enrolment in the trial. With respect to baseline imbalance, 63 of 80 trials were deemed at low risk of bias, 11 of 80 were unclear, and 6 of 80 were deemed at high risk of bias. For loss of clusters, 54 out of 80 were deemed at low risk of bias, as they retained all clusters in the trials, 4 of 80 were unclear, and 22 were deemed at high risk of bias due to loss of clusters throughout the trial. Finally, with respect to incorrect analysis of cluster‐RCTs, 62 of 80 were deemed at low risk of bias, as they properly accounted for the clustered nature of the data in their statistical analysis, and 18 trials were deemed at high risk of bias for failing to incorporate clustering into their analyses.
Effects of interventions
See: Table 1
See Table 1.
Effects of school‐based physical activity interventions on primary outcomes
Physical activity participation
Overall, we are very uncertain about the effects of school‐based physical activity programmes on the proportion of students meeting physical activity guidelines due to inconsistency of effects between studies, imprecision around the effects, and risk of bias in the included studies contributing to this outcome.
This outcome was reported in only 5 studies with quite different interventions (Analysis 1.1). One study explored the effects of after school dance classes on the proportion of girls meeting physical activity guidelines (Jago 2015). At the end of the 20‐week study, between‐group differences in adherence to guidelines were found to be ‐1.11% (95% confidence interval (CI) ‐1.68 to ‐0.73) in the intervention group compared to the control group. One study found that although both groups had fewer adolescents meeting guidelines at the end of study, the decline was noted to be smaller in the intervention group than in the control group; however confidence intervals were not reported (difference 12.22%; P < 0.01) (Andrade 2014). Another study found an uncertain effect on the odds of meeting the guidelines in the intervention group compared to the control group at end of study (odds ratio (OR) 0.65, 95% CI 0.23 to 1.85) (Harrington 2018). One study found a similar proportion of students meeting the guidelines at 15 or 18 months following a whole‐school physical activity and nutrition intervention (difference at 15 months 0.005%, 95% CI ‐0.101 to 0.140) (Adab 2018). One study found that after one year, differences in the proportion of participants meeting guidelines between intervention and control groups were 10.4%; study authors noted that the difference between groups was not statistically significant but included no measure of variation (Kobel 2014).
1.1. Analysis.
Comparison 1: PA programme vs no PA programme, Outcome 1: Physical activity participation: all data
| Physical activity participation: all data | ||||||
| Study | Study population | Intervention group | Control Group | Measurement period | Overall effect | Comment |
| Children: before and after school programme | ||||||
| Jago 2015 | Year 7 female students | After‐school dance classes | Provided data only | 20 weeks | Between group difference in % meeting 60 min/day of MVPA: −1.11% (95% CI −1.68, −0.73) | |
| 1 year | Between group difference in % meeting 60 min/day of MVPA: −1.18% ( (95% CI −1.82, 0.76) | |||||
| Children: schooltime PA | ||||||
| Kobel 2014 | Pupils at primary school, grades 1 and 2 | Teacher training, PA education, and active breaks | No intervention | 1 year | Between‐group difference in % meeting 60 min/day of MVPA: 10.4% (not statistically significant) Intervention group: 54.7% Control group: 44.3% |
|
| Children: multi‐component interventions | ||||||
| Adab 2018 | Year 1 students (aged 5 to 6 years) | 30 min of additional MVPA on each school day, cooking workshops, a 6‐week healthy eating program, and information sheets for families | Ongoing year 2 health related activities and education resources, excluding topics related to healthy eating and PA | 15 months | Between‐group difference in % meeting 60 min/day of MVPA: 0.005% (95% CI −0.101, 0.140) | |
| 18 months | Between‐group difference in % meeting 60 min/day of MVPA: −0.067% (95% CI −0.165, 0.096) | |||||
| Adolescents: multi‐component interventions | ||||||
| Andrade 2014 | Grades 8 and 9 students | ACTIVITAL individual‐ and environmental‐based intervention | Standard curriculum | 28 months | Between‐group difference in % meeting guidelines: 12.22% (P < 0.01) Intervention group: ‐5.87% Control: ‐18.09% |
|
| Harrington 2018 | Female students in years 7 to 9, 11 to 14 years old | Support for PA, PE, and school sport culture and practices with the support of the Youth Sport Trust and a hub school | Continued with normal PA habits | 7 months (midpoint) | Meeting guidelines: OR: 0.78 (0.23, 2.65) | |
| 14 months | Meeting guidelines: OR: 0.65 (0.23, 1.85) | |||||
Physical activity duration
Overall, school‐based physical activity interventions probably have little to no effect on minutes per day of MVPA among children and adolescents (mean difference (MD) 0.73, 95% CI 0.16 to 1.30; 33 studies; Analysis 1.2 moderate‐certainty evidence). These findings should be interpreted with caution due to the inconsistency in outcomes reported based on visual inspection of forest plots and substantial heterogeneity across studies (I² = 75%).
1.2. Analysis.
Comparison 1: PA programme vs no PA programme, Outcome 2: Physical activity duration (minutes/d): meta‐analysis
Six additional studies provided data that were not included in the meta‐analysis. Most findings were consistent with results from the meta‐analysis (Analysis 1.4). Following one year of PE enhanced with strength training and motivational interviewing among adolescents, a significant between‐group difference was found in the percentage of time spent in MVPA; however, the magnitude of this difference was not reported (Ten Hoor 2018). In a study of Grade 7 students, those who took part in a biweekly after school PA programme, enhanced PE, or both were found to increase the percentage of time spent in MVPA (MD 1.99%, 95% CI 1.68 to 2.30; MD 3.12%, 95% CI 2.76 to 3.48; MD 4.98%, 95% CI 4.62 to 5.34, respectively), which was noted by study authors as statistically significant (Zhou 2019).
1.4. Analysis.
Comparison 1: PA programme vs no PA programme, Outcome 4: Physical activity duration: additional data
| Physical activity duration: additional data | ||||||
| Study | Study population | Intervention group | Control Group | Measurement period | Overall effect | Comment |
| Before and after school programmes | ||||||
| Zhou 2019 | Junior high school students, grade 7 | I1: Biweekly after school program | Regular PE (2 days per week) | 32 weeks | % of time spent in MVPA: MD 1.99 (95% CI: 1.68, 2.30) I1: m 4.22 (sd 1.39) Control: m 2.23 (sd 1.52) |
% time reported, not min/day |
| I2: Enhanced PE (3 days per week) plus after school program | Regular PE (2 days per week) | 32 weeks | % of time spent in MVPA: MD 4.98 (95% CI: 4.62, 5.34) I2: m 7.21 (sd 1.84) Control: m 2.23 (sd 1.52) |
Authors note that statistically significant changes were found from baseline to follow‐up in both intervention groups but not the control group however analyses were not described. | ||
| Enhanced PE | ||||||
| Ten Hoor 2018 | Secondary school students, 11 to 15 years old | Strength training and motivational interviewing | Usual curriculum | 1 year | Between group difference in % of time spent in MPVA tested, P = 0.046 | No values reported |
| Zhou 2019 | Junior high school students, grade 7 | I1: Enhanced PE (3 days per week) | Regular PE (2 days per week) | 32 weeks | % of time spent in MVPA: MD 3.12 (95% CI: 2.76, 3.48) I1: m 5.35 (sd 1.79) Control: m 2.23 (sd 1.52) |
% time reported, not min/day |
| I2: Enhanced PE (3 days per week) plus after school program | % of time spent in MVPA: MD 4.98 (95% CI: 4.62, 5.34) I2: m 7.21 (sd 1.84) Control: m 2.23 (sd 1.52) |
Authors note that statistically significant changes were found from baseline to follow‐up in both intervention groups but not the control group however analyses were not described. | ||||
| Multi‐component intervention | ||||||
| Corepal 2019 | Students age 12‐14 | Pedometer challenge | Usual school | Baseline | Intervention: m 33.3 min/day, IQR: 23.6, 49.0) Control: m 43.6 min/day, IQR: 31.0, 69.3 | Feasibility trial, therefore statistical testing not conducted |
| 22 weeks | MD: ‐14.4 min/day Intervention: m 33.0 min/day, IQR: 20.0, 46.2 Control: m 47.4 min/day, IQR: 32.7, 65.1 |
No estimates of variance given, only mean and interquartile range | ||||
| Salmon 2008 | Grade 5 students (10 to 11 years old) | I1: Behavioral modification group, I2: fundamental motor skills group, I3: combined behavioral modification and fundamental motor skills group |
Usual classroom lessons | 1 school year | Adjusted between group difference (vs. control group) I1: MD 2.8 (95% CI 0.3, 5.4) min/day I2: MD 7.8 (95% CI 3.4, 12.3) min/day I3: MD 3.1 (95% CI ‐0.58, 6.7) min/day |
Vigorous PA only |
| 1 year post‐intervention | Adjusted between group difference (vs. control group) I1: MD 2.8 (95% CI 0.2, 5.4) min/day I2: MD 7.7 (95% CI 3.2, 12.2) min/day I3: MD 3.0 (95% CI ‐0.59, 6.6) min/day |
Vigorous PA only | ||||
| Schooltime PA | ||||||
| Ford 2013 | Primary school students aged 5 to 11 years | Accumulated brisk walking program | Normal school lessons | 15 weeks | Change from baseline MD ‐27.4 (95% CI: ‐91.0, 36.2) counts per min Intervention group: ‐29.2 (‐72.0, 13.6) counts per min, P = 0.415 Control group: ‐1.8 (‐50.3, 46.7) counts per min, P = 0.772 |
Weekday counts per min only |
| Magnusson 2011 | Children attending grade 2 (born in 1999) | Students engaged in PA during PE lessons, recess, and during classes; schools had access to PA equipment to use in school lessons; teaching materials promoting PA were provided | Followed the general PA curriculum | 1 year (midpoint) | Group x time interaction in multivariable model P < 0.0001 | |
| 2 years | Group x time interaction in multivariable model P = 0.10 | |||||
In one study, changes in vigorous activity were reported from an intervention targeting behavioural modification (MD 2.8 minutes/d, 95% CI 0.3 to 5.4) or fundamental movement skills (MD 7.8 minutes/d, 95% CI 3.4 to 12.3 minutes/d), and combining behavioural modification and fundamental movement skills (MD 3.1 minutes/d, 95% CI ‐0.58 to 6.7) compared to control (Salmon 2008). Grade 2 children who engaged in physical activity during school, lessons, and recess were noted to take part in more MVPA at study midpoint but not at the end of the intervention; values were not reported (Magnusson 2011). Following implementation of a brisk walking programme during the school day, moderate to vigorous accelerometer counts were reported in the intervention group compared to a control group (MD ‐27.4 counts/min, 95% CI ‐91.0 to 36.2) (Ford 2013). Finally, within‐school and between‐school pedometer step challenges among adolescents age 12 to 14 years were found to be feasible, but minutes/d of MVPA appeared stable across groups throughout the intervention periods (MD ‐14.4 minutes/d, no measure of variance reported) (Corepal 2019).
In subgroup analyses, no differences in effects were found between interventions targeting children and adolescents (test for subgroup differences, P = 0.35; Analysis 1.2); however there were subgroup differences by intervention type (test for subgroup difference, P = 0.03; Analysis 1.3).
1.3. Analysis.
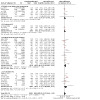
Comparison 1: PA programme vs no PA programme, Outcome 3: Physical activity duration by intervention type (minutes/d): meta‐analysis
Children
In subgroup analyses, school‐based physical activity interventions targeting children probably do not result in a meaningful change in minutes per day of MVPA (MD 1.01 minutes/d, 95% CI 0.08 to 1.93; 22 studies; Analysis 1.2 moderate‐certainty evidence). These findings should be interpreted with caution due to substantial heterogeneity across studies (I² = 69%). Across studies that were not included in the meta‐analysis, findings were consistent (Analysis 1.4).
Adolescents
School‐based physical activity interventions probably do not result in a meaningful change in minutes per day of MVPA among adolescents (MD 1.84 minutes/d, 95% CI 0.34 to 3.35; 11 studies; Analysis 1.2; moderate‐certainty evidence), with substantial heterogeneity (I² = 81%); when differences were found, they were generally small in magnitude (Analysis 1.4).
Before and after school programmes
A total of 6 included studies implemented before and after school programmes in the school setting. Overall, before and after school programmes probably do not increase time spent in MVPA (MD 0.77 minutes/d, 95% CI ‐1.40 to 2.94; 6 studies; Analysis 1.3; moderate‐certainty evidence). Moderate heterogeneity was found across studies (I² = 50%).
Enhanced PE
Three studies tested the effects of enhanced PE interventions. These interventions probably do not change MVPA (MD ‐0.23 minutes/d, 95% CI ‐1.58 to 1.11; 3 studies; Analysis 1.3; moderate‐certainty evidence); however results should be interpreted with caution due to high heterogeneity (I² = 83%).
Multi‐component interventions
Multi‐component interventions in the school setting probably result in small increases in MVPA among children and adolescents (MD 2.42 minutes/d, 95% CI 0.62 to 4.22; 16 studies; Analysis 1.3; moderate‐certainty evidence); however results should be interpreted with caution due to high heterogeneity (I² = 76%).
Schooltime PA
Schooltime PA interventions probably do result in small increases in MVPA among children and adolescents (MD 5.30 minutes/d, 95% CI 0.89 to 9.72; 8 studies; Analysis 1.3; moderate‐certainty evidence); however results should be interpreted with caution due to high heterogeneity (I² = 73%).
Sedentary time
Identified evidence suggests that school‐based physical activity interventions may have little to no difference in minutes per day of sedentary time (MD ‐3.78 minutes/d, 95% CI ‐7.80 to 0.24; 16 studies; Analysis 1.5; low‐certainty evidence). These findings should be interpreted with caution due to imprecision of the effect estimate and risk of bias of included studies.
1.5. Analysis.
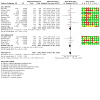
Comparison 1: PA programme vs no PA programme, Outcome 5: Sedentary time (minutes/d): meta‐analysis
Four additional studies provided data that were not included in the meta‐analysis. A majority of findings were consistent with meta‐analysis results, finding little or no effect (Analysis 1.7). Three studies reported sedentary time as an outcome within enhanced PE interventions in adolescents. In a study of teacher PE training, the between‐group mean difference in time spent sedentary at 7 months was 0.92% (95% CI ‐0.28 to 2.13) and was 0.02% (95% CI ‐0.99 to 0.95) at 14 months (Lonsdale 2019a). After one year of strength training and motivational interviewing, study authors note no statistically significant decrease in the percentage of time spent sedentary; however only P values were reported (Ten Hoor 2018). In a study of Grade 7 students, the change in percentage of time spent sedentary among those who took part in a biweekly after school PA programme, enhanced PE, or both was found to be 1.34% (95% CI ‐0.73 to 3.41), 1.11% (95% CI ‐1.09 to 3.31), and 0.11% (95% CI ‐2.31 to 2.54), respectively (Zhou 2019). Finally, within‐school and between‐school pedometer step challenges in adolescents age 12 to 14 years were found to be feasible, but sedentary time appeared stable across groups throughout intervention periods (MD 1.2 minutes/d; no measure of variance reported) (Corepal 2019).
1.7. Analysis.
Comparison 1: PA programme vs no PA programme, Outcome 7: Sedentary time: additional data
| Sedentary time: additional data | ||||||
| Study | Study population | Intervention group | Control Group | Measurement period | Overall effect | Comment |
| Before and after school programmes | ||||||
| Zhou 2019 | Junior high school students, grade 7 | I1: Biweekly after school program | Regular PE (2 days per week) | 32 weeks | % of time spent sedentary: MD 1.34 (95% CI: ‐0.73, 3.41) I1: m 75.74 (sd 8.81) Control: m 74.40 (sd 10.80) |
% time reported, not min/day |
| I2: Enhanced PE (3 days per week) plus after school program | Regular PE (2 days per week) | 32 weeks | % of time spent sedentary: MD 0.11 (95% CI: ‐2.31, 2.54) I2: m 74.51 (sd 11.95) Control: m 74.40 (sd 10.80) |
Authors note that statistically significant changes were found from baseline to follow‐up in the after school program only, however analyses were not described or presented | ||
| Enhanced PE | ||||||
| Lonsdale 2019a | Grade 8 students | Teacher PE training | Standard teaching | 7‐8 months | % time spent sedentary: MD 0.92 (95% CI −0.28, 2.13) | % time reported, not min/day |
| 14‐15 months | % time spent sedentary: MD 0.02 (95% CI −0.99, 0.95) | |||||
| Ten Hoor 2018 | Secondary school students, 11 to 15 years old | Strength training and motivational interviewing | Usual curriculum | 1 year | Between group difference in % of time spent sedentary, P = 0.715 | % time reported, not min/day |
| Zhou 2019 | Junior high school students, grade 7 | I1: Enhanced PE (3 days per week) | Regular PE (2 days per week) | 32 weeks | % of time spent sedentary: MD 1.11 (95%CI: ‐1.09, 3.31) I1: m 75.51 (sd 9.64) Control: m 74.40 (sd 10.80) |
% time reported, not min/day |
| I2: Enhanced PE (3 days per week) plus after school program | Regular PE (2 days per week) | 32 weeks | % of time spent sedentary: MD 0.11 (95% CI: ‐2.31, 2.54) I2: m 74.51 (sd 11.95) Control: m 74.40 (sd 10.80) |
Authors note that statistically significant changes were found from baseline to follow‐up in the after school program only group, however analyses were not described. | ||
| Multi‐component intervention | ||||||
| Corepal 2019 | Students 12‐14 years old | Pedometer challenge | Usual school | Baseline | Intervention: m 449.6 min/day, IQR: 416.5, 524.3 Control: m 466.3 min/day, IQR: 410.0, 534.9 |
Feasibility trial therefore no statistical analyses performed |
| 22 weeks | MD 1.2 min/day Intervention: m 454.7 min/day, IQR: 405.7, 517.8 Control: m 453.5 min/day IQR: 399.8, 529.6 |
Variance cannot be calculated as only mean and interquartile range reported | ||||
In subgroup analyses, no differences in effects were found between children and adolescents (test for subgroup differences, P = 0.58; Analysis 1.5) or by intervention type (test for subgroup difference, P = 0.58; Analysis 1.6).
1.6. Analysis.
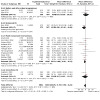
Comparison 1: PA programme vs no PA programme, Outcome 6: Sedentary time (minutes/d) by intervention type: meta‐analysis
Children
Overall, school‐based physical activity programmes may not reduce sedentary time among children (MD ‐3.35 minutes/d, 95% CI ‐9.30 to 2.60; 11 studies; Analysis 1.5; low‐certainty evidence), with low heterogeneity of 37% (Analysis 1.5).
Adolescents
School‐based physical activity programmes may result in little to no difference in sedentary time of adolescents (MD ‐5.67 minutes/d, 95% CI ‐11.48 to 0.14; 5 studies; Analysis 1.5; low‐certainty evidence), with no heterogeneity observed (I² = 0%) (Analysis 1.5).
Before and after school programmes
Before and after school programmes in the school setting may not decrease sedentary time (MD 2.01 minutes/d, 95% CI ‐15.28 to 19.31; 2 studies; Analysis 1.6; low‐certainty evidence). Moderate heterogeneity was found across studies (I² = 46%).
Enhanced PE
Only one study explored the impact of enhanced PE on sedentary time (MD ‐11.18 minutes/d, 95% CI ‐21.96 to ‐0.40; 1 study; Analysis 1.6; low‐certainty evidence).
Multi‐component interventions
Multi‐component interventions in the school setting may result in small decreases in sedentary time (MD ‐4.60 minutes/d, 95% CI ‐9.08 to ‐0.12; 11 studies; Analysis 1.6; low‐certainty evidence). No heterogeneity was noted (I² = 0%).
Schooltime PA
Schooltime PA interventions may not decrease sedentary time (MD ‐3.26 minutes/d, 95% CI ‐19.05 to 12.52; 2 studies; Analysis 1.6; low‐certainty evidence); however results should be interpreted with caution due to the small number of studies and high heterogeneity (I² = 70%).
Effects of school‐based physical activity interventions on secondary outcomes
Fitness
Evidence suggests that school‐based physical activity programmes may improve physical fitness assessed by measured or estimated VO₂max (MD 1.19 mL/kg/min, 95% CI 0.57 to 1.82; 13 studies; Analysis 1.8; low‐certainty evidence). These findings should be interpreted with caution due to inconsistency in effect estimates (based on the high level of heterogeneity in the meta‐analysis (I² = 90%) and visual inspection of forest plots) and indirectness in measuring fitness using estimated VO₂max in most studies.
1.8. Analysis.
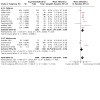
Comparison 1: PA programme vs no PA programme, Outcome 8: Physical fitness (mL/kg/min): meta‐analysis
Twenty‐nine additional studies provided data that were not included in the meta‐analysis. Most results were consistent with the direction of the pooled effect (Analysis 1.10).
1.10. Analysis.
Comparison 1: PA programme vs no PA programme, Outcome 10: Physical fitness: additional data
| Physical fitness: additional data | ||||||
| Study | Study population | Intervention group | Control Group | Measurement period | Overall effect | Comment |
| Before or after school programme | ||||||
| Carlin 2018 | Female students, aged 11 to 13 years old | Brisk walking intervention | Continued with normal PA habits | 12 weeks | No significant changes were observed between group | Data not shown |
| 6 months | No significant changes were observed between group | |||||
| de Heer 2011 | Children in grades 3 to 5 with no condition that would endanger their own or others’ safety | Bienstar intervention of health education and 45 min to 60 min of after school PA | Grade 4 health workbooks and incentives | 12 weeks | Shuttle run performance: MD 3.87 (SE 1.51) laps, P = 0.012 | |
| Wang 2008 | Grade 3 students | 'FitKid' after‐school intervention sessions | — | 3 years | Heart rate response to step test, group*time interaction P < 0.01 | |
| Zhou 2019 | Junior high school students, grade 7 | I1: Biweekly after school program | Regular PE (2 days per week) | 32 weeks | 20‐m shuttle run performance (change from baseline): MD 8.86, 95% CI: 5.68, 12.04) I1: m 12.38 (95% CI 10.2, 14.56) Control: m 3.52 (95% CI 1.18, 5.85) |
Authors note that statistically significant changes were found between both intervention and control groups but analyses were not described |
| I2: Enhanced PE (3 days per week) plus after school program | Regular PE (2 days per week) | 32 weeks | 20‐m shuttle run performance (change from baseline): MD 22.26 laps (95% CI: 19.15, 25.37) I2: m 25.78 (95% CI: 23,7, 27.86) Control: m 3.52 (95% CI: 1.18, 5.85) |
|||
| Enhanced PE | ||||||
| Ketelhut 2020 | Grade 3 students | High intensity interval training | Regular PE | 12 weeks | Between‐group difference in aerobic fitness z‐score: 7.7 (95% CI 2.3, 13.2) | |
| Kriemler 2010 | Grades 1 and 5 students | 2 additional 45‐minute PE lessons/week, activity breaks, and PA homework | Usual, mandatory PE lessons | 9 months | Adjusted shuttle run performance: MD −0.12 (95% CI −0.21, −0.03) stages, P = 0.009 | |
| Ordóñez Dios 2019 | Children age 11‐12 years | Daily run added to regular PE | Regular PE | 12 weeks | 1km time Between‐group difference in change from baseline: ‐0.55 minutes, 95% CI: ‐0.75, ‐0.35 |
|
| Thivel 2011 | Children in grades 1 or 2 | 120 min of additional supervised PE | Habitual 2 H of PE/week | 6 months | Shuttle run performance Between‐group difference in change from baseline: m 0.36, 95% CI: 0.23, 0.49 stages |
|
| Zhou 2019 | Junior high school students, grade 7 | I1: Enhanced PE (3 days per week) | Regular PE (2 days per week) | 32 weeks | 20‐m shuttle run performance (change from baseline): MD 14.33 laps (95%CI: 11.16, 17.50) I1: m 17.85 (95% CI 15.68, 20.02) Control: m 3.52 (95% CI 1.18, 5.85) |
Authors note that statistically significant changes were found between both intervention and control groups but analyses were not described |
| I2: Enhanced PE (3 days per week) plus after school program | 20‐m shuttle run performance (change from baseline): MD 22.26 laps (95% CI: 19.15, 25.37) I2: m 25.78 (95% CI: 23,7, 27.86) Control: m 3.52 (95% CI: 1.18, 5.85) |
|||||
| Multi‐component intervention | ||||||
| Aburto 2011 | Students in grades 4 and 5 | I1: basic intervention of environmental and policy‐level change I2: plus intervention adding additional resources and daily morning exercise |
No change to the standard practices | 18 months | From baseline to follow‐up, there were no significant changes in either group in distance run during the 9 minute run test (P > 0.05) | |
| Andrade 2014 | Grades 8 and 9 students | ACTIVITAL individual‐ and environmental‐based intervention | Standard curriculum | 28 months | Shuttle run performance: MD −0.19 (95% CI −0.54, 0.16) min | |
| Burke 1998 | — | I1: standard PA and nutrition program including classroom lessons, fitness sessions daily, and nutrition program, I2: I1 plus a PA enrichment program for higher‐risk children |
No program | 9 months | Shuttle run performance Girls: Number of laps increased in both intervention groups vs. control group (P = 0.0001) Boys: Number of laps increased in both intervention groups vs. control group (P = 0.0008) |
|
| Cohen 2015 | Grades 3 and 4 students | Teacher learning, PA policies, school‐community linkages | Usual PE and school sport programs | 12 months | Shuttle run performance: MD 5.4 (95% CI 2.3, 8.6) laps, P = 0.003 | 20 m shuttle run test |
| Jago 2011 | Students enrolled in grade 6 | Education, social marketing, food environment, PE curriculum, and equipment provision | Recruitment and data collection only | 2.5 years | Between‐group difference in change in shuttle run performance: MD 0.2 laps, 95% CI: ‐0.5, 0.9) | |
| Jansen 2011 | Grades 3 to 5 | 3 PE sessions/week, additional after school sport and play, classroom education, and parent health promotion | Continued with usual curriculum | 1 school year | Shuttle run performance: MD 0.57 (95% CI 0.13, 1.01) laps | |
| Grades 6 to 8 | Shuttle run performance: MD 0.04 (95% CI ‐0.45, 0.53) laps | |||||
| Madsen 2015 | Grades 3, 4, and 5 students | Nutrition education curriculum, Playworks structured recess before or after school activities, PA and games implemented by teachers | — | 2 years | Mile run time: MD 0.2 (95% CI ‐0.8, 0.4) minutes | |
| Reed 2008 | Grades 4 and 5 children | Action Schools!BC whole‐school PA approach | Regular program of PE and school‐based PA | 11 months | Shuttle run performance, adjusted for baseline values: MD 6 laps, 95% CI: 1.6, 10.4 | |
| Seibert 2019 | Grade 5, 9 to 10 years old | Physically active lessons (45 min) 2‐3d/week on days without PE, physically active homework and physically active recess | Normal routine, 135 min/week of PA | 10 months | Progressive Aerobic Cardiovascular Endurance Run score (change from baseline): MD ‐1.1, 95% CI: ‐2.2, 0.01) Fitness z‐scores (change from baseline: MD ‐0.10, 95% CI: ‐0.15, ‐0.04 |
Change favours the control group |
| Toftager 2014 | — | Physical and organizational environmental changes | — | 2 years | Shuttle run distance: MD 6 (95% CI ‐20, 31) metres, P = 0.43 | |
| Trevino 2004 | All grade 4 children | Health programming regarding 3 health behavior messages associated with diabetes mellitus control and goal setting | — | 7 months | Fitness score: MD 1.87 (95% CI ‐1.44, 5.17) points, P = 0.04 |
Harvard Step Test used |
| Schooltime PA | ||||||
| Breheny 2020 | Years 3 (aged 7–8 years) and 5 (aged 9–10 years) | Daily mile, 15‐minutes of PA incorporated into the school day | Usual school day | 12 months | Linear track test: MD ‐37.4 (95% CI ‐74.7, ‐0.19) metres |
Difference favours control group |
| de Greeff 2016 | Grades 2 and 3 students | Physically active mathematics and language lessons | Usual curriculum | 2 years | Shuttle run performance: MD adjusted for baseline values 0.05 stages, SE: 0.14 |
|
| Donnelly 2017 | Grades 2 and 3 students | Academic Achievement and Physical Activity Across the Curriculum lessons, 160 min/week of MVPA | Traditional classroom instruction and typical PE schedule | 3 years | Progressve Aerobic Cardiorespiratory Endurance Run test performance: MD 1.3 laps, 95% CI: ‐0.5, 3.1 | |
| Have 2018 | Grade 1 students | Active math lessons | Regular classroom instruction | 10 months | Between group difference in intermittent shuttle run test performance: MD 10.0 (SE 13.9) metres, P > 0.05 | |
| Leahy 2019 | Grade 11 students | Burn2Learn, multi component high intensity interval training | Usual school activities | 14 weeks | Shuttle run performance: MD 8.9 (95% CI 1.7, 16.2) laps, P = 0.01 | |
| Magnusson 2011 | Children attending grade 2 | Students engaged in PA during PE lessons, recess, and during classes; schools had access to PA equipment to use in school lessons; teaching materials promoting PA were provided | Followed the general PA curriculum | 2 years | Load achieved on a cycling test: MD 0.37 (95% CI ‐0.27, 1.01) w/kg, P = 0.18 | |
| Resaland 2016 | Grade 5 and 6 | Physically active Norwegian, mathematics, and English lessons on the playground; PA breaks and PA homework | Curriculum‐prescribed PE and PA | 7 months | Intermittent shuttle run test performance: MD 6.9 (95% CI −8.9, 22.6) metres, P = 0.387 | |
| Seljebotn 2019 | Grade 5 students | Physically active lessons, active homework, and physically active recess | Continued normal routine, approximately 135 min/week of PA | 10 months | No significant differences found (no data reported) | |
| Tarp 2016 | Grades 6 and 7 students | 60 min of PA during school time, PA homework | Normal practice | 20 weeks | Shuttle run test performance: MD 9.4 (95% CI ‐3.7, 22.4) metres, P = 0.16 | |
| Torbeyns 2017 | Grades 3 and 4 students | Cycling desks | No lifestyle change | 22 weeks | Shuttle run test performance (change from baseline): MD 0.5 stages, 95% CI: ‐0.5, 1.5 | |
Four studies explored the impact of before and after school physical activity interventions. One study found an improvement in shuttle run performance with MD of 3.87 laps (standard error (SE) 1.51; P = 0.012) laps following 12 weeks of health education and after school physical activity (de Heer 2011). In a second study, the authors noted a statistically significant improvement in heart rate response to a step test after the ‘FitKid’ after school physical activity programme, although absolute values were not reported (Wang 2008). In a study of a brisk walking intervention delivered to adolescents, authors reported that the intervention had little to no effect on fitness (Carlin 2018); however no values for physical fitness were reported. In another study, a bi‐weekly after school programme on its own or combined with enhanced PE yielded statistically significant improvement in shuttle run performance in both intervention groups (MD 8.86 laps, 95% CI 5.68, 12.04 and 22.26 laps; 95% CI 19.15 to 25.37, respectively) (Zhou 2019).
Five studies investigated the effects of enhanced PE on the fitness of school‐age children. Following 12 weeks of adding a daily run to regular physical activity, between‐group difference in 1‐km run time was MD ‐0.55 minutes (95% CI ‐0.75 to ‐0.35) (Ordóñez Dios 2019). An additional 120 minutes/week of supervised PE resulted in a between‐group difference in shuttle run stages of MD 0.36 stages (95% CI 0.23 to 0.49) (Thivel 2011). One study found that two additional 45‐minute PE lessons per week resulted in a between‐group difference in stages on the shuttle run test favouring the control group (MD ‐0.12 stages, 95% CI ‐0.21 to ‐0.03) (Kriemler 2010). After 12 weeks of high‐intensity interval training, between‐group difference in z‐scores in Grade 3 students was MD 7.7 (95% CI 2.3 to 13.2) (Ketelhut 2020). In another study, enhanced PE on its own or combined with a biweekly after school programme yielded statistically significant improvement in shuttle run performance in both intervention groups (MD 14.33 laps, 95% CI 11.16 to 17.50; and MD 22.26 laps, 95% CI 19.15 to 25.37, respectively) (Zhou 2019).
Eleven studies explored the effects of multi‐component interventions. After 12 months of teacher learning, physical activity policies, and school community linkages, MD of 5.4 laps (95% CI 2.3 to 8.6) was found in children (Cohen 2015). A one‐year multi‐component intervention resulted in between‐group differences among students in Grades 3 to 5 of 0.57 laps (95% CI 0.13 to 1.01) and in Grades 6 to 8 of 0.04 laps (95% CI ‐0.45 to 0.53) (Jansen 2011). Following a 9‐month intervention, study authors reported that the number of laps completed by children on the shuttle run significantly increased in the intervention group versus the control group, but values were not reported (Burke 1998). After 11 months of a whole‐school physical activity programme, between‐group difference in shuttle run laps in intervention versus control groups was +6 laps (95% CI 1.6 to 10.4) (Reed 2008). In one study, authors reported that the difference in change in shuttle run performance at 2.5 years was 0.2 laps (95% CI ‐0.5 to 0.9) following a multi‐component intervention for children consisting of education, social marketing, changes to the food environment, and PE curriculum (Jago 2011). One study reported that physically active lessons, physically active homework, and physically active recess resulted in within‐group differences in laps in the control group (m 5.8, SE 0.4) and in the intervention group (m 4.7, SE 0.4), with a between‐group MD of ‐1.1 (95% CI ‐2.2 to 0.01) favouring the control group (Seibert 2019). Following an intervention with environmental and policy‐level changes, study authors reported no statistically significant differences in distance covered during a nine‐minute run test; however absolute values were not reported (Aburto 2011). Following two years of nutrition education, Playworks structured recess, and before and after school activities, the between‐group difference in mile run time was MD 0.2 minutes (95% CI ‐0.8 to 0.4) (Madsen 2015). After 28 months of individual‐ and environmental‐based interventions, between‐group difference in time during a shuttle run for adolescents was MD ‐0.19 minutes (95% CI ‐0.54 to 0.16) (Andrade 2014). Following seven months of health programming and health messaging targeting diabetes control and goal‐setting, between‐group difference in Harvard Step Test scores was MD 1.87 points (95% CI ‐1.44 to 5.17; P = 0.04) (Trevino 2004). Last, the mean difference in shuttle run test distance between adolescents in schools that underwent physical and organisational environmental changes and a control group was MD 6 metres (95% CI ‐20 to 31 after two years of follow‐up) (Toftager 2014).
Finally, ten studies reported on the impact of schooltime PA interventions. Following 12 months of the Daily Mile programme, results favoured the control group (MD ‐37.4 metres, 95% CI ‐74.7 to ‐0.19) (Breheny 2020). Study authors noted that shuttle run performance increased by 0.8 laps in both intervention and control groups after two years of physically active math and language lessons (MD 0.05 stages, SE 0.14; not statistically significant) (de Greeff 2016). After three years of physically active lessons, mean difference in shuttle run test was 1.3 laps (95% CI ‐0.5 to 3.1) (Donnelly 2017). One study found that active math lessons delivered over one 10‐month school year resulted in mean difference in shuttle run test distance of 10 metres (SE 13.9; P > 0.05) (Have 2018). An intervention including 60 minutes of physical activity during school time and physical activity homework found a between‐group difference in shuttle run distance of MD 9.4 metres (95% CI ‐3.7 to 22.4) at 20 weeks (Tarp 2016). An intervention consisting of 7 months of physical activity lessons, homework, and breaks found MD 6.9 metres (95% CI ‐8.9 to 22.6) (Resaland 2016). After 22 weeks of using cycling desks in the classroom, the mean difference in 20‐metre shuttle run was 0.5 stages (95% CI ‐0.5 to 1.5) (Torbeyns 2017). After two years of active physical activity, PE lessons, classroom physical activity, and additional physical activity equipment and teaching materials, the mean difference in maximal cycling test output was 0.37 watts/kg (95% CI ‐0.27 to 1.01) (Magnusson 2011). Physically active lessons, active homework, and recess did not produce a statistically significant effect, although no data were reported (Seljebotn 2019). Finally, 14 weeks of high‐intensity interval training resulted in a mean difference of 8.9 laps (95% CI 1.7 to 16.2) at 14 weeks (Leahy 2019).
In subgroup analyses, no differences in effects were found between children and adolescents (test for subgroup differences, P = 0.08; Analysis 1.8). Differences in effects by intervention type were noted (test for subgroup difference, P < 0.001; Analysis 1.9).
1.9. Analysis.
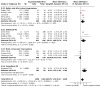
Comparison 1: PA programme vs no PA programme, Outcome 9: Physical fitness (mL/kg/min) by intervention type: meta‐analysis
Children
Overall, evidence suggests that school‐based physical activity programmes probably improve physical fitness among children (MD 1.47 mL/kg/min, 95% CI 0.84 to 2.09; 9 studies; Analysis 1.8 moderate‐certainty evidence). However, this should be interpreted with caution, as only 9 of 31 included studies reported sufficient data to be included in the meta‐analysis. Moderate heterogeneity was also noted across trials (I² = 64%).
Adolescents
Generally, school‐based physical activity programmes probably result in little to no difference in physical fitness (Analysis 1.10). Pooled analysis from studies that reported VO₂max revealed no difference (MD 0.58 mL/kg/min, 95% CI ‐0.18 to 1.35; 4 studies; moderate‐certainty evidence; moderate heterogeneity (I² = 87%).
Before and after school programmes
Before and after school programmes in the school setting probably improve physical fitness (MD 1.38 mL/kg/min, 95% CI 0.34 to 2.41; 5 studies; Analysis 1.9 moderate‐certainty evidence). High heterogeneity was found across studies (I² = 88%).
Enhanced PE
Studies that enhanced PE as part of the intervention probably resulted in improvements in physical fitness (MD 1.99 mL/kg/min, 95% CI 0.76 to 3.21; 4 studies; Analysis 1.9 moderate‐certainty evidence); however high heterogeneity was found across studies (I² = 82%).
Multi‐component interventions
Multi‐component interventions in the school setting probably do not change physical fitness (MD ‐0.33 mL/kg/min, 95% CI ‐0.73 to 0.08; 3 studies; Analysis 1.9 moderate‐certainty evidence); however results should be interpreted with caution due to the small number of studies. No heterogeneity was noted (I² = 0%).
Schooltime PA
Only one study that used schooltime PA to increase fitness was included in the meta‐analysis (MD 2.70, 95% CI 1.04 to 4.36; 1 study; Analysis 1.9); thus, results should be interpreted with caution.
Body mass index
Overall, evidence suggests that school‐based physical activity programmes may result in a very small decrease in BMI z‐score among children and adolescents (MD ‐0.06, 95% CI ‐0.09 to ‐0.02; 21 studies; Analysis 1.11 low‐certainty evidence) and may not decrease BMI (MD ‐0.07 kg/m², 95% CI ‐0.15 to 0.01; 50 studies; Analysis 1.13 low‐certainty evidence). These results should be considered with caution, as substantial heterogeneity and risk of bias were found across studies.
1.11. Analysis.
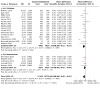
Comparison 1: PA programme vs no PA programme, Outcome 11: BMI: meta‐analysis [z‐scores]
1.13. Analysis.
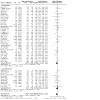
Comparison 1: PA programme vs no PA programme, Outcome 13: BMI: meta‐analysis [kg/m2]
Nine additional studies provided data that could not be included in the meta‐analysis. Findings were mixed. After a 9‐month multi‐component intervention, study authors reported that BMI decreased among boys in the intervention group versus the control group, but not among girls; values were not reported (Burke 1998). After 3 years of a physical activity or physical activity and nutrition wellness policy, study authors found no differences in children's BMI; however values were not reported (Ickovics 2019). Between‐group differences were reported in children's BMI/age‐sex population median values following an intervention targeting behavioural modification (MD ‐0.40, 95% CI ‐1.11 to 0.30), fundamental movement skills (MD ‐0.50, 95% CI ‐1.25 to 0.25), or both (MD ‐1.30, 95% CI ‐2.29 to ‐0.31) (Salmon 2008). After 3 years of physically active lessons, the difference in BMI percentile between intervention and control groups was MD ‐2.3 (95% CI ‐4.8 to 0.2) (Donnelly 2017). After 1 year of active breaks during class time, the between‐group difference in BMI percentile was 0.5 (95% CI ‐0.5 to 1.5) (Kobel 2014). A 2‐year intervention to increase schooltime PA also yielded a between‐group difference in BMI that was not statistically significant, and effect estimates were not reported (Williamson 2007). A 12‐week brisk walking intervention for adolescents produced no difference, but effect estimates were not reported (Carlin 2018). A 16‐week intervention consisting of enhanced PE or enhanced PE with a focus on increasing intensity had no impact on BMI in adolescents, with no values reported (Ardoy 2011). Last, a 1‐year multi‐component intervention for adolescents resulted in a mean difference in BMI percentile of MD 1.09 (95% CI ‐0.64 to 2.82) (Suchert 2015).
In subgroup analyses, no differences in effects were found between children and adolescents for BMI z‐scores (test for subgroup differences, P = 0.23; Analysis 1.11) nor for BMI (test for subgroup differences, P = 0.19; Analysis 1.13). In subgroup analyses by intervention type, no differences in effects were found between intervention types for BMI z‐scores (test for subgroup differences, P = 0.61; Analysis 1.12) nor for BMI (test for subgroup differences, P = 0.80; Analysis 1.14).
1.12. Analysis.
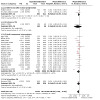
Comparison 1: PA programme vs no PA programme, Outcome 12: BMI by intervention type: meta‐analysis [z‐scores]
1.14. Analysis.
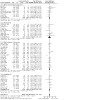
Comparison 1: PA programme vs no PA programme, Outcome 14: BMI by intervention type: meta‐analysis [kg/m2]
Children
School‐based physical activity interventions for children may decrease BMI z‐scores; MD ‐0.06 (95% CI ‐0.11 to ‐0.01; 16 studies; substantial heterogeneity of 88%; Analysis 1.11; low‐certainty evidence). These interventions may also result in a small decrease in BMI (MD ‐0.11 kg/m², 95% CI ‐0.19 to ‐0.02; 38 studies; substantial heterogeneity of 84%; Analysis 1.13; low‐certainty evidence).
Adolescents
School‐based physical activity interventions for adolescents may not decrease BMI z‐scores (MD ‐0.03, 95% CI ‐0.05 to ‐0.00; 5 studies; I² = 0%; Analysis 1.11 low‐certainty evidence) nor BMI (MD 0.05 kg/m², 95% CI ‐0.16 to 0.25; 12 studies; I² =88%; Analysis 1.13 low‐certainty evidence).
Before and after school programmes
Before and after school programmes in the school setting may not decrease BMI z‐scores (MD ‐0.02, 95% CI ‐0.05 to 0.01; 2 studies; Analysis 1.12 low‐certainty evidence) nor BMI (MD ‐0.12 kg/m², 95% CI ‐0.25 to 0.01; 9 studies; Analysis 1.14 low‐certainty evidence). Very little heterogeneity was found across studies (I² = 0%, 7%, respectively).
Enhanced PE
Studies that enhanced PE as part of the intervention may not decrease BMI z‐scores (MD ‐0.08, 95% CI ‐0.29 to 0.13; 1 study; Analysis 1.12 low‐certainty evidence) nor BMI (MD ‐0.04 kg/m², 95% CI ‐0.32 to 0.24; 10 studies; Analysis 1.14 low‐certainty evidence). Results should be interpreted with caution, as only one study reported changes in BMI z‐scores, and high heterogeneity was found across studies for BMI (I² = 92%).
Multi‐component interventions
Multi‐component interventions in the school setting may result in small decreases in BMI z‐scores (MD ‐0.06, 95% CI ‐0.11 to ‐0.01; 17 studies; Analysis 1.12 low‐certainty evidence) but not in BMI (MD ‐0.10 kg/m², 95% CI ‐0.24 to 0.03; 20 studies; Analysis 1.14 low‐certainty evidence). In both analyses, high heterogeneity was found across studies (I² = 87%, 93%, respectively).
Schooltime PA
Only one study reported on the effect of schooltime PA on BMI z‐score (MD ‐0.03, 95% CI ‐0.08 to 0.02; 1 study; Analysis 1.12 low‐certainty evidence). Schooltime PA may not decrease BMI (MD ‐0.05 kg/m², 95% CI ‐0.14 to 0.04; 11 studies; Analysis 1.14 low‐certainty evidence). Low heterogeneity was found across studies.
Health‐related quality of life
Seven included studies reported on health‐related quality of life (Analysis 1.16). Given the limited data reported across heterogeneous interventions and populations, as well as the risk of bias in included studies and possible reporting bias in studies that did not report results for this outcome, we are very uncertain about the effects of school‐based physical activity interventions on health‐related quality of life. A full description of the scales used to assess health‐related quality of life can be found in Appendix 5.
1.16. Analysis.
Comparison 1: PA programme vs no PA programme, Outcome 16: Health‐related quality of life: all data
| Health‐related quality of life: all data | ||||||
| Study | Study population | Intervention group | Control Group | Measurement period | Overall effect | Comment |
| Children | ||||||
| Adab 2018 | Year 1 students (aged 5 to 6 years) | 30 min of additional MVPA on each school day, cooking workshops, a 6‐week healthy eating program, and information sheets for families | Ongoing year 2 health related activities and education resources, excluding topics related to healthy eating and PA | 15 months 30 months |
MD −0.630 (95% CI −4.385, 3.124) points MD 1.248 (95% CI −2.301, 4.796) points |
Measured using Pediatric quality of life inventory |
| Breheny 2020 | Year 3 (aged 7‐8 years) and 5 (9‐10 years) students | Daily Mile, 15 minutes of running/walking within the school grounds during the school day, not to replace PE | Usual school | 12 months | MD 0.010 (95% CI ‐0.002, 0.04) | Measured using Child Health Utility 9D |
| Jago 2015 | Year 7 female students | After‐school dance classes | Provided data only | Baseline T1 T2 |
Baseline MD 0.01 points, P = 0.309 T1 MD 0.0 points, P = 0.667 T2 MD 0.0 points, P = 0.382 |
Meausured using European Quality of Life‐5 Dimensions Youth survey |
| Jago 2019 | Year 3 and 4 students, 7 to 9 years old | Action 3:30R after school PA club | — | End of study | No difference in utility scores or z‐scores between groups | Measured using KIDSCREEN‐10 |
| Resaland 2016 | Grade 5 and 6 | Physically active Norwegian, mathematics, and English lessons on the playground; PA breaks and PA homework | Curriculum‐prescribed PE and PA | End of study | No significant differences found (no data shown) | Measured using KIDSCREEN‐10 |
| Adolescents | ||||||
| Harrington 2018 | Female students in years 7 to 9, 11 to 14 years old | Support for PA, PE, and school sport culture and practices with the support of the Youth Sport Trust and a hub school | Continued with normal PA habits | End of study | No significant differences found (no data shown) | Measured using Child Health Utility 9D |
| Leahy 2019 | Grade 11 students | Burn2Learn, multi component high intensity interval training | Usual school activities | 14 weeks | MD −2.1 (95% CI −4.0, −0.3) points, P = 0.02 | Measured using Strengths and Difficultlies Questionnaire; lower score indicates fewer perceived difficulties |
One study reported a decrease in perceived psychological difficulties among adolescents after 14 weeks of high‐intensity interval training compared to those in a control group (MD ‐2.1 points, 95% CI ‐4.0 to ‐0.3) as measured by the Strengths and Difficulties Questionnaire (Leahy 2019). A school‐based physical activity and healthy eating programme noted a mean difference of 1.248 (95% CI ‐2.301 to 4.796) in paediatric quality of life as measured by the Pediatric Quality of Life inventory (Adab 2018). An after school dance programme noted a mean difference in health‐related quality of life of 0.0 points (P = 0.667) when using the European Quality of Life 5 Dimensions Youth Survey (Jago 2015). The Daily Mile intervention resulted in a between‐group difference of 0.010 points (95% CI ‐0.002 to 0.04) after 12 months on the Child Health Utility 9D, where higher scores indicate poorer health (Breheny 2020). The remaining three studies reported no statistically significant differences between groups and provided no data (Harrington 2018; Jago 2019; Resaland 2016).
Adverse events
Of the 89 trials included, only 16 reported anything related to adverse events (Analysis 1.17). Based on limited data on adverse events reported, including inconsistency between studies, high risk of bias, and the possibility of reporting bias in studies that did not report results for this outcome, the evidence is of very low certainty; we cannot confidently conclude whether there are or are not potential safety concerns related to school‐based physical activity interventions. Of the studies that noted adverse events, 13 simply stated that no adverse events occurred as part of the intervention. Often minimal detail was given as to how adverse events were tracked or recorded. Adverse events were reported in three studies. In one study, a minor adverse event occurred when an intervention participant made contact with another participant while doing a handstand (Nogueira 2014). Another study reported adverse event rates across both study groups of 2.4% at baseline and 1.7% at end of study related to a blood draw for data collection (Jago 2011). The most commonly reported adverse event was dizziness and was not deemed to be related to the intervention itself. Finally, one study reported 24 adverse events such as musculoskeletal injuries; 20 were deemed to be mild, three moderate, and one serious, for an overall adverse event rate of 0.0006 events per programme hour (Wang 2008).
1.17. Analysis.
Comparison 1: PA programme vs no PA programme, Outcome 17: Adverse events: all data
| Adverse events: all data | ||
| Study | Participants with at least one adverse event (N) | Participants discontinuing trial due to an adverse event (N) |
| Andrade 2014 | 0 | 0 |
| Breheny 2020 | 0 | 0 |
| Cohen 2015 | 0 | 0 |
| Ford 2013 | 0 | 0 |
| Harrington 2018 | 0 | 0 |
| Ickovics 2019 | 0 | 0 |
| Jago 2011 | Baseline: 205 events End of Study: 141 events |
0 |
| Jago 2015 | 0 | 0 |
| Ketelhut 2020 | 0 | 0 |
| Leahy 2019 | 0 | 0 |
| Martinez‐Vizcaino 2014 | 0 | 0 |
| Müller 2019 | 0 | 0 |
| Nogueira 2014 | 1 | 0 |
| Okely 2011 | 0 | 0 |
| Salmon 2008 | 0 | 0 |
| Wang 2008 | Year 1: 24 events | 0 |
Assessment of reporting bias
To assess the potential for reporting bias, we created funnel plots for MVPA, sedentary time, fitness, and BMI reported in kg/m² and z‐scores (Figure 4, Figure 5, Figure 6, Figure 7, Figure 8). Because we used a random‐effects meta‐analysis, 95% confidence intervals are not calculated via RevMan 5.4. Based on our interpretation of the funnel plots, it appears there may be some degree of reporting bias in studies that report on minutes per week of MVPA. This reporting bias may lead to overestimation of the magnitude of the effect; however given the overall null findings of the meta‐analysis, this does not change our conclusions.
4.
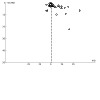
Funnel plot of comparison: 1.2 Physical activity duration: meta‐analysis.
5.
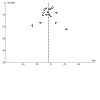
Funnel plot of comparison: 1.5 Sedentary time: meta‐analysis.
6.
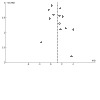
Funnel plot of comparison: 1.8 Physical fitness: meta‐analysis.
7.
Funnel plot of comparison: 1.11 BMI: meta‐analysis [z‐scores].
8.
Funnel plot of comparison: 1.13 BMI: meta‐analysis [kg/m2].
Trials ongoing and awaiting classification
Within our search, we identified 16 trials that are awaiting classification (Characteristics of studies awaiting classification), as well as 12 studies that are ongoing (Characteristics of ongoing studies). Within the studies awaiting classification, 12 are marked as ‘complete’ in the clinical trials registry, but no publications can be found; one has been published only as a protocol paper (Friedrich 2015); two have published conference abstracts but with insufficient information to determine eligibility (O'Malley 2011; Telford 2019); and one has published baseline results only (Salmon 2011a). Within the 9 ongoing studies, trial start dates ranged from 2014 to 2018, with planned end dates from 2020 to 2022. Three studies did not indicate a planned end date.
Discussion
Summary of main results
The objective of this updated review was to assess, analyse, and draw conclusions about the effectiveness of school‐based interventions in promoting physical activity and fitness among school‐attending children and adolescents aged 6 to 18 years. Our primary outcomes were physical activity and sedentary time, with secondary outcomes of fitness, body composition, health‐related quality of life, and adverse effects. Finally, through subgroup analyses, we sought to identify which types of interventions may be most effective for improving physical activity, fitness, and body mass index (BMI) in this population.
The results of this update do not differ greatly from those reported in the original review in 2009 and in the update in 2013. Overall, school‐based physical activity interventions may improve physical fitness (low‐certainty evidence) but probably have minimal impact on time engaged in moderate to vigorous physical activity (MVPA) (moderate‐certainty evidence) and may result in little to no decrease in sedentary time (low‐certainty evidence). Although school‐based physical activity interventions may result in a small decrease in BMI z‐scores (low‐certainty evidence), they may not impact BMI measured as kg/m² (low‐certainty evidence). In this version of the review, only objective measures of physical activity, sedentary time, fitness, and BMI were included. This is important progress, as the advantages of objectively measured physical activity and sedentary time outweigh the advantages of self‐report measures of these outcomes. In addition, the commercialisation of these devices means the costs of these devices are no longer as prohibitive as they once were. The original review and the 2013 update found that school‐based physical activity interventions had a small positive impact on duration of MVPA and television viewing; however, these systematic reviews primarily measured activity using self‐report measures completed by children, parents, or teachers, which may have introduced substantial bias into the results.
We are uncertain as to the effects of school‐based physical activity interventions on the proportion of children or adolescents who met the physical activity guidelines recommendation of 60 minutes of daily MVPA. Some studies report that multi‐component interventions increase the proportion of adolescents meeting guidelines; however, only 2 studies reported on this outcome, and more work is needed to increase the certainty of these findings. When MVPA was reported in minutes/d, little to no difference was seen in the duration of MVPA among children and adolescents. When separated by the type of intervention implemented, some evidence suggests that schooltime physical activity programmes and multi‐component interventions may result in larger increases in MVPA. This is a new finding from our 2013 review, which did not examine effects separately by the type of intervention implemented due to the smaller number of studies. Except for multi‐component interventions, which may result in a small decrease in sedentary time, school‐based physical activity programmes do not appear to be effective in reducing sedentary time among both children and adolescents.
In contrast, school‐based physical activity interventions may have a small to moderate effect on physical fitness among both children and adolescents. In particular, enhanced physical education (PE) and before and after school programmes may result in the largest gains in fitness. Interventions that focused specifically on increased exercise intensity (such as high‐intensity interval training ‐ Leahy 2019 ‐ and an enhanced PE intervention with a specific focus on increased exercise intensity ‐ Ardoy 2011) led to the largest effect sizes.
Although BMI was the most reported outcome, school‐based physical activity interventions may result in a small decrease when measured as z‐scores, and little to no difference when measured as kg/m². Although many of the multi‐component interventions did include additional components such as nutrition education or changes to the school food environment, a more specific focus on diet and nutrition both inside and outside the school environment may be needed to change body weight trajectories (Ho 2012; Ho 2013). Notably, in this update, interventions that were targeted primarily at improving body composition without an explicit focus on physical activity or physical fitness were excluded.
The 2013 review found limited evidence that positive effects are maintained in the longer term, although only a small number of studies measured outcomes beyond the end of the intervention. In this version, several studies reported long‐term follow‐up, but evidence to suggest that changes were maintained long term remains limited. One limitation of this update is that we explored impact only at the immediate post‐intervention time period due to wide heterogeneity in follow‐up times across interventions. The wide variety of study designs, lengths of intervention, and lengths of follow‐up make it challenging to further comment on sustainable effects of the interventions. As more data become available, future updates may have access to sufficient data to pool effects from studies with longer follow‐up time periods.
Very few studies reported on differences in response to interventions between boys and girls, and these results were mixed in with results of studies that did report these differences. As such, we did not seek to carry out a subgroup analysis on differential effects in boys versus girls. Recent estimates suggest there are meaningful differences in physical activity levels between boys and girls, and that although prevalence of insufficient physical activity decreased from 2001 to 2016 in boys, no such change occurred among girls (Guthold 2020). Future studies in this field should examine results separately for boys and girls to determine if interventions have similar effects in individuals of both genders.
Finally, few studies reported information about adverse events, or how these were identified and captured. Adverse events reported were generally muscle soreness or injury related to physical activity and bruising related to a data collection blood draw, for example. One systematic review on physical activity and health outcomes related to physical activity interventions overall reported that no included studies reported any harm or injury associated with physical activity participation (Poitras 2016). These types of potential harms should be explored and reported clearly in future school‐based trials.
One aspect not often considered is the potential for adverse effects on quality of life or harms related to the stigma of participating in physical activity with their peers at school. Also missing from most studies was consideration of factors related to health equity. If physical activity or physical education programming does not meet the needs of individual students or certain subgroups of students, participation may be limited, which may be reflected in variation in findings across studies. In a review of studies about meaningful experiences in physical education and sport, identified themes were social interaction, fun, challenge, competition, motor competence, and personally relevant experiences (Beni 2017). Negative experiences reported in physical education classes in childhood were related to embarrassment and lack of enjoyment of fitness testing and sport, and positive memories of school physical education, such as enjoyment of class activities, time spent with friends or outside, or being allowed to move more after sitting in class all day, were associated with positive attitudes and intentions to be physically active in adulthood in another study (Ladwig 2018). These studies suggest that students need to identify personal meaning in their school physical activity opportunities; a “one‐size‐fits‐all” approach may not be appropriate to encourage physical activity participation.
Most studies did not comment on aspects related to implementation of interventions, such as uptake or adherence to the interventions and fidelity of delivery. It is unknown if interventions were successfully delivered within the schools, which can often be challenging. Without an understanding of fidelity of delivery, any additional minutes of MVPA that resulted from taking part in the school‐based intervention could be compensated for by a decrease in MVPA outside of school time; thus, no overall change in full‐day MVPA was observed. Also, failure to properly implement the programme and poor adherence to the intervention at the student level may occur. Finally, although patient‐oriented research and community engagement initiatives are becoming increasingly prevalent in adult research literature, youth engagement in both design and implementation of these interventions may prove to be a useful strategy to promote uptake and adherence. This could in turn result in not only more meaningful improvements in these short‐term behaviours but also a long‐term commitment to physical activity to improve health and reduce chronic disease risk into adulthood.
Overall completeness and applicability of evidence
A comprehensive search of randomised controlled trials (RCTs) and cluster‐RCTs was conducted, and it is unlikely that many studies were missed by our search strategy. Studies included in this review are applicable to public health and education in high‐income countries, as most studies were conducted in the USA, the UK, and Australia; different strategies may be needed and different effects may be found in low‐ to middle‐income countries. Most studies included in this review were conducted in school‐age children (ages 6 to 12); a smaller number were conducted in adolescents. Although ten trials were conducted exclusively in female students, only one study was conducted among boys only, and few trials explored the effects of sex and gender in the analysis.
The types of interventions included varied widely, and no two studies implemented the same interventions. This makes it very challenging to draw conclusions as to the most effective components of interventions that can elicit changes in the outcomes of interest. The benefit of the wide variety of interventions is that researchers and policy makers can search a variety of protocols to determine what might be effective for future interventions or programming.
Although RCTs are considered the gold standard design for exploring efficacy, it is possible that inclusion of non‐randomised intervention studies may have provided more information on outcomes that were important to this review, namely, health‐related quality of life and adverse events. Given the large number of included trials, it is not feasible to include non‐randomised evidence in this update. However, we wish to acknowledge the potential for this information to be included in studies that were not captured in this review.
Quality of the evidence
As outlined, several factors limited the certainty of results in this review. The most common reason why certainty was downgraded was inconsistency, assessed through visual inspection of forest plots and I² values from the meta‐analysis. This criterion for downgrading was applied to all outcome measures except for sedentary time. Inconsistency in findings is not surprising, given the large differences in target populations, components of interventions studied (including dose and type of physical activity), ways in which outcomes were assessed, and time periods of follow‐up. Nonetheless, this inconsistency limits our confidence in the effects of school‐based physical activity interventions overall.
The quality of the evidence was also limited by high or uncertain risk of bias in the included studies. Although all included trials were individually randomised or cluster‐randomised trials, a number of methodological limitations were present. In particular, blinding of participants and personnel and of outcome assessors often was not reported, introducing the potential for performance and detection bias in assessment of results. Due to the nature of school‐based physical activity interventions, it is near impossible to blind participants and personnel to the assigned intervention. However, blinding of outcome assessors and data analysts is important and could be improved upon in future studies. Attrition bias was also prevalent across studies, particularly for measures of physical activity and sedentary time. Some loss to follow‐up is unavoidable in school‐based interventions, and study authors often reported the proportion of students lost to follow‐up due to moving and changing schools. However, often a greater proportion of missing data was related to physical activity or sedentary time measured by accelerometers. Adherence to wear time protocols for these devices may be poor within some populations, and data loss or technical issues were possible. When there is differential incomplete outcome data by intervention group within trials, these findings are particularly susceptible to bias.
Although this review included only objectively measured physical activity and sedentary time, accelerometers and pedometers are not without limitations. When accelerometers are used to measure physical activity and sedentary time, the accelerometer model, epoch length, non‐wear time, definition of a valid day, wear time criteria, and cut points can differ, causing wide variation between studies and limiting the precision of the effect estimate (as was seen in studies of proportions of participants physically active and sedentary time). For example, a longer epoch length will underestimate MVPA. When studies have minimum wear‐time criteria, the data may be more indicative of habitual physical activity, but sample size will be reduced. The cut points used will also have an impact on physical activity and sedentary time duration (Cain 2013).
Very few of the included studies measured maximal oxygen uptake (VO₂max) directly using gas exchange; this was most often predicted by field tests. This resulted in downgrading of the certainty of evidence for physical fitness due to indirectness. For the most part, studies did use reliable, valid, field‐based measures of aerobic fitness; however the usefulness of these tests is largely determined by participants’ motivation to try their hardest, thus reducing the change that a true measure of fitness was achieved.
Our confidence in the evidence related to both health‐related quality of life and adverse events was limited by potential publication bias, with overall certainty of findings downgraded accordingly. Although many studies reported that no adverse events were reported, most studies did not adequately describe the approach taken to monitor for any adverse events. Although 7 studies reported on health‐related quality of life, others listed these outcomes in protocol papers or in trial registries but did not publish the findings; thus the potential of publication bias remains.
Finally, very few studies reported on the extent to which interventions were implemented as specified. Without adequate process evaluation data, it is not known to what degree students participated in the intervention, and this could have an influence on the impact of the intervention on our outcomes of interest. Information about implementation is important, to understand trial fidelity and for scaling up of interventions in the future. About half of the trials were informed by various theoretical models, including social cognitive theory, socioecological model, self‐determination theory, and the theory of planned behaviour. These theories are intended to promote physical activity at the individual level and may not be as relevant to public health interventions, such as the school‐based studies included in this review (King 2002).
Potential biases in the review process
It is possible that biases were introduced in the review process; however, several steps were taken to minimise this. A comprehensive search strategy, with updates from our previous search strategy to include new terms (such as sedentary time), was used to identify over 9000 citations from 2011 to the present. We did not place limitations by language or publication status. Although efforts were undertaken to minimise this bias (multiple review authors were involved in interpreting results and provided comments on drafts of this update), it is possible that we have interpreted the results to be more positive than they actually are. Readers of this review are cautioned therefore to carefully examine results across studies.
Agreements and disagreements with other studies or reviews
Overall, our findings are similar to those of other systematic reviews and meta‐analyses that have addressed similar questions. A recent systematic review and meta‐analysis examined effects of school‐based physical activity interventions on physical activity and sedentary time, including only cluster‐randomised controlled trials (Love 2019). When studies measured changes in MVPA during the actual intervention period (i.e. during PE class only in an intervention of enhanced PE), there was moderate evidence of effect, whereas when changes in MVPA were examined over the whole school day, effects were inconclusive, and when changes in MVPA were examined across the entire day (both in and out of school time), no effect was seen (Love 2019). It is interesting to note that these study authors also explored the effectiveness of interventions by gender and socioeconomic status and found no difference in effect in terms of either of these variables.
Other reviews have focused more closely on specific intervention types, with similar findings to those presented in this review. A 2019 review of 22 studies that implemented active breaks within the classroom found a small but not significant increase in minutes of MVPA compared to a control group (+3.29 minutes/d, 95% CI ‐0.15 to 8.75) (Masini 2020). However, in this review, only physical activity during class time was included, as opposed to full‐day physical activity measures that were included in this review. Bedard and colleagues found a small reduction in sedentary time when schools took part in an active classroom intervention; however all studies were found to have moderate to high risk of bias (Bedard 2019). A review of active transport interventions found low‐quality evidence to suggest that active transportation can increase transportation‐related MVPA, but with no associated change in physical fitness among children aged 4 to 11 years (Jones 2019).
Authors' conclusions
Implications for practice.
Following are suggestions for public health practitioners, decision‐makers, and policy makers. School‐based physical activity interventions as they have been designed and delivered to date probably have little to no impact on overall time spent in MVPA and may have little to no impact on time spent sedentary. Some evidence suggests that multi‐component interventions that address the whole‐school environment and incorporate physical activity throughout the school day (e.g. physically active lessons, physical activity breaks) may have the strongest impact on time spent in MVPA. Although not the focus of this review, an additional focus on physical activity outside the school environment may help to increase overall physical activity levels. Public health organisations can support schools in providing implementation, assessment, and evaluation.
Although school‐based physical activity interventions may improve physical fitness, specific focus on targeting higher‐intensity activity is warranted.
Finally, school‐based physical activity programmes may have only a very small impact on BMI z‐scores and little to no impact on BMI in kg/m². If the primary goal is to promote healthy body weight, it is likely that another type of intervention may be needed to attain meaningful improvements.
Implications for research.
Across outcomes, the certainty of evidence was downgraded due to inconsistency of findings across interventions. This may be attributed to (1) variability in strategies used and in the frequency, intensity, and duration of interventions; (2) use of various theoretical models to guide the intervention; (3) use of a variety of instruments and tools to assess physical activity or physical fitness (or both); and (4) follow‐up periods of different durations. Full reporting on components of the interventions delivered (e.g. by using the Template for Intervention Description and Replication (TIDieR)) may be helpful in further understanding heterogeneity across studies to identify critical components of success (Hoffmann 2014).
Lack of change in leisure‐time physical activity or physical fitness, in turn, has been attributed most often to issues of (1) inadequate dose (Tolfrey 2000); (2) poor compliance (Baranowski 1990); (3) inattention to the multiplicity of risk factors for physical inactivity and subsequent overly simplistic, uni‐dimensional interventions; (4) methodological errors in measuring fitness (e.g. assessing heart rate only after, as opposed to during, activity); and (5) failure to control for potentially confounding variables (Tolfrey 2000), particularly in cluster‐randomised trials. Future studies should ensure that each of these aspects has been carefully considered in both design and delivery of interventions, which may help to enhance understanding and explain heterogeneity across trials.
What's new
| Date | Event | Description |
|---|---|---|
| 22 September 2021 | New search has been performed | Search has been updated to June 2020 to include new studies. Inclusion criteria have been updated to include only studies with objective measures of physical activity and sedentary time. Previously included outcomes of television viewing time, blood pressure, and blood cholesterol have been removed. New outcomes have been added: sedentary time, body mass index z‐scores, health‐related quality of life, and adverse events. Appraisal of risk of bias has been updated according to the updated Cochrane Handbook for Systematic Reviews of Interventions, including additional considerations for cluster‐randomised controlled trials. Meta‐analyses have been conducted, with subgroup analyses by age (children vs adolescents) and by intervention type. The GRADE approach to interpretation of findings has been incorporated. Overall conclusions with respect to the impact of interventions on fitness and BMI have not changed. After limiting the included studies to only those that use objective measures of physical activity we now conclude that school‐based physical activity interventions probably have minimal impact on time engaged in moderate to vigorous physical activity. |
| 22 September 2021 | New citation required and conclusions have changed | Overall conclusions with respect to the impact of interventions on fitness and BMI have not changed. However, after limiting the included studies to only those that use objective measures of physical activity we now conclude that school‐based physical activity interventions probably have minimal impact on time engaged in moderate to vigorous physical activity. |
History
Review first published: Issue 1, 2009
| Date | Event | Description |
|---|---|---|
| 21 October 2011 | New search has been performed | Searches have been run for the update period (July 2007 to October 2011); 30 new project accounts have been identified and are included in the updated review |
| 21 October 2011 | New citation required but conclusions have not changed | This update has not impacted the conclusions and recommendations of the original review. One change to note is that the physical health status outcome blood cholesterol level (mg/dL) is no longer statistically significant |
| 29 April 2010 | Amended | Change in scope: 3 new relevance criteria have been added and applied to all included studies: (1) randomised controlled trials; (2) interventions implemented a minimum of 12 weeks; and (3) interventions aimed at the general population. This has resulted in exclusion from the update of 12 studies from the original review: 9 because they were not RCTs (Alexandrov 1988; Berenson 1993; Graf 2005; Klepp 1994; Lionis 1991; Manios 1999; Marcus 1987; Plotnikoff 1999; Sallis 1997); 2 because the intervention was shorter than 12 weeks (Eliakim 1996; Fardy 1996); and 1 because the study sample included overweight or obese children only (Carrel 2005a) |
| 19 January 2010 | Amended | Review author ‐ RL LaRocca ‐ has been added |
| 21 May 2008 | Amended | Review has been converted to new review format |
Notes
Portions of the background and methods sections, the appendices, additional tables, and figures are based on a standard template established by the Cochrane Metabolic and Endocrine Disorders Group.
Acknowledgements
We gratefully acknowledge the support and contribution of the Effective Public Health Practice Project in the initial systematic review of this literature in 1999, from which this updated systematic review stems, as well as the contributions of Elena Goldblatt, City of Hamilton Public Health Librarian, who developed the original search strategies. We also gratefully acknowledge Paula Robeson, Daiva Tirilis, Heather Husson, Kara DeCorby, and Rebecca Larocca, who contributed as authors to previous versions of this review, which were published in the Cochrane Library.
We also thank members of the Cochrane Public Health editorial team, in particular, Miranda Cumpston, Alix Hall, and Irma Klerings, as well as external referees Nicole Nathan and Emily Darlington, for their comments on the updated review.
Appendices
Appendix 1. Search strategies
| Cochrane Central Register of Controlled Trials (the Cochrane Library) |
| Update search, via Cochrane Library: October 1 2011 to June 1, 2020 (search conducted 17 February 2021) Details from previous searches can be found in the last update Dobbins 2013. #1 Exercise OR physical education OR physical training OR physical activity OR physical inactivity OR physical fitness OR fitness OR sedentary OR lifestyle OR sport* OR walk* OR danc* #2 child* OR adolescen* #3 school* #4 #1 and #2 and #3 with Publication Year from 2011 to 2020, with Cochrane Library publication date Between Oct 2011 and Jun 2020, in Trials |
| MEDLINE |
| Update search, via Ovid: October Week 1 2011 to June Week 1 2020 (search conducted 17 February 2021) Details from previous searches can be found in the last update Dobbins 2013. 1. randomised controlled trial.pt. 2. controlled clinical trial.pt. 3. randomized.ab. 4. placebo.ab. 5. clinical trials as topic.sh. 6. randomly.ab. 7. trial.ti. 8. 1 or 2 or 3 or 4 or 5 or 6 or 7 9. exp animals/ not humans.sh. 10. 8 not 9 11. exercise/ or circuit‐based exercise/ or gymnastics/ or high‐intensity interval training/ or physical conditioning, human/ or plyometric exercise/ or resistance training/ or running/ or swimming/ or walking/ 12. physical inactivity.mp. 13. exp Motor Activity/ 14. exp "Physical Education and Training"/ 15. Phys* ed*.mp. 16. exp Physical Fitness/ 17. sedentary.ab. or sedentary.ti. 18. screen time.mp. 19. exp Sedentary Lifestyle/ 20. exp Life Style/ 21. (("lifestyle" or life‐style) adj5 activ$).tw. 22. (("lifestyle" or life‐style) adj5 physical$).tw. 23. leisure activities/ or recreation/ 24. exp Walking/ 25. exp Sports/ 26. exp Dancing/ 27. walk$.tw. 28. sport$.tw. 29. cycl$.tw. 30. dancing.mp. 31. exercise therapy/ or plyometric exercise/ or resistance training/ 32. (exercise$ adj aerobic$).tw. 33. (physical$ adj5 (fit$ or train$ or activ$ or endur$)).tw. 34. (exercis$ adj5 (train$ or physical$ or activ$)).tw. 35. exp Child/ 36. Child*.mp. 37. exp Adolescent/ 38. Youth.mp. 39. Adolescen*.mp. 40. Teen*.mp. 41. 35 or 36 or 37 or 38 or 39 or 40 42. Schools/ 43. School$.tw. 44. school‐based.mp. 45. elementary school.mp. 46. middle school.mp. 47. high‐school.mp. 48. grade school.mp. 49. 42 or 43 or 44 or 45 or 46 or 47 or 48 50. 11 or 12 or 13 or 14 or 15 or 16 or 17 or 18 or 19 or 20 or 21 or 22 or 23 or 24 or 25 or 26 or 27 or 28 or 29 or 30 or 31 or 32 or 33 or 34 51. 10 and 41 and 49 and 50 52. limit 51 to ed=20111001‐20200601 |
| Embase |
| Update search, via Ovid Week 41 2011 to Week 23 2020 (search conducted 17 February 2021) Details from previous searches can be found in the last update Dobbins 2013. 1. exercise/ or aerobic exercise/ or anaerobic exercise/ or aquatic exercise/ or circuit training/ or dynamic exercise/ or endurance training/ or exercise intensity/ or high intensity interval training/ or leg exercise/ or muscle exercise/ or pilates/ or plyometrics/ or resistance training/ 2. physical activity/ or cycling/ or jogging/ or jumping/ or lifting effort/ or running/ or swimming/ or walking/ or weight bearing/ or weight lifting/ 3. physical inactivity.mp. or physical inactivity/ 4. exp fitness/ 5. exp physical education/ 6. Phys* ed*.mp. 7. exp sport/ 8. Exertion.mp. 9. recreation/ or dancing/ or recreational game/ 10. exp lifestyle/ 11. exp dancing/ 12. walking/ 13. walking/ 14. sedentary lifestyle/ 15. sedentary behavio?r.af. 16. screen time.mp. 17. kinesiotherapy/ or dynamic exercise/ or leg exercise/ or movement therapy/ or muscle training/ or pilates/ or plyometrics/ 18. exp Exercise therapy/ 19. (physical$ adj5 activ$).tw. 20. (physical$ adj5 fit$).tw. 21. (physical$ adj5 lifestyle$).tw. 22. (physical$ adj5 train$).tw. 23. walk.tw. 24. (aerobics or physical activity or physical inactivity).af. 25. (fitness adj (class$ or regime$ or program$)).af. 26. (aerobics or physical training or physical education).af. 27. (fitness adj (class$ or regime$ or program$)).af. 28. (aerobics or physical training or physical education).af. 29. dance therapy.af. 30. or/1‐29 31. child/ 32. child*.mp. 33. adolescent/ 34. adolescen*.mp. 35. juvenile/ 36. teen*.mp. 37. exp middle school student/ or exp high school/ or exp high school student/ or exp primary school/ or exp school/ 38. high school/ or middle school/ or primary school/ 39. school health service/ or exp school health education/ 40. school*.tw. 41. 31 or 32 or 33 or 34 or 35 or 36 42. 37 or 38 or 39 or 40 43. randomised controlled trial/ 44. randomisation/ 45. random allocation.mp. 46. double blind procedure/ 47. single blind procedure/ 48. clinical trial/ 49. (clinic$ adj trial$1).tw. 50. ((singl$ or doubl$ or treb$ or tripl$) adj (blind$3 or mask$3)).tw. 51. placebo/ 52. Placebo$.tw. 53. Randomly allocated.tw. 54. (allocated adj2 random).tw. 55. 43 or 44 or 45 or 46 or 47 or 48 or 49 or 50 or 51 or 52 or 53 or 54 56. case report.tw. 57. letter.pt. 58. 56 or 57 59. 55 not 58 60. 30 and 41 and 42 and 59 61. limit 60 to em=201141‐202023 |
| BIOSIS |
| Update search, via Web of Science: October 2011 to June 2020 (search conducted 17 February, 2021) Details from previous searches can be found in the last update Dobbins 2013. 1. TS=("physical activity" OR exercise) 2. TS=("physical fitness" OR fitness) 3. TS=(sedentary or screen‐time) 4. TS=(school* OR "physical education" OR student*) 5. TS=(child* OR adolescent*) 6. #1 OR #2 OR #3 7. TS=(random* and trial) 8. TS=(control* and trial) 9. #7 OR #8 10. #4 and #5 AND #6 AND #9 |
| CINAHL |
| Update search, via EBSCO Host Research Databases: October 2011 to June 2020 (search conducted 17 February, 2021) Details from previous searches can be found in the last update Dobbins 2013. S1 (MH "Exercise+") or (MH "Aerobic Exercises+") S2 ""physical inactivity"" S3 (MH "Life Style, sedentary") S4 ("physical education") or (MH "Physical Education and Training") or ("phys* ed*) S5 ("physical activity" or (MH "Physical activity") S6 ("physical fitness") or (MH "Physical Fitness+") or ("fitness") S7 ("walk") or (MH "walking") or (MH "Sports") S8 ""sport*"" S9 S1 OR S2 OR S3 OR S4 OR S5 OR S6 OR S7 OR S8 S10 ((MH "Schools+") or (MH "Schools, Elementary") or (MH "Schools, Middle") or ("school*")) S11 (MH "Child") S12 "adolescen*" S13 "teen*" S14 "youth*" S15 "child*" S16 S10 OR S11 OR S12 OR S13 OR S14 OR S15 S17 MH randomised controlled trials S18 MH double‐blind studies S19 MH single‐blind studies S20 MH random assignment S21 MH pretest‐posttest design S22 MH cluster sample S23 TI (randomised OR randomised) S24 AB (random*) S25 TI (trial) S26 MH (sample size) AND AB (assigned OR allocated OR control) S27 MH (placebos) S28 PT (randomised controlled trial) S29 AB (control W5 group) S30 MH (crossover design) OR MH (comparative studies) S31 AB (cluster W3 RCT) S32 MH animals+ S33 MH (animal studies) S34 TI (animal model*) S35 S32 OR S33 OR S34 S36 MH (human) S37 S35 NOT S36 S38 S17 OR S18 OR S19 OR S20 OR S21 OR S22 OR S23 OR S24 OR S25 OR S26 OR S27 OR S28 OR S29 OR S30 OR S31 S39 S38 NOT S37 S40 S9 AND S16 AND S39 Limiters ‐ Publication from: 20111001 ‐ 20200631 |
| SPORTDiscus |
| Updated search, via EBSCO Host Research Databases: October 2011 to June 2020 (search conducted 17 February, 2021) Details from previous searches can be found in the last update Dobbins 2013. S1. control group OR randomi* control* trial OR effect* OR random sample* or control subject* S2. physical activity OR physical inactivity OR exercise OR fitness OR sport* or danc* OR walk* or physical education OR obesity OR body weight S3. child* OR adolescen* S4. School* S5. S1 AND S2 AND S3 AND S4 Limit 20111001 ‐ 20200601 |
| PsycINFO |
| Updated search, via Ovid: October Week 3 2011 to June Week 1 2020 (search conducted 17 February, 2021) Details from previous searches can be found in the last update Dobbins 2013. 1. Randomized controlled trial.mp. 2. random allocation.mp. 3. double blind method.mp. 4. single blind method.mp. 5. Clinical trial.mp. or exp Clinical Trials/ 6. (clinic$ adj trial$1).tw. 7. ((singl$ or doubl$ or treb$ or tripl$) adj (blind$3 or mask$3)).tw. 8. placebo/ 9. Placebo$.tw. 10. (allocated adj2 random).tw. 11. 1 or 2 or 3 or 4 or 5 or 6 or 7 or 8 or 9 or 10 12. case report.tw. 13. historical article.mp. 14. letter.mp. 15. 12 or 13 or 14 16. 11 not 15 17. exercise/ or aerobic exercise/ or weightlifting/ 18. physical activity/ or exercise/ 19. physical inactivity.mp. 20. exercise.mp. 21. physical activity.mp. 22. motor activity.mp. 23. exp Physical Education/ 24. phys* ed*.mp. 25. exp physical fitness/ 26. physical endurance/ 27. exp aerobic exercise/ 28. exp SEDENTARY BEHAVIOR/ 29. screen time/ 30. sedentary.ab. or sedentary.ti. 31. screen time.mp. 32. exp lifestyle/ 33. lifestyle changes/ 34. (("lifestyle" or life‐style) adj5 activ$).tw. 35. (("lifestyle" or life‐style) adj5 physical$).tw. 36. leisure time/ or recreation/ 37. walking.mp. or exp WALKING/ 38. sports/ or baseball/ or basketball/ or football/ or judo/ or martial arts/ or soccer/ or swimming/ or tennis/ or weightlifting/ 39. exp Dance Therapy/ or exp Dance/ or dancing.mp. 40. walk$.tw. 41. sport$.tw. 42. cycl$.tw. 43. exercise therapy.mp. 44. (exercise$ adj aerobic$).tw. 45. (physical$ adj5 (fit$ or train$ or activ$ or endur$)).tw. 46. (exercis$ adj5 (train$ or physical$ or activ$)).tw. 47. 17 or 18 or 19 or 20 or 21 or 22 or 23 or 24 or 25 or 26 or 27 or 28 or 29 or 30 or 31 or 32 or 33 or 34 or 35 or 36 or 37 or 38 or 39 or 40 or 41 or 42 or 43 or 44 or 45 or 46 48. child*.mp. 49. Adolescen*.mp. 50. Teen*.mp. 51. Youth.mp. 52. 48 or 49 or 50 or 51 53. school*.tw. 54. exp Elementary Schools/ 55. exp Middle Schools/ 56. exp High Schools/ 57. secondary school*.mp. 58. primary school*.mp. 59. grade school*.mp. 60. 53 or 54 or 55 or 56 or 57 or 58 or 59 61. 16 and 47 and 52 and 60 62. limit 61 to up=20111021‐20200601 |
| Sociological abstracts |
| Update search, via ProQuest: October 21 2011 to June 01 2020 (search conducted 17 February, 2020) Details from previous searches can be found in the last update Dobbins 2013. Control group OR randomi* control* trial OR effect* OR random sample* OR control subject* AND Physical activity OR physical inactivity OR exercise OR physical fitness OR fitness OR sport* OR danc* OR walk* OR physical education OR obesity OR body weight AND Child* OR Adolescen* AND School* pd(20110101‐20200601) |
Appendix 2. Baseline characteristics
| Trial ID | Interventions and comparators | Trial period | Ethnic groups (%) | Sex (% female) | Age, years (mean (SD)/range) | BMI, kg/m² (mean (SD)) |
| Breheny 2020 | I: Daily Mile | 2016 to 2018 | 52 White British 16 South Asian 8 Black African Caribbean 24 Other/unknown |
48 | 8.9 (1.0) | — |
| C: usual school routine | ||||||
| Ketelhut 2020 | I: high‐intensity interval training during PE | — | — | 50 | 10.8 (0.6) | 19.6 (4.6) |
| C: usual PE | 41.7 | 10.7 (0.7) | 19.7 (4.0) | |||
| Belton 2019 | I: multi‐component PE, whole‐school and parent‐targeted intervention | 2013 to 2015 | — | 51 | 12.8 (0.4) | Male: 20.0 (3.1) Female: 20.8 (3.5) |
| C: usual care | 50 | 12.8 (0.4) | Male: 19.3 (3.2) Female: 20.3 (2.8) |
|||
| Corepal 2019 | I: pedometer challenge | 2015 to 2016 | — | 53 | — | — |
| C: usual school | ||||||
| Ickovics 2019 | I1: PA school wellness policy | 2011 to 2015 | 47 Hispanic 35 Non‐Hispanic black 18 Non‐Hispanic white | 62 | 10.9 (0.6) | — |
| I2: PA + nutrition school wellness policy | 50 | |||||
| C1: nutrition school wellness policy | 50 | |||||
| C2: delayed control | 50 | |||||
| Jago 2019 | I: Action 3:30R after school PA club | 2017 to 2018 | — | 49 | 8.4/8‐10 | 16.9 (2.5) |
| C: — | 17.2 (2.4) | |||||
| Leahy 2019 | I: Burn2Learn, multi‐component high‐intensity interval training | 2017 | 71 Australian 19 European 6 Asian 4 other | 46 | 16.2 (0.4) | 22.2 (3.0) |
| C: usual school activities | ||||||
| Lonsdale 2019a | I: teacher PE training | 2015 to 2016 | 58 English and European 9 Aboriginal or Torres Strait Islander 33 Other |
48 | 13.0 (0.6) | — |
| C: standard teaching | 57 English and European 10 Aboriginal or Torres Strait Islander 32 Other |
41 | 12.9 (0.5) | — | ||
| Müller 2019 | I1: PA only | 2015 to 2016 | "Colored children (mixed race ancestry), usually Afrikaans speaking, and black African children, mainly Xhosa speaking" | 50 | 9.2 (0.9) | 17.1 |
| I2: PA + health education | ||||||
| I3: PA + health education + nutrition | ||||||
| C1: health education + nutrition | 50 | |||||
| C2: no PA | ||||||
| Ordóñez Dios 2019 | I: 2 x 45‐minute PE sessions per week and daily run | — | — | — | — | 19.1 (3.1) |
| C: 2 x 45‐minute PE sessions per week | — | — | 20.1 (3.8) | |||
| Seibert 2019 | I: 4 core strategies to increase PA | — | — | 49 | 11.1 (—) | 22.0 (—) |
| C: usual PE | 46 | 11.2 (—) | 21.7 (—) | |||
|
Seljebotn 2019 |
I: physically active lessons, active homework, physically active recess | 2014 to 2015 | — | 48 | 9‐10 | 17.6 (3.0) |
| C: continued normal routine, approximately 135 minutes/week of PA | 51 | 17.3 (2.9) | ||||
| Zhou 2019 | I1: enhanced PE | 2015 to 2016 | — | 47 | 12.7 (0.6) | — |
| I2: after school programme | ||||||
| I3: enhanced PE and after school programme | ||||||
| C: regular PE | ||||||
| Adab 2018 | I: 30 minutes of additional MVPA on each school day, cooking workshops, a 6‐week healthy eating programme, information sheets for families | 2011 to 2015 | 45 White British 31 South Asian 8 Black African Caribbean 16 other | 51 | 6.3 (0.3) | — |
| C: ongoing Year 2 health‐related activities and education resources, excluding topics related to healthy eating and PA | 47 | |||||
| Carlin 2018 | I: brisk walking intervention | 2014 | — | 100 | 12.4 (0.6) | 20.3 (3.9) |
| C: continued with normal PA habits | 100 | 19.3 (4.3) | ||||
| Harrington 2018 | I: support for PA, PE, and school sport culture and practices with support of the Youth Sport Trust and a hub school | 2015 to 2016 | 77 White European 12 South Asian 11 other | 100 | 12.8 (0.8) | — |
| C: usual practice of PE and sport | 100 | |||||
| Have 2018 | I: active math lessons | 2012 to 2013 | — | 52 | 7.2 (0.3) | 16.1 (1.7) |
| C: regular classroom instruction | 48 | 15.7 (2.2) | ||||
| Pablos 2018 | I: lunchtime extracurricular PA | — | — | 50 | 10.7 (0.7) | — |
| C: continued with daily activities | 54 | |||||
| Robbins 2018 | I: an after school PA club, counselling, interactive Internet‐based sessions | 2011 to 2016 | 56 Black
44 Non‐Black 16 Hispanic or Latino 84 not Hispanic or Latino |
100 | 12.1 (0.8) | 22.9 (6.0) |
| C: no additional after school programming | 64 Black
36 Non‐Black 13 Hispanic or Latino 87 not Hispanic or Latino |
100 | 23.6 (6.1) | |||
| Siegrist 2013 | I: weekly lifestyle lessons | — | "Mainly Caucasian" | 40 | 11.1 (0.6) | 19.1 (3.5) |
| C: usual activities | 47 | |||||
| Ten Hoor 2018 | I: strength training and motivational interviewing | 2015 to 2016 | — | 52 | 13.0 (0.5) | 19.7 (3.5) |
| C: usual curriculum | 47 | |||||
| Donnelly 2017 | I: Academic Achievement and Physical Activity Across the Curriculum lessons, 160 minutes/week of MVPA | — | 85 not Hispanic or Latino 11 Hispanic or Latino 2 unknown 2 refused or missing | 49 | 8.1 (0.6) | 17.4 (3.1) |
| C: traditional classroom instruction and typical PE schedule | 54 | 8.1 (0.6) | ||||
| Farmer 2017 | I: school‐specific playground action plan | 2011 to 2013 | 19 Māori 12 Pacific 7 Asian 46 New Zealand 16 unknown | 47 | 8.0 (1.2) | 17.4 (2.8) |
| C: no change to school play spaces | 14 Māori 11 Pacific 9 Asian 52 New Zealand 13 unknown | 53 | 7.9 (1.1) | 17.4 (2.7) | ||
| Sutherland 2017 | I: modified Supporting Children's Outcomes using Rewards, Exercise, and Skills programme | 2014 to 2015 | — | 51 | 10.2 | — |
| C: delivered school PA practices according to the curriculum | 10.1 | |||||
| Torbeyns 2017 | I: cycling desks | 2014 to 2015 | — | 50 | 14.3 (0.6) | 19.7 (3.5) |
| C: no lifestyle change | 46 | 20.1 (3.7) | ||||
| Daly 2016 | I: specialist‐taught PE intervention | 2005 to 2009 | 92 Caucasian 6 Asian 1 Indigenous Australian or Polynesian descent 1 unknown | 48 | 8.1 (0.4) | Girls: 17.2 (0.2) Boys: 16.9 (0.2) |
| 49 | Girls: 17.2 (0.2) Boys: 17.0 (0.2) | |||||
| C: usual PE programme | ||||||
| de Greeff 2016 | I: physically active mathematics and language lessons | — | — | 55 | 8.1 (0.7) | 17.0 (2.8) |
| C: usual curriculum | 59 | 16.9 (2.6) | ||||
| Drummy 2016 | I: teacher‐led activity break | — | — | — | 9.5/9‐10 | 19.4 (3.5) |
| C: normal daily routine | 18.3 (2.4) | |||||
| Jarani 2016 | I1: group circuit training‐based PE | — | — | 50 | 8.4 (1.6) | 17.4 (3.2) |
| I2: games‐based PE | 49 | 8.3 (1.6) | 17.9 (3.3) | |||
| C: traditional PE school | 44 | 8.3 (1.6) | 17.8 (3.4) | |||
| Kocken 2016 | I: theory and practical lessons on nutrition and PA | 2009 to 2011 | 87 Western 13 non‐Western | 52 | 9.2 (0.6) | — |
| C: regular school programme or curriculum on nutrition and PA | 85 Western 15 non‐Western | 51 | 9.1 (0.6) | — | ||
| Lau 2016 | I: Xbox 260 Kinect gaming sessions after school | — | Asian | 28 | 9.2 (0.5) | 19.4 (3.6) |
| C: regular PA and PE class | 35 | 19.8 (3.6) | ||||
| Resaland 2016 | I: physically active Norwegian, mathematics, and English lessons on the playground; PA breaks and PA homework | 2014 to 2015 | — | 47 | 10.2 (0.3) | 18.0 (3.0) |
| C: curriculum‐prescribed PE and PA | 49 | 18.1 (3.0) | ||||
| Sutherland 2016 | I: 7 PA intervention strategies and 6 implementation strategies | 2012 to 2014 | 5 Aboriginal and/or Torres Strait Islander | 52 | 12 | 19.9 (3.6) |
| C: only measurement components of the trial, regular PA and PE | 8 Aboriginal and/or Torres Strait Islander | 51 | 20.2 (3.8) | |||
| Tarp 2016 | I: 60 minutes of PA during school time, PA homework | 2013 to 2014 | Boys:
98 Danish
2 European Girls: 96 Danish 2 European 1 other |
49 | 12.9 (0.6) | 19.8 (2.9) |
| C: normal practice | Boys:
94 Danish
2 European
4 other Girls: 91 Danish 2 European 7 other |
52 | 19.3 (3.0) | |||
| Cohen 2015 | I: teacher learning, PA policies, school‐community linkages | 2012 to 2013 | 14 Aboriginal or Torres Strait Islander 86 Australian 1 Asian 5 European 7 other | 54 | 8.5 (0.6) | — |
| C: usual PE and school sport programmes | 54 | |||||
| Jago 2015 | I: after school dance classes | 2013 to 2014 | — | 100 | 11‐12 | 19.5 (3.4) |
| C: provided data only | 100 | 19.5 (3.7) | ||||
| Madsen 2015 | I: nutrition education curriculum, Playworks structured recess before or after school activities, PA and games implemented by teachers | 2011 to 2013 | 6 White 9 Black 55 Latino 15 mixed 16 other | 49 | — | — |
| C: — | 6 White 13 Black 45 Latino 14 mixed 22 other | 56 | ||||
| Muros 2015 | I1: extracurricular PA sessions | 2012 | — | 54 | 10.7 (0.5) | 19.7 (3.7) |
| I2: PA and nutrition | 44 | |||||
| I3: PA and nutrition and extra virgin olive oil during the final month | 42 | |||||
| C1: nutrition and lifestyle education sessions | 54 | |||||
| C2: usual activities | 51 | |||||
| Suchert 2015 | I: multi‐level intervention targeting students, classrooms, schools, and parents | 2014 to 2015 | — | 47 | 13.7 (0.7) | — |
| C: no intervention | 49 | |||||
| Andrade 2014 | I: ACTIVITAL individual‐ and environment‐based intervention | 2009 to 2012 | — | 66 | 12.9 (0.8) | 19.8 (3.4) |
| C: standard curriculum | 59 | 19.7 (2.9) | ||||
| Jago 2014 | I: Action 3:30 activity club | 2012 to 2013 | — | 59 | 10 (0.6) | 18.8 (3.4) |
| C: schools provided data only | 18.4 (3.3) | |||||
| Kipping 2014 | I: PA education intervention | — | — | 49 | 9.5 (0.3) | — |
| C: continued standard education provision | 52 | — | ||||
| Kobel 2014 | I: teacher training, PA education, active breaks | 2010 to 2014 | 31 migration background | 53 | 7.1 (0.6) | 15.98 (2.14) |
| C: no intervention | 49 | |||||
| Martinez‐Vizcaino 2014 | I: MOVI‐2 extracurricular PA programme | 2010 to 2011 | — | 55 | 9.5 (0.7) | 19.0 (3.68) |
| C: standard PE curriculum | 49 | |||||
| Nogueira 2014 | I: high‐intensity capoeira sessions | — | Female:
97 Caucasian
3 Asian or Black Male: 96 Caucasian 4 Asian |
41 | 10.6 (0.6) | 18.5 (3.1) |
| C: usual school activities | 50 | |||||
| Santos 2014 | I: healthy buddies, healthy living lessons, structured aerobic exercise | 2009 to 2010 | 25 First‐Nations 75 non‐First‐Nations | 48 | 9.3 | — |
| C: standard curriculum | 31 First‐Nations 69 non‐First‐Nations | 8.8 | — | |||
| Toftager 2014 | I: physical and organisational environmental changes | 2010 to 2012 | 91 Native Danish parents | 51 | 12.5 (0.6) | 18.9 (3.0) |
| C: — | 92 Native Danish parents | 48 | 12.5 (0.6) | 18.8 (3.0) | ||
| Fairclough 2013 | I: weekly lesson plans, worksheets, homework tasks, lesson resources | 2010 to 2011 | 95 White British | — | 10.6 (0.3) | 17.9 (3.0) |
| C: normal instruction | 10.7 (0.3) | 18.1 (3.7) | ||||
| Ford 2013 | I: accumulated brisk walking programme | — | — | 48 | 5‐11 | 17.1 (3.3) |
| C: normal school lessons | — | 16.4 (2.9) | ||||
| Grydeland 2013 | I: structured lessons, PA breaks, PA promotion | 2007 to 2009 | — | 54 | 11.2 (0.3) | 17.8 (2.5) |
| C: — | 60 | 17.9 (2.6) | ||||
| Melnyk 2013 | I: goal‐setting, education, PA homework | 2010 to 2012 | 65 Hispanic or Latino | 55 | 14.7 (0.7) | 29.7 (7.1) |
| C: Healthy Teens attention control curriculum was intended to promote knowledge of common adolescent health topics and health literacy | 49 | |||||
| Sacchetti 2013 | I: daily PA in schoolyard and classroom | 2006 to 2009 | — | 48 | 9‐11 | 18.0 (2.9) |
| C: standard programme of PE | 48 | 17.8 (2.9) | ||||
| Siegrist 2013 | I: JuvenTUM educational and environmental intervention | 2006 to 2007 | — | 48 | 8.4 (0.7) | 17.4 (2.9) |
| C: continued with usual school activities | 17.3 (3.0) | |||||
| Aburto 2011 | I1: basic intervention of environmental and policy‐level change | 2006 to 2007 | Hispanic | 50 | 10.2 (0.7) | 19.8 (3.8) |
| I2: plus intervention adding additional resources and daily morning exercise | 55 | |||||
| C: no change to standard practices | 50 | |||||
| Ardoy 2011 | I1: 4 sessions/week of PE | 2007 | — | 35 | 13 (0.7) | 22.3 (5.1) |
| I2: 4 sessions/week of PE with emphasis on increasing intensity | 30 | |||||
| C: 2 sessions/week of PE | 44 | |||||
| de Heer 2011 | I: Bienstar intervention of health education and 45 to 60 minutes of after school PA | 2008 | Predominantly Hispanic | 46 | 9.2 (1.0) | 20.3 (4.4) |
| C1: Grade 4 health workbooks and incentives | 45 | 20.0 (4.4) | ||||
| C2: spillover control group | 51 | 19.5 (4.2) | ||||
| Jago 2011 | I: education, social marketing, food environment, PE curriculum, equipment provision | 2006 to 2009 | 59 Hispanic 20 Black 21 White | 53 | 11.3 (0.6) | — |
| C: recruitment and data collection only | 52 | |||||
| Jansen 2011 | I: 3 PE sessions/week, additional after school sport and play, classroom education, parent health promotion | 2006 to 2007 | Grades 3 to 5:
14 Dutch
9 Surinam
6 Antillean
27 Moroccan
22 Turkish
4 Capeverdean
18 other or missing Grades 6 to 8: 14 Dutch 11 Surinam 5 Antillean 22 Moroccan 24 Turkish 5 Capeverdea 19 other or missing |
Grades 3‐5: 51 Grades 6‐8: 53 |
9.2 (1.0) | Grades 3‐5: 17.1 (2.8) Grades 6‐8: 19.1 (3.8) |
| C: continued with the usual curriculum | Grades 3 to 5:
7 Dutch
11 Surinam
4 Antillean
36 Moroccan
20 Turkish
4 Capeverdean
17 other or missing Grades 6 to 8: 8 Dutch 13 Surinam 3 Antillean 35 Moroccan 24 Turkish 5 Capeverdean 15 other or missing |
Grades 3‐5: 51 Grades 6‐8: 49 |
Grades 3‐5: 17.1 (2.8) Grades 6‐8: 19.8 (4.1) |
|||
| Magnusson 2011 | I: students engaged in PA during PE lessons, during recess, and during classes; schools had access to PA equipment to use in school lessons; teaching materials promoting PA were provided | 2006 to 2008 | — | 52 | 7.4 (0.2) | 15.8 (1.1) |
| C: followed the general PA curriculum | 59 | 16.3 (1.0) | ||||
| Okely 2011 | I: PA action plan | 2009 to 2010 | — | 100 | 13.6 | — |
| C: continuation of usual programmes | 100 | |||||
| Thivel 2011 | I: 120 minutes of additional supervised PE | 2003 | — | 51 | 6‐10 | Normal weight: 15.6 (1.1) |
| C: habitual 2 hours of PE/week | Obese: 20.6 (2.6) | |||||
| 49 | Normal weight: 15.5 (1.1) | |||||
| Obese: 20.2 (1.8) | ||||||
| Wilson 2011 | I: Active by Choice Today programme: PA homework, in‐school PA, motivational skills training | — | 76 African American | 56 | 11.3 (0.6) | 22.8 (6.2) |
| C: General Health Education Programme | 69 African American | 52 | 11.4 (0.6) | 22.9 (5.9) | ||
| Kriemler 2010 | I: 2 additional 45‐minute PE lessons/week, activity breaks, PA homework | 2005 to 2006 | Migrant families Grade 1: 34 Grade 5: 25 | Grade 1: 49 Grade 5: 55 | Grade 1: 6.9 (0.3) Grade 5: 11 (0.5) | 17.1 (2.5) |
| C: usual, mandatory PE lessons | Migrant families Grade 1: 26 Grade 5: 24 | Grade 1: 55 Grade 5: 46 | Grade 1: 6.9 (0.3) Grade 5: 11.3 (0.6) | 17.0 (2.6) | ||
| Neumark‐Sztainer 2010 | I: New Moves curriculum (nutrition and self‐empowerment, motivational interviewing, lunch meetings, parent outreach) | 2007 to 2009 | 32 African American 27 White 17 Asian 13 Hispanic 8 mixed/other 3 American Indian | 100 | 15.7 | 25.9 (7.1) |
| C: participation in all‐girls PE class | 24 African American 22 White 30 Asian 16 Hispanic 7 mixed/other 2 American Indian | 100 | 15.8 | 25.5 (6.5) | ||
| Angelopoulos 2009 | I: educational intervention covering self‐esteem, body image, nutrition, PA, fitness, and environmental issues with motivational methods to increase knowledge, skills, self‐efficacy, self‐monitoring, and social influence | 2005 to 2006 | 90 Greek 10 Immigrant | 57 | 10.3 (0.4) | 20.3 (3.6) |
| C: — | 88 Greek 12 Immigrants | 54 | 10.3 (0.4) | 20.1 (3.4) | ||
| Donnelly 2009 | I: 90 minutes/week of moderate to vigorous physically active academic lessons | — | 77 Caucasian 6 African American 10 Hispanic 2 Native American 1 Asian 4 multi‐ethnic | 52 | Grade 2: 7.7 (0.3) Grade 3: 8.7 (0.4) | 17.9 (3.1) |
| C: regular classroom instruction | Grade 2: 7.8 (0.4) Grade 3: 8.7 (0.4) | 18.0 (3.7) | ||||
| Dorgo 2009 | I1: PE manual resistance training programme | — | — | 45 | 15.9 (1.2) | 24.4 (6.1) |
| I2: PE manual resistance training plus cardiovascular endurance training | 15.2 (1.2) | 24.8 (5.9) | ||||
| C: regular PE programme that followed the usual school curriculum | 15.8 (1.1) | 24.9 (5.4) | ||||
| Gentile 2009 | I: 'Switch' programme: promoted healthy lifestyles targeting family, school, and community | 2005 to 2006 | 90 White | 53 | 9.6 | 18.4 (3.3) |
| C: no intentional exposure to the 'Switch' programme | 50 | 9.6 | 18.5 (3.5) | |||
| Neumark‐Sztainer 2009 | I: after school theatre sessions, booster sessions, family outreach | 2006 to 2007 | 54 African American 13 Asian 7 White 3 Hispanic 23 other or mixed | — | 10.3 (1.1) | 20.9(5.1) |
| C: theatre‐based control condition (i.e. children participated in a play focused on environmental health issues using a prepared script) | ||||||
| Peralta 2009 | I: curriculum and peer‐facilitated lunchtime PA session, parent newsletters | 2007 | — | 0 | 12.5 (0.4) | 22.8 (4.1) |
| C: PA curriculum | 0 | 20.4 (4.1) | ||||
| Walther 2009 | I: 1 unit of physical exercise (45 minutes) with at least 15 minutes of endurance training/school day, plus lessons on healthy lifestyle once/month | — | — | 47 | 11.1 | 18.0 (2.6) |
| C: German standards, 2 units (each 45 minutes) of PE/week, 12 units (45 minutes/unit) of high‐level endurance exercise training/week plus participation in competitive sporting events | 42 | 11.1 | 18.2 (2.8) | |||
| Reed 2008 | I: Action Schools!BC whole‐school PA approach | 2003 to 2004 | — | 49 | 10.2 (0.6) | 18.8 (3.5) |
| C: regular programme of PE and school‐based PA | 50 | 10.2 (0.6) | 19.1 (3.7) | |||
| Salmon 2008 | I1: behavioural modification group | 2002 to 2003 | — | 51 | 10 (0.4) | — |
| I2: fundamental motor skills group | 53 | |||||
| I3: combined behavioural modification and fundamental motor skills group | 51 | |||||
| C: usual classroom lessons | 51 | |||||
| Wang 2008 | I: 'FitKid' after school intervention sessions | 2002 to 2006 | 61 Black 31 White 2 Asian 2 Hispanic 5 other | 52 | 8.5 (0.6) | 19.4 (4.7) |
| C: — | 19.3 (4.4) | |||||
| Webber 2008 | I: health education lessons to enhance behavioural skills known to influence PA participation (self‐monitoring, setting goals for behaviour change) | 2003 to 2006 | 46 White 24 African American 12 Hispanic 18 other | 100 | 12 | 20.7 |
| C: — | 100 | 20.9 | ||||
| Weeks 2008 | I: directed jumping activity at the beginning of every PE class | — | — | 58 | Girls: 13.7 (0.4) Boys: 13.8 (0.4) | Girls: 19.5 (3.5) Boys: 20.3 (3.6) |
| C: regular PE warm‐ups and stretching at the beginning of every PE class | ||||||
| 49 | Girls: 13.7 (0.5) Boys: 13.8 (0.4) | Girls: 19.5 (2.1) | ||||
| Boys: 21.5 (5.1) | ||||||
| Barbeau 2007 | I: after school PA programme | — | 100 Black | 100 | 9.5/8‐12 | 20.9 (5.0) |
| C: — | 100 Black | 100 | 9.5/8‐12 | 20.9 (5.6) | ||
| Williamson 2007 | I: Healthy Eating and Exercise programme to increase PA during the school day and at home | — | 95 White 2 Black 3 other | 50 | 9.2 (4.1) | — |
| C: Alcohol/Drug/Tobacco abuse prevention programme | ||||||
| Haerens 2006 | I1: a computer‐tailored intervention to increase MVPA to 60 minutes/d, increase fruit consumption, increase water consumption, and reduce fat | 2003 to 2005 | — | 37 | 13.1 (0.8) | Girls: 20.2 Boys: 19.2 |
| I2: group 1 plus parental involvement | Girls: 20.2 Boys: 19.3 | |||||
| C: no PA and nutrition intervention | Girls: 19.1 Boys: 18.5 | |||||
| Young 2006 | I: PE curriculum taught 5 days/week and family | — | 83 African American | 100 | 13.8 (0.5) | 25.0 (6.9) |
| C: standard PE class | 100 | 25.2 (6.7) | ||||
| Bayne‐Smith 2004 | I: Physical Activity and Teenage Health programme, education sessions plus 20 to 25 minutes of PA | 1994 to 1996 | 13 White 46 African American 29 Hispanic 12 Asian American | 100 | 16.2 (1.3) | 22.8 (4.1) |
| C: same frequency or duration of PE classes, but without lecture or discussion | 5 White 45 African American 28 Hispanic 12 Asian American | 100 | 15.9 (1.2) | 23.6 (5.0) | ||
| Simon 2004 | I: an educational component focusing on PA and sedentary behaviours and new opportunities for PA during and after school hours | 2002 to 2006 | 23 recomposed family | 54 | 11.6 (0.6) | 18.7 (3.7) |
| C: — | 26 recomposed family | 48 | 11.7 (0.7) | 18.9 (3.9) | ||
| Trevino 2004 | I: health programming regarding 3 health behaviour messages associated with diabetes mellitus control and goal‐setting | 2001 to 2002 | 6 Asian 7 African American 83 Mexican American 5 other | 50 | 9.8 (0.5) | 20.6 (5.1) |
| C: — | 6 Asian 13 African American 77 Mexican American 4 other | 49 | 9.8 (0.5) | 20.3 (4.8) | ||
| Stone 2003 | I: food service, skills‐based classroom curricula, family, and PE | 1993 to 2000 | "American Indian" | 48 | 7.6 (0.6) | — |
| C: — | ||||||
| Burke 1998 | I1: standard PA and nutrition programme including classroom lessons, fitness sessions daily, and nutrition programme | 1993 to 1994 | — | 49 | 11 | Low‐risk girls: 17.5 High‐risk girls: 19.2 |
| I2: I1 plus a PA enrichment programme for higher‐risk children | ||||||
| C: no programme | Low‐risk boys: 16.8 High‐risk boys: 21.1 | |||||
| Ewart 1998 | I: 50‐minute 'Project Heart' aerobic exercise classes | 1991 to 1994 | 30 White 70 African American | 100 | — | 24.8 (5.8) |
| C: 50‐minute standard PE classes | 100 | 24.1 (5.0) | ||||
| Luepker 1996 | I1: school food service modifications, PE interventions, and Child and Adolescent Trial for Cardiovascular Health curricula | 1991 to 1994 | 69 White 13 African American 14 Hispanic 4 other | 48 | 8.8 | 17.6 (0.1) |
| I2: I1 plus a family‐based programme | ||||||
| C: usual health curricula, PE, and food service programmes | — | 17.6 (0.1) | ||||
| Bush 1989 | I1: 'Know Your Body' curriculum focusing on nutrition, fitness, prevention of smoking, a personalised health screening, and results on a 'health passport' for parents | 1983 to 1988 | "Predominantly black" | 54 | 10.5 | 14.3 |
| I2: 'Know Your Body' curriculum and health screening, but students do not receive the results of their screening; only parents receive the results | ||||||
| C: health screening only | 14 | |||||
| Walter 1988 | I: special curriculum targeting voluntary changes in risk behaviour in the areas of diet, PA, and smoking | 1980 to 1985 | Bronx:
32 White
43 Black
25 other Westchester: 90 White 3 Black 7 other |
Bronx: 49 Westchester: 46 | Bronx: 9.0 Westchester: 8.9 | Bronx: 11.8 (0.3) Westchester: 11.3 (0.3) |
| C: — | Bronx:
29 White
49 Black
22 other Westchester: 79 White 15 Black 6 other |
Bronx: 46 Westchester: 53 | Bronx: 9 Westchester: 8.9 | Bronx: 11.8 (0.3) Westchester: 11.9 (0.3) |
Appendix 3. Definition of endpoint measurement
| Trial ID | Physical Activity |
| Belton 2019 | Actigraph accelerometer worn on the hip during all waking hours for 9 days; analysed using Evenson cut points for MVPA; reported in minutes/d |
| Corepal 2019 | ActiGraph GT3X/+ accelerometers were worn for a minimum of 8 hours/d for at least 3 days. Activity counts were recorded using 1 second epochs, and were reintegrated in 60 second epochs before Evenson cut points were applied |
| Jago 2019 | ActiGraph wGT3X‐BT accelerometers worn for 7 consecutive days. Students who provided ≥ 3 valid days (500 minutes) of data were included in the analysis. MVPA was estimated using Evenson cut points. Total physical activity was derived from counts per minute |
| Lonsdale 2019a | ActiGraph accelerometers attached at the right hip worn for 5 weekdays and 2 weekend days. Accelerometers assessed students’ moderate (38.26‐66.85 counts) and vigorous (> 66.86 counts) intensity during leisure time |
| Seljebotn 2019 | Actigraph accelerometers were worn on the right hip for 7 days during all waking time. Data were collected in 10 second epochs, and MVPA was calculated using Evenson cut points |
| Zhou 2019 | Actigraph GT3X+ on the right hip during waking hours for 7 consecutive days. Accelerometry data reduction followed procedures developed for Chinese children |
| Adab 2018 | Actiheart accelerometer worn consecutively for 5 days, including a weekend. MVPA recorded as minutes/24 h of at least moderate intensity |
| Harrington 2018 | A GENEActiv accelerometer was worn 24 hours/d for 7 days on their non‐dominant wrist at all time points. Devices were initialised with a sampling frequency of 100 Hz and were set to start recording at midnight on the first day of data collection and to stop recording at midnight 7 days later. Hildebrand cut points were used to estimate MVPA |
| Have 2018 | Total daily PA were assessed using accelerometer (ActiGraph, GT3X and GT3X+, ActiGraph LLC, Pensacola, FL, USA). PA data were collected for 8 days, with a valid measurement of total PA defined as a minimum of 4 days with at least 10 hours of recorded activity each day. Total PA was expressed as mean counts per minute and as mean daily minutes in moderate to vigorous physical activity defined using Evenson cut points |
| Robbins 2018 | ActiGraph GT3X+ accelerometers worn on an elastic belt at the right hip for 7 consecutive days, including 5 weekdays and 2 weekend days. An imputation approach based on all available data in hour blocks on all 7 days was implemented and wear time was standardised to 14 hours per day |
| Ten Hoor 2018 | Measured using accelerometer (Actigraph GT3x, Actigraph, Pensacola, FL, USA) worn on the lower back for 5 consecutive days during all waking hours. Actilife software (v6.13.3) was used to generate activity counts per minute. Only students who had worn the accelerometer at least 8 hours per day during waking hours (i.e. time awake and time to bed) for a minimum of 3 days were included in the analyses. MVPA cut points were determined as proposed by Mattocks and colleagues |
| Farmer 2017 | All children wore an accelerometer (ActiGraph GT3X, Actigraph Corp, Pensacola, FL, USA) 24 hours a day for 7 days, positioned over the right hip. Accelerometers were initialised using ActiLife in uniaxial mode using 15 second epochs. Data were cleaned and scored using an automated script developed in MATLAB (MathWorks, Natick, MA, USA) that removes the appropriate sleep period for each day for each child individually, to avoid sleep being misclassified as sedentary time. A day was considered valid if there were at least 8 valid awake hours. Non‐wear time (awake hours only) was defined as at least 20 minutes of consecutive zeros. Participants were excluded from analysis if less than 3 valid days of wear was obtained. Activity intensities were calculated using the Evenson cut points developed for children aged 5 to 8 years |
| Sutherland 2017 | Accelerometers were used with non‐wear time defined as 30 minutes of consecutive zeros. Counts were collected in 15‐second epochs. The Evenson cut points were used to categorise the intensity of PA (moderate or vigorous) |
| Daly 2016 | PA was measured by accelerometers (Actigraph GT1M, Pensacola, FL, USA) worn simultaneously, positioned on a belt around the waist. MVPA was defined as counts > 2296 per minute |
| Drummy 2016 | Physical activity was measured using an Actigraph accelerometer (GT1M, Actigraph LLC, Pensacole, FL, USA) set to 5 second epochs. Children were asked to wear accelerometers over a 7‐day period (5 weekdays and 2 weekend days), only to be removed when sleeping, bathing, swimming, and showering |
| Kocken 2016 | MVPA was measured using a 1‐dimensional accelerometer; the ActiGraph. Counts per minute were collected every 15 seconds. The Actigraph was worn on the child’s right hip during at least 3 days and was removed when water was involved and during sleeping time |
| Lau 2016 | MVPA was measured using the ActiGraph GT3X+ accelerometer for 7 continuous days. Non‐wear time was determined as zero accelerometer counts for any continuous period of 20 minutes. Wear‐time validation criterion was set at least 480 minutes/d for 4 days during the 7 assessment days. Cut points for MVPA (> 2296 counts per minute) developed by Evenson were applied to calculate MVPA time |
| Resaland 2016 | Physical activity was measured by ActiGraph accelerometers (ActiGraph GT3X+, LLC, Pensacola, Florida, USA). Children were instructed to wear the accelerometer on the right hip at all times over 7 consecutive days, except during water‐based activities or while sleeping. Wear time ≥ 480 minutes/day for ≥ 4 days was applied as a criterion for a valid measurement. Periods ≥ 20 minutes of zero counts were defined as non‐wear time. Evenson cut points for MVPA were used (2296 counts per minute) |
| Sutherland 2016 | Accelerometer non‐wear time was defined as 30 minutes of consecutive zeroes. Counts were collected in 15‐second epochs and counts per minute calculated by dividing total accelerometer counts by minutes of wear time. The Evenson cut points were used to categorise the intensity of physical activity (moderate or vigorous) |
| Tarp 2016 | Physical activity levels were assessed by accelerometer (GT3X and GT3X+ devices by ActiGraph LLC, Pensacola, FL, USA). Devices were worn on the right hip every day during a 7‐day period. The epoch was set to 2 seconds, but files were downloaded in 10 second epochs. A sequence of more than 30 minutes of consecutive zeroes was considered non‐wear time and was not included in analyses. To be included, students had to obtain a minimum of 4 days with at least 10 hours of valid registration at both time points. Evenson cut points were used to calculate time spent in MVPA |
| Cohen 2015 | ActiGraph GT3Xþ accelerometers (ActiGraph, LLC, Fort Walton Beach, FL) were used. Children were required to wear accelerometers during waking hours for 7 consecutive days, except while bathing and swimming. Data were collected and stored in 10 second epochs with a frequency of 30 Hz. Valid wear time for total physical activity was defined as a minimum of 3 weekdays and a weekend day with at least 8 hours (480 minutes/d) of total wear time recorded. Non‐wear time was defined as strings of consecutive zeroes equating to 20 minutes. Evenson cut points were used to calculate time spent in sedentary (< 25 counts), light (26 to 573 counts), moderate (574 to 1002 counts), and vigorous (> 1003 counts) activity |
| Jago 2015 | MVPA was assessed using an Actigraph GT3X+ accelerometer for 7 days. A valid day of accelerometer data was defined as a minimum of 500 minutes of data between 05:00 and 11.59 PM. Periods > 60 minutes in which zero values were recorded were interpreted as ‘non‐wear’ time. For valid days, mean minutes engaged in MVPA (≥ 2296 counts per minute) were derived |
| Andrade 2014 | Physical activity was assessed using accelerometers (type GT‐256 and GT1M Actigraph, Florida USA) in a sub‐sample of adolescents selected using a random number. A syntax in Stata was used for data reduction and to compute registered time, and time spent in moderate to vigorous physical activity (≥ 760 counts/min). Accelerometers were worn for 5 weekdays and measurements were excluded with less than 540 minutes of registered time per day. The proportion of adolescents who met the recommended 60 minutes of MVPA per day was calculated |
| Jago 2014 | Physical activity was assessed using an ActiGraph accelerometer (Model GT3X+; ActiGraph LLC, FL, USA) set to collect data at 30 Hz for a maximum of 5 days including a weekend day. Periods ≥ 60 minutes of zero values were defined as accelerometer “non‐wear”. Participants were included if they provided at least 2 weekdays of valid accelerometer data (at least 500 minutes of data between 6 am and 11 pm). Mean minutes of MVPA on a weekday was derived using a cut point ≥ 2296 counts per minute |
| Kipping 2014 | The ActiGraph GT3X+ accelerometers were used for 5 days of data collection (3 weekdays and 2 weekend days) during the day (except when bathing, swimming, or participating in contact sports such as karate). Time spent in MVPA was any time spent in activities that were at least 2296 counts per minute |
| Kobel 2014 | Objective measurements of physical activity were performed using the Actiheart® activity sensor continuously over a period of at least 4 to 6 successive days (2 weekend days and 2 to 4 weekdays) |
| Fairclough 2013 | Physical activity was objectively assessed for 7 consecutive days using ActiGraph GT1M accelerometers and 5 second epochs. Sustained 20 minute periods of zero counts were considered non‐wear time. Valid wear time was at least 540 minutes on weekdays and 480 minutes on weekend days for a minimum of 3 days. Cut points ≥ 2160 counts per minutes and ≥ 4806 counts per minute classified moderate and vigorous intensity physical activity |
| Ford 2013 | Physical activity levels were quantified using MTI accelerometers (Manufacturing Technologies Inc., Shalimar, FL) using a 1 minute epoch setting |
| Grydeland 2013 | Children wore accelerometers (GT1M/CSA model 7164; ActiGraph, Fort Walton Beach, FL, USA) for 5 consecutive days and were instructed to wear the monitor continuously all awake hours except when doing water activities. Output was sampled every 10 seconds for 2 weekdays and 2 weekend days with valid wear time set at a minimum of 3 days and at least for 8 hours each day |
| Magnusson 2011 | Accelerometers (Actigraph™ GT1M monitors) were worn during waking hours for 7 consecutive days ‐ 5 weekdays and 2 weekend days ‐ at a sampling epoch of 60 seconds. MVPA was defined as activity above 2000 CPM |
| Okely 2011 | Participants wore an Actigraph accelerometer (7164 and GT1M models; Fort Walton Beach, FL) for 7 consecutive days attached to an adjustable elastic belt over the right hip. Data were collected in 30 second epochs. Thirty‐second activity counts were uploaded to determine the amount of time spent in light (LPA; 1.5‐2.9 METs) moderate (MPA; 4‐6.9 METs), and vigorous (VPA; ≥ 7 METs) physical activity |
| Wilson 2011 | Assessments of MVPA were obtained with omni‐directional Actical accelerometers (Mini‐Mitter, Bend, OR) over 7 consecutive days. Data were recorded in 1 minute epochs and were converted into time spent MVPA (3 to 9 METS) based on Actical‐specific activity count thresholds where MVPA = 1500 to 6500 and VPA ≥ 6500 |
| Kriemler 2010 | PA was monitored with an accelerometer, which was worn continuously around the hip for 5 weekdays ‐ at baseline and at the end of the intervention |
| Donnelly 2009 | Accelerometers were worn over 4 consecutive days, which included 2 weekdays and 2 weekend days |
| Peralta 2009 | Weekday MVPA (minutes/d). PA was measured over 7 consecutive days using MTI 7164 Actigraph accelerometers worn on belts at the right hip. Average minutes of moderate (MPA), vigorous (VPA), and MVPA were calculated using a composite method |
| Salmon 2008 | PA was assessed using Manufacturing Technology Inc. AM7164‐2.2C accelerometers. Children wore the MTI on a belt positioned over the right hip during waking hours, except when bathing or swimming, for 8 days at each of the 4 measurement points |
| Webber 2008 | MET‐weighted minutes of MVPA using accelerometers worn for 7 consecutive days except while bathing, swimming, or sleeping |
| Haerens 2006 | Children wore the accelerometer for 6 days above the right hip bone, underneath the clothes. Accelerometers were set to measure activity counts in an epoch time of 1 minute. Cut points > 3200 moderate to vigorous minutes were used |
| Trial ID | Sedentary time |
| Corepal 2019 | ActiGraph GT3X/+ accelerometers were worn for a minimum of 8 hours/d for at least 3 days. Activity counts were recorded using 1 second epochs and reintegrated to 60 second epochs before Evenson cut points were applied |
| Jago 2019 | ActiGraph wGT3X‐BT accelerometers worn for 7 consecutive days. Students who provided ≥ 3 valid days (500 minutes) of data were included in the analysis. Sedentary time was derived based on a cut point < 100 CPM |
| Lonsdale 2019a | ActiGraph accelerometers attached at the right hip worn for 5 weekdays and 2 weekend days. Accelerometers assessed students’ sedentary behaviour (< 1.67 counts per 1 second) during leisure time |
| Seljebotn 2019 | Actigraph accelerometers were worn on the right hip for 7 days during all waking time. Data were collected in 10 second epochs, and sedentary time was calculated using Evenson cut points |
| Zhou 2019 | Actigraph GT3X+ accelerometer was worn on the right hip during waking hours for 7 consecutive days. Data reduction followed procedures developed for Chinese children |
| Adab 2018 | Actiheart accelerometer worn consecutively for 5 days, including a weekend. Sedentary time reported in hours/d |
| Harrington 2018 | A GENEActiv accelerometer was worn 24 hours/d for 7 days on the non‐dominant wrist at all time points. Devices were initialised with a sampling frequency of 100 Hz and were set to start recording at midnight on the first day of data collection and to stop recording at midnight 7 days later. Hildebrand cut points were used to estimate sedentary time |
| Ten Hoor 2018 | Measured using accelerometer (Actigraph GT3x, Actigraph, Pensacola, FL, USA) worn on the lower back for 5 consecutive days during all waking hours. Actilife software (v6.13.3) was used to generate activity counts per minute. Only students who had worn the accelerometer at least 8 hours per day during waking hours (i.e. time awake and time to bed) for a minimum of 3 days were included in the analyses. Sedentary time cut points were determined as proposed by Mattocks and colleagues, and were reported as % of time spent sedentary |
| Daly 2016 | PA was measured by accelerometers (Actigraph GT1M, Pensacola, FL, USA) worn simultaneously, positioned on a belt around the waist. Sedentary activity was defined as < 100 counts per minute |
| Kocken 2016 | Sedentary time was measured using a 1‐dimensional accelerometer; the ActiGraph. Counts per minute were collected every 15 seconds. The Actigraph was worn on the child’s right hip during at least 3 days and the ActiGraph was removed when water was involved and during sleeping time |
| Resaland 2016 | Sedentary time was measured by ActiGraph accelerometers (ActiGraph GT3X+, LLC, Pensacola, Florida, USA). Children were instructed to wear the accelerometer on the right hip at all times over 7 consecutive days, except during water‐based activities or while sleeping. Wear time ≥ 480 minutes/d for ≥ 4 days was applied as a criterion for a valid measurement. Periods ≥ 20 minutes of zero counts were defined as non‐wear time. Evenson cut points for sedentary time (0 to 100 counts per minute) were used |
| Jago 2015 | Sedentary time was assessed using an Actigraph GT3X+ accelerometer worn for 7 days. A valid day of accelerometer data was defined as a minimum of 500 minutes of data between 05:00 and 11.59 pm. Periods > 60 minutes in which zero values were recorded were interpreted as ‘non‐wear’ time. Sedentary cut points used were not reported |
| Andrade 2014 | Sedentary time was assessed using accelerometers (type GT‐256 and GT1M Actigraph, Florida USA) in a sub‐sample of adolescents selected using a random number. A syntax in Stata was used for data reduction and to compute registered time and time spent in sedentary activity (≤ 100 counts/min). Accelerometers were worn for 5 weekdays and measurements were excluded with less than 540 minutes of registered time per day |
| Kipping 2014 | The ActiGraph GT3X+ accelerometers were used for 5 days of data collection (3 weekdays and 2 weekend days) during the day (except when bathing, swimming, or participating in contact sports such as karate). Time spent sedentary was time spent in activities between 0 and 100 counts per minute |
| Toftager 2014 | Accelerometers were worn during all waking hours for 7 consecutive days except when doing water activities. Strings of 60 minutes or longer of consecutive zeroes, allowing for 2 epoch periods of non‐zero interruptions, were interpreted to represent non‐wear time. Valid data were at least 3 days with at least 10 hours (600 minutes) of activity per day. Evenson activity cut points were used to calculate sedentary time (> 100 CPM) expressed as minutes per day |
| Fairclough 2013 | Sedentary time was objectively assessed for 7 consecutive days using ActiGraph GT1M accelerometers and 5 second epochs. Sustained 20 minute periods of zero counts were considered non‐wear time. Valid wear time was at least 540 minutes on weekays and 480 minutes on weekend days for a minimum of 3 days. Cut points of 100 counts per minute were classified as sedentary time |
| Grydeland 2013 | Children wore accelerometers (GT1M/CSA model 7164; ActiGraph, Fort Walton Beach, FL, USA) for 5 consecutive days and were instructed to wear the monitor continuously all awake hours except when doing water activities. Output was sampled every 10 seconds for 2 weekdays and 2 weekend days with valid wear time set at a minimum of 3 days and for at least 8 hours each day |
| Okely 2011 | Participants wore an Actigraph accelerometer (7164 and GT1M models; Fort Walton Beach, FL) for 7 consecutive days attached to an adjustable elastic belt over the right hip. Data were collected in 30 second epochs. Thirty second activity counts were uploaded to determine the amount of time spent in sedentary activity |
| Webber 2008 | Minutes of sedentary time using accelerometers worn for 7 consecutive days except while bathing, swimming, or sleeping |
| Haerens 2006 | Children wore the accelerometer for 6 days above the right hip bone, underneath the clothes. Accelerometers were set to measure activity counts in an epoch time of 1 minute. Cut points < 800 were used for sedentary time |
| Trial ID | Physical fitness |
| Breheny 2020 | British Athletics Linear Track Test, children encouraged to run as far as they could in 2 minutes on a pre‐measured 50 metre linear track |
| Ketelhut 2020 | 6‐minute run test |
| Leahy 2019 | 20 metre PACER shuttle run test. The last successful stage was recorded and was converted into the number of 20 metre laps |
| Müller 2019 | 20 metre shuttle run test, adhering to a standard test protocol. Most schoolchildren wore school or street shoes, and some ran barefoot. The number of fully completed laps was recorded and was converted to VO2max values, according to a standard protocol |
| Ordóñez Dios 2019 | Cardiorespiratory capacity was evaluated using a 1 km test |
| Seibert 2019 | PACER 20 metre shuttle run test, terminated when the participant fails to complete the 20 metre run in the allotted time twice. PACER score expressed in number of laps completed and converted to a z‐score for age and sex |
| Seljebotn 2019 | Aerobic fitness was assessed by the Andersen test, a 10‐minute interval running test. Results are expressed as distance run in 10 minutes on a 20 metre course |
| Zhou 2019 | 20 metre shuttle‐run test was used to assess cardiorespiratory fitness |
| Carlin 2018 | Queens College Step Test was used; participants wore a heart rate monitor during the step test, with heart rate recorded at baseline, and at 10 seconds, 15 seconds, and 20 seconds following completion of the step test and was used to estimate VO2max as mL/kg/min |
| Have 2018 | Aerobic fitness was assessed using the Andersen test. Children were instructed to run as far as possible in 10 minutes back and forth between 2 lines 20 metres apart. The test score was total distance in metres run by each child |
| Pablos 2018 | 20 metre shuttle‐run test was used to determine the maximal oxygen consumption (VO2max). Indirect incremental multi‐stage field test over a distance of 20 metres to exhaustion using the pace set by a CD emitting beep signals at preset intervals. The initial speed was set at 8.5 km/hr for the first minute and was increased by 0.5 km/hr each subsequent minute |
| Robbins 2018 | The Progressive Aerobic CV Endurance Run (PACER) test, a 15 or 20 metre shuttle run was used. Participants ran from 1 line to another on a flat surface, according to audio cues, which increase in pace until participants can no longer complete laps in the time allotted. The number of laps completed is converted to estimated VO2 for analysis |
| Donnelly 2017 | The Progressive Aerobic Cardiovascular Endurance Run (PACER) by Leger was used. Participants ran a 20 metre shuttle course with 1 minute stages, paced by an audible beep. The number of laps completed constituted the PACER score |
| Torbeyns 2017 | The 20 metre shuttle run test involved running continuously between 2 points that are 20 metres apart from side to side. These runs are synchronised with a prerecorded CD, which beeps at set intervals. As the test proceeds, intervals between successive beeps decrease, forcing the athlete to increase speed over the course of the test, until it is impossible to keep in sync with the recording (or, on extremely rare occasions, until the athlete completes the test). The recording is structured into 21 ‘levels’, each of which lasts around 62 seconds. The interval of beeps is calculated as requiring speed at the start of 8.5 km/hr, increasing by 0.5 km/hr with each level thereafter. The highest level reached was used as the outcome measure |
| de Greeff 2016 | 20 metre shuttle run, cardiorespiratory endurance, in number of completed stages from the EUROFIT fitness battery |
| Jarani 2016 | The Andersen intermittent shuttle run test was used to estimate maximal oxygen uptake. Children had to run as fast as they could to cover the longest possible distance during the 10 minute test run, and this distance was the test result. To estimate child’s VO2max, the equation: VO2max = 18.38 + (0.03301 × distance) – (5.92 × sex) [(boys = 0; girls = 1)] was used |
| Lau 2016 | Assessed using the Progressive Aerobic Cardiovascular Endurance Run 20 metre shuttle run performance test by Leger. The number of laps completed for all participants was recorded and maximal shuttle run speed was calculated accordingly. Aerobic fitness was estimated using the most current cross‐validated regression model for predicting VO2max |
| Resaland 2016 | Aerobic fitness was measured with an Andersen intermittent practical running field test administered according to standard procedures: Children ran from one end line to another (20 metres apart) in an intermittent to‐and‐fro movement, with 15 second work periods and 15 second breaks (standing still), for a total duration of 10 minutes. We recorded the distance covered as the outcome for the analysis. To enable comparing of aerobic fitness level across studies, VO2peak was calculated using the equation suggested by Aadland |
| Tarp 2016 | Cardiorespiratory fitness was assessed by the Andersen test, a 10‐minute intermittent running test with total distance in metres used as the test result |
| Cohen 2015 | Cardiorespiratory fitness was assessed using the Leger 20 metre multi‐stage fitness test. Participants were required to run back and forth between 2 lines over a 20 metre distance within a set time limit. Running speed started at 8.5 km/hr and increased by 0.5 km/hr each minute. The test was completed when a participant failed to reach the line for 2 consecutive shuttles. Scores were recorded as the level and shuttle reached, which was converted to the number of 20 metre laps completed |
| Madsen 2015 | Participants completed the 1 mile run as a measure of cardiorespiratory fitness, with results presented as minutes to completion |
| Muros 2015 | Maximal oxygen uptake (VO2max) was estimated using a 20 metre incremental‐maximum shuttle run field test, employing the equation proposed by Ruiz. The shuttle run test involves running to and from between 2 lines placed 20 metres apart. Participants start at an initial velocity of 8.5 kph and increase their speed by 0.5 kph for every 20 metres covered as indicated by an audio recording played on a validated CD‐ROM. The test concludes when the subject is unable to reach the line on 2 consecutive occasions at the speed demanded by the audio recording |
| Suchert 2015 | The 20 metre shuttle run test (by Leger et al) was used. In this field test, participants run back and forth at a distance of 20 metres in a given time interval indicated by pre‐recorded audio signals. The required running pace starts with 8.0 km/hr and continuously increases by 0.5 km/hr each minute. The test stops either when students abandon by themselves or when they fail to reach the line by the sound for the second time. The total number of completed laps was used for statistical analyses. In addition, maximal oxygen consumption (VO2max) was estimated using the quadratic model by Mahar |
| Andrade 2014 | The EUROFIT test battery was used to assess cardiorespiratory endurance via the 20 metre shuttle run test |
| Nogueira 2014 | The 20 metre shuttle run test (aka, the beep test) was used and VO2max was estimated according to the velocity associated with the level reached by the participant, by using the algorithm VO2max = 31.025 + (3.238 × velocity) − (3.248 × age) + (0.1536 × age × velocity). Participants ran on an indoor surface between 2 points marked on the ground 20 metres apart; once the participant was unable to meet the required speed on successive laps, the level achieved was recorded, and associated velocity was entered into the algorithm along with age |
| Toftager 2014 | Aerobic fitness was measured using the Andersen test (20 metre shuttle run) expressed as metres completed |
| Fairclough 2013 | VO2peak was assessed using an individually calibrated continuous incremental treadmill (H/P/ Cosmos, Traunstein, Germany) test to volitional exhaustion, under ambient conditions, using an online gas analysis system (Jaeger Oxycon Pro; Viasys Healthcare, Warwick, UK) |
| Aburto 2011 | Participants ran around a calibrated track for 9 minutes, and the distance travelled was recorded in metres |
| Ardoy 2011 | A 20 yard or metre shuttle run was used to assess cardiorespiratory fitness |
| de Heer 2011 | The Progressive Aerobic Cardiovascular Endurance Run (PACER) test requires participants to run up and down a 20 metre court. At each side of the court, a beep sounds to signal the student to turn around and run back. The test increases in speed every minute and is completed when a student fails to reach the other side in time for the signal for the second time. Total number of laps completed was reported |
| Jago 2011 | Fitness was assessed by the 20 metre shuttle test (20 metre) using standard procedures by Leger |
| Jansen 2011 | Fitness was measured using the 20 metre shuttle run following the EUROFIT protocol |
| Magnusson 2011 | Cardiorespiratory fitness (W/kg) was measured with a Monark ergometer bike using the study protocol from the European Youth Heart study. This maximal ergometer test is run such that every 3 minutes, the weight on the wheel is increased by 20 to 25 W, depending on the participant’s weight. Each participant keeps a steady pace on the bike until exhaustion, or until he or she can no longer keep a steady pace |
| Thivel 2011 | The 20 metre shuttle run test developed by Léger was used. Children were instructed to run as long as possible between 2 lines 20 metres apart at an increasing speed imposed by emitted tones at intervals. The speed began at 8 km/hr and increased by 0.5 km/hr every minute. As soon as a child was not able to complete a whole stage, the test was stopped; the child’s score corresponded to the last fully completed stage |
| Kriemler 2010 | The Leger 20 metre shuttle run test was used, with results reported as number of laps completed |
| Walther 2009 | All participants underwent a graded treadmill test with spirometry until exhaustion, according to a modified Bruce protocol for children starting at 1.7 mph and 0 degrees |
| Reed 2008 | Leger's 20 metre incremental shuttle run was used, which was designed for children and provides age and sex reference normative data. Children ran 20 metre laps at 8.5 km/hr‐1. Running speed then increased by 0.5 km hr‐1 each minute. Children continued running until they could no longer maintain preset and standardised pace. Total laps were recorded |
| Wang 2008 | Biological measurements were made in a mobile laboratory that was brought to the school sites. Fitness level was assessed by HR at completion of the bench‐stepping test. Low HR at the end of 3 minutes of stepping indicates better CVF |
| Barbeau 2007 | Oxygen consumption (VO₂) was measured using a Sensormedics Vmax 229 cardiopulmonary system (Yorba Linda, CA). The treadmill protocol began with a 4 minute warm‐up at 0% grade and 2.0 mph. The speed was then increased by 0.5 mph every 2 minutes until reaching 3.0 mph, at which time the grade increased to 2% for 2 minutes, then increased an additional 3% every 2 minutes until reaching 20% grade or exhaustion |
| Bayne‐Smith 2004 | Measured fitness level as recovery from Queens College step test. Subjects stepped up and down a step for 3 minutes at 22 steps per minute. HRs were counted for 15 seconds beginning 5 seconds after stepping ended |
| Trevino 2004 | Outcome was measured as physical fitness score using a modified Harvard step test. Baseline HR was recorded. Child then stepped on and off a stool with both feet for 5 minutes. The student was paced at 30 cycles per minute. A physical fitness score was calculated from the total time of exercise (in seconds) multiplied by 100 and was divided by the sum of 3 HR values measured at 0, 1, and 2 minutes after exercise |
| Burke 1998 | Physical fitness was measured by laps completed in the Leger Shuttle Run, in which children ran 20 metre laps in time to a tape recording of beeps at a predetermined pace, continuing until they were unable to keep pace with the recording |
Appendix 4. 'Risk of bias' assessment
| 'Risk of bias' domains |
|
Random sequence generation (selection bias due to inadequate generation of a randomised sequence) For each included trial, we described the method used to generate the allocation sequence in sufficient detail to allow an assessment of whether it should produce comparable groups.
Allocation concealment (selection bias due to inadequate concealment of allocation prior to assignment) We described for each included trial the method used to conceal allocation to interventions prior to assignment, and we assessed whether intervention allocation could have been foreseen in advance of or during recruitment or changed after assignment.
We also evaluated trial baseline data to incorporate assessment of baseline imbalance into the 'Risk of bias' judgement for selection bias (Corbett 2014). Chance imbalances may also affect judgements on risk of attrition bias. In the case of unadjusted analyses, we distinguished between trials that we rated as being at low risk of bias on the basis of both randomisation methods and baseline similarity, and trials that we judged as being at low risk of bias on the basis of baseline similarity alone (Corbett 2014). We re‐classified judgements of unclear, low, or high risk of selection bias as specified in Appendix 4. Blinding of participants and study personnel (performance bias due to knowledge of allocated interventions by participants and personnel during the trial)
Blinding of outcome assessment (detection bias due to knowledge of allocated interventions by outcome assessment)
Incomplete outcome data (attrition bias due to quantity, nature, or handling of incomplete outcome data) For each included trial or each outcome, or both, we described the completeness of data, including attrition and exclusions from analyses. We stated whether the trial reported attrition and exclusions, and we reported the number of participants included in the analysis at each stage (compared with the number of randomised participants per intervention/comparator groups). We also noted if the trial reported reasons for attrition or exclusion, and whether missing data were balanced across groups or were related to outcomes. We considered the implications of missing outcome data per outcome such as high dropout rates (e.g. above 15%) or disparate attrition rates (e.g. difference of 10% or more between trial arms).
Selective reporting (reporting bias due to selective outcome reporting) We assessed outcome reporting bias by integrating results of the appendix 'Matrix of trial endpoints (publications and trial documents)' (Boutron 2014; Jones 2015a; Mathieu 2009), with those of the appendix 'High risk of outcome reporting bias according to the Outcome Reporting Bias In Trials (ORBIT) classification' (Kirkham 2010). This analysis formed the basis for the judgement of selective reporting.
Specific to cluster‐RCTs: recruitment bias For all cluster‐RCTs, we assessed recruitment bias by assessing whether individual participants were recruited to the trial, and individual‐level data were collected before or after clusters were randomised to an intervention or control group. This served as the basis for judgement of recruitment bias. Although the unit of randomisation is the cluster, bias could be introduced if individual participants knew whether the school or the classroom would receive the intervention or control condition prior to deciding whether or not to join the study.
Specific to cluster‐RCTs: baseline imbalance Often in cluster‐randomised trials, individuals within a cluster are more similar than participants across clusters. Particularly when the number of clusters randomised is small, there may be differences in baseline characteristics across study groups even if randomisation was successful.
Specific to cluster‐RCTs: loss of clusters
Specific to cluster‐RCTs: incorrect analysis Because participants in any cluster are often more similar than participants across clusters and tend to respond to an intervention in a similar manner, their data cannot be assumed to be independent. Failing to account for this is often referred to as 'unit‐of‐analysis error' because the unit of analysis is different from the unit of allocation (Whiting‐O'Keefe 1984), and many cluster‐randomised trials have been incorrectly analysed in this manner (Eldridge 2008).
|
Appendix 5. Health‐related quality of life: instruments
| Instrument | Dimensions (sub‐scales) (no. of items) | Validated instrument | Answer options | Scores |
Minimum score Maximum score |
Weighting of scores | Direction of scales | Minimal important difference |
|
Strengths and Difficulties Questionnaire Employed in (Leahy 2019) |
|
Yes (Goodman 1998 and Goodman 2001) | 3‐point scale | Item scores range from 0 to 2 Scale scores range from 0 to 10 | 0 to 40 | — | Higher scores indicate more psychological difficulties | — |
|
Perceived Stress Scale Employed in (Leahy 2019) |
10 items | Yes (Cohen 1983 and Chan 2013) | 5‐point scale | Item scores range from 0 to 4 | 0 to 40 | — | Higher scores indicate a greater degree of subjective stress experienced by participants | — |
|
KIDSCREEN KIDSCREEN‐10 Employed in (Jago 2019) KIDSCREEN‐27 Employed in Resaland 2016 |
KIDSCREEN‐10: 10 items KIDSCREEN‐27:
|
Yes (Ravens‐Sieberer 2006, Ravens‐Sieberer 2010, and Ravens‐Sieberer 2014) |
5‐point scale | Items are scored as Rasch scales, then translated into T‐values with mean of 50 and standard deviation of 10 | 1 to 5 | — | Higher T‐scores indicate higher HRQoL | — |
| Child Health Utility 9D (CHU9D) Employed in Breheny 2020, Jago 2019, Harrington 2018 | 9 items | Yes (Stevens 2011 and Stevens 2012) | 5‐point scale | Item levels range from 1 to 5 | 1 to 5 | Yes | Higher item scores indicate lower level of health | — |
| Pediatric quality of life inventory(PedsQL) Employed in Adab 2018 |
|
Yes (Varni 2003 and Varni 2017) | 5‐point scale (aged 8 to 18) 3‐point scale (aged 5 to 7) |
Item scores range from 0 to 4 Scale scores range from 0 to 100 | 0 to 100 | No | Higher scores indicate better HRQoL |
|
| European Quality of Life‐5 Dimensions Youth Survey (EQ‐5D‐Y) Employed in Jago 2015 | Descriptive system
Visual analogue scale: no sub‐scales |
Yes (Ravens‐Sieberer 2010 and van Reenen 2014) | Descriptive system: 3‐level scale Visual analogue scale: vertical, continuous scale |
Descriptive system: item levels range from 1 to 3 Visual analogue scale: 0 to 100 |
Descriptive system: 1 to 3 Visual analogue scale: 0 to 100 | Yes | Descriptive system: higher scores indicate worse health states Visual analogue scale: higher scores indicate better perceived health state |
— |
Data and analyses
Comparison 1. PA programme vs no PA programme.
| Outcome or subgroup title | No. of studies | No. of participants | Statistical method | Effect size |
|---|---|---|---|---|
| 1.1 Physical activity participation: all data | 5 | Other data | No numeric data | |
| 1.1.1 Children: before and after school programme | 1 | Other data | No numeric data | |
| 1.1.2 Children: schooltime PA | 1 | Other data | No numeric data | |
| 1.1.3 Children: multi‐component interventions | 1 | Other data | No numeric data | |
| 1.1.4 Adolescents: multi‐component interventions | 2 | Other data | No numeric data | |
| 1.2 Physical activity duration (minutes/d): meta‐analysis | 33 | 20614 | Mean Difference (IV, Random, 95% CI) | 0.73 [0.16, 1.30] |
| 1.2.1 Children | 22 | 10715 | Mean Difference (IV, Random, 95% CI) | 1.01 [0.08, 1.93] |
| 1.2.2 Adolescents | 11 | 9899 | Mean Difference (IV, Random, 95% CI) | 1.84 [0.34, 3.35] |
| 1.3 Physical activity duration by intervention type (minutes/d): meta‐analysis | 33 | 20614 | Mean Difference (IV, Random, 95% CI) | 0.73 [0.16, 1.30] |
| 1.3.1 Before and after school programmes | 6 | 2571 | Mean Difference (IV, Random, 95% CI) | 0.77 [‐1.40, 2.94] |
| 1.3.2 Enhanced PE | 3 | 2050 | Mean Difference (IV, Random, 95% CI) | ‐0.23 [‐1.58, 1.11] |
| 1.3.3 Multi‐component interventions | 16 | 12135 | Mean Difference (IV, Random, 95% CI) | 2.42 [0.62, 4.22] |
| 1.3.4 Schooltime PA | 8 | 3858 | Mean Difference (IV, Random, 95% CI) | 5.30 [0.89, 9.72] |
| 1.4 Physical activity duration: additional data | 6 | Other data | No numeric data | |
| 1.4.1 Before and after school programmes | 1 | Other data | No numeric data | |
| 1.4.2 Enhanced PE | 2 | Other data | No numeric data | |
| 1.4.3 Multi‐component intervention | 2 | Other data | No numeric data | |
| 1.4.4 Schooltime PA | 2 | Other data | No numeric data | |
| 1.5 Sedentary time (minutes/d): meta‐analysis | 16 | 11914 | Mean Difference (IV, Random, 95% CI) | ‐3.78 [‐7.80, 0.24] |
| 1.5.1 Children | 11 | 5766 | Mean Difference (IV, Random, 95% CI) | ‐3.35 [‐9.30, 2.60] |
| 1.5.2 Adolescents | 5 | 6148 | Mean Difference (IV, Random, 95% CI) | ‐5.67 [‐11.48, 0.14] |
| 1.6 Sedentary time (minutes/d) by intervention type: meta‐analysis | 16 | 11914 | Mean Difference (IV, Random, 95% CI) | ‐3.78 [‐7.80, 0.24] |
| 1.6.1 Before and after school programmes | 2 | 773 | Mean Difference (IV, Random, 95% CI) | 2.01 [‐15.28, 19.31] |
| 1.6.2 Enhanced PE | 1 | 540 | Mean Difference (IV, Random, 95% CI) | ‐11.18 [‐21.96, ‐0.40] |
| 1.6.3 Multi‐component interventions | 11 | 9164 | Mean Difference (IV, Random, 95% CI) | ‐4.60 [‐9.08, ‐0.12] |
| 1.6.4 Schooltime PA | 2 | 1437 | Mean Difference (IV, Random, 95% CI) | ‐3.26 [‐19.05, 12.52] |
| 1.7 Sedentary time: additional data | 4 | Other data | No numeric data | |
| 1.7.1 Before and after school programmes | 1 | Other data | No numeric data | |
| 1.7.2 Enhanced PE | 3 | Other data | No numeric data | |
| 1.7.5 Multi‐component intervention | 1 | Other data | No numeric data | |
| 1.8 Physical fitness (mL/kg/min): meta‐analysis | 13 | 3980 | Mean Difference (IV, Random, 95% CI) | 1.19 [0.57, 1.82] |
| 1.8.1 Children | 9 | 2215 | Mean Difference (IV, Random, 95% CI) | 1.47 [0.84, 2.09] |
| 1.8.2 Adolescents | 4 | 1765 | Mean Difference (IV, Random, 95% CI) | 0.58 [‐0.18, 1.35] |
| 1.9 Physical fitness (mL/kg/min) by intervention type: meta‐analysis | 13 | 3980 | Mean Difference (IV, Random, 95% CI) | 1.19 [0.57, 1.82] |
| 1.9.1 Before and after school programmes | 5 | 724 | Mean Difference (IV, Random, 95% CI) | 1.38 [0.34, 2.41] |
| 1.9.2 Enhanced PE | 4 | 1387 | Mean Difference (IV, Random, 95% CI) | 1.99 [0.76, 3.21] |
| 1.9.3 Multi‐component interventions | 3 | 1697 | Mean Difference (IV, Random, 95% CI) | ‐0.33 [‐0.73, 0.08] |
| 1.9.4 Schooltime PA | 1 | 172 | Mean Difference (IV, Random, 95% CI) | 2.70 [1.04, 4.36] |
| 1.10 Physical fitness: additional data | 29 | Other data | No numeric data | |
| 1.10.1 Before or after school programme | 4 | Other data | No numeric data | |
| 1.10.2 Enhanced PE | 5 | Other data | No numeric data | |
| 1.10.3 Multi‐component intervention | 11 | Other data | No numeric data | |
| 1.10.4 Schooltime PA | 10 | Other data | No numeric data | |
| 1.11 BMI: meta‐analysis [z‐scores] | 21 | 22948 | Mean Difference (IV, Random, 95% CI) | ‐0.06 [‐0.09, ‐0.02] |
| 1.11.1 Children | 16 | 15732 | Mean Difference (IV, Random, 95% CI) | ‐0.06 [‐0.11, ‐0.01] |
| 1.11.2 Adolescents | 5 | 7216 | Mean Difference (IV, Random, 95% CI) | ‐0.03 [‐0.05, ‐0.00] |
| 1.12 BMI by intervention type: meta‐analysis [z‐scores] | 21 | 22948 | Mean Difference (IV, Random, 95% CI) | ‐0.06 [‐0.09, ‐0.02] |
| 1.12.1 Before and after school programmes | 2 | 1615 | Mean Difference (IV, Random, 95% CI) | ‐0.02 [‐0.05, 0.01] |
| 1.12.2 Enhanced PE | 1 | 174 | Mean Difference (IV, Random, 95% CI) | ‐0.08 [‐0.29, 0.13] |
| 1.12.3 Multi‐component interventions | 17 | 19489 | Mean Difference (IV, Random, 95% CI) | ‐0.06 [‐0.11, ‐0.01] |
| 1.12.4 Schooltime PA | 1 | 1670 | Mean Difference (IV, Random, 95% CI) | ‐0.03 [‐0.08, 0.02] |
| 1.13 BMI: meta‐analysis [kg/m2] | 50 | 34337 | Mean Difference (IV, Random, 95% CI) | ‐0.07 [‐0.15, 0.01] |
| 1.13.1 Children | 38 | 25447 | Mean Difference (IV, Random, 95% CI) | ‐0.11 [‐0.19, ‐0.02] |
| 1.13.2 Adolescents | 12 | 8890 | Mean Difference (IV, Random, 95% CI) | 0.05 [‐0.16, 0.25] |
| 1.14 BMI by intervention type: meta‐analysis [kg/m2] | 50 | 34337 | Mean Difference (IV, Random, 95% CI) | ‐0.07 [‐0.15, 0.01] |
| 1.14.1 Before and after school programmes | 9 | 2314 | Mean Difference (IV, Random, 95% CI) | ‐0.12 [‐0.25, 0.01] |
| 1.14.2 Enhanced PE | 10 | 3357 | Mean Difference (IV, Random, 95% CI) | ‐0.04 [‐0.32, 0.24] |
| 1.14.3 Multi‐component interventions | 20 | 24417 | Mean Difference (IV, Random, 95% CI) | ‐0.10 [‐0.24, 0.03] |
| 1.14.4 Schooltime PA | 11 | 4249 | Mean Difference (IV, Random, 95% CI) | ‐0.05 [‐0.14, 0.04] |
| 1.15 BMI: additional data | 9 | Other data | No numeric data | |
| 1.15.1 Before or after school programme | 1 | Other data | No numeric data | |
| 1.15.2 Enhanced PE | 1 | Other data | No numeric data | |
| 1.15.3 Multi‐component intervention | 4 | Other data | No numeric data | |
| 1.15.4 Schooltime PA | 3 | Other data | No numeric data | |
| 1.16 Health‐related quality of life: all data | 7 | Other data | No numeric data | |
| 1.16.1 Children | 5 | Other data | No numeric data | |
| 1.16.2 Adolescents | 2 | Other data | No numeric data | |
| 1.17 Adverse events: all data | 16 | Other data | No numeric data |
1.15. Analysis.
Comparison 1: PA programme vs no PA programme, Outcome 15: BMI: additional data
| BMI: additional data | ||||||
| Study | Study population | Intervention group | Control Group | Measurement period | Overall effect | Comment |
| Before or after school programme | ||||||
| Carlin 2018 | Female students, aged 11 to 13 years old | Brisk walking intervention | Continued with normal PA habits | 12 weeks | No between group differences | BMI values not reported |
| 6 months | No between group differences | |||||
| Enhanced PE | ||||||
| Ardoy 2011 | Students age 12 to 14, enrolled in first year of secondary school | I1: 4 sessions/week of PE I2: 4 sessions/week of PE with emphasis on increasing intensity |
2 sessions/week of PE | 16 weeks | No between group differences | BMI values not reported |
| Multi‐component intervention | ||||||
| Burke 1998 | — | I1: standard PA and nutrition program including classroom lessons, fitness sessions daily, and nutrition program I2: I1 plus a PA enrichment program for higher‐risk children |
No program | 9 months | Significant difference between I1 and control group in boys only, P = 0.016 No significant difference between I1 and control in girls, or I2 and control |
No BMI values reported |
| 15 months | No significant differences between groups for boys or girls | |||||
| Ickovics 2019 | Grades 5 and 6 students | I1: PA school wellness policy I2: PA + nutrition school wellness policy |
C1: Nutrition school wellness policy C2: delayed control |
3 years | No significant group by time interaction P = 0.94 | No BMI values reported |
| Salmon 2008 | Grade 5 students (approximately 10 to 11 years old) | I1: behavioral modification group I2: fundamental motor skills group I3: combined behavioral modification and fundamental motor skills group |
Usual classroom lessons | 1 school year | Adjusted BMI/sex‐age population median I1: MD ‐0.40 (95% CI ‐1.11, 0.30) kg/m2 I2: MD ‐0.50 (95% CI ‐1.25, 0.25) kg/m2 I3: MD ‐1.30 (95% CI ‐2.29, ‐0.31) kg/m2 |
BMI/sex‐age population median not kg/m2 or z‐score |
| Suchert 2015 | Students age 12 to 17 years | Multilevel intervention targeting students, classrooms, schools, and parents | No intervention | 12 weeks | — | BMI percentile, not kg/m2 or z‐score |
| 1 year | BMI percentile: MD 1.09 (95% CI −0.64, 2.82), P = 0.215 | |||||
| Schooltime PA | ||||||
| Donnelly 2017 | Grades 2 and 3 students | Academic Achievement and Physical Activity Across the Curriculum lessons, 160 min/week of MVPA | Traditional classroom instruction and typical PE schedule | 3 years | BMI percentile (change from baseline): MD ‐2.3, 95% CI: ‐4.8, 0.2 | BMI percentile, not kg/m2 or z‐score |
| Kobel 2014 | Pupils at primary school, grades 1 and 2 | Teacher training, PA education, and active breaks | No intervention | 1 year | Adjusted BMI percentile (change from baseline): MD 0.5, 95% CI: ‐0.5, 1.5 | BMI percentile, not kg/m2 or z‐score |
| Williamson 2007 | Students in grades 2 to 6 | Healthy Eating and Exercise program to increase PA during the school day and at home | Alcohol/Drug/Tobacco abuse prevention program | 2 years | No between group differences, P = 0.5458 | BMI values not reported |
Characteristics of studies
Characteristics of included studies [author‐defined order]
Breheny 2020.
| Study characteristics | ||
| Methods | Study design: cluster‐RCT | |
| Participants |
School inclusion criteria: UK schools with at least 20 pupils in school years 3 and 5 School exclusion criteria: none Student inclusion criteria: students in Years 3 (aged 7 to 8 years) and 5 (aged 9 to 10 years) Student exclusion criteria: pupils that had a disability preventing them from running or walking for 15 minutes and those who were unable to have their height and/or weight measured at baseline Setting: school Age group: children Gender distribution: females and males Country where trial was performed: UK |
|
| Interventions |
Intervention: The Daily Mile. Each day, the teacher leads the class on a run or walk as fast as they can go in 15 minutes Comparator: usual practice Duration of intervention: 12 months Duration of follow‐up: ‐ Number of schools: 40 Theoretical framework: ‐ |
|
| Outcomes | Fitness BMI Health‐related quality of life |
|
| Study registration | ISRCTN 12698269 | |
| Publication details |
Language of publication: English Funding: Birmingham City Council Publication status: peer‐reviewed journal |
|
| Stated aim for study | "The aim of this pragmatic cluster RCT is to assess the clinical and cost‐effectiveness of The Daily Mile in Birmingham primary schools for the purpose of improving health and well being" | |
| Notes | ||
| Risk of bias | ||
| Bias | Authors' judgement | Support for judgement |
| Random sequence generation (selection bias) | Low risk | Quote from publication: "an independent statistician used a constrained randomisation based algorithm in a statistical package" |
| Allocation concealment (selection bias) | Low risk | Quote from publication: "an independent statistician used a constrained randomisation based algorithm in a statistical package" |
| Blinding of participants and personnel (performance bias) All outcomes | High risk | Quote from publication: "it was not possible to mask school staff, children, family members and project staff" |
| Blinding of outcome assessment (detection bias) All outcomes | Low risk | Quote from publication: "all research staff undertaking the physical measurements were blinded" |
| Incomplete outcome data (attrition bias) Anthropometrics, Fitness | Low risk | Quote from publication: "There was a large amount of missing data for the other secondary outcomes. For fitness and academic attainment this exceeded 56% at certain time points and therefore multiple imputation was performed and both complete case and imputed variables are reported" |
| Selective reporting (reporting bias) | Low risk | Comment: all applicable outcomes reported |
| Cluster RCT ‐ Recruitment bias | Low risk | Comment: schools enrolled and baseline data collected prior to randomisation |
| Cluster RCT ‐ Baseline imbalance | Low risk | Comment: no baseline differences |
| Cluster RCT ‐ Loss of clusters | High risk | Comment: 1 cluster lost from control arm |
| Cluster RCT ‐ Incorrect analysis | Low risk | Comment: clustering accounted for in analysis |
Ketelhut 2020.
| Study characteristics | ||
| Methods | Study design: cluster‐RCT | |
| Participants |
School inclusion criteria: within a pool of project schools from another study School exclusion criteria: ‐ Student inclusion criteria: third grade, written parental/guardian consent Student exclusion criteria: health conditions that did not allow unrestricted physical activity Setting: school Age group: children Gender distribution: females and males Country where trial was performed: Germany |
|
| Interventions |
Intervention: high‐intensity interval training incorporated into the first 20 minutes of regular PE classes (1 × 45 minutes and 1 × 90 minutes per week) Comparator: regular PE classes (1 × 45 minutes and 1 × 90 minutes per week) Duration of intervention: 12 weeks Duration of follow‐up: ‐ Number of schools: 1 Theoretical framework: ‐ |
|
| Outcomes | Fitness | |
| Study registration | ‐ | |
| Publication details |
Language of publication: English Funding: ‐ Publication status: peer‐reviewed journal |
|
| Stated aim for study | "the aim of the present study was to examine the effects of a regular school‐based and child‐specific high intensity interval training intervention not only on aerobic fitness and peripheral blood pressure but moreover on different parameters of arterial stiffness" | |
| Notes | ||
| Risk of bias | ||
| Bias | Authors' judgement | Support for judgement |
| Random sequence generation (selection bias) | Low risk | Quote from publication: "randomisation was carried out by the principal investigator using a computer‐generated random number table" |
| Allocation concealment (selection bias) | Unclear risk | Comment: not described |
| Blinding of participants and personnel (performance bias) All outcomes | Unclear risk | Comment: not described; not likely done |
| Blinding of outcome assessment (detection bias) All outcomes | Unclear risk | Comment: not described |
| Incomplete outcome data (attrition bias) Anthropometrics, Fitness | Unclear risk | Comment: not described |
| Selective reporting (reporting bias) | Unclear risk | Comment: no protocol or registry document available. |
| Cluster RCT ‐ Recruitment bias | Unclear risk | Comment: not described |
| Cluster RCT ‐ Baseline imbalance | Low risk | Comment: no baseline differences |
| Cluster RCT ‐ Loss of clusters | Low risk | Comment: no clusters lost |
| Cluster RCT ‐ Incorrect analysis | High risk | Comment: analyses not adjusted for clustered nature of data |
Belton 2019.
| Study characteristics | ||
| Methods | Study design: cluster‐RCT | |
| Participants |
School inclusion criteria: (a) schools have a qualified PE teacher on staff, (b) first year students attending the school were time tabled for a minimum of 70 minutes of PE weekly, (c) schools were mixed gender and were situated in the greater area of a large Irish city School exclusion criteria: — Student inclusion criteria: first year post primary students (12 to 13 years old) attending post primary education within a particular Irish geographical region Student exclusion criteria: — Setting: school Age group: adolescent Gender distribution: females and males Country/Countries where trial was performed: Ireland |
|
| Interventions |
Intervention: a whole‐school multi‐component intervention programme, aimed at reducing the age‐related decline of MVPA among adolescents. Key features include 1. PE component: PE teachers received 4 hours of Y‐PATH professional development including 6 targeted lesson plans focusing heavily on motivational climate, integrating health‐related activity core knowledge through fun and engaging practical lessons, with an emphasis on functional movement skill proficiency. Resource cards were used to prompt teachers to enable them to integrate a health‐related activity and fundamental movement skill focus within other core PE content areas. Students were given a PA journal to learn to track PA behaviours and identify ways to increase PA levels, and a PA directory containing information and contact details for local youth sport and PA clubs 2. Whole‐school teacher component: PA promotion workshops for teachers, and development and implementation of a school 'charter' for PA. Teachers were encouraged to be 'active role models' 3. Parent component: information evening for parents and information leaflets distributed through the school newsletter to highlight key strategies for promoting PA beyond the school environment Comparator: usual care, consisting of regular delivery of the Irish Junior Cycle PE curriculum, and the broader school curricula Duration of intervention: 2 years Duration of follow‐up: 2 years Number of schools: 20 Theoretical framework: social‐ecological framework, self‐determination theory |
|
| Outcomes | PA duration | |
| Study registration | ISRCTN20495704 | |
| Publication details |
Language of publication: English Funding: Dublin Local Sports Partnerships, Dublin City University Career Start grant Publication status: peer‐reviewed journal |
|
| Stated aim for study | "to investigate the effect of participation in the Y‐PATH intervention over a two‐year period on objectively measured MVPA levels of young people" | |
| Notes | ||
| Risk of bias | ||
| Bias | Authors' judgement | Support for judgement |
| Random sequence generation (selection bias) | High risk | Quote from publication: "one school from each pair was then randomly allocated by the study principal investigator to the control group (and the other to the intervention group) using a manual number generator in blocks of 1:1, prior to the commencement of baseline testing" |
| Allocation concealment (selection bias) | High risk | Quote from publication: "one school from each pair was then randomly allocated by the study principal investigator to the control group (and the other to the intervention group) using a manual number generator in blocks of 1:1, prior to the commencement of baseline testing" |
| Blinding of participants and personnel (performance bias) All outcomes | High risk | Quote from publication: "not possible given the nature of the intervention" |
| Blinding of outcome assessment (detection bias) All outcomes | High risk | Quote from publication: "not possible given the nature of the intervention" |
| Incomplete outcome data (attrition bias) Anthropometrics, Fitness | High risk | Comment: BMI data missing > 10% |
| Incomplete outcome data (attrition bias) Physical activity and sedentary time | High risk | Comment: Large % missing data |
| Selective reporting (reporting bias) | High risk | Comment: BMI data not reported, stated in methods; secondary outcomes listed in clinical trials registry not reported |
| Cluster RCT ‐ Recruitment bias | High risk | Comment: baseline data collected after randomisation of schools |
| Cluster RCT ‐ Baseline imbalance | Low risk | Comment: groups balanced at baseline [author communication] |
| Cluster RCT ‐ Loss of clusters | High risk | Comment: 50% of clusters lost at 24 months |
| Cluster RCT ‐ Incorrect analysis | Low risk | Quote from publication: "a three level multilevel structure was proposed with random intercepts, where time (Level one), pupils (Level two) and schools (Level three) served as the grouping variables, where time was treated as a fixed effect in the model but was also incorporated as a random slope effect (repeated measure) in the residual component" |
Corepal 2019.
| Study characteristics | ||
| Methods | Study design: cluster‐RCT | |
| Participants |
School inclusion criteria: post‐primary schools in Belfast that had previously participated in research projects with the university School exclusion criteria: ‐ Student inclusion criteria: Year 9 classes Student exclusion criteria: advised by a general practitioner not to undertake MVPA, did not provide assent, or parents completed parental opt‐out consent form Setting: school Age group: adolescents Gender distribution: females and males Country where trial was performed: North Ireland |
|
| Interventions |
Intervention: StepSmart Challenge used gamification and self‐determination theory to encourage and support PA behaviour change. During phase 1, competitions were held between schools, between classes, and between students using material and social incentives. FitBit Zips were provided to track progress towards challenges. Phase 2 included a within‐student pedometer competition using the StepSmart Challenge website Comparator: no intervention or incentives Duration of intervention: 22 weeks Duration of follow‐up: 52 weeks Number of schools: 5 Theoretical framework: self‐determination theory |
|
| Outcomes | PA duration Sedentary time |
|
| Study registration | NCT02455986 | |
| Publication details |
Language of publication: English Funding: HSC R&D Enabling Research Award Publication status: peer‐reviewed journal |
|
| Stated aim for study | "This study investigated the feasibility of implementing and evaluating a school‐based gamified pedometer competition designed to promote physical activity among 12–14‐year‐olds, known as ‘The StepSmart Challenge’, which integrates core gamification strategies with self‐determination theory" | |
| Notes | ||
| Risk of bias | ||
| Bias | Authors' judgement | Support for judgement |
| Random sequence generation (selection bias) | Low risk | Quote from publication: "stratified randomisation process (stratified by socioeconomic status, and whether schools were single‐sex or co‐educational) was undertaken by an independent statistician to assign schools to the intervention or control group using software available at http://www.randomization.com" |
| Allocation concealment (selection bias) | Low risk | Quote from publication: "stratified randomisation process (stratified by socioeconomic status, and whether schools were single‐sex or co‐educational) was undertaken by an independent statistician to assign schools to the intervention or control group using software available at http://www.randomization.com" |
| Blinding of participants and personnel (performance bias) All outcomes | Unclear risk | Comment: not described |
| Blinding of outcome assessment (detection bias) All outcomes | Unclear risk | Comment: not described |
| Incomplete outcome data (attrition bias) Physical activity and sedentary time | High risk | Comment: only 57.4% of returned accelerometers had data valid for analysis |
| Selective reporting (reporting bias) | Low risk | Comment: all relevant outcomes reported |
| Cluster RCT ‐ Recruitment bias | Unclear risk | Comment: not described |
| Cluster RCT ‐ Baseline imbalance | Unclear risk | Comment: not described |
| Cluster RCT ‐ Loss of clusters | Low risk | Comment: no clusters lost |
| Cluster RCT ‐ Incorrect analysis | Low risk | Comment: feasibility trial, thus only descriptive values reported |
Ickovics 2019.
| Study characteristics | ||
| Methods | Study design: cluster‐RCT | |
| Participants |
School inclusion criteria: K through 8 district schools New Haven, Connecticut School exclusion criteria: — Student inclusion criteria: students enrolled in Grade 5 when the study began or began attending a target school in Grade 6 Student exclusion criteria: — Setting: school, urban Age group: children Gender distribution: females and males Country where trial was performed: USA |
|
| Interventions |
Intervention 1: PA only Intervention 2: Nutrition + PA All schools received $500/y to establish a School Wellness team, focused on written policy implementation relevant to randomised condition. Research staff supported schools with 1 to 2 visits per month to provide workshops PA: high‐quality PE class at least 90 minutes/week to foster a lifelong appreciation for physical fitness and to participate in fitness activities; promotion of active transport; integration of PA into the classroom; fitness challenges. PA will not be used as a form of punishment (e.g. running laps, withholding recess), distribution of activity monitors, use of online tracking software, family‐targeted newsletters Nutrition: appealing and attractive meals, clean and pleasant setting, no fried vegetables, only low‐fat, non‐flavoured milk, whole‐grain cereals. Schools will not use food or beverages as rewards or punishments, and will limit celebrations involving food to once per month and with only 1 food or beverage that does not meet school nutrition standards. Nutrition education provided through parent workshops, student materials, school menus, and bulletins. Schools asked to engage parents and students in thorough taste testing of new menu options and to assist with selecting food Comparator 1: nutrition intervention only Comparator 2: delayed control; schools received other health‐relevant training (e.g. oral health, cold or influenza prevention) during the study period, with obesity‐related materials delivered at study completion Duration of intervention: 3 years Duration of follow‐up: annually for 3 years Number of schools: 12 Theoretical Framework: — |
|
| Outcomes | BMI | |
| Study registration | NCT02043626 (retrospectively registered) | |
| Publication details |
Language of publication: English Funding: non‐commercial funding (research funding body) Publication status: peer‐reviewed journal |
|
| Stated aim for study | "The objective of this cluster randomised trial is to assess whether implementation of specific nutrition and PA components of the written school wellness policies lead to healthier student outcomes, including BMI trajectories and behavioral correlates" | |
| Notes | ||
| Risk of bias | ||
| Bias | Authors' judgement | Support for judgement |
| Random sequence generation (selection bias) | Low risk | Quote from publication: "randomisation was achieved using a computer‐generated sequence" |
| Allocation concealment (selection bias) | Low risk | Quote from publication: "to minimize selection bias, all schools were recruited before randomisation" |
| Blinding of participants and personnel (performance bias) All outcomes | High risk | Quote from publication: "neither schools nor researchers could be blinded to study condition" |
| Blinding of outcome assessment (detection bias) All outcomes | High risk | Quote from publication: "neither schools nor researchers could be blinded to study condition" |
| Incomplete outcome data (attrition bias) Anthropometrics, Fitness | Low risk | Comment: most missing data due to students moving |
| Selective reporting (reporting bias) | High risk | Comment: mental health and standardised test scores not reported |
| Cluster RCT ‐ Recruitment bias | Unclear risk |
Quote from publication: "schools were recruited before randomisation" Comment: unclear when baseline data were collected |
| Cluster RCT ‐ Baseline imbalance | Low risk | Comment: there were no notable school‐level differences in size or relevant socioeconomic characteristics |
| Cluster RCT ‐ Loss of clusters | Low risk | Comment: no clusters lost |
| Cluster RCT ‐ Incorrect analysis | Low risk | Quote from publication: "multivariable analyses accounted for multilevel nature of data, adjusting for intra‐cluster correlation among repeated measures within students and schools, and allowed use of all study time points" |
Jago 2019.
| Study characteristics | ||
| Methods | Study design: cluster‐RCT | |
| Participants |
School inclusion criteria: primary schools from South Gloucestershire and North Somerset local authority School exclusion criteria: — Student inclusion criteria: pupils in Year 3 or 4 (aged 7 to 9) at baseline Student exclusion criteria: — Setting: school Age group: children Gender distribution: females and males Country where trial was performed: UK |
|
| Interventions |
Intervention: Action 3:30R after‐school clubs, scheduled to run twice per week for 15 weeks and last 60 minutes per session. Sessions were designed to promote maximal participation, skill development, cooperation, problem‐solving, PA, and choice. Sessions began with fun warm‐up activities and moved through a series of small sided games and activities with a focus on fun and participation while improving fundamental movement skills such as running, catching, throwing, and using space in invasion games. Teaching assistants took part in 5 days (25 hours) of training to promote and foster aspects of motivation drawn within the club, with focus on creating a club climate that supported autonomy, relatedness, and competence. Teaching assistants completed a log book to indicate whether sessions were delivered fully, partially, or not at all and a register of attendance Comparator: — Duration of intervention: 15 weeks Duration of follow‐up: 15 weeks Number of schools: 12 Theoretical framework: self‐determination theory |
|
| Outcomes | PA duration Sedentary time BMI Health‐related quality of life |
|
| Study registration | ISRCTN34001941 | |
| Publication details |
Language of publication: English Funding: non‐commercial funding (governmental organisation) Publication status: peer‐reviewed journal |
|
| Stated aim for study | "The aim of this study is to test the feasibility of the revised version of Action 3:30 which has been reworked to more successfully appeal to and engage girls and recruit less active children" | |
| Notes | ||
| Risk of bias | ||
| Bias | Authors' judgement | Support for judgement |
| Random sequence generation (selection bias) | Low risk | Quote from publication: "computer generated" |
| Allocation concealment (selection bias) | Low risk | Quote from publication: "allocation will be performed (computer‐generated allocation) by an independent member of the Bristol Randomised Trials Collaboration who will be blind to the school identity" |
| Blinding of participants and personnel (performance bias) All outcomes | High risk | Quote from publication: "randomisation will take place after baseline data collection has been completed. School is the unit of randomisation" |
| Blinding of outcome assessment (detection bias) All outcomes | High risk | Comment: attempted to blind staff, but unsuccessful [author communication] |
| Incomplete outcome data (attrition bias) Anthropometrics, Fitness | Low risk | Comment: low loss to follow‐up at student level |
| Incomplete outcome data (attrition bias) Physical activity and sedentary time | Low risk | Comment: low loss to follow‐up at student level |
| Selective reporting (reporting bias) | Low risk | Comment: all outcomes in protocol paper reported |
| Cluster RCT ‐ Recruitment bias | Low risk | Quote from publication: "all measures will be taken at baseline prior to randomisation" |
| Cluster RCT ‐ Baseline imbalance | Low risk | Comment: Control and intervention groups did not differ by demographics, PA, or psychosocial outcomes at baseline |
| Cluster RCT ‐ Loss of clusters | High risk | Comment: 2 schools dropped out after randomisation |
| Cluster RCT ‐ Incorrect analysis | Low risk | Quote from publication: "multivariable mixed effects linear regression that took account of the clustering of pupils in schools was conducted" |
Leahy 2019.
| Study characteristics | ||
| Methods | Study design: cluster‐RCT | |
| Participants |
School inclusion criteria: — School exclusion criteria: — Student inclusion criteria: students in Grade 11 at study schools who did not have an injury or illness that would preclude their participation in high‐intensity activity as outlined in the participant information and consent form (e.g. existing physical injury) Student exclusion criteria: — Setting: school Age group: adolescents Gender distribution: females and males Country where trial was performed: Australia |
|
| Interventions |
Intervention: Burn2Learn, a 14‐week multi‐component high‐intensity interval training intervention to improve older adolescents’ physical and mental health. Participants were prescribed 3 high‐intensity interval training sessions/week, for 14 weeks. Teachers were asked to offer at least 2 opportunities/week for high‐intensity interval training during class time, with the ultimate target of students performing 3 sessions/week (i.e. 1 self‐directed session outside of class). Any additional high‐intensity interval training sessions performed by participants were reported individually to the school champion to monitor session adherence. High‐intensity interval training sessions comprised a brief 2‐minute warm‐up, followed by 8 to 16 minutes of high‐intensity interval training, followed by a 2‐minute cool‐down (12 to 20 minutes total). Sessions were performed individually, in pairs, or in small groups. Participants were provided with pre‐designed high‐intensity interval training workouts that included a combination of aerobic‐based (e.g. shuttle runs) and resistance‐based (e.g. push‐ups) exercises designed to be performed using minimal space and equipment. Participants were able to select from the following high‐intensity interval training theme workouts: gym high‐intensity interval training, sport high‐intensity interval training, class high‐intensity interval training, dance high‐intensity interval training, combat high‐intensity interval training, and brain high‐intensity interval training. A full‐day professional learning workshop was provided for a school champion (i.e. teacher) and another member of staff to facilitate the Burn2Learn programme. The intervention included an introductory seminar for students, school‐based high‐intensity interval training sessions, parental videos, and an equipment and resource pack (including high‐intensity interval training task cards). Technique cards reinforcing correct technique were also provided to the intervention school and were used by the school champion during early weeks of the intervention. To encourage maintenance of the appropriate exercise intensity (i.e. > 85% maximum heart rate), participants were provided with heart rate monitors (Wahoo TICKR) during high‐intensity interval training sessions. Participants’ heart rates during sessions were viewed on smartphones utilising a commercially available group heart rate monitoring application (OnBeat) Comparator: a wait‐list control group participated in usual school activities and received the intervention following the post‐test assessment period Duration of intervention: 14 weeks Duration of follow‐up: 14 weeks Number of schools: 2 Theoretical framework: self‐determination theory |
|
| Outcomes | Fitness BMI Health‐related quality of life |
|
| Study registration | ACTRN12617000544370 | |
| Publication details |
Language of publication: English Funding: non‐commercial funding (governmental organisation) Publication status: peer‐reviewed journal |
|
| Stated aim for study | "the objective of this study was to evaluate the impact of a teacher‐facilitated high intensity interval training program for older adolescents, embedded within the school day in regard to 4 domains of feasibility (i.e. recruitment, retention, adherence, and program satisfaction). Preliminary efficacy was evaluated by testing the effect of the high intensity interval training program on cardiorespiratory fitness, muscular fitness, and psychological health" | |
| Notes | ||
| Risk of bias | ||
| Bias | Authors' judgement | Support for judgement |
| Random sequence generation (selection bias) | Low risk | Quote from publication: "the 2 schools were randomised to the Burn2Learn intervention group, or a wait‐list control group using a coin flip by an independent researcher not involved in the project following baseline assessments" |
| Allocation concealment (selection bias) | Low risk | Quote from publication: "the 2 schools were randomised to the Burn2Learn intervention group, or a wait‐list control group using a coin flip by an independent researcher not involved in the project following baseline assessments" |
| Blinding of participants and personnel (performance bias) All outcomes | High risk | Comment: not possible |
| Blinding of outcome assessment (detection bias) All outcomes | High risk | Quote from publication: "trained research assistants, who were blinded to group allocation, conducted assessments for the primary outcome. Assessors responsible for the collection of secondary outcomes were not blinded to group allocation" |
| Incomplete outcome data (attrition bias) Anthropometrics, Fitness | High risk | Comment: reasons for dropout not reported |
| Selective reporting (reporting bias) | High risk | Comment: PA not reported |
| Cluster RCT ‐ Recruitment bias | Low risk | Quote from publication: "the 2 schools were randomised to the Burn2Learn intervention group, or a wait‐list control group using a coin flip by an independent researcher not involved in the project following baseline assessments" |
| Cluster RCT ‐ Baseline imbalance | Low risk | Comment: baseline demographics were compared, and all groups were similar [author communication] |
| Cluster RCT ‐ Loss of clusters | Low risk | Comment: no clusters lost |
| Cluster RCT ‐ Incorrect analysis | High risk | Comment: no clustering accounted for in analysis |
Lonsdale 2019a.
| Study characteristics | ||
| Methods | Study design: cluster‐RCT | |
| Participants |
School inclusion criteria: (1) school with students enrolled in Grades 8 and 9; (2) funded by the New Sout Wales Department of Education; (3) permission granted by the principal, the head PE teacher, and at least 1 Grade 8 PE teacher; (4) located in Western Sydney; (5) in a postal code with a mean decile rank that was below the median on the Australian Bureau of Statistics’ Index of Relative Socioeconomic Disadvantage School exclusion criteria: — Student inclusion criteria: students physically able to take part in Grade 8 PE Student exclusion criteria: — Setting: school Age group: adolescent Gender distribution: females and males Country/Countries where trial was performed: Australia |
|
| Interventions |
Intervention: the 'Activity and Motivation in Physical Education’ (AMPED) intervention had 2 aims: (1) to help teachers deliver lessons that maximised opportunities for MVPA; and (2) to help teachers enhance their students’ motivation towards PE. Teachers’ learnt strategies that were categorised under 2 headings: (A) ‘Maximising Movement and Skill Development’ and (B) ‘Reducing Transition Time’. Strategies to enhance student motivation were organised under 2 further headings: (C) ‘Building Competence’ and (D) ‘Supporting Students’. Face‐to‐face workshops included brief presentations by the research team, but many of these teachers worked independently on the project’s website. This independent work was designed to help ensure teachers were comfortable working on the website, to facilitate later use. Throughout the entire intervention, teachers had access to online resources, a discussion forum, videos of good/poor practice, and the project’s mobile phone application, which included implementation and self‐reflection prompts Comparator: standard teaching, wait‐list control Duration of intervention: 7 to 8 months Duration of follow‐up: 14 to 15 months Number of schools: 14 Theoretical framework: self‐determination theory, |
|
| Outcomes | PA duration Sedentary time |
|
| Study registration | ACTRN12614000184673 | |
| Publication details |
Language of publication: English Funding: non‐commercial funding (research funding body) Publication status: peer‐reviewed journal |
|
| Stated aim for study | "The purpose of this study is to evaluate an intervention designed to increase the amount of health‐enhancing PA that secondary school students accumulate during their school‐based PE lessons" | |
| Notes | ||
| Risk of bias | ||
| Bias | Authors' judgement | Support for judgement |
| Random sequence generation (selection bias) | Low risk | Quote from publication: "using a computer‐based randomisation plan generator...a researcher not associated with recruitment or data collection, and who will be blind to school identity, will carry out randomisation procedures" |
| Allocation concealment (selection bias) | Low risk | Comment: All 14 eligible schools randomised at 1 time point |
| Blinding of participants and personnel (performance bias) All outcomes | Low risk |
Quote from publication: "students participating in the study will also be blinded to hypotheses and school allocation. Teachers will be aware of their allocation to the intervention or control condition" Comment: using only objective physical activity assessment, teacher's knowledge unlikely to bias results |
| Blinding of outcome assessment (detection bias) All outcomes | Low risk | Quote from publication: "trained research assistants who will be blinded to school allocation will conduct baseline, post‐intervention and maintenance phase assessments" |
| Incomplete outcome data (attrition bias) Physical activity and sedentary time | High risk | Comment: 34% and 44% of physical activity data missing in intervention and control groups, respectively, at end of study |
| Selective reporting (reporting bias) | Low risk | Comment: all relevant outcomes reported |
| Cluster RCT ‐ Recruitment bias | High risk | Comment: teachers and students enrolled after schools randomised; teachers aware of allocation |
| Cluster RCT ‐ Baseline imbalance | Low risk | Comment: baseline characteristics balanced between 2 groups |
| Cluster RCT ‐ Loss of clusters | Low risk | Comment: no clusters lost |
| Cluster RCT ‐ Incorrect analysis | Low risk | Quote from publication: "we included four random intercept effects for: (1) lesson; (2) student; (3) teacher; and (4) class. When preliminary analyses suggested clustering at the school level, we included a fifth random intercept effect for this level" |
Müller 2019.
| Study characteristics | ||
| Methods | Study design: cluster‐RCT | |
| Participants |
School inclusion criteria: quintile 3 schools selected based on geographic location, representation of various target communities, and commitment to support project activities School exclusion criteria: < 100 learners in Grade 4 Student inclusion criteria
Student exclusion criteria: — Setting: school Age group: children/adolescents Gender distribution: females and males Country where trial was performed: South Africa |
|
| Interventions |
Intervention 1: PA: a multi‐dimensional PA intervention during school time developed in collaboration with education authorities, teachers, and students. 4 key components included:
Intervention 2: PA + Health education: health education lessons were held to increase children’s awareness of intestinal parasite infections Intervention 3: PA + Health education + Nutrition: a nutrition intervention consisting of classroom‐based lessons to help increase awareness of the importance of healthy nutrition were held Comparator 1: Health education + Nutrition Comparator 2: no intervention Duration of intervention: 2 × 10‐week blocks Duration of follow‐up: 15 months Number of schools: 8 Theoretical framework: — |
|
| Outcomes | Fitness BMI |
|
| Study registration | ISRCTN68411960(retrospectively registered) | |
| Publication details |
Language of publication: English Funding: non‐commercial funding (research funding body) Publication status: peer‐reviewed journal |
|
| Stated aim for study | "The overarching purpose of the Disease, Activity and Schoolchildren’s Health study was to investigate the dual disease burden (i.e. non‐communicable diseases and infectious diseases) among children in primary schools in disadvantaged neighbourhoods" | |
| Notes | ||
| Risk of bias | ||
| Bias | Authors' judgement | Support for judgement |
| Random sequence generation (selection bias) | Low risk | Quote from publication: "generating the allocation sequence by a simple randomisation of the schools was carried out by the research team on the basis of a computer‐generated random number list" |
| Allocation concealment (selection bias) | High risk | Quote from publication: "research team allocated schools, concealment and blinding were not possible in our study design" |
| Blinding of participants and personnel (performance bias) All outcomes | High risk | Quote from publication: "concealment and blinding were not possible in our study design" |
| Blinding of outcome assessment (detection bias) All outcomes | High risk | Quote from publication: "concealment and blinding were not possible in our study design" |
| Incomplete outcome data (attrition bias) Anthropometrics, Fitness | High risk | Comment: 281 lost to follow‐up |
| Selective reporting (reporting bias) | High risk | Comment: different primary outcome reported in trial registry |
| Cluster RCT ‐ Recruitment bias | Low risk | Comment: individual learners were enrolled and baseline data collected before randomisation at the cluster level (of schools) [author communication] |
| Cluster RCT ‐ Baseline imbalance | Low risk | Quote from publication: "no significant differences in primary outcome measures, such as obesity, skin‐folds and cardiorespiratory fitness at baseline were detected, when comparing schools with and without PA intervention" |
| Cluster RCT ‐ Loss of clusters | Low risk | Comment: no clusters lost |
| Cluster RCT ‐ Incorrect analysis | Low risk | Quote from publication: "separate mixed linear regression models were employed with random intercepts for school classes, in order to adjust for cluster effects" |
Ordóñez Dios 2019.
| Study characteristics | ||
| Methods | Study design: cluster‐RCT | |
| Participants |
School inclusion criteria: bilingual public schools School exclusion criteria: — Student inclusion criteria: children aged 11 to 12 years in their last year of primary school Student exclusion criteria: — Setting: school Age group: children Gender distribution: females and males Country where trial was performed: Spain |
|
| Interventions |
Intervention: two 45‐minute sessions of PE per week plus a daily run (starting at 250 m and progressing to 750 m) Comparator: two 45‐minute sessions of PE per week as stipulated by law Duration of intervention: 12 weeks Duration of follow‐up: 12 weeks Number of schools: 2 Theoretical framework: — |
|
| Outcomes | Fitness BMI |
|
| Study registration | — | |
| Publication details |
Language of publication: English/Spanish Funding: non‐commercial funding (research funding body) Publication status: peer‐reviewed journal |
|
| Stated aim for study | "The objective of this study is to examine the possible effects of a daily physical activity intervention on physical fitness, coordination and attention" | |
| Notes | ||
| Risk of bias | ||
| Bias | Authors' judgement | Support for judgement |
| Random sequence generation (selection bias) | Unclear risk | Comment: not described |
| Allocation concealment (selection bias) | Unclear risk | Comment: not described |
| Blinding of participants and personnel (performance bias) All outcomes | Unclear risk | Comment: not described |
| Blinding of outcome assessment (detection bias) All outcomes | Unclear risk | Comment: not described |
| Incomplete outcome data (attrition bias) Anthropometrics, Fitness | Unclear risk | Comment: number of participants enrolled or randomised not described; only number analysed |
| Selective reporting (reporting bias) | Unclear risk | Comment: no protocol published |
| Cluster RCT ‐ Recruitment bias | Unclear risk | Comment: unclear when baseline data were collected |
| Cluster RCT ‐ Baseline imbalance | Unclear risk | Comment: demographic characteristics not compared |
| Cluster RCT ‐ Loss of clusters | Low risk | Comment: no loss of clusters |
| Cluster RCT ‐ Incorrect analysis | High risk | Comment: clustered nature of data not accounted for in analysis |
Seibert 2019.
| Study characteristics | ||
| Methods | Study design: cluster‐RCT | |
| Participants |
School inclusion criteria: 40% or more of students qualifying for free or reduced lunch School exclusion criteria: — Student inclusion criteria: Grades 3 to 8 Student exclusion criteria: — Setting: school Age group: children Gender distribution: females and males Country where trial was performed: USA |
|
| Interventions |
Intervention: implementation of 3 Centre for Disease Control‐recommended evidence‐based strategies: (1) increasing the amount of time spent in MVPA during PE classes, (2) encouraging active classroom breaks, (3) providing organised PA opportunities during recess, and (4) providing organised PA opportunities before and after school Comparator: continued with prior routine PA programming Duration of intervention: 1 school year Duration of follow‐up: 1 school year Number of schools: 49 Theoretical framework: — |
|
| Outcomes | Fitness | |
| Study registration | NCT02411552 (retrospectively registered) | |
| Publication details |
Language of publication: English Funding: University of Wisconsin‐MadisonWisconsin Partnership Program and NIH T32 DK077586 Publication status: peer‐reviewed journal |
|
| Stated aim for study | "In this study we evaluated the feasibility and effects of a large‐scale implementation program for CDC‐recommended school based physical activity strategies on cardiovascular fitness measured by the Progressive Aerobic Cardiovascular Endurance Run in low SES Wisconsin schools" | |
| Notes | ||
| Risk of bias | ||
| Bias | Authors' judgement | Support for judgement |
| Random sequence generation (selection bias) | Unclear risk | Comment: not described |
| Allocation concealment (selection bias) | Unclear risk | Comment: not described |
| Blinding of participants and personnel (performance bias) All outcomes | High risk | Comment: principals and PE educators informed of intervention status |
| Blinding of outcome assessment (detection bias) All outcomes | High risk | Comment: schools completed PACER as part of their regular PE class and submitted data to researchers |
| Incomplete outcome data (attrition bias) Anthropometrics, Fitness | Unclear risk | Comment: not described |
| Selective reporting (reporting bias) | Low risk | Comment: all outcomes listed in clinical trials registry reported |
| Cluster RCT ‐ Recruitment bias | High risk | Comment: data collected after randomisation |
| Cluster RCT ‐ Baseline imbalance | Low risk | Comment: between‐group differences at baseline adjusted for in analysis |
| Cluster RCT ‐ Loss of clusters | Unclear risk | Comment: not described |
| Cluster RCT ‐ Incorrect analysis | Low risk | Quote from publication: "linear mixed effects modelling with school‐specific random effects were conducted to perform the comparisons of outcome measures at baseline between the 2 study arms" |
Seljebotn 2019.
| Study characteristics | ||
| Methods | Study design: cluster‐RCT | |
| Participants |
School inclusion criteria: all primary schools in the municipality of Stavanger, Norway School exclusion criteria: — Student inclusion criteria: Grade 5 ‐ 9 to 10 years old Student exclusion criteria: — Setting: school Age group: children Gender distribution: females and males Country where trial was performed: Norway |
|
| Interventions |
Intervention: physically active lessons (45 minutes) 2 to 3 days/week on days without PE. Lessons were held mainly outdoors and included games, relays, and quizzes with curricular questions from theoretical subjects. Physically active lessons included at least 15 minutes of MVPA, were easily organised and adapted, included competitive and non‐competitive elements, and were enjoyable activities that included all children. Secondary components included physically active homework (10 minutes/d) and physically active recess (10 minutes/d). The intervention was intended to increase the amount of PA by 190 minutes/week, giving a total of 325 minutes/week of PA. To further improve the quality of the physically active lessons, a quality framework was stated at the back of the physically active lesson form and included tips of how differentiation, autonomy, collaboration, enjoyment, and high activity level could be ensured. To assist and support intervention teachers, 1 primary and 1 secondary contact person from the Active School project team was assigned to each intervention school. Contact persons attended meetings and regularly visited participating teachers and classes throughout the school year (1 to 4 visits/month, depending on requests from the schools). 1 pre‐intervention seminar and 1 midway seminar were arranged for the teachers to give information about the programme and to provide support. New physically active lessons were shared between intervention schools through a website Comparator: control schools were asked to continue their normal routine, which included approximately 135 minutes/week of PA Duration of intervention: 10 months Duration of follow‐up: 10 months Number of schools: 9 Theoretical framework: — |
|
| Outcomes | PA duration Sedentary time Fitness BMI |
|
| Study registration | NCT03436355 | |
| Publication details |
Language of publication: English Funding: non‐commercial funding (research funding body) Publication status: peer‐reviewed journal |
|
| Stated aim for study | "Based on current knowledge, the research question of this study is as follows: to what extent will increased PA in school affect children’s executive function and aerobic fitness?" | |
| Notes | ||
| Risk of bias | ||
| Bias | Authors' judgement | Support for judgement |
| Random sequence generation (selection bias) | Low risk | Quote from publication: "the computer program 'Researcher Randomizer' was used to randomise the 2 groups into intervention and control groups" |
| Allocation concealment (selection bias) | Unclear risk | Comment: not stated |
| Blinding of participants and personnel (performance bias) All outcomes | High risk | Comment: participants and study staff were not randomised [author communication] |
| Blinding of outcome assessment (detection bias) All outcomes | High risk | Comment: outcome assessors were not blinded [author communication] |
| Incomplete outcome data (attrition bias) Anthropometrics, Fitness | Low risk | Comment: low loss to follow‐up; unrelated to intervention |
| Incomplete outcome data (attrition bias) Physical activity and sedentary time | Low risk | Comment: low loss to follow‐up; unrelated to intervention |
| Selective reporting (reporting bias) | High risk | Comment: composite measure of executive function reported rather than individual components listed as primary outcomes |
| Cluster RCT ‐ Recruitment bias | High risk | Comment: randomisation before participant enrolment |
| Cluster RCT ‐ Baseline imbalance | Unclear risk | Comment: not stated |
| Cluster RCT ‐ Loss of clusters | Low risk | Comment: no clusters lost |
| Cluster RCT ‐ Incorrect analysis | High risk | Quote from publication: "due to low variance between schools in these outcomes, multilevel analysis was not considered necessary" |
Zhou 2019.
| Study characteristics | ||
| Methods | Study design: cluster‐RCT | |
| Participants |
School inclusion criteria: middles schools from large, medium, and small metropolitan regions in China with similar student enrolment numbers, student‐teacher ratios, and outdoor facilities; having 80 to 100 students of both genders enrolled in seventh grade; located at least 5 kilometres apart from other study schools; agreed to randomisation of treatment; agreed to implement policy and curriculum modifications School exclusion criteria: − Student inclusion criteria: junior high school healthy students; current enrolment, parental consent, and no physical disability Student exclusion criteria: students who cannot exercise; members of varsity sports teams Setting: school Age group: adolescent Gender distribution: females and males Country where trial was performed: China |
|
| Interventions |
Intervention 1: school physical education ‐ minimum of 3 PE classes/week and daily 15‐minute recess, portable exercise equipment, redesign of PE curriculum, recess rhythmic aerobic routine, use of fitness and health handbook for knowledge and skills to be used on inclement weather days, bi‐weekly text messages to students Intervention 2: after school programme ‐ bi‐weekly 45‐minute after school PA programme, portable exercise equipment, use of fitness and health handbook for knowledge and skills to be used on inclement weather days, bi‐weekly text messages to students Intervention 3: school physical education + after school programme Comparator: two 45‐minute PE classes per week Duration of intervention: 32 weeks Duration of follow‐up: ‐ Number of schools: 12 Theoretical framework: socioecological model, competence motivation theory |
|
| Outcomes | PA duration Sedentary time Fitness |
|
| Study registration | ||
| Publication details |
Language of publication: English Funding: serving National Special Needs in Doctoral Talents Development Program—Performance Training and Health Promotion for Adolescents; the support programme for High‐level Teacher Team Development of BeijingMunicipal Institutions (IDHT20170515); Beijing Social Science Funding Project (No. 16YTB018); Scientific Research Project of Beijing Educational Committee (No. KM201710029002) Publication status: peer‐reviewed journal |
|
| Stated aim for study | "The purpose of the 4‐arm study was to examine the incremental effect of adding moderate physical activity and vigorous physical activity on the physical fitness among the children that were assigned to Arm 1‐school physical education intervention, Arm 2‐afterschool program intervention, Arm 3‐school physical education and after school program and Arm 4‐control condition" | |
| Notes | ||
| Risk of bias | ||
| Bias | Authors' judgement | Support for judgement |
| Random sequence generation (selection bias) | Unclear risk | Comment: not described |
| Allocation concealment (selection bias) | Unclear risk | Comment: not described |
| Blinding of participants and personnel (performance bias) All outcomes | High risk | Comment: students and staff not blinded |
| Blinding of outcome assessment (detection bias) All outcomes | Low risk | Comment: data collectors trained and blinded to allocation |
| Incomplete outcome data (attrition bias) Anthropometrics, Fitness | Low risk | Comment: very small quantity of missing data |
| Incomplete outcome data (attrition bias) Physical activity and sedentary time | Unclear risk | Comment: only some participants wore accelerometers; no indication of completion rate |
| Selective reporting (reporting bias) | Low risk | Comment: all relevant outcomes reported |
| Cluster RCT ‐ Recruitment bias | Unclear risk | Comment: not described |
| Cluster RCT ‐ Baseline imbalance | Low risk | Comment: some baseline differences across groups, but adjusted for in analysis |
| Cluster RCT ‐ Loss of clusters | Low risk | Comment: no clusters lost |
| Cluster RCT ‐ Incorrect analysis | High risk | Comment: not all analyses presented; unclear which tests were used |
Adab 2018.
| Study characteristics | ||
| Methods | Study design: cluster‐RCT | |
| Participants |
School inclusion criteria: all state primary schools in the West Midlands (UK), which included school years 1 to 5 (children aged 5 to 10 years) and were within a 35‐mile radius of the University of Birmingham School exclusion criteria: schools with fewer than 17 pupils in the relevant year group (minimum cluster size) or those who were in special measures (status applied by the Office for Standards in Education when it considers that a school fails to supply an acceptable level of education and appears to lack the leadership capacity necessary to secure improvements) Student inclusion criteria: all Year 1 pupils (aged 5 to 6 years) in participating schools Student exclusion criteria: — Setting: school Age group: children Gender distribution: females and males Country where trial was performed: UK |
|
| Interventions |
Intervention: 4 overlapping components
Comparator: continued with ongoing Year 2 health‐related activities plus citizenship education resources, excluding topics related to healthy eating and PA Duration of intervention: 12 months Duration of follow‐up: 15 and 18 months Number of schools: 54 Theoretical framework: — |
|
| Outcomes | PA participation PA duration Sedentary time BMI Health‐related quality of life |
|
| Study registration | ISRCTN97000586 | |
| Publication details |
Language of publication: English Funding: non‐commercial funding (governmental organisation) Publication status: peer‐reviewed journal |
|
| Stated aim for study | "The main aim is to assess the clinical and cost‐effectiveness of the 12‐month childhood obesity prevention intervention programme, developed and refined in the Birmingham healthy Eating and Active lifestyle for CHildren Study, using usual practice in primary schools as the comparator" | |
| Notes | ||
| Risk of bias | ||
| Bias | Authors' judgement | Support for judgement |
| Random sequence generation (selection bias) | Low risk | Quote from publication: "a blocked balancing algorithm was used to randomise participating schools to intervention or comparator arms. Schools were randomly allocated according to a randomisation scheme, which minimized imbalance on several characteristics" |
| Allocation concealment (selection bias) | Low risk | Quote from publication: "to ensure concealment of allocation we carried out randomisation after baseline measurements. Sessional researchers blind to arm allocation mainly undertook further data collection" |
| Blinding of participants and personnel (performance bias) All outcomes | High risk | Comment: participants not blinded |
| Blinding of outcome assessment (detection bias) All outcomes | Low risk | Quote from publication: "researchers blind to arm allocation mainly undertook further data collection" |
| Incomplete outcome data (attrition bias) Anthropometrics, Fitness | Low risk | Comment: most loss to follow‐up due to children changing schools |
| Incomplete outcome data (attrition bias) Physical activity and sedentary time | Low risk | Comment: most loss to follow‐up due to children changing schools |
| Selective reporting (reporting bias) | Low risk | Comment: protocol published; all stated outcomes reported |
| Cluster RCT ‐ Recruitment bias | Low risk | Comment: schools and participants recruited before randomisation |
| Cluster RCT ‐ Baseline imbalance | Low risk | Comment: clusters balanced at baseline |
| Cluster RCT ‐ Loss of clusters | Low risk | Quote from publication: 1 school lost at first follow‐up (N = 20 students) but retained in analysis |
| Cluster RCT ‐ Incorrect analysis | Low risk | Quote from publication: "adjusted model included the baseline measurement and treatment arm as the independent variables, and to account for the clustered nature of the sample, school as the random effect" |
Carlin 2018.
| Study characteristics | ||
| Methods | Study design: cluster‐RCT | |
| Participants |
School inclusion criteria: a convenience sample of schools in Northern Ireland School exclusion criteria: — Student inclusion criteria: all female pupils aged 11 to 13 years attending 6 post‐primary schools in Northern Ireland who were free from any medical condition that would limit their participation in a brisk walking intervention Student exclusion criteria: — Setting: school Age group: children/adolescents Gender distribution: females Country where trial was performed: Northern Ireland |
|
| Interventions |
Intervention: brisk walking intervention consisting of structured 10– to 15‐minute walks spread across the school week before the first bell, at mid‐morning break, and at lunch time. Participants were instructed to attend at least 3 walking sessions/week and to increase the number of sessions that they attended to at least 5 walking sessions/week by Week 12 of the intervention. Walks were led by older pupils trained as walk leaders to ensure safety and intensity (i.e. at a pace sufficient to elicit moderate‐intensity PA). Walk leader training was facilitated by the research team at a lunchtime session and was informed by a PA coordinator from a local Health and Social Care Trust. Training was facilitated by a member of the research team and was delivered to walk leaders at a lunchtime session. Participants were provided with timetables of planned group walks, detailing start time and meeting location for each walk, and were given weekly verbal reminders by school staff and walk leaders to attend the walking sessions. Participants were provided with prompt cards from the research team containing general tips and advice in relation to brisk walking and information on setting goals. Schools were instructed to provide at least 2 walking sessions for participants to attend each day Comparator: continued with normal PA habits. Following completion of the intervention, all control schools were provided study resources to implement their own school‐based brisk walking programme Duration of intervention: 12 weeks Duration of follow‐up: 6 months Number of schools: 6 Theoretical framework: social cognitive theory |
|
| Outcomes | Fitness BMI |
|
| Study registration | NCT02871830 (retrospectively registered) | |
| Publication details |
Language of publication: English Funding: — Publication status: peer‐reviewed journal |
|
| Stated aim for study | "The aim of this pilot study was to investigate the feasibility of peer‐led brisk Walking In ScHools intervention (the WISH study) and to investigate the impact of participating in a 12‐week school‐based walking programme on schooltime PA and sedentary behaviour post‐intervention (week 12) and at follow‐up (6 months). The secondary aim was to examine the effects of the intervention on a range of health‐related outcome measures" | |
| Notes | ||
| Risk of bias | ||
| Bias | Authors' judgement | Support for judgement |
| Random sequence generation (selection bias) | Low risk | Quote from publication: "participants were randomly allocated by school, using a computer‐based random number generator to either receive the intervention or to act as controls" |
| Allocation concealment (selection bias) | Low risk | Comment: randomisation completed after baseline measurement |
| Blinding of participants and personnel (performance bias) All outcomes | High risk | Quote from publication: "blinding of schools and participants was not possible" |
| Blinding of outcome assessment (detection bias) All outcomes | High risk | Quote from publication: "researcher responsible for data collection and analysis was not blinded to group allocation" |
| Incomplete outcome data (attrition bias) Anthropometrics, Fitness | Low risk | Comment: very few missing data due to student absence on measurement day |
| Selective reporting (reporting bias) | High risk | Comment: protocol specifies total weekly PA as the primary outcome; only schooltime PA was reported |
| Cluster RCT ‐ Recruitment bias | Low risk | Comment: schools and students recruited before randomisation |
| Cluster RCT ‐ Baseline imbalance | High risk | Comment: no statistical comparison between groups [author communication] |
| Cluster RCT ‐ Loss of clusters | Low risk | Comment: no clusters lost |
| Cluster RCT ‐ Incorrect analysis | High risk | Comment: clustering not accounted for in analysis |
Harrington 2018.
| Study characteristics | ||
| Methods | Study design: cluster‐RCT | |
| Participants |
School inclusion criteria: all state (government‐funded) secondary schools in Leicester City, Leicestershire, and Rutland, UK, with a Key Stage 3 (students age 11 to 14 years), and state schools that were geographically close to Leicester City, Leicestershire, and Rutland but in neighbouring counties School exclusion criteria: — Student inclusion criteria: girls between the ages of 11 and 14 years and in Years 7, 8, and 9 Student exclusion criteria: — Setting: school Age group: children/adolescents Gender distribution: females Country where trial was performed: UK |
|
| Interventions |
Intervention: Girls Active, a support framework for schools to review and change their PA, PE, and school sport culture and practices with support of the Youth Sport Trust and a hub school to develop a school action plan. Core components include submission of self‐review and action plans; attendance of lead teacher at initial training; use of package of resources or use of an alternative; engagement of young people as peer leaders; use of online, in‐person, or phone support of hub and/or development coach; lead teacher attendance at peer review day; and submission of mission analysis. Schools were provided with two £500 capacity funding instalments to coincide with action plan submission Comparator: schools were not given any specific guidance or advice and were assumed to carry on with their usual practice of PE and sport provision Duration of intervention: 14 months Duration of follow‐up: 14 months Number of schools: 20 Theoretical framework: social cognitive theory |
|
| Outcomes | PA participation PA duration Sedentary time BMI Health‐related quality of life |
|
| Study registration | ISRCTN10688342 | |
| Publication details |
Language of publication: English Funding: non‐commercial funding (research funding body) Publication status: peer‐reviewed journal |
|
| Stated aim for study | "The aim of this study was to assess the effectiveness of the Girls Active PA programme in UK secondary schools" | |
| Notes | ||
| Risk of bias | ||
| Bias | Authors' judgement | Support for judgement |
| Random sequence generation (selection bias) | High risk | Quote from publication: "sequentially numbered sections within a folder were used to implement the group allocations" |
| Allocation concealment (selection bias) | Low risk | Quote from publication: "following baseline measurements, schools were randomised by an independent statistician. The investigator team were not aware of the sequence until after randomisation" |
| Blinding of participants and personnel (performance bias) All outcomes | High risk | Quote from publication: "the trial statistician was not blinded" |
| Blinding of outcome assessment (detection bias) All outcomes | Low risk | Quote from publication: "measurement team members, except the team lead for the day, were blinded to group randomisation" |
| Incomplete outcome data (attrition bias) Anthropometrics, Fitness | High risk |
Comment: only per protocol utilised; large missing data from control schools Quote from publication: "the per protocol population included schools that engaged with 70% of the seven core components (as detailed above) of the programme over the 14 months and had complete data for the analysis concerned on ‘by analysis’ basis. In the control arm, the per protocol population included all schools/pupils randomised to that arm" |
| Incomplete outcome data (attrition bias) Physical activity and sedentary time | High risk |
Comment: only per protocol utilised; large missing data from control schools Quote from publication: "the per protocol population included schools that engaged with 70% of the seven core components (as detailed above) of the programme over the 14 months and had complete data for the analysis concerned on ‘by analysis’ basis. In the control arm, the per protocol population included all schools/pupils randomised to that arm" |
| Selective reporting (reporting bias) | Low risk | Comment: all outcomes in trial registry reported |
| Cluster RCT ‐ Recruitment bias | Low risk | Quote from publication: "randomisation will occur after baseline assessments and will be carried out by the Leicester Clinical Trials Unit" |
| Cluster RCT ‐ Baseline imbalance | Low risk |
Comment: baseline differences at cluster level accounted for Quote from publication: "generalized estimating equations, accounting for school level clustering, and adjusting for baseline MVPA, stratification factors of school size (< 850, ≥ 850) and percent of non‐White pupils (< 20%, ≥ 20%), percent free school meals and participant year group, were employed" |
| Cluster RCT ‐ Loss of clusters | High risk | Comment: 2 control schools lost to follow‐up |
| Cluster RCT ‐ Incorrect analysis | Low risk | Quote from publication: "generalized estimating equations, accounting for school level clustering, and adjusting for baseline MVPA, stratification factors of school size (< 850, ≥ 850) and percent of non‐White pupils (< 20%, ≥ 20%), percent free school meals and participant year group, were employed" |
Have 2018.
| Study characteristics | ||
| Methods | Study design: cluster‐RCT | |
| Participants |
School inclusion criteria: schools in Danish municipalities that did not have a structured programme that incorporated PA in the classroom School exclusion criteria: — Student inclusion criteria: — Student exclusion criteria: physical disability, no written parental consent Setting: school Age group: children Gender distribution: females and males Country where trial was performed: Denmark |
|
| Interventions |
Intervention: classroom‐based PA incorporated into math lessons for 1 school year. Subjects received an average of 6 math lessons of 45 minutes/week. Each lesson included at least 15 minutes of PA, with limited sedentary time. Teachers attended a series of workshops to provide them with the skills to implement task‐relevant physical activity into math teaching Comparator: children in control schools received regular classroom instruction, also with an average of 6 math lessons of 45 minutes/week. Math teachers in the control schools were asked not to make any changes to their usual teaching methods before study endpoint measurements Duration of intervention: 10 months Duration of follow‐up: 10 months Number of schools: 12 Theoretical framework: theory of embodied cognition |
|
| Outcomes | PA duration BMI |
|
| Study registration | NCT02488460 (retrospectively registered) | |
| Publication details |
Language of publication: English Funding: non‐commercial funding (charitable trust) Publication status: peer‐reviewed journal |
|
| Stated aim for study | "We designed a randomised controlled trial with the primary objective of investigating how math achievement was affected by task‐relevant PA incorporated into math teaching for 7‐year‐old school children" | |
| Notes | ||
| Risk of bias | ||
| Bias | Authors' judgement | Support for judgement |
| Random sequence generation (selection bias) | Low risk | Quote from publication: "randomisation was performed by random selection of sealed envelopes containing the intervention allocation stratified by municipality, in the presence of school leaders, municipality representatives and study researchers" |
| Allocation concealment (selection bias) | Low risk | Quote from publication: "randomisation was performed by random selection of sealed envelopes containing the intervention allocation stratified by municipality, in the presence of school leaders, municipality representatives and study researchers" |
| Blinding of participants and personnel (performance bias) All outcomes | High risk | Comment: not possible |
| Blinding of outcome assessment (detection bias) All outcomes | Low risk | Quote from publication: "the research assistants were blinded to the randomisation result for measurement of the outcomes and for data entry" |
| Incomplete outcome data (attrition bias) Anthropometrics, Fitness | Low risk | Quote from publication: "during the 9‐month intervention period, the dropout rate was 13.7% in the control group and 8.8% in the intervention group, which was not statistically significant. Dropouts were mainly attributed to subjects not present at follow‐up trials due to sickness or moving to a different city as well as subjects not being able to complete the test due to injury (e.g. the fitness test)" |
| Incomplete outcome data (attrition bias) Physical activity and sedentary time | Low risk | Quote from publication: "during the 9‐month intervention period, the dropout rate was 13.7% in the control group and 8.8% in the intervention group, which was not statistically significant. Dropouts were mainly attributed to subjects not present at follow‐up trials due to sickness or moving to a different city as well as subjects not being able to complete the test due to injury (e.g. the fitness test)" |
| Selective reporting (reporting bias) | Low risk | Comment: all main outcomes reported |
| Cluster RCT ‐ Recruitment bias | Low risk | Comment: all baseline data were measured prior to randomisation [author communication] |
| Cluster RCT ‐ Baseline imbalance | Low risk | Quote from publication: "there were no significant differences at baseline between intervention and control group in any descriptive characteristics except height" |
| Cluster RCT ‐ Loss of clusters | Low risk | Comment: no clusters lost |
| Cluster RCT ‐ Incorrect analysis | Low risk | Quote from publication: "because of the clustered nature of the data, schools were included as random effects in the analyses and the Kenward‐Roger degrees of freedom approximation was used" |
Pablos 2018.
| Study characteristics | ||
| Methods | Study design: cluster‐RCT | |
| Participants |
School inclusion criteria: public (government‐funded) schools in urban areas School exclusion criteria: — Student inclusion criteria: in Grade 5 or 6 and not enrolled in any other research study Student exclusion criteria: — Setting: school, urban Age group: children Gender distribution: females and males Country where trial was performed: Spain |
|
| Interventions |
Intervention: Healthy Habits Program included free lunchtime extracurricular activities 2 times/week beginning with a brief 10‐minute talk about healthy habits (diet, PA, sleep, and hygiene) followed by a PE session consisting of a 15‐minute warm‐up, a 40‐minute main section (theme games for the first 22 sessions and modified sports for remaining sessions), and a 10‐minute calming down section involving another theme game led by a trained teacher. Total PA was 150 minutes/week, with intensity and duration increasing gradually throughout the intervention. Students also received a take‐home worksheet to reinforce session topics to be signed by parents or guardians. The programme was accompanied by three 45‐minute talks for parents and teachers about health habits for children Comparator: continued with daily activities without participating in the Healthy Habits Program Duration of intervention: 8 months Duration of follow‐up: 8 months Number of schools: 4 Theoretical framework: — |
|
| Outcomes | Fitness BMI |
|
| Study registration | — | |
| Publication details |
Language of publication: English Funding: non‐commercial funding (research funding body) Publication status: peer‐reviewed journal |
|
| Stated aim for study | "Its purpose is to bring health and education together within the school setting, with the involvement of the family, to achieve healthy lifestyle habits in the short and long term" | |
| Notes | ||
| Risk of bias | ||
| Bias | Authors' judgement | Support for judgement |
| Random sequence generation (selection bias) | Low risk | Quote from publication: "each school was designated as a control or intervention group using 4 opaque envelopes containing the assigned treatment, which was handled by someone who was not involved in the study" |
| Allocation concealment (selection bias) | Low risk | Quote from publication: "each school was designated as a control or intervention group using 4 opaque envelopes containing the assigned treatment, which was handled by someone who was not involved in the study" |
| Blinding of participants and personnel (performance bias) All outcomes | Low risk | Comment: participants were not blinded [author communication] |
| Blinding of outcome assessment (detection bias) All outcomes | Low risk | Comment: outcome assessors blinded [author communication] |
| Incomplete outcome data (attrition bias) Anthropometrics, Fitness | Low risk | Quote from publication: "30 children were excluded because of missing administrative data or absence from school when the measurements were taken. Complete data were collected for 158 of the 190 children" |
| Selective reporting (reporting bias) | Unclear risk | Comment: no protocol published or trial registry; cannot determine |
| Cluster RCT ‐ Recruitment bias | High risk | Comment: randomisation prior to student enrolment [author communication] |
| Cluster RCT ‐ Baseline imbalance | Low risk | Comment: BMI used to balance groups statistically at baseline [author communication] |
| Cluster RCT ‐ Loss of clusters | Low risk | Comment: no clusters lost |
| Cluster RCT ‐ Incorrect analysis | High risk | Comment: clustering not accounted for in analysis |
Robbins 2018.
| Study characteristics | ||
| Methods | Study design: cluster‐RCT | |
| Participants |
School inclusion criteria: located in urban community setting; enrolment greater than 100 girls in each school or more than double the number of girls needed for the study site (N = 50/school) in any combination of Grades 5, 6, 7, and/or 8; student body comprising at least 50% minority versus non‐minority race or ethnicity and including a similar percentage enrolled in the free and reduced lunch programme School exclusion criteria: administrators not interested in participating, did not agree to random assignment, could not guarantee their availability at post‐intervention follow‐up Student inclusion criteria: girls in Grades 5 through 7 (ages 10 to 14; 8th graders if needed in schools having only Grades 7 and 8); available and willing to participate in the PA club 3 days/week for 17 weeks; available for follow‐up (9 months after intervention ends); agree to school random assignment; able to read, understand, and speak English Student exclusion criteria: involved in or planning to be involved in school or community sports or other organised PAs, such as dance lessons, that involve MVPA and require participation 3 or more days/week after school; a health condition precluding safe MVPA Setting: school, urban Age group: children/adolescents Gender distribution: females Country where trial was performed: USA |
|
| Interventions |
Intervention
Comparator: students did not receive any after‐school programming other than the programming currently offered by the school and community Duration of intervention: 17 weeks Duration of follow‐up: 13 months Number of schools: 8 Theoretical framework: health promotion model and self‐determination theory |
|
| Outcomes | PA duration Fitness BMI |
|
| Study registration | NCT01503333 (retrospectively registered) | |
| Publication details |
Language of publication: English Funding: non‐commercial funding (governmental organisation) Publication status: peer‐reviewed journal |
|
| Stated aim for study | "The primary aim was to evaluate the effect of a Girls on the Move school‐based intervention on minutes of MVPA among fifth‐ to eighth‐grade girls" | |
| Notes | ||
| Risk of bias | ||
| Bias | Authors' judgement | Support for judgement |
| Random sequence generation (selection bias) | Low risk | Comment: a statistician used a computer programme to randomly assign the 2 schools in each pair to receive either intervention or control [author communication] |
| Allocation concealment (selection bias) | Low risk | Comment: schools were registered, paired, and randomised by an independent statistician [author communication] |
| Blinding of participants and personnel (performance bias) All outcomes | Low risk | Quote from publication: "girls, parents or guardians, principals, nurses, and school staff are not told about hypotheses" |
| Blinding of outcome assessment (detection bias) All outcomes | Low risk | Quote from publication: "the measurement and intervention teams function independently so as to blind members of the former group to each school’s randomisation status throughout the entire study" |
| Incomplete outcome data (attrition bias) Anthropometrics, Fitness | Low risk | Quote from publication: "we determined data to be missing at random, and multiple imputation was employed. Based on recommendations and the complexity of the process, 20 imputations were conducted at the individual level" |
| Incomplete outcome data (attrition bias) Physical activity and sedentary time | Low risk | Quote from publication: "we determined data to be missing at random, and multiple imputation was employed. Based on recommendations and the complexity of the process, 20 imputations were conducted at the individual level" |
| Selective reporting (reporting bias) | Low risk | Comment: outcomes listed in protocol appear to have been reported on |
| Cluster RCT ‐ Recruitment bias | High risk | Quote from publication: "prior to the start of the school year, the PI and project manager inform each principal regarding the randomisation status of his or her respective school to assist each principal with future planning. Principals are told that the randomisation information must remain confidential until completion of baseline data collection in the fall" |
| Cluster RCT ‐ Baseline imbalance | Low risk | Quote from publication: "both groups of girls (N = 1519) were similar for most baseline characteristics. However, the control group had a higher proportion of Black girls (P = .001) and higher BMI (P = .035) than the intervention group. The intervention group had a higher proportion of healthy weight girls, but a lower proportion of obese girls than the control group (P = .046)" |
| Cluster RCT ‐ Loss of clusters | Low risk | Comment: no clusters lost [author communication] |
| Cluster RCT ‐ Incorrect analysis | Low risk | Quote from publication: "models included the group variable, cluster random effect of school, and the following fixed effects: age, BMI z‐score, race, socioeconomic status, ethnicity, pubertal stage, and study year" |
Siegrist 2018.
| Study characteristics | ||
| Methods | Study design: cluster‐RCT | |
| Participants |
School inclusion criteria: all secondary schools in the greater district of a city in Southern Germany that were willing to take part over 4 years and to be randomised to an intervention school with a lifestyle intervention programme or a control school School exclusion criteria: outside of the study area (distance > 30 km) Student inclusion criteria: Grade 5, parental consent Student exclusion criteria: — Setting: school Age group: children Gender distribution: females and males Country where trial was performed: Germany |
|
| Interventions |
Intervention: school prevention programme aimed at increasing PA inside and outside of school through regular exercise in sports lessons and additional PA in school (active breaks during lessons, active school breaks). Weekly lifestyle lessons were taught by school teachers and were reinforced by worksheets, homework, and practical instructions. The programme also intended to improve eating patterns and other health behaviours (reduction in media use and inactivity). Teachers took part in 4 to 6 annual training sessions. Parents received regular newsletters and were invited to a parental training programme 2 to 3 times per year, which included coaching parents to lead a more active lifestyle and providing nutritional counselling regarding family dinners. Comparator: control schools were asked to continue their usual activities Duration of intervention: 18 months Duration of follow‐up: 18 months Number of schools: 15 Theoretical framework: social cognitive theory |
|
| Outcomes | BMI | |
| Study registration | NCT00988754 (retrospectively registered) | |
| Publication details |
Language of publication: English Funding: non‐commercial funding (governmental organisation) Publication status: peer‐reviewed journal |
|
| Stated aim for study | "we implemented a comprehensive cluster‐randomised school‐ and family based lifestyle‐intervention trial in secondary schools with aim to improve PA, physical fitness and cardio metabolic risk factors in children" | |
| Notes | ||
| Risk of bias | ||
| Bias | Authors' judgement | Support for judgement |
| Random sequence generation (selection bias) | Low risk | Quote from publication: "randomisation of schools was conducted by sealed envelopes (1:1) in 8 intervention and 7 control schools" |
| Allocation concealment (selection bias) | Low risk | Quote from publication: "randomisation of schools was conducted by sealed envelopes (1:1) in 8 intervention and 7 control schools" |
| Blinding of participants and personnel (performance bias) All outcomes | High risk | Quote from publication: "a limitation of our study is that the main coordinator of the study was not blinded to the group assignments of the schools" |
| Blinding of outcome assessment (detection bias) All outcomes | Low risk | Quote from publication: "we tried to eliminate this bias by blinding medical examiners who were not aware of the group allocation of the participating children" |
| Incomplete outcome data (attrition bias) Anthropometrics, Fitness | Low risk | Comment: most loss to follow‐up due to moving schools |
| Selective reporting (reporting bias) | High risk | Comment: quality of life and anthropometry not reported |
| Cluster RCT ‐ Recruitment bias | High risk | Comment: randomisation at school level before enrolment of students |
| Cluster RCT ‐ Baseline imbalance | Low risk | Comment: models adjusted for key baseline differences [author communication] |
| Cluster RCT ‐ Loss of clusters | Low risk | Comment: no clusters lost |
| Cluster RCT ‐ Incorrect analysis | Low risk | Quote from publication: "data were aggregated per cluster to account for the cluster‐randomised design in the statistical analysis" |
Ten Hoor 2018.
| Study characteristics | ||
| Methods | Study design: cluster‐RCT | |
| Participants |
School inclusion criteria: Dutch secondary schools School exclusion criteria: — Student inclusion criteria: — Student exclusion criteria: — Setting: school Age group: children/adolescents Gender distribution: females and males Country where trial was performed: The Netherlands |
|
| Interventions |
Intervention: strength training exercises during at least 30% of regular PE lessons, ~ 5 to 30 minutes/lesson. Teachers were instructed about the programme and specific strength exercises and safety guidelines, participated in workshops to improve their motivational speaking skills, were provided with materials (medicine balls, elastic bands, and free weights), and received a book with strength exercises and games. Once a month, a 1‐hour lesson based on motivational interviewing and facilitated by a trained mentor or PE teacher was used to increase motivation to be more physically active Comparator: continued with usual curriculum Duration of intervention: 1 year Duration of follow‐up: 1 year Number of schools: 9 Theoretical framework: theory of planned behaviour or reasoned action approach, self‐determination theory, social comparison theory, intervention mapping |
|
| Outcomes | PA duration Sedentary time |
|
| Study registration | NTR5676 | |
| Publication details |
Language of publication: English Funding: non‐commercial funding (research funding body) Publication status: peer‐reviewed journal |
|
| Stated aim for study | "In this cluster RCT, we investigated the 1‐year efficacy of incorporating strength exercises into gym classes, in combination with monthly motivational lessons (to engage in PAs after school) on the body composition and activity level of adolescents" | |
| Notes | ||
| Risk of bias | ||
| Bias | Authors' judgement | Support for judgement |
| Random sequence generation (selection bias) | Low risk | Quote from publication: "randomised (stratified on education level; by flip of a coin by the first author under supervision of the fourth author) into an intervention condition (4 schools) or a standard curriculum control condition (5 schools)" |
| Allocation concealment (selection bias) | Low risk | Comment: allocation concealed from schools or directors; informed that they may or may not receive the intervention immediately [author communication] |
| Blinding of participants and personnel (performance bias) All outcomes | High risk | Comment: not possible [author communication] |
| Blinding of outcome assessment (detection bias) All outcomes | High risk | Comment: not possible [author communication] |
| Incomplete outcome data (attrition bias) Physical activity and sedentary time | High risk | Comment: 26% to 28% loss to follow‐up |
| Selective reporting (reporting bias) | High risk | Comment: strengths listed in clinical trials registry but not reported |
| Cluster RCT ‐ Recruitment bias | High risk | Comment: students were enrolled and baseline data collected after school randomisation [author communication] |
| Cluster RCT ‐ Baseline imbalance | Low risk | Quote from publication: "no baseline differences were found between the 2 conditions in age, height, weight, BMI (Z‐score), body composition, or PA outcomes (including wear time of the accelerometer)" |
| Cluster RCT ‐ Loss of clusters | Low risk | Comment: no loss of clusters |
| Cluster RCT ‐ Incorrect analysis | Low risk | Quote from publication: "the random (variance) model part consisted of an unstructured covariance matrix for the within‐school variances and covariance of the 2 repeated measures plus a random intercept for the between‐school outcome variance" |
Donnelly 2017.
| Study characteristics | ||
| Methods | Study design: cluster‐RCT | |
| Participants |
School inclusion criteria: elementary schools within a 25‐mile radius of Lawrence, Kansas, including Grades 2 through 5, with at least 40 students in Grades 2 and 3, not participating in other classroom‐based PA interventions, and agreeing to be randomised School exclusion criteria: — Student inclusion criteria: a random sample of Grade 2 and 3 students in each school from those who provided parental consent or child assent Student exclusion criteria: students with physical or intellectual disabilities or learning disorders were part of the intervention or control group as a function of attending the school; however, some were ineligible to complete the outcome assessment due to their disability (i.e. blind, severe intellectual disability, etc.) Setting: school Age group: children Gender distribution: females and males Country where trial was performed: USA |
|
| Interventions |
Intervention: teacher‐delivered 10‐minute Academic Achievement and Physical Activity Across the Curriculum lessons twice per day (1 morning and 1 afternoon) 5 days/week plus 60 minutes of PE to total 160 minutes/week of MVPA Comparator: teachers were asked to continue to use traditional classroom instruction and to continue with their typical PE schedule (2‐ to 30‐minute classes/week) Duration of intervention: 3 years Duration of follow‐up: — Number of schools: 17 Theoretical framework: — |
|
| Outcomes | BMI Fitness |
|
| Study registration | NCT01699295 (retrospectively registered) | |
| Publication details |
Language of publication: English Funding: non‐commercial funding (research funding body) Publication status: peer‐reviewed journal |
|
| Stated aim for study | "The primary aim of this study is to assess differences in academic achievement in students who receive physically active lessons and students in control schools who receive regular academic lessons. Secondary aims include determining potential mediators of any association between Academic Achievement and Physical Activity Across the Curriculum and academic achievement, including changes in cognitive function, cardiovascular fitness, daily PA, BMI and attention‐to‐task. An extensive process analysis will also be performed to document the fidelity of the intervention" | |
| Notes | ||
| Risk of bias | ||
| Bias | Authors' judgement | Support for judgement |
| Random sequence generation (selection bias) | Low risk | Quote from publication: "computer randomised by study statistician" |
| Allocation concealment (selection bias) | Unclear risk | Comment: not described |
| Blinding of participants and personnel (performance bias) All outcomes | High risk | Comment: students and teachers not blinded |
| Blinding of outcome assessment (detection bias) All outcomes | Low risk | Quote from publication: "staff completing assessments, other than those obtained in the classroom, and staff performing data entry, were blinded to condition" |
| Incomplete outcome data (attrition bias) Anthropometrics, Fitness | High risk | Comment: large loss to follow‐up; no imputation for secondary outcomes |
| Selective reporting (reporting bias) | High risk | Comment: PA not reported |
| Cluster RCT ‐ Recruitment bias | High risk | Comment: students recruited after randomisation |
| Cluster RCT ‐ Baseline imbalance | High risk | Comment: baseline differences not controlled for |
| Cluster RCT ‐ Loss of clusters | High risk | Comment: loss of clusters from both groups |
| Cluster RCT ‐ Incorrect analysis | Low risk | Comment: clustering accounted for in analysis |
Farmer 2017.
| Study characteristics | ||
| Methods | Study design: cluster‐RCT | |
| Participants |
School inclusion criteria: state primary schools (Years 1 to 8 that are fully funded by the state and are co‐educational) with at least 150 pupils and a school decile ranking of 1 to 6 School exclusion criteria: — Student inclusion criteria: children in school years 2 and 4 Student exclusion criteria: no exclusion criteria Setting: school Age group: children Gender distribution: females and males Country where trial was performed: New Zealand |
|
| Interventions |
Intervention: researchers, play worker, and school community worked together and received funding over the course of 1 year to develop a playground action plan tailored for each intervention school (e.g. addition of more interactive play equipment, alterations to school rules and policies). The majority of recommendations involved no to little cost, such as leaving trees that had been cut down in pieces or letting the grass grow long to encourage imaginative play, re‐purposing real estate signs for sledding down hills, purchasing raincoats and gumboots to allow outside play when wet, and using plastic piping and sand for water play Comparator: asked not to change anything in school play spaces Duration of intervention: 2 years Duration of follow‐up: 2 years Number of schools: 16 Theoretical framework: — |
|
| Outcomes | PA duration BMI |
|
| Study registration | ACTRN12612000675820 (retrospectively registered) | |
| Publication details |
Language of publication: English Funding: non‐commercial funding (research funding body) Publication status: peer‐reviewed journal |
|
| Stated aim for study | "The aim of our 2‐year cluster RCT (PLAY) was to determine whether providing greater opportunities for risk and challenge in primary schools increased PA and reduced relative body weight over the long term. A secondary aim considered the effect of the intervention on how children interacted with 1 another which forms the basis of a separate paper" | |
| Notes | ||
| Risk of bias | ||
| Bias | Authors' judgement | Support for judgement |
| Random sequence generation (selection bias) | Low risk | Quote from publication: "pairs of schools were created by matching for region, school roll and decile ranking, and were randomly assigned to intervention or control by tossing a coin" |
| Allocation concealment (selection bias) | Low risk | Comment: coin toss used |
| Blinding of participants and personnel (performance bias) All outcomes | High risk | Comment: participants not blinded |
| Blinding of outcome assessment (detection bias) All outcomes | Low risk | Quote from publication: "measurements were obtained … by researchers blinded to group allocation" |
| Incomplete outcome data (attrition bias) Anthropometrics, Fitness | Low risk | Quote from publication: "the missing data were imputed using chained equations assuming that the data were missing at random" |
| Incomplete outcome data (attrition bias) Physical activity and sedentary time | Low risk | Quote from publication: "the missing data were imputed using chained equations assuming that the data were missing at random" |
| Selective reporting (reporting bias) | High risk | Comment: bullying, steps/d, nutrition not reported |
| Cluster RCT ‐ Recruitment bias | High risk | Comment: students enrolled after randomisation |
| Cluster RCT ‐ Baseline imbalance | Low risk | Comment: clusters similar; models adjusted |
| Cluster RCT ‐ Loss of clusters | Low risk | Comment: no loss of clusters |
| Cluster RCT ‐ Incorrect analysis | Low risk | Comment: clustering accounted for in analysis |
Sutherland 2017.
| Study characteristics | ||
| Methods | Study design: cluster‐RCT | |
| Participants |
School inclusion criteria: government or Catholic elementary schools; located within Hunter New England Local Health District; socioeconomic score ≤ 5 (lower 50% of New South Wales) based on school post code; not participating in other PA studies School exclusion criteria: — Student inclusion criteria: Grades 3 to 6 Student exclusion criteria: major physical or intellectual conditions impeding engagement in PA Setting: school Age group: children Gender distribution: females and males Country/Countries where trial was performed: Australia |
|
| Interventions |
Intervention: a modified version of the Supporting Children’s Outcomes using Rewards, Exercise and Skills programme consisting of school committees and policy review, quality PE lessons, recess and lunchtime activity via student leadership, provision of equipment, and linkage with parents and community sporting organisations Comparator: measurement components of the trial only; school PA practices according to curriculum Duration of intervention: 6 months Duration of follow‐up: 6 months Number of schools: 46 Theoretical framework: social‐ecological theory and health promoting schools framework |
|
| Outcomes | PA duration | |
| Study registration | ACTRN12615000437561 (retrospectively registered) | |
| Publication details |
Language of publication: English Funding: non‐commercial funding (research funding body) Publication status: peer‐reviewed journal |
|
| Stated aim for study | "The primary aim of this paper is to report the effectiveness of an adapted version of an evidence based school PA program known as Supporting Children’s Outcomes using Rewards, Exercise and Skills on children’s MVPA. Secondary trial outcomes describe the impact on school implementation of practices including PE teaching quality and school PA practices" | |
| Notes | ||
| Risk of bias | ||
| Bias | Authors' judgement | Support for judgement |
| Random sequence generation (selection bias) | Low risk | Quote from publication: "schools underwent stratified randomisation based on SES, allocated in a 1:1 ratio to intervention or control by an independent statistician using computerized random number function in Microsoft Excel" |
| Allocation concealment (selection bias) | High risk | Comment: random allocation of schools to group occurred post recruitment but before data collection |
| Blinding of participants and personnel (performance bias) All outcomes | Low risk | Comment: personnel delivering intervention blinded; primary outcome assessment concealed from participants, so lack of blinding of participants unlikely to affect outcome |
| Blinding of outcome assessment (detection bias) All outcomes | Low risk | Comment: outcome assessors blinded |
| Incomplete outcome data (attrition bias) Physical activity and sedentary time | Unclear risk | Comment: no mention of missing data at end of study |
| Selective reporting (reporting bias) | Low risk | Comment: trial protocol referenced |
| Cluster RCT ‐ Recruitment bias | Low risk | Comment: participants recruited before cluster randomisation |
| Cluster RCT ‐ Baseline imbalance | Unclear risk | Comment: no analysis of clusters for similarity |
| Cluster RCT ‐ Loss of clusters | High risk | Comment: 1 cluster lost after randomisation; no reason given |
| Cluster RCT ‐ Incorrect analysis | Low risk | Comment: statistical analysis accounted for clustering |
Torbeyns 2017.
| Study characteristics | ||
| Methods | Study design: RCT | |
| Participants |
Student inclusion criteria: Grades 3 and 4 of high school in Ninove, Belgium Student exclusion criteria: — Setting: school Age group: adolescents Gender distribution: females and males Country/Countries where trial was performed: Belgium |
|
| Interventions |
Intervention: students were instructed to cycle on a height‐adjustable cycling desk (LifeSpan C3‐DT5 Bike Desk) for 4 class hours/week (4 × 50 min). Participants were free to adjust the cycling intensity to their preference. All participants were asked to not change their lifestyle during the study (e.g. PA levels outside the classroom) Comparator: asked to not change their lifestyle during the study (e.g. PA levels outside the classroom) Duration of intervention: 22 weeks Duration of follow‐up: 22 weeks Number of schools: 1 Theoretical framework: — |
|
| Outcomes | Fitness BMI |
|
| Study registration | — | |
| Publication details |
Language of publication: English Funding: other funding (no sources of funding received) Publication status: peer‐reviewed journal |
|
| Stated aim for study | "Thus, the purpose of this study was to examine the impact of providing cycling desks in a classroom for 5 months on energy expenditure, physical health parameters, cognitive performance, brain functioning and educational measures in an adolescent population" | |
| Notes | ||
| Risk of bias | ||
| Bias | Authors' judgement | Support for judgement |
| Random sequence generation (selection bias) | Unclear risk | Comment: not stated |
| Allocation concealment (selection bias) | Unclear risk | Comment: not stated |
| Blinding of participants and personnel (performance bias) All outcomes | High risk | Comment: participants not blinded |
| Blinding of outcome assessment (detection bias) All outcomes | Unclear risk | Comment: not stated |
| Incomplete outcome data (attrition bias) Anthropometrics, Fitness | High risk | Quote from publication: "7 more participants (4 intervention, 3 control) were excluded because they were absent for more than 1 week during the intervention period" |
| Selective reporting (reporting bias) | Unclear risk | Comment: no protocol referenced |
Daly 2016.
| Study characteristics | ||
| Methods | Study design: cluster‐RCT | |
| Participants |
School inclusion criteria: suburb primary schools in Canberra, where the average household income approximates the mean for Australian city dwellers School exclusion criteria: — Student inclusion criteria: all Grade 2 children in good health, able to participate freely in PE, willing to undertake a series of venous blood collections Student exclusion criteria: — Setting: school Age group: children/adolescents Gender distribution: females and males Country/Countries where trial was performed: Australia |
|
| Interventions |
Intervention: specialist PE teacher to replace general classroom teacher programme. An all‐inclusive, enjoyable, challenging yet non‐threatening environment for PA that encouraged students to discover answers to a range of physical movement problems and game strategies themselves, through experimentation and self‐discovery. Lesson plans included game play, fitness activities, skill practice, and core movements Comparator: continued with usual PE programme (traditional fitness and stretching exercise, including running and walking around the oval) conducted by the generalist classroom teachers, none of whom were formally trained in PE. Teachers rarely participated in activities Duration of intervention: 4 years Duration of follow‐up: 4 years Number of schools: 29 Theoretical framework: — |
|
| Outcomes | PA duration Sedentary time |
|
| Study registration | ACTRN12612000027819 | |
| Publication details |
Language of publication: English Funding: other funding (charitable trust) Publication status: peer‐reviewed journal |
|
| Stated aim for study | "The primary aim of the Lifestyle of Our Kids project is to investigate relationships of (a) PA in general, and (b) an externally provided specialist PE program in schools, with physiological and psychological health and development in young children. This study is intended to provide a range of integrated scientific evidence upon which conclusions may be drawn in regard to optimising childhood health and development" | |
| Notes | ||
| Risk of bias | ||
| Bias | Authors' judgement | Support for judgement |
| Random sequence generation (selection bias) | Low risk | Quote from publication: "after acceptance, the allocation of schools to the intervention or control groups was determined randomly, 2 members of the research team drawing from a shuffled set of 29 envelopes, each of which contained a school name" |
| Allocation concealment (selection bias) | Low risk | Comment: allocation concealed until after enrolment |
| Blinding of participants and personnel (performance bias) All outcomes | High risk | Comment: participants not blinded |
| Blinding of outcome assessment (detection bias) All outcomes | High risk | Comment: research staff blinded to group only for some measures |
| Incomplete outcome data (attrition bias) Physical activity and sedentary time | Low risk | Comment: large loss to follow‐up but unrelated to intervention (i.e. relocation) |
| Selective reporting (reporting bias) | High risk | Comment: academic performance and hand‐eye coordination not reported |
| Cluster RCT ‐ Recruitment bias | Low risk | Comment: students enrolled after randomisation |
| Cluster RCT ‐ Baseline imbalance | Low risk | Comment: no baseline imbalance |
| Cluster RCT ‐ Loss of clusters | Low risk | Comment: no clusters lost |
| Cluster RCT ‐ Incorrect analysis | Low risk | Quote from publication: "school, year, and subject were included in the model as random effects to account for the sample design and hence possible dependence structure in the data" |
de Greeff 2016.
| Study characteristics | ||
| Methods | Study design: cluster‐RCT | |
| Participants |
School inclusion criteria: primary schools in the Northern part of The Netherlands School exclusion criteria: — Student inclusion criteria: Grade 2 or 3; all children from that class participated in the intervention programme Student exclusion criteria: — Setting: school Age group: children Gender distribution: females and males Country/Countries where trial was performed: The Netherlands |
|
| Interventions |
Intervention: physically active mathematics and language lessons that were taught in the classroom. During each lesson, the children stood behind or beside their school desk. In each lesson, 10 to 15 minutes was spent on mathematics and 10 to 15 minutes on language. Physical exercises were relatively easy to perform and were aimed at exercising at moderate to vigorous intensity level. During the lessons, all children performed basic exercises and specific exercises simultaneously. Specific exercises were performed when children solved an academic task. For example, the word ‘dog’ must be spelled by jumping in place for every mentioned letter, or children had to jump 6 times to solve the multiplication ‘2 × 3’. Basic exercises (marching, jogging, or hopping in place) were performed during the remaining part of the lesson (e.g. when children were thinking about a sum) Comparator: — Duration of intervention: 2 × 22 weeks Duration of follow‐up: 3 years Number of schools: 12 Theoretical framework: — |
|
| Outcomes | Fitness BMI |
|
| Study registration | ISRCTN17021806 | |
| Publication details |
Language of publication: English Funding: non‐commercial funding (governmental organisation) Publication status: peer‐reviewed journal |
|
| Stated aim for study | "This study is part of the project ‘‘Fit en Vaardig op school’’ (fit and academically proficient at school), which is a RCT including a school‐based intervention program for primary school children with the primary aim to improve academic performance" | |
| Notes | ||
| Risk of bias | ||
| Bias | Authors' judgement | Support for judgement |
| Random sequence generation (selection bias) | Unclear risk | Comment: not described |
| Allocation concealment (selection bias) | Low risk | Comment: performed by the National Bureau for Economic Policy Analysis ‐ not involved with the study |
| Blinding of participants and personnel (performance bias) All outcomes | High risk | Comment: students not blinded |
| Blinding of outcome assessment (detection bias) All outcomes | Unclear risk | Comment: not described |
| Incomplete outcome data (attrition bias) Anthropometrics, Fitness | Unclear risk | Comment: unclear where different sample sizes come from across papers |
| Selective reporting (reporting bias) | Low risk | Comment: all outcomes from clinical trials registry reported on |
| Cluster RCT ‐ Recruitment bias | Unclear risk | Comment: not described |
| Cluster RCT ‐ Baseline imbalance | Low risk | Comment: adjusted for in analysis |
| Cluster RCT ‐ Loss of clusters | High risk | Comment: 2 schools did not start the second intervention period |
| Cluster RCT ‐ Incorrect analysis | Low risk | Quote from publication: "a random intercept was considered for each child (level 1) and for each school (level 2), to account for the common experience the children share within each school" |
Drummy 2016.
| Study characteristics | ||
| Methods | Study design: cluster‐RCT | |
| Participants |
School inclusion criteria: convenience sample of primary schools School exclusion criteria: — Student inclusion criteria: students aged 9 and 10 Student exclusion criteria: — Setting: school Age group: children Gender distribution: females and males Country/Countries where trial was performed: Northern Ireland |
|
| Interventions |
Intervention: teachers in the intervention group were asked to lead a 5‐minute activity break 3 times/d for 12 weeks. The activity break began with gentle jogging on the spot as a warm‐up for less than 1 minute, followed by moderate to vigorous intensity exercises such as hopping, jumping, and running on the spot, scissor kicks, etc. Teachers could select which exercises to include in each activity break. They were encouraged to vary activities each day. Children participated in the activity break in the classroom beside their desks Comparator: control groups continued with their normal daily routine throughout the 12‐week period Duration of intervention: 12 weeks Duration of follow‐up: 12 weeks Number of schools: 7 Theoretical framework: — |
|
| Outcomes | PA duration BMI |
|
| Study registration | — | |
| Publication details |
Language of publication: English Funding: — Publication status: peer‐reviewed journal |
|
| Stated aim for study | "Thus, the present study examined the effect of a classroom‐based activity break on accelerometer‐determined MVPA and anthropometric variables in a sample of children attending primary schools in Northern Ireland" | |
| Notes | ||
| Risk of bias | ||
| Bias | Authors' judgement | Support for judgement |
| Random sequence generation (selection bias) | High risk | Comment: stratified by rural/urban location and given alternate numbers by researcher [author communication] |
| Allocation concealment (selection bias) | Unclear risk | Comment: concealed from participants but investigator could have foreseen assignment [author communication] |
| Blinding of participants and personnel (performance bias) All outcomes | High risk | Comment: participants could not be blinded |
| Blinding of outcome assessment (detection bias) All outcomes | High risk | Comment: no blinding [author communication] |
| Incomplete outcome data (attrition bias) Anthropometrics, Fitness | High risk | Comment: > 10% loss to follow‐up; reasons not collected [author communication] |
| Incomplete outcome data (attrition bias) Physical activity and sedentary time | High risk | Comment: > 10% loss to follow‐up; reasons not collected [author communication] |
| Selective reporting (reporting bias) | Unclear risk | Comment: no protocol; appears all outcomes reported |
| Cluster RCT ‐ Recruitment bias | High risk | Comment: baseline data collected after randomisation |
| Cluster RCT ‐ Baseline imbalance | Low risk | Comment: no baseline differences |
| Cluster RCT ‐ Loss of clusters | Low risk | Comment: no clusters lost |
| Cluster RCT ‐ Incorrect analysis | High risk | Comment: clustering not accounted for in analysis |
Jarani 2016.
| Study characteristics | ||
| Methods | Study design: cluster‐RCT | |
| Participants |
School inclusion criteria: elementary schools in Tirana that were not engaged in any PA programme or intervention, had gym space larger than 180 m, and a typical indoor air investigation, which included observation of conditions in the area of the gym and comfort parameters such as humidity and temperature School exclusion criteria: — Student inclusion criteria: Grades 1 and 4 Student exclusion criteria: — Setting: school Age group: children Gender distribution: females and males Country/Countries where trial was performed: Albania |
|
| Interventions |
Intervention 1: exercise group intervention programme emphasised PA exercises (e.g. gait exercises to improve speed). PE lessons were organised to allow maximum participation of children using station or circuit teaching framework to provide opportunities for continuous practice on different exercises at the same time. The exercise group programme was structured in 4 different modules: movement awareness, object or manipulative skills, rhythm, tumbling or gymnastics for Grade 1; and throwing or catching, rhythm, fitness, tumbling or gymnastics for Grade 4, respectively. PE structures station or circuit activities were orientated on an individual school child Intervention 2: games group intervention programme was focused on fun games. PE lessons were organised to allow maximum participation of children using station or circuit teaching framework to provide opportunities for continuous practice on different exercises or games at the same time. The programme was structured in 4 different modules: movement awareness, object or manipulative skills, rhythm, tumbling or gymnastics for grade 1 and throwing or catching, rhythm, fitness, tumbling or gymnastics for grade 4, respectively. The games group‐based PE focused on involving more than 3 or 4 children in a game organised to address each of the 4 modules Comparator: traditional PE school curriculum given by classroom teachers using traditional PE programmes including mainly typical sports Duration of intervention: 5 months Duration of follow‐up: 5 months Number of schools: 4 Theoretical framework: — |
|
| Outcomes | Fitness BMI |
|
| Study registration | — | |
| Publication details |
Language of publication: English Funding: non‐commercial funding (governmental organisation) Publication status: peer‐reviewed journal |
|
| Stated aim for study | "The aim of this study was to examine the effectiveness of 2 new PE programmes on skill‐ and health‐related fitness among elementary school children aged 7 and 10 years in Tirana, Albania, without changing the traditional frequency and duration of the current PE in Albanian schools. Another aim of the study was to compare 2 PE programme approaches to improve children’s physical fitness: 1 with the emphasis on exercises and the other on games using station circuit teaching framework during PE lessons" | |
| Notes | ||
| Risk of bias | ||
| Bias | Authors' judgement | Support for judgement |
| Random sequence generation (selection bias) | Low risk | Comment: random numbers table |
| Allocation concealment (selection bias) | Low risk | Comment: allocation was concealed [author communication] |
| Blinding of participants and personnel (performance bias) All outcomes | High risk | Comment: blinding of students not possible |
| Blinding of outcome assessment (detection bias) All outcomes | High risk | Quote from publication: "...not able to conduct the collection of data blinded to what group the children were randomly allocated" |
| Incomplete outcome data (attrition bias) Anthropometrics, Fitness | Low risk | Comment: high completion rates; no differences between groups; no differences between completers and non‐completers |
| Selective reporting (reporting bias) | Unclear risk | Comment: no protocol published |
| Cluster RCT ‐ Recruitment bias | High risk | Comment: classes were randomised before students enrolled [author communication] |
| Cluster RCT ‐ Baseline imbalance | Low risk | Comment: accounted for in analysis |
| Cluster RCT ‐ Loss of clusters | Low risk | Comment: no loss of classes or schools |
| Cluster RCT ‐ Incorrect analysis | Low risk | Comment: school and class as random effects in model |
Kocken 2016.
| Study characteristics | ||
| Methods | Study design: cluster‐RCT | |
| Participants |
School inclusion criteria: — School exclusion criteria: — Student inclusion criteria: 9 to 11 years Student exclusion criteria: — Setting: school, mix Age group: children Gender distribution: females and males Country/Countries where trial was performed: The Netherlands |
|
| Interventions |
Intervention: the intervention Extra Fit! comprised a variety of theory and practical lessons on nutrition and PA to provide an attractive programme for children. The intervention was focused on the main behavioural changes: decreasing consumption of high‐energy or high‐fat foods and sugar‐sweetened drinks; promoting a healthy breakfast; increasing consumption of fruits and vegetables; reducing television viewing and computer gaming or browsing; and increasing PAs at school and outside school hours. Behavioural determinants of the Theory of Planned Behaviour that were targeted were knowledge (theory lessons and practical assignments), attitude (group discussions and food diaries), social norm (group discussions and homework assignments), and perceived behavioural control (modelling through assignments, e.g. preparing a healthy meal and PA games) Comparator: regular school programme or curriculum on nutrition and PA Duration of intervention: 2 × 16 weeks Duration of follow‐up: 24 months Number of schools: 45 Theoretical framework: theory of planned behaviour |
|
| Outcomes | PA duration Sedentary time BMI |
|
| Study registration | — | |
| Publication details |
Language of publication: English Funding: non‐commercial funding (research funding body) Publication status: peer‐reviewed journal |
|
| Stated aim for study | "The aim of Extra Fit! was to improve dietary habits, PA and inactivity behavior in order to prevent overweightness" | |
| Notes | ||
| Risk of bias | ||
| Bias | Authors' judgement | Support for judgement |
| Random sequence generation (selection bias) | Unclear risk | Comment: not described |
| Allocation concealment (selection bias) | Unclear risk | Comment: not described |
| Blinding of participants and personnel (performance bias) All outcomes | High risk | Comment: participants could not be blinded to intervention |
| Blinding of outcome assessment (detection bias) All outcomes | Unclear risk | Comment: interviewers were blinded with respect to group status of the child’s school (intervention or control) for nutrition interviews, not other measures |
| Incomplete outcome data (attrition bias) Anthropometrics, Fitness | High risk | Comment: large loss to follow‐up |
| Incomplete outcome data (attrition bias) Physical activity and sedentary time | High risk | Comment: large loss to follow‐up |
| Selective reporting (reporting bias) | Unclear risk | Comment: no protocol |
| Cluster RCT ‐ Recruitment bias | Low risk | Comment: all students within randomised schools enrolled |
| Cluster RCT ‐ Baseline imbalance | Low risk | Comment: hip‐waist ratio was significantly higher in the control group at time 0 (t‐test, P < 0.01). There were no other significant differences in baseline characteristics between intervention and control groups |
| Cluster RCT ‐ Loss of clusters | High risk | Comment: 20/65 schools dropped out after randomisation; 7 schools lost to follow‐up after intervention began |
| Cluster RCT ‐ Incorrect analysis | Low risk | Quote from publication: "outcome analyses were conducted using multilevel regression models, with schools included as a random effect" |
Lau 2016.
| Study characteristics | ||
| Methods | Study design: RCT | |
| Participants |
Student inclusion criteria: all students in Grade 4 Student exclusion criteria: — Setting: school Age group: children Gender distribution: females and males Country/Countries where trial was performed: China |
|
| Interventions |
Intervention: children participated in two 60‐minute Xbox 260 Kinect gaming sessions/week after school for 12 school weeks. Children were free to choose games from the 12 offered sports in Season 1 or Season 2 within a play session. This approach was chosen to encourage children’s autonomy and to enhance attractiveness and the challenge of game play. Children and their partners with consensus of opinion had their own choice on the order of games, what they wanted to play, and the duration of each game play. Participants could get awarded based on degree and speed of movement and level of difficulty Comparator: adopted regular PA and PE class and received no additional intervention Duration of intervention: 12 weeks Duration of follow‐up: 12 weeks Number of schools: 1 Theoretical framework: — |
|
| Outcomes | PA duration Fitness BMI |
|
| Study registration | — | |
| Publication details |
Language of publication: English Funding: non‐commercial funding (research funding body) Publication status: peer‐reviewed journal |
|
| Stated aim for study | "Thus, besides the effect of an active video games intervention on children’s aerobic fitness and PA level, this study also sought to explore the active video games impact on players’ psychological correlates, including PA task efficacy, barrier efficacy, and enjoyment" | |
| Notes | ||
| Risk of bias | ||
| Bias | Authors' judgement | Support for judgement |
| Random sequence generation (selection bias) | Low risk | Comment: random numbers table [author communication] |
| Allocation concealment (selection bias) | High risk | Comment: allocation not concealed from investigators [author communication] |
| Blinding of participants and personnel (performance bias) All outcomes | High risk | Comment: no blinding of participants |
| Blinding of outcome assessment (detection bias) All outcomes | Low risk | Comment: outcome assessors were blinded [author communication] |
| Incomplete outcome data (attrition bias) Anthropometrics, Fitness | Low risk | Comment: no loss to follow up |
| Incomplete outcome data (attrition bias) Physical activity and sedentary time | Low risk | Comment: no loss to follow up |
| Selective reporting (reporting bias) | Unclear risk | Comment: no protocol published |
Resaland 2016.
| Study characteristics | ||
| Methods | Study design: cluster‐RCT | |
| Participants |
School inclusion criteria: schools had ≥ 7 pupils in Grade 5 School exclusion criteria: — Student inclusion criteria: children were healthy (with no serious or chronic illness) and able to participate in daily PA and PE. Participants had to be able to complete standard academic performance tests (our primary outcome) Student exclusion criteria: — Setting: school, mix Age group: children Gender distribution: females and males Country/Countries where trial was performed: Norway |
|
| Interventions |
Intervention: comprised 3 components aimed at providing children with the opportunity to engage in 165 minutes of PA/week more than the control group
In addition, pupils participated in the curriculum‐prescribed 90 minutes/week of PE and the curriculum‐prescribed 45 minutes/week of PA. Thus, PA (165 minutes/week) and PE or PA (135 minutes/week) components provided children opportunities to engage in school‐based PAs 300 minutes/week. The intervention was designed so activities could be varied and enjoyable for the children. Teachers were encouraged to motivate children during active lessons, to stimulate their positive feelings and attitudes towards PA. The intervention was designed so approximately 25% of daily PA was of vigorous intensity, defined as “children sweating and being out of breath.” Teachers achieved the vigorous‐PA‐intensity component through selecting a variety of high‐intensity activities such as running, relay racing, obstacle courses, and various forms of high‐activity play Comparator: curriculum‐prescribed 90 minutes/week of PE and 45 minutes/week of PA (total 135 minutes/week). It was specified to control schools that they should carry out the amount of PA and PE that they would have done regardless of the study Duration of intervention: 7 months Duration of follow‐up: 7 months Number of schools: 60 Theoretical framework: socioecological conceptual framework |
|
| Outcomes | PA duration Sedentary time Fitness Health‐related quality of life |
|
| Study registration | NCT02132494 | |
| Publication details |
Language of publication: English Funding: non‐commercial funding (research funding body) Publication status: peer‐reviewed journal |
|
| Stated aim for study | "Our primary objective is to investigate the effect of a 1‐year school‐based PA intervention (Active Smarter Kids; ASK) on academic performance on a sample of 10‐year‐old boys and girls attending elementary school in Norway" | |
| Notes | ||
| Risk of bias | ||
| Bias | Authors' judgement | Support for judgement |
| Random sequence generation (selection bias) | Low risk | Quote from publication: a neutral third party (Centre for Clinical Research, Haukeland University Hospital, Norway) performed the randomisation |
| Allocation concealment (selection bias) | Low risk | Quote from publication: a neutral third party (Centre for Clinical Research, Haukeland University Hospital, Norway) performed the randomisation |
| Blinding of participants and personnel (performance bias) All outcomes | High risk | Comment: groups not blinded to intervention |
| Blinding of outcome assessment (detection bias) All outcomes | High risk | Comment: only data manager and statisticians blinded to group allocation |
| Incomplete outcome data (attrition bias) Anthropometrics, Fitness | Low risk | Comment: low loss to follow‐up |
| Incomplete outcome data (attrition bias) Physical activity and sedentary time | Low risk | Comment: low loss to follow‐up |
| Selective reporting (reporting bias) | Low risk | Comment: outcomes listed in protocol appear to have been reported |
| Cluster RCT ‐ Recruitment bias | Low risk | Comment: > 97% recruitment |
| Cluster RCT ‐ Baseline imbalance | Low risk | Comment: no differences |
| Cluster RCT ‐ Loss of clusters | High risk | Comment: N = 3 clusters withdrew after randomisation |
| Cluster RCT ‐ Incorrect analysis | Low risk | Quote from publication: "analyses were performed using a mixed‐effect model with school as a random effect" |
Sutherland 2016.
| Study characteristics | ||
| Methods | Study design: cluster‐RCT | |
| Participants |
School inclusion criteria: government and Catholic schools; schools with post codes ranked in the bottom 50% of New South Wales post codes based on the Socio‐Economic Indexes for Australia; between 120 and 200 Year 7 students (to meet sample size requirements); and not participating in other major PA or health intervention studies School exclusion criteria: — Student inclusion criteria: all Year 7 students in participating schools will be eligible to participate in the study measurement Student exclusion criteria: classes catering for students with severe physical and mental disabilities will be excluded Setting: school Age group: adolescents Gender distribution: females and males Country/Countries where trial was performed: Australia |
|
| Interventions |
Intervention: intervention involved implementation of 7 PA intervention strategies and 6 strategies to support implementation of the intervention. PA intervention strategies included:
The intervention implementation strategies included
Comparator: schools allocated to control group participated in measurement components of the trial only and delivered PA teaching and promotion practices according to PE curriculum and school‐based initiatives Duration of intervention: 24 months Duration of follow‐up: 24 months Number of schools: 10 Theoretical framework: socioecological theory and health‐promoting schools framework |
|
| Outcomes | PA duration BMI |
|
| Study registration | ACTRN12612000382875 | |
| Publication details |
Language of publication: English Funding: non‐commercial funding (governmental organisation) Publication status: peer‐reviewed journal |
|
| Stated aim for study | "The aim of this study is to determine whether a multi‐component PA intervention implemented in disadvantaged secondary schools can reduce the decline in PA associated with adolescence" | |
| Notes | ||
| Risk of bias | ||
| Bias | Authors' judgement | Support for judgement |
| Random sequence generation (selection bias) | Low risk | Comment: block randomisation using random numbers function |
| Allocation concealment (selection bias) | Low risk | Comment: independent statistician conducted randomisation after data were collected |
| Blinding of participants and personnel (performance bias) All outcomes | High risk | Comment: participants not blinded |
| Blinding of outcome assessment (detection bias) All outcomes | Low risk | Comment: data were collected by trained research assistants blind to group allocation |
| Incomplete outcome data (attrition bias) Anthropometrics, Fitness | Low risk | Quote from publication: "2 sensitivity analyses were conducted, first using only those that provided complete adiposity outcomes at all 3 time points (complete cases), and second using multiple imputation to fill in the missing data. The multiple imputation model used the method of chained regression equations, including variables that were prognostic of missing data and additional demographic and outcome data to create 5 imputed data sets. The results from fitting the model were pooled over the 5 data sets using Rubin’s method" |
| Incomplete outcome data (attrition bias) Physical activity and sedentary time | Low risk | Quote from publication: "PA outcome data were analysed assuming data were “missing at random.” Sensitivity analyses were undertaken for the primary outcome, initially adjusting for any variables on which students with and without 24‐month follow‐up accelerometer data were significantly different, and secondly, using multiple imputation" |
| Selective reporting (reporting bias) | Low risk | Comment: all outcomes in protocol reported |
| Cluster RCT ‐ Recruitment bias | Low risk | Comment: randomisation occurred after baseline data collected |
| Cluster RCT ‐ Baseline imbalance | Unclear risk | Comment: did not assess |
| Cluster RCT ‐ Loss of clusters | Low risk | Comment: no clusters lost |
| Cluster RCT ‐ Incorrect analysis | Low risk | Quote from publication: "a 3‐level hierarchical model was used to capture correlations in the data with random intercepts for repeated measures on individuals clustered within schools" |
Tarp 2016.
| Study characteristics | ||
| Methods | Study design: cluster‐RCT | |
| Participants |
School inclusion criteria: all schools participating in a primary school project about PA and health School exclusion criteria: — Student inclusion criteria: all students in Grade 6 and 7 classes Student exclusion criteria: — Setting: school, mix Age group: adolescents Gender distribution: females and males Country/Countries where trial was performed: Denmark |
|
| Interventions |
Intervention: 60 minutes of PA during school time on all school days including scheduled activities during recess were initiated by teachers and volunteer students. PA homework consisted of a booklet containing suggestions for various daily activities of 5 to 10 minutes, and students were instructed to perform at least 1 activity on all days. It was emphasised that these activities were in addition to usual daily activities. A 2‐week cycling campaign was launched in the middle of the intervention to facilitate active transportation by cycling. A custom‐made “activity watch” was used as a shared tool by teachers and students to serve as motivation and to sum up the amount of time the class had engaged in PA during academic subjects and scheduled recess activities Comparator: schools were asked to continue with their normal practice Duration of intervention: 20 weeks Duration of follow‐up: 20 weeks Number of schools: 14 Theoretical framework: social cognitive theory, socioecological theory, health promoting schools framework from WHO |
|
| Outcomes | PA duration Fitness BMI |
|
| Study registration | NCT02012881 | |
| Publication details |
Language of publication: English Funding: non‐commercial funding (governmental organisation) Publication status: peer‐reviewed journal |
|
| Stated aim for study | "The primary aim of the present paper is to describe the effectiveness of a school‐based PA intervention in enhancing executive functions and academic performance in adolescents. Furthermore, the effect of the intervention on PA levels, cardiorespiratory fitness and adiposity were assessed as these are potential explanatory variables" | |
| Notes | ||
| Risk of bias | ||
| Bias | Authors' judgement | Support for judgement |
| Random sequence generation (selection bias) | Low risk | Quote from publication: "the randomisation process was conducted by the principal investigator as draws of folded paper with school names from a bowl in the presence of other senior researchers" |
| Allocation concealment (selection bias) | Low risk | Quote from publication: "the randomisation process was conducted by the principal investigator as draws of folded paper with school names from a bowl in the presence of other senior researchers" |
| Blinding of participants and personnel (performance bias) All outcomes | High risk | Quote from publication: "baseline measures were carried out after the randomisation with schools aware of the randomisation results. This was also known to the staff conducting the tests" |
| Blinding of outcome assessment (detection bias) All outcomes | Unclear risk | Quote from publication: "baseline measures were carried out after the randomisation with schools aware of the randomisation results. This was also known to the staff conducting the tests" |
| Incomplete outcome data (attrition bias) Anthropometrics, Fitness | High risk | Comment: large loss to follow‐up on some outcome measures. Significant differences at baseline between students and those lost to follow‐up included in analyses |
| Incomplete outcome data (attrition bias) Physical activity and sedentary time | High risk | Comment: large loss to follow‐up on some outcome measures. Significant differences at baseline between students and those lost to follow‐up included in analyses |
| Selective reporting (reporting bias) | Low risk | Comment: all outcomes listed in protocol paper reported |
| Cluster RCT ‐ Recruitment bias | High risk | Comment: schools randomised before participants recruited |
| Cluster RCT ‐ Baseline imbalance | Low risk | Comment: baseline imbalance accounted for in analysis |
| Cluster RCT ‐ Loss of clusters | High risk | Quote from publication: "2 intervention schools withdrew the acceptance before the start of the study, but after the randomisation. Additionally, 3 schools not originally enrolled in the study were invited from local networks and randomised" |
| Cluster RCT ‐ Incorrect analysis | Low risk | Quote from publication: "as the units of randomisation were schools a “random effect” was added by using mixed models (maximum likelihood based) to accommodate the clustering of students within these units" |
Cohen 2015.
| Study characteristics | ||
| Methods | Study design: cluster‐RCT | |
| Participants |
School inclusion criteria: 16 government primary schools located within 30 minutes' drive from the University of Newcastle, with a Socio‐Economic Indexes for Areas ≤ 5 (lowest 50%) School exclusion criteria: — Student inclusion criteria: all students in Grades 3 and 4 (stage 2) at study schools Student exclusion criteria: — Setting: school Age group: children Gender distribution: females and males Country/Countries where trial was performed: Australia |
|
| Interventions |
Intervention: implemented in 3 phases. Phase 1 focused on teacher professional learning, student leadership workshops, and PA promotion tasks to achieve awards. Examples of tasks included acting as equipment monitor, organising games during recess and lunch, and writing a PA promotion article for the school newsletter. Equipment was provided to the school during this phase, and the school committee was established. In phase 2, schools were encouraged to implement 6 PA policies to support the promotion of PA and fundamental movement skill competency within the school. A member of the research team met with the principal at the intervention schools to explain the policies. The member of the research team then conducted a meeting with all staff members to explain the policies and to provide strategies for implementation of the policies. In addition, the research team used a range of strategies targeting the home environment (newsletters, parent evening, and fundamental movement skill homework) to engage parents and encourage them to support their children’s PA. Phase 3 addressed strategies to improve school–community links (e.g. inviting local sporting organisations to assist with school sport programmes) Comparator: control group followed the usual PE and school sport programmes. The New South Wales Department of Education and Communities requires by policy that all schools provide students with 120 minutes/week of planned PA. In government primary schools, sports programmes are similar among schools Duration of intervention: 12 months Duration of follow‐up: 12 months Number of schools: 8 Theoretical framework: socioecological model |
|
| Outcomes | PA duration Fitness |
|
| Study registration | ACTRN12611001080910 | |
| Publication details |
Language of publication: English Funding: non‐commercial funding (research funding body) Publication status: peer‐reviewed journal |
|
| Stated aim for study | "Supporting Children's Outcomes using Rewards, Exercise, and Skills is a multi‐component school‐based intervention that combines a range of evidence‐based behavior change strategies to promote PA and fundamental movement skills competency among primary school aged children from low‐income communities" | |
| Notes | ||
| Risk of bias | ||
| Bias | Authors' judgement | Support for judgement |
| Random sequence generation (selection bias) | Low risk | Quote from publication: "randomly allocated to the intervention or control group using a computer‐based random number producing algorithm by a researcher not involved in the current study" |
| Allocation concealment (selection bias) | Low risk | Comment: randomisation occurred after baseline assessment [author communication] |
| Blinding of participants and personnel (performance bias) All outcomes | High risk | Comment: participants not blinded to intervention |
| Blinding of outcome assessment (detection bias) All outcomes | High risk | Comment: assessors were blind to treatment allocation at baseline but not at follow‐up assessments |
| Incomplete outcome data (attrition bias) Anthropometrics, Fitness | High risk | Comment: large loss to follow‐up; different by group |
| Incomplete outcome data (attrition bias) Physical activity and sedentary time | High risk | Comment: large loss to follow‐up; different by group |
| Selective reporting (reporting bias) | Low risk | Comment: all outcomes in protocol reported |
| Cluster RCT ‐ Recruitment bias | Low risk | Comment: baseline assessments were conducted prior to randomisation |
| Cluster RCT ‐ Baseline imbalance | Low risk | Comment: baseline imbalance adjusted for statistically |
| Cluster RCT ‐ Loss of clusters | Low risk | Comment: no loss of clusters reported |
| Cluster RCT ‐ Incorrect analysis | Low risk | Comment: analysis accounted for clustered design |
Jago 2015.
| Study characteristics | ||
| Methods | Study design: cluster‐RCT | |
| Participants |
School inclusion criteria: state secondary schools operating within 3 local authorities: Bristol City Council, North Somerset Council, Bath and North East Somerset Council School exclusion criteria: excluding special educational needs, dance academies, and privately or independently funded schools Student inclusion criteria: Year 7 girls who are able to engage in PE class Student exclusion criteria: — Setting: school Age group: children/adolescents Gender distribution: females Country/Countries where trial was performed: UK |
|
| Interventions |
Intervention: intervention consisted of up to 40, 75‐minute dance sessions provided twice per week after school. Session plans included guidance on how to reinforce the underpinning self‐determination theory principles as well as advice on activities, group work, and dance skill development. To reflect a ‘normal’ dance session, instructors were able to decide on the genre of dance used, after consultation with the girls at their school Comparator: provided data only Duration of intervention: 20 weeks Duration of follow‐up: 52 weeks Number of schools: 18 Theoretical framework: self‐determination theory |
|
| Outcomes | PA participation PA duration Sedentary time Health‐related quality of life |
|
| Study registration | ISRCTN52882523(retrospectively registered) | |
| Publication details |
Language of publication: English Funding: non‐commercial funding (research funding body) Publication status: peer‐reviewed journal |
|
| Stated aim for study | "Determine the effectiveness of the Bristol Girls Dance Project intervention to improve the objectively‐assessed (accelerometer) mean weekday min of MVPA accumulated by Year 7 girls 1 year after the baseline measurement (Time 2 = time 0 + 52 weeks)" | |
| Notes | ||
| Risk of bias | ||
| Bias | Authors' judgement | Support for judgement |
| Random sequence generation (selection bias) | Low risk | Comment: using Stata to balance arms by minimisation |
| Allocation concealment (selection bias) | Low risk | Comment: 1 investigator conducted randomisation; 1 notified schools of allocation after randomisation completed |
| Blinding of participants and personnel (performance bias) All outcomes | High risk | Comment: participants not blinded |
| Blinding of outcome assessment (detection bias) All outcomes | Low risk | Comment: trained field workers; blinded to intervention allocation; collected data |
| Incomplete outcome data (attrition bias) Physical activity and sedentary time | Low risk | Comment: minimal missing data |
| Selective reporting (reporting bias) | Low risk | Comment: all outcomes in protocol reported in results |
| Cluster RCT ‐ Recruitment bias | Low risk | Comment: randomisation after baseline data collection |
| Cluster RCT ‐ Baseline imbalance | Low risk | Comment: baseline imbalances adjusted for |
| Cluster RCT ‐ Loss of clusters | Low risk | Comment: no loss of clusters |
| Cluster RCT ‐ Incorrect analysis | Low risk | Comment: all models adjusted for clustering of girls in schools |
Madsen 2015.
| Study characteristics | ||
| Methods | Study design: cluster‐RCT | |
| Participants |
School inclusion criteria: > 50% of students eligible for free or reduced‐price lunch; average of at least 60 students/grade; no exposure to Playworks in the past 5 years School exclusion criteria: — Student inclusion criteria: all Grade 3, 4, and 5 students from the 6 participating schools Student exclusion criteria: — Setting: school, urban Age group: — Gender distribution: females and males Country/Countries where trial was performed: USA |
|
| Interventions |
Intervention: each intervention school received 1 part‐time registered dietician coach and 1 full‐time Playworks coach for 2 school years. Each year, the registered dietician coach delivered a 12‐week nutrition and energy balance education curriculum that included food tasting, PA games to reinforce nutrition messages, and strategies to help students meet their nutrition and PA goals. Registered dietician coaches also worked with a team of school staff and parents to implement classroom wellness policies and to make improvements in school food, including increased offerings of fruits and vegetables to meet the Bronze‐level Healthier USA School Challenge criteria. The Playworks coach structured recess activities before and during school hours to encourage active participation by all students. The Playworks coach also led a PA session with individual classes every other week. Classroom teachers were trained to implement Playworks games and classroom management strategies in their PE sessions with students. Last, Playworks coaches led after‐school sports leagues throughout each year Comparator: — Duration of intervention: 2 years Duration of follow‐up: 2 years Number of schools: 6 Theoretical framework: social cognitive theory |
|
| Outcomes | Fitness BMI |
|
| Study registration | — | |
| Publication details |
Language of publication: English Funding: non‐commercial funding (charitable trust) Publication status: peer‐reviewed journal |
|
| Stated aim for study | "The current study was designed to test the impact of Energy Balance 4 Kids with Play on students’ nutrition and PA knowledge and behaviours, fitness, and BMI z‐score over a 2‐year period beginning in the fall of 2011" | |
| Notes | ||
| Risk of bias | ||
| Bias | Authors' judgement | Support for judgement |
| Random sequence generation (selection bias) | Low risk | Comment: random number generator [author communication] |
| Allocation concealment (selection bias) | High risk | Comment: 1 school knowingly assigned to intervention group |
| Blinding of participants and personnel (performance bias) All outcomes | High risk | Comment: students not blinded |
| Blinding of outcome assessment (detection bias) All outcomes | High risk | Comment: no blinding [author communication] |
| Incomplete outcome data (attrition bias) Anthropometrics, Fitness | Low risk | Comment: missing data explained; similar between groups |
| Selective reporting (reporting bias) | Low risk | Comment: all outcomes reported in protocol paper |
| Cluster RCT ‐ Recruitment bias | High risk | Comment: baseline data collected after randomisation |
| Cluster RCT ‐ Baseline imbalance | Low risk | Comment: differences adjusted for in analyses |
| Cluster RCT ‐ Loss of clusters | Low risk | Comment: no clusters were lost [author communication] |
| Cluster RCT ‐ Incorrect analysis | Low risk | Quote from publication: "mixed‐effects linear regression models were used ...[with] school as a random effect to account for clustering" |
Muros 2015.
| Study characteristics | ||
| Methods | Study design: cluster‐RCT | |
| Participants |
School inclusion criteria: rural environment and similar socioeconomic status School exclusion criteria: — Student inclusion criteria: 10 to 11 years old Student exclusion criteria: — Setting: school, rural Age group: children Gender distribution: females and males Country/Countries where trial was performed: Spain |
|
| Interventions |
Intervention 1: intervention consisted of 60‐minute sessions of PA held twice per week. PA was controlled by means of heart rate monitoring. The aim of the training sessions was to improve aerobic capacity using PAs specifically targeted for health gains such as motor skills, games, and sports. Play was used in all activities to motivate students and achieve the desired level of PA. All games and tasks were designed and developed by a group of experts in education and sports science and were directed by the same supervisor Intervention 2: PA and nutritional educational interventions combined Intervention 3: the same intervention as PA and nutritional educational intervention group and replaced the oil that they normally consumed with extra virgin olive oil during the final month of the intervention Compartor 1: nutritional educational sessions informed participants about the benefits of a Mediterranean diet (high fruit, vegetables, legumes, fish, cereals, and unsaturated‐to‐saturated fat ratio, and low meat, meat products, and dairy products) and lifestyle. Nutritional education involved both parents and students. One or both parents could attend the sessions. It was compulsory for pupils to attend both nutrition sessions held during school time Comparator 2: continued with their usual activities Duration of intervention: 6 months Duration of follow‐up: 6 months Number of schools: 5 Theoretical framework: — |
|
| Outcomes | Fitness BMI |
|
| Study registration | — | |
| Publication details |
Language of publication: English Funding: non‐commercial funding (charitable trust) Publication status: peer‐reviewed journal |
|
| Stated aim for study | "The aim of our study was to investigate the effects of 4 experimental conditions and 1 no intervention control group on health‐related parameters, such as the lipid, physiological and anthropometric profiles of children" | |
| Notes | ||
| Risk of bias | ||
| Bias | Authors' judgement | Support for judgement |
| Random sequence generation (selection bias) | Low risk | Comment: computer‐generated random numbers [author communication] |
| Allocation concealment (selection bias) | Low risk | Comment: researchers could not know the intervention assignment [author communication] |
| Blinding of participants and personnel (performance bias) All outcomes | High risk | Comment: participants not blinded |
| Blinding of outcome assessment (detection bias) All outcomes | Low risk | Comment: for all outcomes, investigators were blinded to grouping |
| Incomplete outcome data (attrition bias) Anthropometrics, Fitness | High risk | Comment: only 56% of participants have end of study measures; reasons not reported |
| Selective reporting (reporting bias) | Unclear risk | Comment: no protocol published |
| Cluster RCT ‐ Recruitment bias | Low risk | Comment: students and parents enrolled before randomisation |
| Cluster RCT ‐ Baseline imbalance | High risk | Comment: groups imbalanced at baseline; not controlled for |
| Cluster RCT ‐ Loss of clusters | Low risk | Comment: no clusters lost (only 1/group) |
| Cluster RCT ‐ Incorrect analysis | High risk | Comment: clustering not accounted for in analysis |
Suchert 2015.
| Study characteristics | ||
| Methods | Study design: cluster‐RCT | |
| Participants |
School inclusion criteria: schools selected from a complete list of all secondary schools in Schleswig Holstein obtained from the Ministry of Education School exclusion criteria: schools for disabled students Student inclusion criteria: all students in participating classes Student exclusion criteria: — Setting: school Age group: adolescents Gender distribution: females and males Country/Countries where trial was performed: Germany |
|
| Interventions |
Intervention: the intervention operates at 4 levels: individual, class, school, and parents
Comparator: no further intervention Duration of intervention: 12 weeks Duration of follow‐up: 1 year Number of schools: 29 Theoretical framework: — |
|
| Outcomes | Fitness BMI |
|
| Study registration | ISRCTN49482118 | |
| Publication details |
Language of publication: English Funding: non‐commercial funding (charitable trust) Publication status: peer‐reviewed journal |
|
| Stated aim for study | "The aim of the study is to evaluate the implementation and effectiveness of the “läuft” PA program among adolescents in grade 8" | |
| Notes | ||
| Risk of bias | ||
| Bias | Authors' judgement | Support for judgement |
| Random sequence generation (selection bias) | Low risk | Quote from publication: "a stratified randomisation was carried out on the school level (according to type of school and number of participating classes) with the computer program Randomization In Treatment Arms" |
| Allocation concealment (selection bias) | Low risk | Comment: randomisation conducted using a computer programme |
| Blinding of participants and personnel (performance bias) All outcomes | High risk | Comment: participants not blinded to intervention |
| Blinding of outcome assessment (detection bias) All outcomes | High risk | Comment: assessors were not blinded [author communication] |
| Incomplete outcome data (attrition bias) Anthropometrics, Fitness | Low risk | Quote from publication: "students in the study sample engaged in less out‐of‐school sports activities at baseline than students lost to post‐assessment (P = 0.006). Attrition analyses revealed no further differences. There was no selective attrition between groups" |
| Selective reporting (reporting bias) | High risk | Comment: reporting of medical testing listed in protocol missing |
| Cluster RCT ‐ Recruitment bias | High risk | Comment: participants recruited after clusters randomised |
| Cluster RCT ‐ Baseline imbalance | High risk | Comment: clusters not balanced at baseline |
| Cluster RCT ‐ Loss of clusters | Low risk | Comment: there was no dropout on school or class level |
| Cluster RCT ‐ Incorrect analysis | Low risk | Comment: analysis accounted for clustered design |
Andrade 2014.
| Study characteristics | ||
| Methods | Study design: cluster‐RCT | |
| Participants |
School inclusion criteria: > 90 students in Grades 8 and 9 and located in the urban area of Cuenca, Ecuador Eligible schools were paired according to 4 criteria
School exclusion criteria: schools with no matching pair Student inclusion criteria: 2 Grade 8 and 2 Grade 9 classes were randomly selected; all students in those grades were invited to participate Student exclusion criteria: pregnant adolescents and those with muscle or bone injury or a concomitant disease Setting: school, urban Age group: adolescents Gender distribution: females and males Country/Countries where trial was performed: Ecuador |
|
| Interventions |
Intervention: ACTIVITAL intervention for PA objectives were to decrease daily screen time (1 hour to 2 hours/d), to increase daily PA levels to reach 60 minutes/d, and to have the school offer more opportunities to be active. Individual‐based strategies included delivery of an educational package organised at the classroom level. Persons in charge of delivering the educational package received an introduction to the intervention objectives and a basic workshop on healthy eating and PA. The PA environmental strategy included workshops with parents that were organised at the same time as classes with adolescents and covered similar topics; organisation of social events at school such as an interactive session with famous young athletes; and environmental modification ‐ a walking trail was drawn on the school playground in the second year of the intervention. There was no minimum dose for activities for each of the intervention strategies Comparator: standard curriculum as determined by the Ecuadorian government, geared at increasing sport skills and includes and a mandatory 80 minutes of PE/week Duration of intervention: 28 months Duration of follow‐up: 28 months Number of schools: 20 Theoretical framework: social cognitive theory, information‐motivation behavioural skills model, control theory, theory of planned behaviour |
|
| Outcomes | PA participation PA duration Sedentary time Fitness BMI |
|
| Study registration | NCT01004367 | |
| Publication details |
Language of publication: English Funding: non‐commercial funding (research funding body) Publication status: peer‐reviewed journal |
|
| Stated aim for study | "We implemented a school‐based health promotion intervention ACTIVITAL that aimed at improving diet and PA. ACTIVITAL was developed using participatory approaches and tailored to the Ecuadorian school context" | |
| Notes | ||
| Risk of bias | ||
| Bias | Authors' judgement | Support for judgement |
| Random sequence generation (selection bias) | Low risk | Quote from publication: "using a random number generation with random allocation of the intervention within each pair" |
| Allocation concealment (selection bias) | Unclear risk | Comment: no description of allocation concealment |
| Blinding of participants and personnel (performance bias) All outcomes | Low risk | Quote from publication: "adolescents were not informed about the existence of a counterfactual school" |
| Blinding of outcome assessment (detection bias) All outcomes | Unclear risk | Comment: not described |
| Incomplete outcome data (attrition bias) Anthropometrics, Fitness | Low risk |
Comment: loss to follow‐up greater in control school, but data imputed Quote from publication: "age, BMI z‐score, gender, physical activity knowledge and socioeconomic status were used as predictors in models to impute data in the pairs" |
| Incomplete outcome data (attrition bias) Physical activity and sedentary time | Low risk |
Comment: loss to follow‐up greater in control school, but data imputed Quote from publication: "age, BMI z‐score, gender, physical activity knowledge and socioeconomic status were used as predictors in models to impute data in the pairs" |
| Selective reporting (reporting bias) | Low risk | Comment: all published outcomes reported |
| Cluster RCT ‐ Recruitment bias | High risk | Comment: students enrolled after randomisation |
| Cluster RCT ‐ Baseline imbalance | Low risk | Comment: adjusted for in models |
| Cluster RCT ‐ Loss of clusters | Low risk | Comment: no clusters lost |
| Cluster RCT ‐ Incorrect analysis | Low risk | Comment: mixed models used to account for effect of clustering |
Jago 2014.
| Study characteristics | ||
| Methods | Study design: cluster‐RCT | |
| Participants |
School inclusion criteria: primary schools in the Greater Bristol area School exclusion criteria: — Student inclusion criteria: all Year 5 and 6 children who are physically able to engage in PE classes Student exclusion criteria: — Setting: school Age group: children Gender distribution: females and males Country/Countries where trial was performed: UK |
|
| Interventions |
Intervention: Action 3:30 school PA sessions. The focus of the sessions was to promote children’s perceptions of autonomy, belonging, and competence. Amongst a range of techniques, to promote autonomy, teaching assistants were encouraged to provide children with choices within activities, such as leading warm‐ups and adapting games, and there were child‐led sessions in which children chose the activities. Teaching assistants supported competence by setting progressive activities targeting quick successes balanced with providing optimal challenge and providing specific praise for attempts as well as outcomes. Relatedness was supported through empathic teaching assistant‐child interactions, with teaching assistants showing interest in the children’s lives outside the intervention and encouraging teamwork Comparator: schools provided data at Time 0, Time 1, and Time 2 only; no other contact was made by the research team Duration of intervention: 20 weeks Duration of follow‐up: 9 months Number of schools: 20 Theoretical framework: self‐determination theory |
|
| Outcomes | PA duration | |
| Study registration | ISRCTN58502739 (retrospectively registered) | |
| Publication details |
Language of publication: English Funding: non‐commercial funding (research funding body) Publication status: peer‐reviewed journal |
|
| Stated aim for study | "The main research question for a future definitive trial is, ‘Is Action 3:30, an after‐school PA intervention that is based on behaviour‐change theory and delivered by teaching assistants, effective in improving the PA, attitudes and confidence of Year 5 and 6 children?’ Specific aims: 1) Estimate the likely recruitment, attendance, and retention rates of pupils to the Action 3:30 after school PA intervention. 2) Estimate the likely impact on PA while the club was still running and 4 months after contact sessions had ended. 3) Develop a reliable costing tool and assess the feasibility of obtaining programme cost data. 4) Estimate the sample size for an adequately powered evaluation of the Action 3:30 intervention" | |
| Notes | ||
| Risk of bias | ||
| Bias | Authors' judgement | Support for judgement |
| Random sequence generation (selection bias) | Low risk | Quote from publication: "randomisation was conducted by an independent statistician in the trials unit with no other involvement in the project" |
| Allocation concealment (selection bias) | Low risk | Comment: conducted by clinical trials unit not involved in the study |
| Blinding of participants and personnel (performance bias) All outcomes | High risk | Comment: students and staff not blinded |
| Blinding of outcome assessment (detection bias) All outcomes | High risk | Comment: attempted to blind data collectors, but group allocation was often revealed by students or staff [author communication] |
| Incomplete outcome data (attrition bias) Physical activity and sedentary time | Low risk | Comment: small loss to follow‐up; reasons provided |
| Selective reporting (reporting bias) | Low risk | Comment: all outcomes in protocol paper reported |
| Cluster RCT ‐ Recruitment bias | Low risk | Quote from publication: "schools were randomly assigned to intervention or control arms once baseline data had been processed" |
| Cluster RCT ‐ Baseline imbalance | Low risk | Comment: models adjusted for baseline imbalance |
| Cluster RCT ‐ Loss of clusters | Low risk | Comment: no clusters lost |
| Cluster RCT ‐ Incorrect analysis | Low risk | Quote from publication: "models [used]... robust standard errors used to take account of the cluster randomised design" |
Kipping 2014.
| Study characteristics | ||
| Methods | Study design: cluster‐RCT | |
| Participants |
School inclusion criteria: all state primary and junior schools with children in Years 4 to 6 (aged 8 to 11) in the area covered by Bristol City Council and North Somerset Council School exclusion criteria: special schools (i.e. those for children whose additional needs cannot be met in a mainstream setting) because they are unlikely to be teaching the standard national curriculum and children may not be able to take part in all measurements Student inclusion criteria: children in Year 4 (age 8 to 9) at the recruitment stage Student exclusion criteria: — Setting: school, mix Age group: children Gender distribution: females and males Country/Countries where trial was performed: UK |
|
| Interventions |
Intervention: Active for Life Year 5 is a school‐based intervention that aims to increase children’s self‐efficacy and knowledge, together with motivating parents, to increase children’s levels of PA, reduce sedentary behaviour, and increase consumption of fruits and vegetables; a secondary aim is to improve other aspects of healthy activity and diet. The 5 components of the intervention are:
Comparator: continued standard education provision for the school year, and any involvement in additional health‐promoting activities, but no access to intervention teacher training and no known access to teaching materials Duration of intervention: 1 school year Duration of follow‐up: 1 school year Number of schools: 60 Theoretical framework: social cognitive theory |
|
| Outcomes | PA duration Sedentary time BMI |
|
| Study registration | ISRCTN50133740 | |
| Publication details |
Language of publication: English Funding: non‐commercial funding (research funding body) Publication status: peer‐reviewed journal |
|
| Stated aim for study | "The aims of Active for Life Year 5 are to determine the effectiveness and cost‐effectiveness of the intervention in children aged 9 to 10 years to improve the following primary outcomes: 1) Daily time spent in, and amount of, PA. 2) Daily time spent in sedentary behaviour. 3) Portions of fruit and vegetables consumed/d. And secondary outcomes: 1) Time spent screen‐viewing/d. 2) Portions of: snacks, high fat foods, and high energy drinks consumed/d. 3) BMI. 4) Waist circumference. 5) Whether overweight or obese. The aim is to determine whether the intervention affects these outcomes in the short‐term (i.e. immediately at the end of the intervention) and in the longer term (i.e. 12 months after the end of the intervention)" | |
| Notes | ||
| Risk of bias | ||
| Bias | Authors' judgement | Support for judgement |
| Random sequence generation (selection bias) | Low risk | Quote from publication: "schools were grouped and randomly allocated them to control or intervention. 1 author (DAL) who was unaware of any characteristics of the schools did the randomisation (identification numbers were used to relate schools to the 2 stratifying variables, and DAL had no knowledge of which schools these numbers linked to)" |
| Allocation concealment (selection bias) | Low risk | Quote from publication: "randomisation was concealed by using the Bristol Randomised Trials Collaboration’s automated (remote) system" |
| Blinding of participants and personnel (performance bias) All outcomes | High risk | Comment: students not blinded |
| Blinding of outcome assessment (detection bias) All outcomes | Low risk | Comment: field workers collecting data were blind to allocation |
| Incomplete outcome data (attrition bias) Anthropometrics, Fitness | Low risk | Comment: similar missing data at baseline and at end of study |
| Incomplete outcome data (attrition bias) Physical activity and sedentary time | Low risk | Comment: similar missing data at baseline and at end of study |
| Selective reporting (reporting bias) | Low risk | Comment: all outcomes in protocol paper reported |
| Cluster RCT ‐ Recruitment bias | Low risk | Comment: randomisation after enrolment |
| Cluster RCT ‐ Baseline imbalance | Low risk | Comment: analyses adjusted for baseline values |
| Cluster RCT ‐ Loss of clusters | Low risk | Comment: no loss of clusters |
| Cluster RCT ‐ Incorrect analysis | Low risk | Comment: multi‐level regression models accounted for clustering within school |
Kobel 2014.
| Study characteristics | ||
| Methods | Study design: cluster‐RCT | |
| Participants |
School inclusion criteria: all primary schools of the state of Baden‐Württemberg School exclusion criteria: teachers who already took part in the programme in the academic year 2009/2010 were not included in the study Student inclusion criteria: pupils at primary school participating in the Baden‐Württemberg study, Grades 1 and 2 Student exclusion criteria: none Setting: school Age group: children Gender distribution: females and males Country/Countries where trial was performed: Germany |
|
| Interventions |
Intervention: a progressive, teacher‐led intervention from Grades 1 to 4 using a spiral curriculum. Each teacher takes part in a 3‐part training course led by a colleague or other teacher (not an external expert) to enhance programme acceptance and facilitate translation into the school environment for sustainability. The intervention consists of 20 units/school year of lessons on “beverages”, “PAs”, and “recreational activities”. These units are spread over the whole academic year. Furthermore, the intervention consists of 2 PA exercises that are performed every school day ("active breaks”, each exercise takes between 5 and 7 minutes). Additionally, “family homework” exercises are given, which are small tasks related to the lesson’s topics to involve parents. Further, samples for parents’ evenings and templates for letters to parents in 3 languages (i.e. German, Turkish, and Russian) are included Comparator: in the academic year 2010/2011, there was no intervention in the control group; although interested, class teachers belonging to the control group received no local training and no materials for the intervention; they were registered for participation in the academic year 2011/2012. In the academic year 2011/2012, these class teachers started with the 3‐part local training course Duration of intervention: 1 year Duration of follow‐up: 1 year Number of schools: 91 Theoretical framework: social cognitive theory, saluto‐genetic competence, action‐oriented approach |
|
| Outcomes | PA participation PA duration BMI |
|
| Study registration | DRKS00000494 | |
| Publication details |
Language of publication: English Funding: — Publication status: peer‐reviewed journal |
|
| Stated aim for study | "The purpose of this study, therefore, is to investigate the children’s behaviours after a 1‐year intervention in respect of the programme’s key aspects: an increase of PA, a decrease in time spent with screen media as well as more regular breakfast, and a reduction of the consumption of sugar‐sweetened beverages" | |
| Notes | ||
| Risk of bias | ||
| Bias | Authors' judgement | Support for judgement |
| Random sequence generation (selection bias) | Low risk | Comment: the randomisation list was generated by an independent person in the Institute of Epidemiology and Medical Biometry Ulm University, using a validated system, which involves a pseudo‐random number generator to ensure that the resulting treatment sequence will be both reproducible and non‐predictable [author communication] |
| Allocation concealment (selection bias) | Low risk | Comment: allocation was concealed by using an independent statistician |
| Blinding of participants and personnel (performance bias) All outcomes | High risk | Comment: students and teachers knew group assignment |
| Blinding of outcome assessment (detection bias) All outcomes | Low risk | Comment: outcome assessors at schools were blinded [author communication] |
| Incomplete outcome data (attrition bias) Anthropometrics, Fitness | High risk | Comment: > 10% loss to follow‐up; no explanation given |
| Incomplete outcome data (attrition bias) Physical activity and sedentary time | High risk | Comment: > 10% loss to follow‐up; no explanation given |
| Selective reporting (reporting bias) | High risk | Comment: skin‐fold thickness reported in protocol but not in article |
| Cluster RCT ‐ Recruitment bias | High risk | Comment: students enrolled after randomisation |
| Cluster RCT ‐ Baseline imbalance | Low risk | Comment: baseline demographics similar |
| Cluster RCT ‐ Loss of clusters | High risk | Comment: N = 6 classes withdrew because of randomisation to control group |
| Cluster RCT ‐ Incorrect analysis | High risk | Comment: statistical analysis does not account for clustering |
Martinez‐Vizcaino 2014.
| Study characteristics | ||
| Methods | Study design: cluster‐RCT | |
| Participants |
School inclusion criteria: schools in different municipalities in the province of Cuenca, Spain School exclusion criteria: — Student inclusion criteria: literate in Castilian Spanish, no physical or mental disorder identified by parents or teachers that would prevent student from doing PA, no chronic disease that paediatrician or family doctor considered would prevent student from participating in MOVI‐2, collaboration of a family member who would respond to questionnaires on lifestyle Student exclusion criteria: — Setting: school, mix Age group: children Gender distribution: females and males Country/Countries where trial was performed: Spain |
|
| Interventions |
Intervention: MOVI‐2 consisted of an extracurricular play‐based and non‐competitive PA programme. The primary objective of MOVI‐2 was to increase weekly PA while improving health‐related fitness. MOVI‐2 included basic sports games, traditional games, and other outdoor activities such as cycling or gymkhanas. The programme included two 90‐minute PA sessions during weekdays in the evening from 4:00 to 5:30 PM and one 150‐minute session on Saturday morning each week Comparator: standard PE curriculum (2 hours/week of PA at low to moderate intensity) Duration of intervention: 8 months Duration of follow‐up: 8 months Number of schools: 20 Theoretical framework: socioecological model |
|
| Outcomes | BMI | |
| Study registration | NCT01277224 (retrospectively registered) | |
| Publication details |
Language of publication: English Funding: non‐commercial funding (research funding body) Publication status: peer‐reviewed journal |
|
| Stated aim for study | "Our study assessed the impact of a standardized PA program on adiposity and cardio metabolic risk in grades 4 and 5 schoolchildren. The program consisted of noncompetitive recreational activities focused on developing aerobic and muscular fitness" | |
| Notes | ||
| Risk of bias | ||
| Bias | Authors' judgement | Support for judgement |
| Random sequence generation (selection bias) | Low risk | Comment: computer‐generated procedure |
| Allocation concealment (selection bias) | Low risk | Comment: opaque envelopes |
| Blinding of participants and personnel (performance bias) All outcomes | High risk | Quote from publication: "it was impossible to blind parents, children, and teachers to the existence of the intervention group program" |
| Blinding of outcome assessment (detection bias) All outcomes | High risk | Quote from publication: "although it was not possible to blind the investigators who measured other study variables at baseline and at the conclusion of the study as to trial group allocation, the analysts who processed and analysed the study data were blinded in this respect" |
| Incomplete outcome data (attrition bias) Anthropometrics, Fitness | High risk | Comment: > 10% loss to follow‐up; reason not provided |
| Selective reporting (reporting bias) | Low risk | Comment: all outcomes reported in protocol described |
| Cluster RCT ‐ Recruitment bias | High risk | Comment: students recruited after randomisation |
| Cluster RCT ‐ Baseline imbalance | Low risk | Quote from publication: "there were no statistically significant differences between intervention and control participants in any baseline characteristics" |
| Cluster RCT ‐ Loss of clusters | Low risk | Comment: no clusters lost [author communication] |
| Cluster RCT ‐ Incorrect analysis | Low risk | Comment: clustering accounted for in analysis |
Nogueira 2014.
| Study characteristics | ||
| Methods | Study design: cluster‐RCT | |
| Participants |
School inclusion criteria: 2 local independent primary schools (Gold Coast, Australia) of essentially identical size and demographic (ethnicity and socioeconomic profile), with comparable school fees, school hours, curricula, and time devoted to PE and other PAs School exclusion criteria: — Student inclusion criteria: students who were of sound general health, fully ambulatory, and gave their consent to participate Student exclusion criteria: students taking medications known to affect bone, muscle, or metabolism; recovering from a limb fracture or other immobilising injury in the past 6 months; affected by any condition not compatible with PA; parents declined to consent Setting: school Age group: children Gender distribution: females and males Country/Countries where trial was performed: Australia |
|
| Interventions |
Intervention: instructor‐led exercise bouts comprising 10 minutes of continuous high‐intensity movement intended to improve musculoskeletal and metabolic health. Programme was largely based on capoeira, a Brazilian sport that combines martial arts with dance, and a broad range of continuous movements of medium to high impact, applied at varying speeds and directions to increase heart rate and to load a variety of muscle groups and skeletal regions in upper and lower body. Occasional small prizes (e.g. balls, game vouchers) were provided to reward participation and improvement Comparator: control school children continued to undertake usual school activities over the course of the intervention year Duration of intervention: 9 months Duration of follow‐up: 21 months Number of schools: 2 Theoretical framework: — |
|
| Outcomes | BMI Fitness |
|
| Study registration | — | |
| Publication details |
Language of publication: English Funding: — Publication status: peer‐reviewed journal |
|
| Stated aim for study | "The aim of the current study then, was to test the efficacy of a brief, novel, and enjoyable bone‐ and fat‐targeted exercise program on parameters of bone, muscle and fat in healthy pre‐and peri‐pubertal boys over the course of a school year. The aim of the CAPO Kids intervention trial then was to determine the effect of a brief, simple, enjoyable, musculoskeletal‐ and fat‐targeted exercise programme on quantitative‐ultrasound‐derived bone quality, fat and metabolic health in pre‐ and early‐pubertal girls over the course of a school year" | |
| Notes | ||
| Risk of bias | ||
| Bias | Authors' judgement | Support for judgement |
| Random sequence generation (selection bias) | Low risk | Comment: coin toss used |
| Allocation concealment (selection bias) | Low risk | Comment: group allocation concealed from participants and investigators prior to randomisation [author communication] |
| Blinding of participants and personnel (performance bias) All outcomes | Low risk | Quote from publication: "control school participants were aware of neither the intervention activity nor the overall purpose of the study" |
| Blinding of outcome assessment (detection bias) All outcomes | High risk | Comment: testers were not blinded to intervention |
| Incomplete outcome data (attrition bias) Anthropometrics, Fitness | Low risk | Comment: overall loss to follow‐up was 9% and was related mainly to student relocation or absence from school on the days of testing |
| Selective reporting (reporting bias) | Unclear risk | Comment: no protocol published |
| Cluster RCT ‐ Recruitment bias | Low risk | Comment: students enrolled after randomisation, but almost complete enrolment |
| Cluster RCT ‐ Baseline imbalance | Low risk | Comment: adjusted for in analysis |
| Cluster RCT ‐ Loss of clusters | Low risk | Comment: no clusters lost |
| Cluster RCT ‐ Incorrect analysis | High risk | Comment: clustering not accounted for in analysis |
Santos 2014.
| Study characteristics | ||
| Methods | Study design: cluster‐RCT | |
| Participants |
School inclusion criteria: within the provincial jurisdiction, minimum of 200 students/school, and offering Grades 1 through 6 School exclusion criteria: — Student inclusion criteria: — Student exclusion criteria: consent not received or condition that limited participation in PA Setting: school, mix Age group: children Gender distribution: females and males Country/Countries where trial was performed: Canada |
|
| Interventions |
Intervention: an older class was paired with a younger class. Each week, older students received a 45‐minute healthy living lesson from their classroom teacher. Later that week, older students acted as peer mentors, teaching a 30‐minute lesson to their younger “buddies”. The “Go Move!” aspect included two 30‐minute structured aerobic fitness sessions/week, called fitness loops, with student pairs. Students were encouraged to complete the fitness loops at a vigorous intensity using perceived exertion scales. The “Go Fuel!” component included lessons about distinguishing nutritious from unhealthy (nutrient poor, energy‐rich) foods and beverages. As part of the “Go Feel Good!” component, students were taught to value themselves and classmates based on individual traits rather than on peer influence. The peer‐led model facilitated social skills, self‐esteem, and social responsibility Comparator: standard curriculum Duration of intervention: 7 months Duration of follow‐up: 7 months Number of schools: 20 Theoretical framework: — |
|
| Outcomes | BMI | |
| Study registration | NCT01979978 (retrospectively registered) | |
| Publication details |
Language of publication: English Funding: non‐commercial funding (governmental organisation) Publication status: peer‐reviewed journal |
|
| Stated aim for study | "The present study was designed to overcome these limitations by using a cluster‐randomised effectiveness trial to test the hypothesis that a school‐based, peer‐led healthy living program would reduce adiposity and increase PA among children" | |
| Notes | ||
| Risk of bias | ||
| Bias | Authors' judgement | Support for judgement |
| Random sequence generation (selection bias) | Low risk | Quote from publication: "schools were randomised in a computer‐generated random selection process and blocked to ensure equal representation from rural and First Nations (i.e. Indigenous) schools in both intervention and control arms" |
| Allocation concealment (selection bias) | Unclear risk | Comment: randomisation completed by investigator not involved in data collection; concealment unclear |
| Blinding of participants and personnel (performance bias) All outcomes | High risk | Comment: students and teachers not blinded |
| Blinding of outcome assessment (detection bias) All outcomes | Low risk | Comment: research assistants blinded to study assignment |
| Incomplete outcome data (attrition bias) Anthropometrics, Fitness | Low risk | Comment: low loss to follow‐up; no differences in outcome measures were noted between completers and non‐completers |
| Selective reporting (reporting bias) | Low risk | Comment: outcomes match clinical trial registry |
| Cluster RCT ‐ Recruitment bias | High risk | Comment: students enrolled after randomisation |
| Cluster RCT ‐ Baseline imbalance | Low risk | Comment: baseline differences controlled for |
| Cluster RCT ‐ Loss of clusters | High risk | Comment: 1 intervention school withdrew from the study |
| Cluster RCT ‐ Incorrect analysis | Low risk | Quote from publication: "all analyses were adjusted for random effect of student and within‐school clustering using a compound symmetry structure for the within‐student correlations" |
Toftager 2014.
| Study characteristics | ||
| Methods | Study design: cluster‐RCT | |
| Participants |
School inclusion criteria: all municipalities in the Region of Southern Denmark were invited; 5 municipalities (Esbjerg, Nordfyn, Varde, Vejle, and Sønderborg) accepted the invitation and were asked to enrol public schools that contained Grade 8 School exclusion criteria: schools that were placed in the countryside and had more than 50% of all students living farther than 2 km Euclidian distance from the school, had a majority of students that were non‐native Danish Student inclusion criteria: — Student exclusion criteria: — Setting: school, mix Age group: children/adolescents Gender distribution: females and males Country/Countries where trial was performed: Denmark |
|
| Interventions |
Intervention: intervention consisted of 11 intervention components changing the physical and organisational environment of schools. The multi‐component intervention was developed according to socioecological models of behavioural change and was constructed in accordance with existing knowledge‐based research and practical experiences from Danish school settings. A detailed written description of intervention components was delivered to all participating schools and included 4 physical environment changes and 7 organisational environment changes. Required physical environment changes included the following components:
Organisational environment changes included:
http://www.forebyggelsescenter.dk Comparator: — Duration of intervention: 2 years Duration of follow‐up: 2 years Number of schools: 14 Theoretical framework: socioecological model of behavioural change |
|
| Outcomes | PA duration Sedentary time Fitness |
|
| Study registration | ISRCTN79122411 | |
| Publication details |
Language of publication: English Funding: other funding (funded by a non‐profit organisation) Publication status: peer‐reviewed journal |
|
| Stated aim for study | "The aim of the School site, Play Spot, Active transport, Club fitness and Environment Study was to develop, document, and assess a comprehensive intervention in local school districts that promote everyday PA among 11‐ to 15‐year‐old adolescents" | |
| Notes | ||
| Risk of bias | ||
| Bias | Authors' judgement | Support for judgement |
| Random sequence generation (selection bias) | Low risk | Comment: drew lots [author communication] |
| Allocation concealment (selection bias) | High risk | Comment: allocation not concealed [author communication] |
| Blinding of participants and personnel (performance bias) All outcomes | High risk | Comment: participants not blinded to intervention group |
| Blinding of outcome assessment (detection bias) All outcomes | High risk | Comment: outcome assessors not blinded [author communication] |
| Incomplete outcome data (attrition bias) Anthropometrics, Fitness | Low risk | Quote from publication: "out of the participating adolescents at baseline 13% (N = 162) had moved to another school at follow‐up, and 2% (N = 27) withdrew consent" |
| Incomplete outcome data (attrition bias) Physical activity and sedentary time | Low risk | Quote from publication: "out of the participating adolescents at baseline 13% (N = 162) had moved to another school at follow‐up, and 2% (N = 27) withdrew consent" |
| Selective reporting (reporting bias) | Low risk | Comment: all main outcomes in protocol reported |
| Cluster RCT ‐ Recruitment bias | High risk | Comment: individuals recruited and baseline measures taken after randomisation |
| Cluster RCT ‐ Baseline imbalance | Low risk | Comment: no baseline differences between groups |
| Cluster RCT ‐ Loss of clusters | Low risk | Comment: no clusters lost |
| Cluster RCT ‐ Incorrect analysis | Low risk | Comment: clustering of students within schools was accounted for by including schools as a random effect in analyses |
Fairclough 2013.
| Study characteristics | ||
| Methods | Study design: cluster‐RCT | |
| Participants |
School inclusion criteria: within pre‐defined geographical units known as Neighbourhood Management Areas, 1 high and 1 low socioeconomic status school (defined as percentage of students per school eligible to receive free school meals) were randomly selected School exclusion criteria: — Student inclusion criteria: all children within Year 6 (10 to 11 years old) Student exclusion criteria: — Setting: school Age group: children Gender distribution: females and males Country/Countries where trial was performed: UK |
|
| Interventions |
Intervention: Children’s Health, Activity and Nutrition: Get Educated! curriculum consisted of 20 weekly lesson plans, worksheets, homework tasks, lesson resources, and a CD‐ROM. Lessons provided an opportunity for children to discuss, explore, and understand the meaning and practicalities of PA and nutrition as key elements of healthy lifestyles. The core message of the PA and sedentary behaviour components was “move more, sit less” with no specific prescription given as to what forms of PA the children should do. Nutrition components focused on topics such as energy balance, macronutrients, and eating behaviours. Homework tasks involved the whole family because formative work emphasised the importance of family support Comparator: classes in the comparison schools received normal instruction. This did not involve a specific unit of Personal, Social, and Health Education focused on healthy eating and PA, but concepts related to these areas may have been touched on informally during other lessons Duration of intervention: 20 weeks Duration of follow‐up: 8 months Number of schools: 12 Theoretical framework: social cognitive theory |
|
| Outcomes | PA duration Sedentary time Fitness BMI |
|
| Study registration | ISRCTN03863885 (retrospectively registered) | |
| Publication details |
Language of publication: English Funding: — Publication status: peer‐reviewed journal |
|
| Stated aim for study | "The Children’s Health, Activity and Nutrition: Get Educated! intervention was designed to promote healthy weight in primary school children through a teacher‐delivered curriculum‐based intervention with family involvement, focused on PA and dietary behaviour. The aim of this pragmatic evaluation was to assess the effectiveness of the Children’s Health, Activity and Nutrition: Get Educated! intervention on measures of body size, PA, and food intake" | |
| Notes | ||
| Risk of bias | ||
| Bias | Authors' judgement | Support for judgement |
| Random sequence generation (selection bias) | Low risk | Comment: random number generator used |
| Allocation concealment (selection bias) | High risk | Comment: not described |
| Blinding of participants and personnel (performance bias) All outcomes | High risk | Comment: students not blinded |
| Blinding of outcome assessment (detection bias) All outcomes | High risk | Comment: outcome assessors not blinded [author communication] |
| Incomplete outcome data (attrition bias) Anthropometrics, Fitness | High risk | Comment: large loss to follow‐up, bigger in intervention group |
| Incomplete outcome data (attrition bias) Physical activity and sedentary time | High risk | Comment: large loss to follow‐up, bigger in intervention group |
| Selective reporting (reporting bias) | Low risk | Comment: outcomes match with trial registry |
| Cluster RCT ‐ Recruitment bias | High risk | Comment: randomisation conducted prior to baseline measures |
| Cluster RCT ‐ Baseline imbalance | Low risk | Comment: baseline differences adjusted for in analyses |
| Cluster RCT ‐ Loss of clusters | High risk | Comment: 1 school lost from intervention group |
| Cluster RCT ‐ Incorrect analysis | Low risk | Quote from publication: "multilevel models can analyse the hierarchical nature of non‐independent, nested data by taking into account the dependency of observations. Children were defined as the first level unit of analysis, and school was the second level unit of analysis" |
Ford 2013.
| Study characteristics | ||
| Methods | Study design: RCT | |
| Participants |
Student inclusion criteria: aged 5 to 11 years, from 2 primary schools located within the southeast of England Student exclusion criteria: — Setting: school Age group: children Gender distribution: females and males Country/Countries where trial was performed: UK |
|
| Interventions |
Intervention: accumulated brisk walking programming during school time Comparator: normal school lessons during walking sessions, which involved seated literacy work Duration of intervention: 15 weeks Duration of follow‐up: 15 weeks Number of schools: 2 Theoretical framework: — |
|
| Outcomes | PA duration BMI |
|
| Study registration | — | |
| Publication details |
Language of publication: English Funding: — Publication status: peer‐reviewed journal |
|
| Stated aim for study | "The purpose of this study was to determine whether a 15‐week accumulated brisk walking programme, performed within a primary school setting, is effective in eliciting changes in body composition in 5‐ to 11‐year‐olds" | |
| Notes | ||
| Risk of bias | ||
| Bias | Authors' judgement | Support for judgement |
| Random sequence generation (selection bias) | Low risk | Quote from publication: "participants were divided into 2 groups using the random number generation function in SPSS" |
| Allocation concealment (selection bias) | Unclear risk | Comment: not described |
| Blinding of participants and personnel (performance bias) All outcomes | High risk | Comment: participants not blinded |
| Blinding of outcome assessment (detection bias) All outcomes | Unclear risk | Comment: not described |
| Incomplete outcome data (attrition bias) Anthropometrics, Fitness | Unclear risk | Comment: 22 dropped out; study authors do not indicate which group they were from |
| Incomplete outcome data (attrition bias) Physical activity and sedentary time | Unclear risk | Comment: 22 dropped out; study authors do not indicate which group they were from |
| Selective reporting (reporting bias) | Unclear risk | Comment: no protocol published |
Grydeland 2013.
| Study characteristics | ||
| Methods | Study design: cluster‐RCT | |
| Participants |
School inclusion criteria: more than 40 pupils in Grade 6 and located in the 3 or 4 largest towns or municipalities in the 7 counties surrounding the county of Oslo School exclusion criteria: — Student inclusion criteria: all Grade 6 students in 37 included schools Student exclusion criteria: — Setting: school Age group: children/adolescents Gender distribution: females and males Country/Countries where trial was performed: Norway |
|
| Interventions |
Intervention: collaboration with school principals, teachers, school health services, and parent committees to increase students' PA during school hours and leisure time, and to reduce screen time. Teachers held 1 structured lecture on energy balance; initiated 10‐minute PA breaks during class at least once/week; hung posters in classrooms; launched active commuting campaigns; distributed fact sheets to parents once per month; and implemented a computer‐tailored programme for students. Each school received an “Activity box” with sports equipment and toys to promote PA during recess Comparator: — Duration of intervention: 20 months Duration of follow‐up: 32 months Number of schools: 37 Theoretical framework: social cognitive theory and socioecological framework |
|
| Outcomes | PA duration Sedentary time BMI |
|
| Study registration | — | |
| Publication details |
Language of publication: English Funding: non‐commercial funding (research funding body) Publication status: peer‐reviewed journal |
|
| Stated aim for study | "The overall goal of the HEalth In Adolescents study was to design, implement, and evaluate a comprehensive, intervention programme to promote healthy weight development among young adolescent schoolchildren (11 to 13 year olds)" | |
| Notes | ||
| Risk of bias | ||
| Bias | Authors' judgement | Support for judgement |
| Random sequence generation (selection bias) | Low risk | Quote from publication: "schools were randomised by simple drawing" |
| Allocation concealment (selection bias) | Low risk | Quote from publication: "allocation could not be predetermined" |
| Blinding of participants and personnel (performance bias) All outcomes | High risk | Quote from publication: "neither participants nor investigators were blinded for condition" |
| Blinding of outcome assessment (detection bias) All outcomes | High risk | Quote from publication: "neither participants nor investigators were blinded for condition" |
| Incomplete outcome data (attrition bias) Anthropometrics, Fitness | Low risk | Comment: < 10% loss to follow‐up |
| Incomplete outcome data (attrition bias) Physical activity and sedentary time | Low risk | Comment: < 10% loss to follow‐up |
| Selective reporting (reporting bias) | Low risk | Comment: all outcomes in protocol paper reported |
| Cluster RCT ‐ Recruitment bias | High risk | Comment: schools were randomised prior to baseline data collection [author communication] |
| Cluster RCT ‐ Baseline imbalance | Low risk | Comment: no baseline differences |
| Cluster RCT ‐ Loss of clusters | Low risk | Comment: no clusters lost |
| Cluster RCT ‐ Incorrect analysis | Low risk | Comment: clustering accounted for in analysis |
Melnyk 2013.
| Study characteristics | ||
| Methods | Study design: cluster‐RCT | |
| Participants |
School inclusion criteria: 11 high schools from 2 school districts in the southwestern USA. The choice of schools was designed to provide diversity across race or ethnicity as well as socioeconomic status School exclusion criteria: — Student inclusion criteria: teens 14 to 16 years of age enrolled in a health class at 1 of 11 participating high schools, assented to participation, had a custodial parent who consented to the teen's participation in the study and optionally for himself or herself, could speak and read in English, parents could speak and read either Spanish or English Student exclusion criteria: a medical condition that would prevent participation in the PA component of the programme Setting: school Age group: adolescents Gender distribution: females and males Country/Countries where trial was performed: USA |
|
| Interventions |
Intervention: goal‐setting to promote engagement in healthy lifestyle behaviours and problem‐solving for typical adolescent challenges; educational content to increase teens' knowledge of how to lead a healthy lifestyle; homework to reinforce skills learned in the classroom; 20 minutes of PA within each of the 15 Creating Opportunities for Personal Empowerment components. Teachers chose types of physical activities, which commonly included movement within the classroom, brisk walking, dodge ball, kickball, obstacle courses, "Tank" (a game suggested by the research team), and basketball Comparator: Healthy Teens attention control curriculum was intended to promote knowledge of common adolescent health topics and health literacy. Content included pertinent health information for teens Duration of intervention: 15 weeks Duration of follow‐up: 10 months Number of schools: 11 Theoretical framework: cognitive‐behavioural theory |
|
| Outcomes | BMI | |
| Study registration | NCT01704768 | |
| Publication details |
Language of publication: English Funding: non‐commercial funding (governmental organisation) Publication status: peer‐reviewed journal |
|
| Stated aim for study | "The purpose of this study is to test the short and more long‐term efficacy of the Creating Opportunities for Personal Empowerment Healthy Lifestyles Thinking, Emotions, Exercise, Nutrition intervention, versus an attention control program (Healthy Teens) on the healthy lifestyle behaviours, BMI and BMI percentile, social skills, depressive or anxiety symptoms and academic performance of 779 culturally diverse high school teens enrolled in the southwest region of the USA for the ultimate purpose of preventing overweight or obesity, mental health disorders and poor academic functioning" | |
| Notes | ||
| Risk of bias | ||
| Bias | Authors' judgement | Support for judgement |
| Random sequence generation (selection bias) | Low risk | Comment: drawing names from a hat |
| Allocation concealment (selection bias) | Low risk | Comment: allocation could not be predetermined |
| Blinding of participants and personnel (performance bias) All outcomes | Low risk | Comment: students and teachers were blinded to intervention |
| Blinding of outcome assessment (detection bias) All outcomes | Low risk | Comment: outcome assessors were blinded [author communication] |
| Incomplete outcome data (attrition bias) Anthropometrics, Fitness | High risk | Comment: large loss to follow‐up; no description of handling missing data |
| Incomplete outcome data (attrition bias) Physical activity and sedentary time | High risk | Comment: large loss to follow‐up, no description of handling missing data |
| Selective reporting (reporting bias) | Low risk | Comment: all specified outcomes reported on |
| Cluster RCT ‐ Recruitment bias | Low risk | Comment: students blinded to group allocation |
| Cluster RCT ‐ Baseline imbalance | Low risk | Comment: baseline differences adjusted for |
| Cluster RCT ‐ Loss of clusters | Low risk | Comment: no clusters lost to follow‐up [author communication] |
| Cluster RCT ‐ Incorrect analysis | Low risk | Comment: clustering was accounted for in analysis as per protocol paper [author communication] |
Sacchetti 2013.
| Study characteristics | ||
| Methods | Study design: cluster‐RCT | |
| Participants |
School inclusion criteria: — School exclusion criteria: — Student inclusion criteria: Grade 3 Student exclusion criteria: — Setting: school Age group: children Gender distribution: females and males Country/Countries where trial was performed: Italy |
|
| Interventions |
Intervention: PA consisted of at least 30 minutes of physical exercise/d, divided between schoolyard (vigorous activity) and classroom (moderate activity). Twice weekly, a further 50 minutes of PE was spent in the gym, according to the standard curriculum of PE. On average, then, during school hours, children were engaged for around 45 minutes in specific PA, which was moderate Comparator: control group followed the standard programme of PE involving 2 lessons of around 50 minutes/week in the gym, taught by the ordinary classroom teacher Duration of intervention: 2 years Duration of follow‐up: 2 years Number of schools: 26 Theoretical framework: — |
|
| Outcomes | BMI | |
| Study registration | — | |
| Publication details |
Language of publication: English Funding: non‐commercial funding (governmental organisation) Publication status: peer‐reviewed journal |
|
| Stated aim for study | "The aim of this study was to assess whether a school‐based intervention of PA education was effective in improving physical abilities and influencing physical behavior in a representative group of primary school children. As a second aspect, the possible effect on body weight was considered. In the study, we compared the PA habits, the physical performances, and BMI measurements in an intervention group and a control group of children at baseline (age: 8 to 9 years) and after a 2‐year follow‐up (age: 10 to 11 years)" | |
| Notes | ||
| Risk of bias | ||
| Bias | Authors' judgement | Support for judgement |
| Random sequence generation (selection bias) | Low risk | Comment: computerised random number generator [author communication] |
| Allocation concealment (selection bias) | Low risk | Comment: allocation was concealed from participants and/or study personnel prior to randomisation [author communication] |
| Blinding of participants and personnel (performance bias) All outcomes | High risk | Comment: students not blinded |
| Blinding of outcome assessment (detection bias) All outcomes | High risk | Comment: outcome assessors were not blinded [author communication] |
| Incomplete outcome data (attrition bias) Anthropometrics, Fitness | Low risk | Quote from publication: "any loss to follow‐up was due to children who moved to other schools (14.2% and 13.9% respectively in intervention and control groups)" |
| Selective reporting (reporting bias) | Unclear risk | Comment: no protocol published |
| Cluster RCT ‐ Recruitment bias | High risk | Comment: clusters randomised before individuals recruited |
| Cluster RCT ‐ Baseline imbalance | Low risk | Quote from publication: "both in boys and girls, no significant differences were found between the intervention and control groups in age, BMI, and frequency and duration of the practice of extra scholastic sports" |
| Cluster RCT ‐ Loss of clusters | Low risk | Comment: no loss of clusters reported |
| Cluster RCT ‐ Incorrect analysis | High risk | Comment: clustering not accounted for in analysis |
Siegrist 2013.
| Study characteristics | ||
| Methods | Study design: cluster‐RCT | |
| Participants |
School inclusion criteria: primary schools throughout Bavaria, Germany School exclusion criteria: none Student inclusion criteria: attendance in Grade 2 or 3 and written consent from parents Student exclusion criteria: — Setting: school Age group: children Gender distribution: females and males Country/Countries where trial was performed: Germany |
|
| Interventions |
Intervention: the focus of the multi‐faceted JuvenTUM intervention was on directly educating and encouraging children, teachers, and parents to live active and healthy lifestyles. Additionally, school environmental settings (e.g. physical environment, organisation of school breaks, playing during school time, sports facilities) were altered to promote more PA. http://www.juventum.med.tum.de/ Comparator: principals were instructed to continue with school activities as usual, without changing policies related to PA or nutrition during the study period Duration of intervention: 1 year Duration of follow‐up: 1 year Number of schools: 8 Theoretical framework: — |
|
| Outcomes | BMI | |
| Study registration | — | |
| Publication details |
Language of publication: English Funding: non‐commercial funding (governmental organisation) Publication status: peer‐reviewed journal |
|
| Stated aim for study | "The aim of the present project was to evaluate a simple and ubiquitously applicable school‐based educational program to increase PA, fitness, and lifestyle awareness and to improve health obesity measures" | |
| Notes | ||
| Risk of bias | ||
| Bias | Authors' judgement | Support for judgement |
| Random sequence generation (selection bias) | Low risk | Comment: schools randomised by drawing a lot [author communication] |
| Allocation concealment (selection bias) | Low risk | Comment: allocation was concealed, and recruitment was based on willingness to be randomised to either group [author communication] |
| Blinding of participants and personnel (performance bias) All outcomes | High risk | Comment: participants not blinded to intervention |
| Blinding of outcome assessment (detection bias) All outcomes | Low risk | Comment: outcome assessors were not aware of group allocation [author communication] |
| Incomplete outcome data (attrition bias) Anthropometrics, Fitness | Low risk | Comment: children with missing data were ill or were absent from school or had left school |
| Selective reporting (reporting bias) | Unclear risk | Comment: no protocol available or trial registered |
| Cluster RCT ‐ Recruitment bias | High risk | Comment: individual students enrolled after randomisation at school level [author communication] |
| Cluster RCT ‐ Baseline imbalance | Low risk | Comment: intervention and control schools were comparable with regard to socioeconomic status of the population and recreational environments |
| Cluster RCT ‐ Loss of clusters | Low risk | Comment: no clusters lost |
| Cluster RCT ‐ Incorrect analysis | High risk | Comment: analysis did not account for cluster design |
Aburto 2011.
| Study characteristics | ||
| Methods | Study design: cluster‐RCT | |
| Participants |
School inclusion criteria: located in the south of Mexico City, classified by the Secretary of Public Education as low socioeconomic status, received benefits from the Federal School Breakfast Program, demonstrated minimum facilities necessary for execution of the intervention, possessed the standard Secretary of Public Education–issued set of sports equipment, enrolled at least 350 students, and consisted of 2 or more classrooms/grades School exclusion criteria: — Student inclusion criteria: all students in Grades 4 and 5 Student exclusion criteria: — Setting: school, urban Age group: children Gender distribution: females and males Country/Countries where trial was performed: Mexico |
|
| Interventions |
Intervention 1 ‐ Basic: environmental and policy changes at the school level meant to foster an environment conducive to increased PA. These changes were complemented with an educational campaign to increase students’ and school staff’s awareness of the importance of PA for health Intervention 2 ‐ Plus: all components of the basic intervention plus additional changes requiring more resources such as an added daily exercise session held before classes began, in which all students participated Comparator: control group experienced no change to the standard practices of public schools in Mexico City related to PE (once/week) and recess (non‐existent) Duration of intervention: 6 months Duration of follow‐up: 6 months Number of schools: 27 Theoretical framework: reciprocal determinism |
|
| Outcomes | BMI Fitness |
|
| Study registration | — | |
| Publication details |
Language of publication: English Funding: non‐commercial funding (governmental organisation) Publication status: peer‐reviewed journal |
|
| Stated aim for study | "The objective of this investigation was to test the effect of a school‐based environmental intervention on PA and physical fitness of students attending public primary schools in Mexico City" | |
| Notes | ||
| Risk of bias | ||
| Bias | Authors' judgement | Support for judgement |
| Random sequence generation (selection bias) | Low risk | Quote from publication: "using a statistical program to draw a random sample from the complete list of eligible schools, 27 schools were randomly chosen for inclusion. Using the same program to draw 3 samples from the 27, the 3 intervention groups were randomly generated" |
| Allocation concealment (selection bias) | Unclear risk | Comment: not described |
| Blinding of participants and personnel (performance bias) All outcomes | High risk | Quote from publication: "the nature of the environmental intervention precluded blinding of the participants or field staff" |
| Blinding of outcome assessment (detection bias) All outcomes | High risk |
Quote from publication: "data analysts and researchers were blinded to the meaning of all numeric codes until data analyses were complete" Comment: outcome assessors not blinded |
| Incomplete outcome data (attrition bias) Anthropometrics, Fitness | Low risk | Comment: low loss to follow‐up for outcome measures |
| Selective reporting (reporting bias) | High risk | Comment: anthropometry not reported; only P value for fitness |
| Cluster RCT ‐ Recruitment bias | High risk | Comment: data collected after randomisation |
| Cluster RCT ‐ Baseline imbalance | Low risk | Comment: accounted for in analysis |
| Cluster RCT ‐ Loss of clusters | High risk | Comment: 3 clusters from control group lost to follow up due to time constraints |
| Cluster RCT ‐ Incorrect analysis | Low risk | Quote from publication: "robust standard error accounting for the design effect of school were calculated" |
Ardoy 2011.
| Study characteristics | ||
| Methods | Study design: cluster‐RCT | |
| Participants |
School inclusion criteria: — School exclusion criteria: — Student inclusion criteria: age 12 to 14, enrolled in first year of secondary school Student exclusion criteria: partial injury or illness or chronic disease that prevented involvement in PE classes Setting: school Age group: adolescents Gender distribution: females and males Country/Countries where trial was performed: Spain |
|
| Interventions |
Intervention 1: experimental group 1 doubled the academic load stipulated for this subject (4 sessions/week). Experimental group 1 was taught in the same sessions as the control group, doubling the volume of booster sessions with the same objectives, content, and methods. For practical matters and questions of viability, extra sessions were carried out during the afternoon, under the same conditions, and in the same facilities as the usual sessions (held during the morning). Sessions were carried out in accordance with the established curriculum, with approval of the educational institution and the parents Intervention 2: experimental group 2 also received 4 sessions/week in which there was special emphasis on increasing the intensity of sessions. Experimental group 2 objectives and content were the same, but with high intensity across all sessions. For practical matters and questions of viability, extra sessions were carried out during the afternoon, under the same conditions, and in the same facilities as the usual sessions (held during the morning). Sessions were carried out in accordance with the established curriculum, with approval of the educational institution and the parents Comparator: control group received 2 sessions of PE/week as established by regulations currently in force in Spain. For all groups, content included the same teaching units (subjects) and sessions on physical fitness and health, games and sports, personal driving qualities, movement, and environmental activities. This intervention was designed to adhere closely to characteristics and context of educational content to obtain results of great application and transfer to national education policies Duration of intervention: 16 weeks Duration of follow‐up: 16 weeks Number of schools: 1 Theoretical framework: social cognitive theory, information‐motivation behavioural skills model, control theory, theory of planned behaviour |
|
| Outcomes | BMI Fitness |
|
| Study registration | NCT01098968 (retrospectively registered) | |
| Publication details |
Language of publication: Spanish Funding: non‐commercial funding (governmental organisation) Publication status: peer‐reviewed journal |
|
| Stated aim for study | "The purpose of the present study is to examine the effect on physical fitness and body composition of: a) doubling the number of sessions of PE/week; b) doubling the number of sessions of PE/week plus increasing their intensity; and c) increasing the intensity of the sessions, while maintaining the same number/week" | |
| Notes | ||
| Risk of bias | ||
| Bias | Authors' judgement | Support for judgement |
| Random sequence generation (selection bias) | Unclear risk | Comment: not described |
| Allocation concealment (selection bias) | Unclear risk | Comment: not described |
| Blinding of participants and personnel (performance bias) All outcomes | High risk | Comment: students could not be blinded |
| Blinding of outcome assessment (detection bias) All outcomes | Low risk | Comment: randomisation was blinded for those who performed the outcome assessment |
| Incomplete outcome data (attrition bias) Anthropometrics, Fitness | Low risk | Comment: minimal missing data and very few dropouts in each group |
| Selective reporting (reporting bias) | Low risk | Comment: all outcomes specified in protocol paper reported on |
| Cluster RCT ‐ Recruitment bias | Unclear risk | Comment: unclear when baseline data were collected |
| Cluster RCT ‐ Baseline imbalance | Low risk | Comment: secondary analysis adjusted for age |
| Cluster RCT ‐ Loss of clusters | Low risk | Comment: no clusters lost |
| Cluster RCT ‐ Incorrect analysis | High risk | Comment: clustering within classes not accounted for in analysis. |
de Heer 2011.
| Study characteristics | ||
| Methods | Study design: cluster‐RCT | |
| Participants |
School inclusion criteria: schools in El Paso, Texas, were selected according to school location (for logistical purposes, half of those chosen were located within 5 miles of the University of Texas at El Paso campus), size, socioeconomic status, and percentage of children with limited English proficiency School exclusion criteria: — Student inclusion criteria: enrolled in 1 of the target grades (3 to 5) and had no condition that would endanger their own or others’ safety Student exclusion criteria: — Setting: school Age group: children Gender distribution: females and males Country/Countries where trial was performed: USA |
|
| Interventions |
Intervention: a 20‐ to 30‐minute health education component followed by 45 to 60 minutes of PA after school in the schoolyard or in the multi‐purpose room using a bilingual health education curriculum, Bienestar (well‐being), that is, culturally targeted to Mexican Americans. The curriculum included modules on healthy eating, exercise, diabetes, and self‐esteem. Activities for the programme emphasised cardiovascular activity and aerobic recreational games Comparator 1: students received Grade 4 health workbooks and incentives at pretest and follow‐up measurements, but they did not attend after‐school sessions Comparator 2 (spillover control group): students were in an intervention classroom but declined an invitation to participate in the after‐school programme. Students received Grade 4 health workbooks and incentives at pretest and follow‐up measurements, but they did not attend after‐school sessions Duration of intervention: 12 weeks Duration of follow‐up: 4 months Number of schools: 6 Theoretical framework: social cognitive theory |
|
| Outcomes | BMI Fitness |
|
| Study registration | — | |
| Publication details |
Language of publication: English Funding: non‐commercial funding (research funding body) Publication status: peer‐reviewed journal |
|
| Stated aim for study | "We developed, implemented, and evaluated a culturally tailored health education and PA after‐school program for a population of predominantly Hispanic elementary school children" | |
| Notes | ||
| Risk of bias | ||
| Bias | Authors' judgement | Support for judgement |
| Random sequence generation (selection bias) | Low risk | Comment: random number generator in excel [author communication] |
| Allocation concealment (selection bias) | Low risk | Comment: enrolment and baseline assessment prior to generation of randomisation sequence [author communication] |
| Blinding of participants and personnel (performance bias) All outcomes | High risk | Comment: students could not be blinded |
| Blinding of outcome assessment (detection bias) All outcomes | High risk | Comment: project staff collected these measurements in collaboration with each school’s PE teachers during PE classes (not blinded) |
| Incomplete outcome data (attrition bias) Anthropometrics, Fitness | High risk | Comment: differential loss to follow up; did not present imputed analysis |
| Selective reporting (reporting bias) | Unclear risk | Comment: no protocol paper; appears all outcomes are reported |
| Cluster RCT ‐ Recruitment bias | Low risk | Comment: enrolment and baseline assessment prior to generation of randomisation sequence [author communication] |
| Cluster RCT ‐ Baseline imbalance | Low risk | Comment: models adjusted for baseline imbalance |
| Cluster RCT ‐ Loss of clusters | Low risk | Comment: no clusters lost [author communication] |
| Cluster RCT ‐ Incorrect analysis | Low risk | Comment: analysis accounted for clustering of students within classrooms and classrooms within schools |
Jago 2011.
| Study characteristics | ||
| Methods | Study design: cluster‐RCT | |
| Participants |
School inclusion criteria: student body at least 50% minority (African American, Hispanic or Latino, and/or American Indian) and/or greater than 50% eligible for free or reduced lunch; annual student attrition from all causes is ≤ 25%; expected cohort size at end of study is at least 50 per school; school authorities willing to accept randomisation, permit grade‐wide data collection, and assist with mass mailings to students' homes; possess Federal Wide Assurance to conduct research and agree to adhere to the protocol; schools must also have at least 1 play area that satisfied intervention requirements School exclusion criteria: — Student inclusion criteria: enrolled in Grade 6 in fall 2006, able to participate in school’s standard PE programme, not previously diagnosed with diabetes, providing parent's or guardian’s informed consent and minor child informed assent to participate in data collection and evaluation procedures Student exclusion criteria: — Setting: school Age group: children Gender distribution: females and males Country/Countries where trial was performed: USA |
|
| Interventions |
Intervention: intervention had 4 integrated components. The first component was change in the total school food environment. The second component was a programme of peer‐led, teacher‐facilitated learning activities. The third component was a social marketing campaign that had a different theme for each semester of the intervention. The fourth element was a revised, more active PE curriculum. Schools also received around $10,000 of equipment and a teacher assistant to facilitate small‐group activities that were intended to increase activity time during sessions Comparator: control group activities were limited to recruitment and data collection only Duration of intervention: 2.5 years Duration of follow‐up: 2.5 years Number of schools: 42 Theoretical framework: developmental learning frameworks |
|
| Outcomes | Fitness BMI |
|
| Study registration | NCT00458029 (retrospectively registered) | |
| Publication details |
Language of publication: English Funding: non‐commercial funding (research funding body) Publication status: peer‐reviewed journal |
|
| Stated aim for study | "HEALTHY was a primary prevention trial with a public health objective of preventing the development of risk factors for type 2 diabetes in adolescents" | |
| Notes | ||
| Risk of bias | ||
| Bias | Authors' judgement | Support for judgement |
| Random sequence generation (selection bias) | Low risk | Comment: coordinating centre developed randomisation scheme |
| Allocation concealment (selection bias) | Low risk | Comment: randomisation occurred at a coordinating centre |
| Blinding of participants and personnel (performance bias) All outcomes | Low risk | Comment: study took measures to mask intervention to both students and parents |
| Blinding of outcome assessment (detection bias) All outcomes | Low risk | Comment: separate study staff not aware of treatment assignment administered data collection protocols |
| Incomplete outcome data (attrition bias) Anthropometrics, Fitness | Low risk | Comment: loss to follow‐up similar between groups; most often due to transfer to another school |
| Selective reporting (reporting bias) | Low risk | Comment: all outcomes reported on |
| Cluster RCT ‐ Recruitment bias | Low risk | Comment: students enrolled after randomisation, but investigators attempted to mask students and parents to school assignment |
| Cluster RCT ‐ Baseline imbalance | Low risk | Comment: baseline balance; models adjusted for confounders |
| Cluster RCT ‐ Loss of clusters | Low risk | Comment: no clusters lost |
| Cluster RCT ‐ Incorrect analysis | Low risk | Comment: analyses accounted for clustered design |
Jansen 2011.
| Study characteristics | ||
| Methods | Study design: cluster‐RCT | |
| Participants |
School inclusion criteria: schools in more deprived inner‐city areas with high proportions of immigrant children in the city of Rotterdam School exclusion criteria: schools that could not be paired based on size, proportion of migrants, and neighbourhood Student inclusion criteria: Grades 3 to 8 Student exclusion criteria: — Setting: school, urban Age group: children/adolescents Gender distribution: females and males Country/Countries where trial was performed: The Netherlands |
|
| Interventions |
Intervention: 4 components: (1) implementation of 3 PE sessions/week by a PE teacher; (2) organisation of additional voluntary sport and play activities outside school hours; (3) classroom education with 3 main lessons on healthy nutrition, active living, and healthy lifestyle choices adapted for each grade. Each lesson finishes with joint goal‐setting, and individual counselling by the school nurse is offered if needed; (4) health promotion gathering at the beginning of the school year for parents and involvement of local sport clubs Comparator: continued with usual curriculum: 2 PE sessions/week by classroom teacher or a PE teacher, dependent on school policy Duration of intervention: 1 school year Duration of follow‐up: 1 school year Number of schools: 20 Theoretical framework: theory of planned behaviour and ecological model |
|
| Outcomes | BMI Fitness |
|
| Study registration | ISRCTN84383524 (retrospectively registered) | |
| Publication details |
Language of publication: English Funding: — Publication status: peer‐reviewed journal |
|
| Stated aim for study | "The purpose of this study was to evaluate the effect of a school‐based intervention program to reduce overweight and improve fitness in primary school children" | |
| Notes | ||
| Risk of bias | ||
| Bias | Authors' judgement | Support for judgement |
| Random sequence generation (selection bias) | Low risk | Quote from publication: "randomisation took place within each pair with the toss of a coin by an officer of the municipal education service" |
| Allocation concealment (selection bias) | Low risk | Comment: randomisation was done with a coin toss; participants could not foresee assignment |
| Blinding of participants and personnel (performance bias) All outcomes | High risk | Comment: blinding was not feasible based on nature of intervention |
| Blinding of outcome assessment (detection bias) All outcomes | High risk | Comment: blinding was not feasible due to the presence of a PE teacher during PE class in intervention schools |
| Incomplete outcome data (attrition bias) Anthropometrics, Fitness | Low risk | Comment: very low dropout; missing data not described but were imputed in analysis |
| Selective reporting (reporting bias) | Low risk | Comment: all specified outcomes reported |
| Cluster RCT ‐ Recruitment bias | High risk | Comment: schools were randomised prior to baseline data collection [author communication] |
| Cluster RCT ‐ Baseline imbalance | Low risk | Comment: baseline differences adjusted for |
| Cluster RCT ‐ Loss of clusters | High risk | Comment: 6 clusters lost after randomisation |
| Cluster RCT ‐ Incorrect analysis | Low risk | Comment: multi‐level analyses were used to allow for clustering of observations within schools |
Magnusson 2011.
| Study characteristics | ||
| Methods | Study design: cluster‐RCT | |
| Participants |
School inclusion criteria: 3 pairs of schools in the city of Reykjavik were selected and matched for size (i.e. number of students and total number of grades, with at least 30 students entering Grade 2 in 2006) School exclusion criteria: — Student inclusion criteria: all children attending Grade 2 Student exclusion criteria: — Setting: school Age group: children Gender distribution: females and males Country/Countries where trial was performed: Iceland |
|
| Interventions |
Intervention: students had opportunities to engage in PA during PE lessons, during recess, and during classes where PA was to be integrated into various subjects of the general curriculum. Teachers at intervention schools were provided access to PA equipment intended to be used during regular school lessons. Teaching materials promoting PA, such as books and DVDs on classroom workouts and cooperative activity games, etc., were provided. After the first year of intervention, an additional PE lesson was introduced at the intervention schools. PE teachers at each of the intervention schools carried out this additional lesson, which was specifically tailored to suit all children while maintaining a high level of intensity Comparator: followed general PA curriculum, compulsory on a national level, consisting of two 40‐minute PE sessions/week, in addition to 2 swimming lessons/week, taught over the course of a 6‐week period any time during the school year Duration of intervention: 2 years Duration of follow‐up: 2 years Number of schools: 6 Theoretical framework: social cognitive theory |
|
| Outcomes | BMI Fitness PA duration |
|
| Study registration | — | |
| Publication details |
Language of publication: English Funding: non‐commercial funding (research funding body) Publication status: peer‐reviewed journal |
|
| Stated aim for study | "The objectives of this study were to compare changes in volume and intensity of PA among the group of intervention children to PA levels of children who only received general curriculum‐based PA (controls) and further, to assess whether the intervention effect on PA was modified by gender or BMI" | |
| Notes | ||
| Risk of bias | ||
| Bias | Authors' judgement | Support for judgement |
| Random sequence generation (selection bias) | Unclear risk | Comment: not described |
| Allocation concealment (selection bias) | Unclear risk | Comment: not described |
| Blinding of participants and personnel (performance bias) All outcomes | High risk | Comment: blinding not possible |
| Blinding of outcome assessment (detection bias) All outcomes | Unclear risk | Comment: not described |
| Incomplete outcome data (attrition bias) Anthropometrics, Fitness | High risk | Comment: large quantity of missing data; reasons not provided |
| Incomplete outcome data (attrition bias) Physical activity and sedentary time | High risk | Comment: large quantity of missing data; reasons not provided |
| Selective reporting (reporting bias) | Unclear risk | Comment: protocol not published |
| Cluster RCT ‐ Recruitment bias | High risk | Comment: schools recruited and randomised 8 months before baseline measurements |
| Cluster RCT ‐ Baseline imbalance | Unclear risk | Comment: adjusted for BMI; many others not considered (e.g. only half of participants had data on socioeconomic status) |
| Cluster RCT ‐ Loss of clusters | Unclear risk | Comment: not described |
| Cluster RCT ‐ Incorrect analysis | Low risk | Comment: clustering accounted for in analysis |
Okely 2011.
| Study characteristics | ||
| Methods | Study design: cluster‐RCT | |
| Participants |
School inclusion criteria: secondary schools in New South Wales that submitted an expression of interest and completed a profile used to pair‐match schools School exclusion criteria: — Student inclusion criteria: girls, formally enrolled in Grade 8 within participating schools, provided written consent from themselves and their parent(s) or guardian(s) Student exclusion criteria: — Setting: school Age group: adolescents Gender distribution: females Country/Countries where trial was performed: Australia |
|
| Interventions |
Intervention: schools developed and implemented unique 18‐month action plans with a member of the research team. Intervention strategies were designed to prevent a decline in participation in MVPA levels among girls over the course of the intervention. Each school followed an identical process in developing the intervention, which involved developing an action learning team and the school‐specific action plan. The action plan addressed formal curriculum, school environment, and links with the community. During intervention, schools participated in monthly meetings with a member of the research team to share their progress towards study outcomes Comparator: continuation of their usual programmes Duration of intervention: 18 months Duration of follow‐up: 18 months Number of schools: 25 Theoretical framework: health‐promoting schools framework |
|
| Outcomes | PA duration Sedentary time |
|
| Study registration | ACTRN12610001077055 | |
| Publication details |
Language of publication: English Funding: non‐commercial funding (governmental organisation) Publication status: peer‐reviewed journal |
|
| Stated aim for study | "The primary aim of the study was to test if an 18‐month school‐based intervention targeting school sport and PE (through the formal curriculum), school ethos (including policies and school breaks such as lunchtime), and links with the local community, could prevent the decline in objectively measured PA compared with matched control schools" | |
| Notes | ||
| Risk of bias | ||
| Bias | Authors' judgement | Support for judgement |
| Random sequence generation (selection bias) | Low risk | Comment: randomisation using a computer‐based random number algorithm |
| Allocation concealment (selection bias) | High risk | Comment: not clear, but 1 matched school replaced a lost cluster |
| Blinding of participants and personnel (performance bias) All outcomes | Low risk | Comment: teachers and students blinded to matched comparison schools |
| Blinding of outcome assessment (detection bias) All outcomes | Low risk | Comment: trained data collectors were blinded to group allocation |
| Incomplete outcome data (attrition bias) Physical activity and sedentary time | Low risk | Comment: small number lost to end of study testing without reason; similar between groups. Missing accelerometer data imputed |
| Selective reporting (reporting bias) | Low risk | Comment: all outcomes reported in protocol paper published |
| Cluster RCT ‐ Recruitment bias | High risk | Comment: randomisation completed prior to baseline data collection |
| Cluster RCT ‐ Baseline imbalance | Unclear risk | Comment: not assessed |
| Cluster RCT ‐ Loss of clusters | High risk | Comment: 1 cluster lost from control group |
| Cluster RCT ‐ Incorrect analysis | Low risk | Comment: all analyses accounted for hierarchical structure of data |
Thivel 2011.
| Study characteristics | ||
| Methods | Study design: cluster‐RCT | |
| Participants |
School inclusion criteria: local public schools School exclusion criteria: — Student inclusion criteria: children in Grade 1 or 2, taking part in standard PE classes offered by the school, not participating in more than 3 hours of extracurricular sports activity/week, free of any known disease, not involved in any other study Student exclusion criteria: — Setting: school Age group: children Gender distribution: females and males Country/Countries where trial was performed: France |
|
| Interventions |
Intervention: PA programme consisted of 120 minutes (2 times for 60 minutes) of supervised physical exercise in addition to 2 hours of PE classes/week. Sessions consisted of a 10‐minute warm‐up followed by psychometric activities and exercises to improve coordination, flexibility, strength, speed, and endurance. Content of the programme was designed to enhance pleasure and enjoyment during exercise, to encourage children’s participation in PA during the intervention, but also to motivate them to maintain an active lifestyle on a long‐term basis. The main objectives of sessions were to increase time spent in PA and to minimise inactivity Comparator: followed their habitual 2 hours of PE/week Duration of intervention: 6 months Duration of follow‐up: 6 months Number of schools: 19 Theoretical framework: — |
|
| Outcomes | BMI Fitness |
|
| Study registration | — | |
| Publication details |
Language of publication: English Funding: non‐commercial funding (governmental organisation) Publication status: peer‐reviewed journal |
|
| Stated aim for study | "The aim of this study was to explore the effect of a 6‐month school‐based PA intervention on obese and lean children’s body composition and physical fitness" | |
| Notes | ||
| Risk of bias | ||
| Bias | Authors' judgement | Support for judgement |
| Random sequence generation (selection bias) | Low risk | Comment: computer‐generated [author communication] |
| Allocation concealment (selection bias) | High risk | Comment: allocation not concealed [author communication] |
| Blinding of participants and personnel (performance bias) All outcomes | Low risk | Quote from publication: "children in control group were not aware of intervention group" |
| Blinding of outcome assessment (detection bias) All outcomes | High risk | Comment: outcome assessors not blinded [author communication] |
| Incomplete outcome data (attrition bias) Anthropometrics, Fitness | High risk | Comment: sample size of 457 from original 650 participants [suthor communication] |
| Selective reporting (reporting bias) | Unclear risk | Comment: no protocol published |
| Cluster RCT ‐ Recruitment bias | High risk | Comment: students were enrolled after randomisation [author communication] |
| Cluster RCT ‐ Baseline imbalance | Low risk | Comment: no baseline differences between groups [author communication] |
| Cluster RCT ‐ Loss of clusters | Low risk | Comment: no clusters lost [author communication] |
| Cluster RCT ‐ Incorrect analysis | High risk | Comment: clustering not accounted for in analysis |
Wilson 2011.
| Study characteristics | ||
| Methods | Study design: cluster‐RCT | |
| Participants |
School inclusion criteria: middle schools in South Carolina paired on school size, percentage of minorities, proportion of free and reduced lunches, and urban or rural setting School exclusion criteria: — Student inclusion criteria: all Grade 6 students in 24 public middle schools with parental consent who agreed to study participation and random assignment Student exclusion criteria: a medical condition that interfered with PA, developmentally delayed such that intervention materials were not cognitively appropriate, currently in treatment for a psychiatric disorder Setting: grade school, home Age group: children Gender distribution: females and males Country/Countries where trial was performed: USA |
|
| Interventions |
Intervention: Active by Choice Today, a 17‐week programme implemented on Mondays, Tuesdays, and Thursdays for 2 hours after school. On Wednesdays, students practised what they had learned in the after‐school programme in their home environment. A trained team leader, with expertise in implementing PAs among youth, provided the structure for implementation of the Active by Choice Today intervention programme. The programme had 3 main components: homework or snack (30 minutes); MVPA (60 minutes) that students selected each week; and a behavioural skills and motivational component (30 minutes) during which intervention staff worked with participants on developing strategies for increasing MVPA in their home environment. The Active by Choice Today intervention specifically targeted development of behavioural skills (communication, reciprocity of social support, group goal‐setting, and behavioral competence) for increasing PA outside of programme days. In addition, the Active by Choice Today after‐school programme social environment (autonomy, choice, participation, belongingness, fun, enjoyment, and support) was designed to have a positive impact on cognitive mediators (self‐confidence, perceived competence) and motivational orientation (intrinsic motivation, commitment, positive self‐concept) to promote long‐term PA behaviour Comparator: General Health Education Programme (comparison programme) focused on nutrition, stress management, drug prevention, and dropout prevention (with no PA component). Programme consisted of homework or a snack (30 minutes) and 3 hands‐on activities related to general health (30 minutes each). The comparison programme was held on the same days and times as the Active by Choice Today intervention programme Duration of intervention: 17 weeks Duration of follow‐up: 19 weeks Number of schools: 24 Theoretical framework: social cognitive theory and self‐determination theory |
|
| Outcomes | PA duration | |
| Study registration | NCT01028144 (retrospectively registered) | |
| Publication details |
Language of publication: English Funding: non‐commercial funding (this article was supported by a grant (R01 HD 045693) funded by the National Institutes of Child Health and Human Development to D. K. W.) Publication status: peer‐reviewed journal |
|
| Stated aim for study | "The primary aim of this study was to determine the efficacy of the motivational and behavioral skills Active by Choice Today intervention (vs a control program – general health education) on increasing PA at 2‐week post‐intervention (primary outcome) and at mid‐intervention (intermediate outcome) in underserved adolescents" | |
| Notes | ||
| Risk of bias | ||
| Bias | Authors' judgement | Support for judgement |
| Random sequence generation (selection bias) | Unclear risk | Comment: no description of the randomisation process given |
| Allocation concealment (selection bias) | Low risk | Comment: all participants were allocated at 1 point in time following recruitment, so at time of recruitment, allocation was not known |
| Blinding of participants and personnel (performance bias) All outcomes | Unclear risk | Comment: not described |
| Blinding of outcome assessment (detection bias) All outcomes | Low risk | Quote from publication: "baseline measures were obtained by blinded measurement staff" |
| Incomplete outcome data (attrition bias) Physical activity and sedentary time | Low risk | Comment: did intention‐to‐treat analysis; also provided details on dropouts |
| Selective reporting (reporting bias) | Low risk | Comment: specified primary outcomes reported on |
| Cluster RCT ‐ Recruitment bias | Low risk | Comment: baseline measures were obtained prior to randomisation |
| Cluster RCT ‐ Baseline imbalance | Low risk | Comment: groups similar at baseline |
| Cluster RCT ‐ Loss of clusters | Low risk | Comment: no clusters lost |
| Cluster RCT ‐ Incorrect analysis | Low risk | Quote from publication: "mixed ANCOVAs with random effects appropriate for group randomised trials were used" |
Kriemler 2010.
| Study characteristics | ||
| Methods | Study design: cluster‐RCT | |
| Participants |
School inclusion criteria: rural or urban localisation, prevalence of 10% to 30% migrants as in the Swiss population, and, for practical reasons, presence of at least a Grade 1 and a Grade 5 class in each school. Intervention; control schools were located in provinces that were comparable as regards socioeconomic status of the population and recreational facilities at school School exclusion criteria: — Student inclusion criteria: Grades 1 and 5 students in participating schools Student exclusion criteria: — Setting: schools, urban and rural Age group: children Gender distribution: females and males Country/Countries where trial was performed: Switzerland |
|
| Interventions |
Intervention: all children participated in 3 mandatory, 45‐minute PE lessons/week; intervention group participated in 2 additional 45‐minute PE lessons/week. Mandatory PE lessons were given by the usual classroom teachers according to the specified curriculum; additional lessons were taught mostly outdoors by PE teachers. Three to five 2‐ to 5‐minute activity breaks (motor skill tasks ‐ jumping or balancing on 1 leg, power games, coordinative tasks) were provided each day during academic lessons. Children also received daily PA homework (10 minutes' worth) prepared by PE teachers, including aerobic, strength, or motor skill tasks (e.g. brushing teeth while standing on 1 leg, hopping up and down the stairs, jumping rope comparable activities) Comparator: control group continued to participate in the usual, mandatory PE lessons (45 minutes, 3 times/week); they were not informed that an intervention group existed in the other schools (teachers in the control group were aware but did not know the content of the intervention) Duration of intervention: 9 months Duration of follow‐up: 9 months Number of schools: 15 Theoretical framework: socioecological conceptual model |
|
| Outcomes | PA duration Fitness BMI |
|
| Study registration | ISRCTN15360785 (registered retrospectively) | |
| Publication details |
Language of publication: English Funding: non‐commercial funding (Swiss Federal Office of Sports (grant number SWI05‐013), Swiss National Science Foundation (grant number PMPDB‐114401), and Diabetes Foundation of the Region of Basel) Publication status: peer‐reviewed journal |
|
| Stated aim for study | "Our goal was to intervene at the level of the school class, so we did a cluster RCT with a school based stringent PA programme versus traditional PE during 1 school year. We aimed to increase aerobic fitness, PA, and quality of life while decreasing body fat and a composite cardiovascular risk factor score in the intervention group compared with the control group" | |
| Notes | ||
| Risk of bias | ||
| Bias | Authors' judgement | Support for judgement |
| Random sequence generation (selection bias) | Low risk | Comment: randomised using a random numbers table |
| Allocation concealment (selection bias) | Low risk | Comment: all participants were allocated at 1 point in time following recruitment, so at time of recruitment, allocation was not known |
| Blinding of participants and personnel (performance bias) All outcomes | Low risk | Quote from publication: "children and parents in the control group were not informed about the existence of the intervention programme in other schools. The teachers in the control group knew about the intervention arm but were not informed about its content" |
| Blinding of outcome assessment (detection bias) All outcomes | Low risk | Quote from publication: “assessors responsible for the measurements were blinded to the group allocation for all measurements except skin‐fold and waist circumference measures” (Kriemler 2010, p2) Comment: blinding was in place for relevant outcomes |
| Incomplete outcome data (attrition bias) Anthropometrics, Fitness | Low risk | Comment: intention‐to‐treat principle employed |
| Incomplete outcome data (attrition bias) Physical activity and sedentary time | High risk | Comment: intention‐to‐treat principle employed, but only 82/205 in control group have completed PA data |
| Selective reporting (reporting bias) | Low risk | Comment: all outcomes identified a priori were reported on |
| Cluster RCT ‐ Recruitment bias | Low risk | Comment: baseline measures were obtained prior to randomisation |
| Cluster RCT ‐ Baseline imbalance | Low risk | Comment: groups were similar at baseline |
| Cluster RCT ‐ Loss of clusters | High risk | Comment: high loss to follow‐up; no differences between those who completed and those who were missing, but still likely to introduce bias (e.g. only 82/205 in control group have completed PA data) |
| Cluster RCT ‐ Incorrect analysis | Low risk | Comment: clustering accounted for in analysis |
Neumark‐Sztainer 2010.
| Study characteristics | ||
| Methods | Study design: cluster‐RCT | |
| Participants |
School inclusion criteria: high schools in Minneapolis or St. Paul metropolitan area of Minnesota that agreed to participate as control or intervention sites. Participating schools were in urban and first‐ring suburban areas because of their diverse student bodies School exclusion criteria: — Student inclusion criteria: girls in intervention and control schools were invited to register for an all‐girls PE class as an alternative to the regular co‐educational class. In participating schools, students were required to take 1 or 2 PE classes to graduate from high school; participation in this class counted toward that requirement Student exclusion criteria: girls were screened for PA and eating disorder behaviours. 4 girls were excluded because of high levels of PA (1 hour/d) Setting: school, urban Age group: adolescents Gender distribution: females Country/Countries where trial was performed: USA |
|
| Interventions |
Intervention: intervention group continued to participate in the all‐girls PE class during the first semester of the school year. Group members also received the New Moves curriculum during their PE class (approximately 16 weeks) and participated in New Moves activities throughout the rest of the school year (maintenance period). This programme included:
PE teachers attended full‐day training before intervention and half‐day training during intervention. They received regular, ongoing support from New Moves staff throughout the programme. New Moves intervention staff ran all programme components aside from the PE class. These staff received training and ongoing support in motivational interviewing techniques Comparator: control group continued to participate in the all‐girls PE class during the first semester of the school year. Teachers were free to conduct PE classes as they desired during the study period and did not receive training on New Moves until after the study period Duration of intervention: 16 weeks Duration of follow‐up: 16 weeks Number of schools: 12 Theoretical framework: social cognitive theory |
|
| Outcomes | BMI | |
| Study registration | NCT00250497 | |
| Publication details |
Language of publication: English Funding: non‐commercial funding (National Institute of Diabetes and Digestive and Kidney Diseases, National Institutes of Health) Publication status: peer‐reviewed journal |
|
| Stated aim for study | "This paper describes the main findings from a group‐RCT designed to evaluate the impact of a school‐based intervention aimed at preventing weight related problems in adolescent girls: New Moves" | |
| Notes | ||
| Risk of bias | ||
| Bias | Authors' judgement | Support for judgement |
| Random sequence generation (selection bias) | Low risk | Comment: random numbers table [author communication] |
| Allocation concealment (selection bias) | Low risk | Comment: all participants were allocated at 1 point in time following recruitment, so at time of recruitment, allocation was not known |
| Blinding of participants and personnel (performance bias) All outcomes | Unclear risk | Comment: blinding of participants not described |
| Blinding of outcome assessment (detection bias) All outcomes | Unclear risk | Comment: unclear whether trained staff taking measurements were blinded to intervention allocation |
| Incomplete outcome data (attrition bias) Anthropometrics, Fitness | Low risk | Comment: less than 10% dropout rate in intervention group; no details on reasons for dropout provided |
| Selective reporting (reporting bias) | Low risk | Comment: all main outcomes reported |
| Cluster RCT ‐ Recruitment bias | Low risk | Comment: baseline data collected before randomisation [author communication] |
| Cluster RCT ‐ Baseline imbalance | Low risk | Comment: differences adjusted for in analyses |
| Cluster RCT ‐ Loss of clusters | Low risk | Comment: no clusters lost |
| Cluster RCT ‐ Incorrect analysis | Low risk | Comment: clustering accounted for in analysis |
Angelopoulos 2009.
| Study characteristics | ||
| Methods | Study design: cluster‐RCT | |
| Participants |
School inclusion criteria: from total number of primary schools in the region, a random sample of 26 schools was selected School exclusion criteria: — Student inclusion criteria: Grade 5 pupils Student exclusion criteria: — Setting: schools, urban and rural Age group: children Gender distribution: females and males Country/Countries where trial was performed: Greece |
|
| Interventions |
Intervention: 12‐month programme (January 2005 to January 2006) integrated into existing school curriculum in combination with PE and science and environmental classes, providing the least possible disturbance. Programme material included a student’s workbook and a teacher’s manual, which offered activities for use in class in an appendix. The manual covered the following: self‐esteem, body image, nutrition, PA, fitness, and environmental issues; materials were used 1 to 2 hours/week. Motivational methods and strategies were used to increase knowledge (i.e. discussion, active learning, cues), increase skills and self‐efficacy (i.e. modelling, guided practice, enactment), achieve better self‐monitoring (i.e. problem‐solving, goal‐setting), improve attitudes and beliefs (i.e. self re‐evaluation, environmental re‐evaluation, arguments, modelling, direct experience), and modify social influence (i.e. modelling, mobilising social support). School teachers trained by the research team delivered the intervention, and there was a home component for which parental involvement was required to provide reinforcement Comparator: — Duration of intervention: 12 months Duration of follow‐up: 12 months Number of schools: 26 Theoretical framework: theory of planned behaviour |
|
| Outcomes | BMI | |
| Study registration | — | |
| Publication details |
Language of publication: English Funding: — Publication status: peer‐reviewed journal |
|
| Stated aim for study | "The aim of the current study was to evaluate the effectiveness of this school‐based intervention program, which was developed and implemented based on the Theory of Planned Behavior, on obesity indices and blood pressure in primary school children in the prefecture of Ioannina—a poor area with high obesity rates in Greece" | |
| Notes | ||
| Risk of bias | ||
| Bias | Authors' judgement | Support for judgement |
| Random sequence generation (selection bias) | Low risk | Comment: random digits used to develop allocation sequence |
| Allocation concealment (selection bias) | Low risk | Comment: all participants were allocated at 1 point in time following recruitment, so at time of recruitment, allocation was not known |
| Blinding of participants and personnel (performance bias) All outcomes | Unclear risk | Comment: no information given; likely not done |
| Blinding of outcome assessment (detection bias) All outcomes | Unclear risk | Comment: no information given; likely not done |
| Incomplete outcome data (attrition bias) Anthropometrics, Fitness | High risk | Comment: cannot determine how many students started the study; know only how many finished |
| Selective reporting (reporting bias) | Unclear risk | Comment: no protocol published; cannot assess |
| Cluster RCT ‐ Recruitment bias | Unclear risk | Comment: no indication that participants were registered before randomisation |
| Cluster RCT ‐ Baseline imbalance | Low risk | Comment: participant characteristics balanced at baseline |
| Cluster RCT ‐ Loss of clusters | Low risk | Comment: same N (321/325) reported in all analyses |
| Cluster RCT ‐ Incorrect analysis | Low risk | Quote from publication: "inter‐school variation was also taken into account by including the random school effect in the models" |
Donnelly 2009.
| Study characteristics | ||
| Methods | Study design: cluster‐RCT | |
| Participants |
School inclusion criteria: 26 elementary schools in Northeast Kansas School exclusion criteria: — Student inclusion criteria: participants were in Grades 2 and 3 at baseline Student exclusion criteria: — Setting: school, urban Age group: children Gender distribution: females and males Country/Countries where trial was performed: USA |
|
| Interventions |
Intervention: Physical Activity Across the Curriculum; provided training for classroom teachers (6‐hour in‐service session) to deliver existing academic lessons taught thorough PA, using examples from TAKE 10!, a programme of the International Life Sciences Institute Research Foundation/Center for Health Promotion. 90 minutes/week of MVPA academic lessons was delivered intermittently throughout the school day Comparator: regular classroom instruction without physically active lessons Duration of intervention: 3 years Duration of follow‐up: 3 years Number of schools: 24 Theoretical framework: — |
|
| Outcomes | BMI PA duration |
|
| Study registration | — | |
| Publication details |
Language of publication: English Funding: non‐commercial funding (National Institutes of Health) Publication status: peer‐reviewed journal |
|
| Stated aim for study | "The primary aim of Physical Activity Across the Curriculum was to increase PA sufficiently to reduce gains in BMI for Physical Activity Across the Curriculum compared to control schools" | |
| Notes | ||
| Risk of bias | ||
| Bias | Authors' judgement | Support for judgement |
| Random sequence generation (selection bias) | Unclear risk | Comment: no description of the randomisation process given |
| Allocation concealment (selection bias) | Low risk | Comment: all participants were allocated at 1 point in time following recruitment, so at time of recruitment, allocation was not known |
| Blinding of participants and personnel (performance bias) All outcomes | High risk | Quote from publication: "RA who conducted classroom visitations were not blinded" |
| Blinding of outcome assessment (detection bias) All outcomes | Low risk | Quote from publication: "RA were blinded to condition for measurement of the primary and secondary outcomes, and for data entry" |
| Incomplete outcome data (attrition bias) Anthropometrics, Fitness | Low risk | Comment: 2.5% missing data; not likely to affect results |
| Incomplete outcome data (attrition bias) Physical activity and sedentary time | Unclear risk | Comment: missing data from sub‐sample that wore accelerometers not reported |
| Selective reporting (reporting bias) | Low risk | Comment: all outcomes identified a priori were reported on |
| Cluster RCT ‐ Recruitment bias | Unclear risk | Comment: no indication participants consented before randomisation |
| Cluster RCT ‐ Baseline imbalance | Low risk | Comment: participant characteristics balanced at baseline |
| Cluster RCT ‐ Loss of clusters | High risk | Comment: 1 school dropped out because of randomisation, another school was lost for another reason that could not be related to the intervention. Overall small number lost, but no comparison of characteristics between those lost and those retained |
| Cluster RCT ‐ Incorrect analysis | Low risk | Comment: clustering accounted for in analysis |
Dorgo 2009.
| Study characteristics | ||
| Methods | Study design: cluster‐RCT | |
| Participants |
School inclusion criteria: — School exclusion criteria: — Student inclusion criteria: high school students enrolled in PE classes at selected high schools Student exclusion criteria: cardiovascular problems, spine deformities, pregnancy Setting: school Age group: adolescents Gender distribution: females and males Country/Countries where trial was performed: USA |
|
| Interventions |
Intervention 1: PE programme that used manual resistance training in every session. 80‐minute class sessions 3 times/week, plus a 10‐ to 15‐minute warm‐up segment with light cardiovascular activities and dynamic stretching followed by the manual resistance training‐specific segment of approximately 20 to 30 minutes, conducted and supervised by trained research assistants Intervention 2: manual resistance training PE programme plus a cardiovascular endurance training segment in every session. 80‐minute class sessions, 3 times/week, plus a 20‐ to 30‐minute manual resistance training segment, conducted and supervised by trained research assistants, with an additional 20‐ to 30‐minute period devoted to cardiovascular endurance training. Cardiovascular activities included walking, jogging, step aerobics, and aerobic kickboxing Comparator: a regular PE programme that followed the usual school curriculum. 80‐minute class sessions. 3 times/week. PE classes focused on skill development for various individual PAs (i.e. bowling, badminton, tennis, table tennis, golf, various track and field events) and team PAs (i.e. soccer, basketball, softball or baseball, volleyball, floor hockey), as well as participation in leisure activities (i.e. hiking) and sport tournaments Duration of intervention: 18 weeks Duration of follow‐up: 18 weeks Number of schools: 3 Theoretical framework: — |
|
| Outcomes | BMI | |
| Study registration | — | |
| Publication details |
Language of publication: English Funding: non‐commercial funding (National Institutes of Health, National Center on Minority Health and Health Disparities through the Hispanic Health Disparities Research Center, and by Grant Number 5G12RR008124 from National Institutes of Health, Research Centers in Minority Institutions) Publication status: peer‐reviewed journal |
|
| Stated aim for study | "The purpose of this study was to document the changes in physical fitness scores and body composition measures of adolescents through the application of manual resistance training and cardiovascular endurance training in school‐based PE settings compared with adolescents attending a traditional PE program" | |
| Notes | ||
| Risk of bias | ||
| Bias | Authors' judgement | Support for judgement |
| Random sequence generation (selection bias) | Low risk | Comment: coin flipping [author communication] |
| Allocation concealment (selection bias) | Low risk | Comment: all participants were allocated at a single point in time following recruitment, so at time of recruitment, allocation was not known |
| Blinding of participants and personnel (performance bias) All outcomes | Unclear risk | Comment: no information given; likely not done |
| Blinding of outcome assessment (detection bias) All outcomes | Unclear risk | Comment: no information given; likely not done |
| Incomplete outcome data (attrition bias) Anthropometrics, Fitness | High risk | Quote from publication: “24 subjects failed to attend the post‐test data collection and were not included in the data analyses” (Dorgo, 2009, p.2291) |
| Selective reporting (reporting bias) | Unclear risk | Comment: no protocol published; cannot assess |
| Cluster RCT ‐ Recruitment bias | Low risk | Comment: baseline data collected before randomisation |
| Cluster RCT ‐ Baseline imbalance | High risk | Comment: baseline differences in some outcomes |
| Cluster RCT ‐ Loss of clusters | High risk | Comment: clusters lost to follow‐up |
| Cluster RCT ‐ Incorrect analysis | High risk | Comment: no indication clustering was accounted for in analysis |
Gentile 2009.
| Study characteristics | ||
| Methods | Study design: cluster‐RCT | |
| Participants |
School inclusion criteria: all 10 elementary schools in Lakeville, Minnesota, and Cedar Rapids, Iowa, USA School exclusion criteria: — Student inclusion criteria: Grades 3, 4, and 5 Student exclusion criteria: — Setting: community, home, school Age group: children Gender distribution: females and males Country/Countries where trial was performed: USA |
|
| Interventions |
Intervention: 'Switch’ programme, promoted healthy active lifestyles by encouraging students to 'Switch what you Do, Chew, and View’, including be active for 60 minutes or more/d, limit total screen time to 2 hours or fewer/d, and eat 5 fruits or vegetables or more/d. Community component: promotion of awareness of healthy lifestyles and prevention of childhood obesity included paid advertising (e.g. billboards) and unpaid media emphasising key messages. School component: teachers were provided materials and ways to integrate key concepts into their existing curricula. Family component: provided parents (and children) with materials and resources to facilitate adoption of healthy target behaviours. Monthly packets containing behavioural tools were provided to assist parents and children in modifying their behaviours Comparator: no intentional exposure to the Switch programme; may have been exposed to the community component of the intervention; did not receive any school materials; did not receive materials or resources, other than surveys Duration of intervention: 8 months Duration of follow‐up: 14 months Number of schools: 10 Theoretical framework: socioecological model |
|
| Outcomes | BMI | |
| Study registration | NCT00685555 (retrospectively registered) | |
| Publication details |
Language of publication: English Funding: other funding (in Lakeville, Minnesota, Switch was sponsored by Medica Foundation, Healthy and Active America Foundation, and Fairview Health Services; in Cedar Rapids, Iowa, Switch was sponsored by Cargill, Inc, and the Healthy and Active America Foundation) Publication status: peer‐reviewed journal |
|
| Stated aim for study | "The primary objectives of Switch were to: (1) increase the amount of PA; (2) reduce the amount of screen time (television and video game time); and (3) increase fruit and vegetable consumption among children from grade 3 to 5" | |
| Notes | ||
| Risk of bias | ||
| Bias | Authors' judgement | Support for judgement |
| Random sequence generation (selection bias) | Low risk | Comment: random number generated; Excel [author communication] |
| Allocation concealment (selection bias) | Low risk | Comment: all participants were allocated at a single point in time following recruitment, so at time of recruitment, allocation was not known |
| Blinding of participants and personnel (performance bias) All outcomes | Low risk | Comment: participants did not know about other conditions [author communication] |
| Blinding of outcome assessment (detection bias) All outcomes | High risk | Comment: study personnel were not blinded [author communication] |
| Incomplete outcome data (attrition bias) Anthropometrics, Fitness | High risk | Comment: incomplete outcome data; not adequately addressed |
| Selective reporting (reporting bias) | Low risk | Comment: all outcomes identified a priori were reported on |
| Cluster RCT ‐ Recruitment bias | Low risk | Comment: baseline data were collected before randomisation |
| Cluster RCT ‐ Baseline imbalance | Low risk | Comment: no baseline differences apparent |
| Cluster RCT ‐ Loss of clusters | Low risk | Comment: no clusters lost to follow‐up |
| Cluster RCT ‐ Incorrect analysis | Low risk | Comment: clustering adjusted for in analysis |
Neumark‐Sztainer 2009.
| Study characteristics | ||
| Methods | Study design: cluster‐RCT | |
| Participants |
School inclusion criteria: 4 urban schools in St. Paul, Minnesota, USA, in which 90% of students qualified for free or reduced price lunch School exclusion criteria: — Student inclusion criteria: all children in Grades 4 to 6 at intervention and control schools were eligible to participate and were selected on a first come, first served basis Student exclusion criteria: — Setting: school, community, theatre, urban Age group: children Gender distribution: females and males Country/Countries where trial was performed: USA |
|
| Interventions |
Intervention: 3 components
Each theatre session included
For the initial sessions, the ACTivities component included exercises to introduce children to theatre techniques and to build trust and cooperation. In later sessions, ACTivities focused on enhancing knowledge and skills related to PA and healthy eating and promoting a positive body image through interactive activities. Children were asked to share their personal experiences related to being active and eating healthfully. The content of the script for the Ready. Set. ACTION! play was developed through these activities. During final sessions, children were introduced to the script and began to rehearse for the final play performance. Booster sessions included activities such as creating advertisements for fruits and vegetables; painting positive affirmations (e.g. I am special) on a mirror to take home; brainstorming ways to be active while watching television (e.g. doing jumping jacks during commercials); teaching dance and strength training exercises to classmates; learning exercises to do at home with families; and rehearsing for school performance of the Ready. Set. ACTION! play. For the family outreach component, Weekly Fun and Fitness packs (i.e. a healthy food with a simple recipe or fitness incentives for the family) and a CD of the Ready. Set. ACTION! songs were sent home (each pack also included a parent postcard with information and interactive activities on a topic addressed in the after‐school programme). There were also 2 family events
Comparator: theatre‐based intervention involving performing a play focused on environmental health issues using a prepared script Duration of intervention: 16 weeks Duration of follow‐up: 16 weeks Number of schools: 4 Theoretical framework: social cognitive theory |
|
| Outcomes | BMI | |
| Study registration | NCT00604513 (retrospectively registered) | |
| Publication details |
Language of publication: English Funding: other funding (National Institutes of Health (R21 DK072972 to D.N.S.); National Institute of Diabetes and Digestive and Kidney Diseases; Illusion Theater received additional funding for theatre components from The Medica Foundation, The General Mills Communities of Color Project Grants, and The Best Buy Children’s Foundation) Publication status: peer‐reviewed journal |
|
| Stated aim for study | "Our primary aim was to develop and test the feasibility of implementing Ready. Set. ACTION!, developed in partnership between researchers at the University of Minnesota and artists/educators from Illusion Theater, a Minneapolis‐based theatre company with experience in educational theatre" | |
| Notes | ||
| Risk of bias | ||
| Bias | Authors' judgement | Support for judgement |
| Random sequence generation (selection bias) | Low risk | Comment: drawing names [author communication] |
| Allocation concealment (selection bias) | Low risk | Comment: all participants were allocated at a single point in time following recruitment, so at time of recruitment, allocation was not known |
| Blinding of participants and personnel (performance bias) All outcomes | Low risk | Comment: participants were not blinded but did not know of the study hypothesis [author communication] |
| Blinding of outcome assessment (detection bias) All outcomes | High risk | Comment: outcome assessors were not blinded [author communication] |
| Incomplete outcome data (attrition bias) Anthropometrics, Fitness | High risk | Comment: authors should have used intention‐to‐treat analysis. Although they did adjust for baseline differences, they adjusted for only certain characteristics like age and sex, and not for any of the outcome variables |
| Selective reporting (reporting bias) | Low risk | Comment: all outcomes identified a priori were reported on |
| Cluster RCT ‐ Recruitment bias | Low risk | Comment: baseline data were collected before school randomisation [author communication] |
| Cluster RCT ‐ Baseline imbalance | Low risk | Comment: no substantive baseline differences were found |
| Cluster RCT ‐ Loss of clusters | Low risk | Comment: no clusters were lost |
| Cluster RCT ‐ Incorrect analysis | High risk | Comment: clustering was not accounted for in statistical analysis |
Peralta 2009.
| Study characteristics | ||
| Methods | Study design: RCT | |
| Participants |
Student inclusion criteria: participants were recruited from the entire Grade 7 (12 to 13 years; N = 172) student population of a single‐sex (boys) secondary school in Sydney, Australia. Following completion of the school's compulsory fitness testing battery, students' cardiorespiratory fitness results (measured by the Multistage Fitness Test) were ranked from highest to lowest (119 to 9 laps). Students with lowest scores (< 49 laps, N = 60; placing them in the bottom 50th percentile among boys this age in New South Wales, Australia) were invited to participate Student exclusion criteria: no other inclusion or exclusion criteria Setting: school Age group: adolescents Gender distribution: males Country/Countries where trial was performed: Australia |
|
| Interventions |
Intervention: the intervention programme was primarily based on social cognitive theory, with 16 program weeks, each week comprising 1 × 60‐minute curriculum session and 2 × 20‐minute lunchtime PA sessions. Each 60‐minute curriculum session included practical and/or theoretical components focused on promoting PA through increasing physical self‐esteem and self‐efficacy, reducing time spent in small‐screen recreation on weekends, decreasing sweetened beverage consumption, increasing fruit consumption and the acquisition and practice of self‐regulatory behaviours such as goal‐setting and time management, and identifying and overcoming barriers. Behaviour modification techniques (e.g. group goals converting time spent in PA to kilometres to reach a specified destination) and incentives were used. The practical component included modified games and activities. The researcher primarily facilitated the intervention with staff and parent involvement. A Program Champion (PE teacher) liaised with School Executive and other staff to promote the programme within the school and to assist with logistical requirements. Grade 11 students peer‐facilitated lunchtime sessions based on their potential to be positive role models and had 1, 20‐minute training session. Parents were emailed 6 newsletters throughout, informing them of programme content, motivating them, and suggesting strategies to engage the family in healthy behaviours, creating a stronger connection between parents and the school Comparator: participated in 16 × 60‐minute curricular PA sessions at the same time as the intervention group, with a school PE teacher guiding the control group Duration of intervention: 16 weeks Duration of follow‐up: 16 weeks Number of schools: 1 Theoretical framework: social cognitive theory |
|
| Outcomes | PA duration BMI |
|
| Study registration | — | |
| Publication details |
Language of publication: English Funding: other funding (the broader intervention school community partly funded the study) Publication status: peer‐reviewed journal |
|
| Stated aim for study | "The aim of this study was to assess the feasibility, acceptability and potential efficacy of a multifaceted secondary school‐based program (the Fitness Improvement Lifestyle Awareness Program) among adolescent boys with low cardiorespiratory fitness" | |
| Notes | ||
| Risk of bias | ||
| Bias | Authors' judgement | Support for judgement |
| Random sequence generation (selection bias) | Low risk | Comment: participants were randomised, using a computer‐based number‐producing algorithm, to either intervention or active comparison group |
| Allocation concealment (selection bias) | Low risk | Comment: all participants were allocated at a single point in time following recruitment, so at time of recruitment, allocation was not known |
| Blinding of participants and personnel (performance bias) All outcomes | Unclear risk | Comment: not described |
| Blinding of outcome assessment (detection bias) All outcomes | Low risk | Quote from publication: “trained independent assessors, blind to group allocation, conducted the measurements” (Peralta 2009, p538) |
| Incomplete outcome data (attrition bias) Anthropometrics, Fitness | Low risk | Comment: outcome data complete |
| Incomplete outcome data (attrition bias) Physical activity and sedentary time | Low risk | Comment: outcome data complete |
| Selective reporting (reporting bias) | Unclear risk | Comment: no protocol published; cannot assess |
Walther 2009.
| Study characteristics | ||
| Methods | Study design: cluster‐RCT | |
| Participants |
School inclusion criteria: Grade 6 classes from 3 different schools were recruited School exclusion criteria: — Student inclusion criteria: study selection was based on willingness of parents to allow their children to participate in the study protocol for at least 1 year Student exclusion criteria: none Setting: school Age group: children Gender distribution: females and males Country/Countries where trial was performed: Germany |
|
| Interventions |
Intervention: classes were assigned to 1 unit of physical exercise (45 minutes) with at least 15 minutes of endurance training/school day. In addition, lessons on healthy lifestyle were included in the regular schedule once monthly for all pupils Comparator: according to German standards, 2 units (each 45 minutes) of PE/week are mandatory in all schools. Non‐randomised sport students (reference group) received 12 units (45 minutes/unit) of high‐level endurance exercise training/week and frequently participated in competitive sporting events, thus representing maximum of physical fitness attainable under reasonable conditions in school‐age children Duration of intervention: 1 year Duration of follow‐up: 1 year Number of schools: 3 Theoretical framework: — |
|
| Outcomes | Fitness BMI |
|
| Study registration | NCT00176371 | |
| Publication details |
Language of publication: English Funding: other funding (Novartis, Deutsche Forschungsgemeinschaft (KO 3512/1‐1), Roland Ernst Stiftung) Publication status: peer‐reviewed journal |
|
| Stated aim for study | "The aim of this study was to investigate the effect of daily school exercise on physical fitness, motor skills, and body composition in school children through a randomised, prospective trial" | |
| Notes | ||
| Risk of bias | ||
| Bias | Authors' judgement | Support for judgement |
| Random sequence generation (selection bias) | Unclear risk | Comment: randomisation process not reported |
| Allocation concealment (selection bias) | Low risk | Comment: all participants were allocated at a single point in time following recruitment, so at time of recruitment, allocation was not known |
| Blinding of participants and personnel (performance bias) All outcomes | Unclear risk | Comment: no information given; likely not done |
| Blinding of outcome assessment (detection bias) All outcomes | Unclear risk | Comment: no information given; likely not done |
| Incomplete outcome data (attrition bias) Anthropometrics, Fitness | High risk | Comment: incomplete outcome data; not adequately addressed |
| Selective reporting (reporting bias) | Low risk | Comment: all outcomes identified a priori were reported on |
| Cluster RCT ‐ Recruitment bias | Low risk | Comment: randomisation completed after students enrolled |
| Cluster RCT ‐ Baseline imbalance | Unclear risk | Comment: no information given |
| Cluster RCT ‐ Loss of clusters | Low risk | Comment: no clusters lost |
| Cluster RCT ‐ Incorrect analysis | Low risk | Comment: clustering accounted for in analysis |
Reed 2008.
| Study characteristics | ||
| Methods | Study design: cluster‐RCT | |
| Participants |
School inclusion criteria: elementary schools from the Vancouver and Richmond School Districts in British Columbia, Canada, not already engaged in PA programmes School exclusion criteria: — Student inclusion criteria: all children in Grades 4 and 5 attending included schools Student exclusion criteria: 3 girls and 2 boys excluded as they had health conditions that could affect normal PA or development Setting: school, community, home, urban Age group: children Gender distribution: females and males Country/Countries where trial was performed: Canada |
|
| Interventions |
Intervention: Action Schools! BC model was consistent with the 'active school' framework and emphasised an integrated whole‐school approach rather than traditional classroom‐based health education, targeting 6 Action Zones
School Action Team – comprised school principal, teachers, or both ‐ was convened at each school; an Action Schools! BC facilitator worked with Action Teams to design a programme with activities across the 6 Action Zones. A 1‐day training workshop was held for intervention teachers, who were provided a Classroom Action Bin with resources to support their Action Plan, with the goal for each school to provide students with 150 minutes of PA/week (2 × 40‐minute PE classes and 15 × 5 minutes/d of Classroom Action) Comparator: teachers in usual practice schools continued their regular programmes of PE and school‐based PA Duration of intervention: 11 months Duration of follow‐up: 11 months Number of schools: 8 Theoretical framework: social cognitive theory |
|
| Outcomes | BMI Fitness |
|
| Study registration | NCT01412203 (retrospectively registered) | |
| Publication details |
Language of publication: English Funding: British Columbia Ministry of Health Publication status: peer‐reviewed journal |
|
| Stated aim for study | "Our primary objective was to determine whether Action Schools! BC was an effective model to decrease cardiovascular risk factors in elementary‐school children" | |
| Notes | ||
| Risk of bias | ||
| Bias | Authors' judgement | Support for judgement |
| Random sequence generation (selection bias) | Low risk |
Quote from publication: "schools were then remotely randomised to either Usual Practice or Intervention by an epidemiologist not involved in the trial" (Reed 2008, p527) Comment: randomisation performed remotely via a random number draw [author communication] |
| Allocation concealment (selection bias) | High risk | Comment: it was reported that it was not possible for schools to be blinded to random assignment; therefore concealment was not attained |
| Blinding of participants and personnel (performance bias) All outcomes | High risk | Comment: participants were not blinded [author communication] |
| Blinding of outcome assessment (detection bias) All outcomes | High risk | Comment: outcome assessors were not blinded [author communication] |
| Incomplete outcome data (attrition bias) Anthropometrics, Fitness | High risk | Comment: incomplete outcome data; not adequately addressed |
| Selective reporting (reporting bias) | Low risk | Comment: all outcomes identified a priori were reported on |
| Cluster RCT ‐ Recruitment bias | High risk | Comment: data collection after randomisation |
| Cluster RCT ‐ Baseline imbalance | Unclear risk | Comment: not described |
| Cluster RCT ‐ Loss of clusters | Low risk | Comment: very low loss to follow‐up, most often due to moving to a different school |
| Cluster RCT ‐ Incorrect analysis | Low risk | Comment: clustering accounted for in analysis |
Salmon 2008.
| Study characteristics | ||
| Methods | Study design: cluster‐RCT | |
| Participants |
School inclusion criteria: convenience sample of 3 government primary schools located on 4 campuses in low socioeconomic status areas (based on socioeconomic index for area scores) in metropolitan Melbourne was recruited to the study School exclusion criteria: — Student inclusion criteria: all Grade 5 (approximately 10 to 11 years old) students at selected schools were eligible to participate and were invited to take part in the study Student exclusion criteria: — Setting: school, urban Age group: children Gender distribution: females and males Country/Countries where trial was performed: Australia |
|
| Interventions |
Students were assigned to 1 of 4 conditions: a Behavioural Modification group, a Fundamental Motor Skillsgroup, a combined Behavioural Modification and Fundamental Motor Skills group, or a control group. Components of the intervention programme were developed by the study team, with others adapted from previous interventions (SPARK), concepts outlined in Robinson's study, from Planet Health, and from the Victorian Fundamental Motor Skills programme Intervention 1: behavioural modification: included 19 sessions of 40 to 50 minutes over 3 school terms by intervention specialist teacher, with different aims for each set of lessons (e.g. increasing awareness of time use, health benefits of PA, self‐monitoring time spent in sedentary behaviours and PA, raising awareness of home and community environments in relation to choices and opportunities, decision‐making skills, developing their own PAs and games, 'intelligent viewing', a 'Switch‐off Challenge', intermittent reinforcement schedule with a small reward) Intervention 2: fundamental motor skills: 19 sessions of 40 to 50 minutes over 3 school terms taught by the same intervention specialist teacher who delivered the behavioural modification intervention. The fundamental motor skills intervention focused on 6 skills, including 3 object control skills and 3 locomotor skills. Skills were taught with emphasis on fun through games and maximum involvement for all children. Most lessons focused on at least 2 skills, and each skill was a focus lesson in at least 6 sessions Intervention 3: behavioural modification and fundamental motor skills Comparator: usual classroom lessons Duration of intervention: 1 school year Duration of follow‐up: 2 years Number of schools: 3 Theoretical framework: social marketing theory and behavioural choice theory |
|
| Outcomes | PA duration BMI |
|
| Study registration | — | |
| Publication details |
Language of publication: English Funding: non‐commercial funding (Victorian Health Promotion Foundation) Publication status: peer‐reviewed journal |
|
| Stated aim for study | "The primary aims of this study were to evaluate the effectiveness of an intervention designed to prevent excess weight gain (beyond gains associated with normal growth and maturation), reduce the likelihood of being overweight or obese, reduce time spent in recreational screen behaviours (TV, computer, and electronic games) and promote PA participation among 10‐year‐old children" | |
| Notes | ||
| Risk of bias | ||
| Bias | Authors' judgement | Support for judgement |
| Random sequence generation (selection bias) | High risk | Comment: participants selected a ticket from a container, which specified group allocation |
| Allocation concealment (selection bias) | High risk | Comment: allocation was concealed from parents and teachers until after baseline data collection [author communication] |
| Blinding of participants and personnel (performance bias) All outcomes | High risk | Comment: participants and study personnel were not blinded [author communication] |
| Blinding of outcome assessment (detection bias) All outcomes | High risk | Comment: 2 trained staff members not blinded to group assignment took measurements |
| Incomplete outcome data (attrition bias) Anthropometrics, Fitness | High risk | Comment: incomplete outcome data; not adequately addressed |
| Incomplete outcome data (attrition bias) Physical activity and sedentary time | High risk | Comment: incomplete outcome data; not adequately addressed |
| Selective reporting (reporting bias) | Low risk | Comment: all outcomes identified a priori were reported on |
| Cluster RCT ‐ Recruitment bias | Low risk | Comment: school classes randomised after recruitment |
| Cluster RCT ‐ Baseline imbalance | Low risk | Comment: baseline differences between groups, but confounders adjusted for in secondary analyses |
| Cluster RCT ‐ Loss of clusters | Low risk | Comment: no clusters lost |
| Cluster RCT ‐ Incorrect analysis | Low risk | Comment: clustering accounted for in analysis |
Wang 2008.
| Study characteristics | ||
| Methods | Study design: cluster‐RCT | |
| Participants |
School inclusion criteria: elementary schools in Augusta, Georgia School exclusion criteria: — Student inclusion criteria: all Grade 3 students attending the 9 intervention schools were invited to enrol in the FitKid Project free of charge Student exclusion criteria: — Setting: school, urban Age group: children Gender distribution: females and males Country/Countries where trial was performed: USA |
|
| Interventions |
Intervention: the 'FitKid' after‐school programme was offered 5 days/week (not offered during holidays and vacation periods). Certified school teachers and paraprofessionals implemented the programme, following established guidelines that included reinforcement and teaching techniques, safety measures, evaluation procedures, and monthly activity plans that accommodate local weather conditions (i.e. more outdoor‐based activities in spring, winter, and late fall, and more indoor activities in summer and early fall, when it is often too hot and humid to play outside). 2‐hour intervention sessions began with a 40‐minute period during which youths were provided a healthy snack and academic enrichment activities. Snacks were provided through the US Department of Agriculture's National School Lunch and Child and Adult Care Food Programs in cooperation with the school nutrition service. Academic enrichment activities were incorporated into the programme to ensure that participation in the FitKid intervention during after‐school hours would not damage the academic progress of children. The 80 minutes of PA included a variety of activities designed to improve sport skills, aerobic fitness, strength, and flexibility; 40 minutes was devoted to vigorous PA Comparator: — Duration of intervention: 3 school years Duration of follow‐up: 3 years Number of schools: 18 Theoretical framework: — |
|
| Outcomes | BMI Fitness |
|
| Study registration | — | |
| Publication details |
Language of publication: English Funding: non‐commercial funding (National Institutes of Health) Publication status: peer‐reviewed journal |
|
| Stated aim for study | "The objective of this study was to evaluate the cost‐effectiveness of the Medical College of Georgia FitKid Project, a 3‐year, after‐school program designed to prevent obesity among elementary school students" | |
| Notes | ||
| Risk of bias | ||
| Bias | Authors' judgement | Support for judgement |
| Random sequence generation (selection bias) | Low risk | Quote from publication: "schools then were randomised within strata to control or experimental arms of the project using a random number table" |
| Allocation concealment (selection bias) | Low risk | Comment: all participants were allocated at a single point in time following recruitment, so at time of recruitment, allocation was not known |
| Blinding of participants and personnel (performance bias) All outcomes | High risk | Comment: students were notified of intervention status |
| Blinding of outcome assessment (detection bias) All outcomes | Unclear risk | Comment: no information given; likely not done |
| Incomplete outcome data (attrition bias) Anthropometrics, Fitness | High risk | Comment: incomplete outcome data; not adequately addressed |
| Selective reporting (reporting bias) | Low risk | Comment: all outcomes identified a priori were reported on |
| Cluster RCT ‐ Recruitment bias | High risk | Comment: schools randomised before participants enrolled; some students notified of intervention assignment prior to recruitment |
| Cluster RCT ‐ Baseline imbalance | Low risk | Comment: adjusted for baseline differences |
| Cluster RCT ‐ Loss of clusters | Unclear risk | Comment: no information given |
| Cluster RCT ‐ Incorrect analysis | Low risk | Comment: clustering accounted for in analysis |
Webber 2008.
| Study characteristics | ||
| Methods | Study design: cluster‐RCT | |
| Participants |
School inclusion criteria: public middle schools at which a majority of students lived in the surrounding community, enrolment of at least 90 grade 8 girls, yearly withdrawal rates < 28%, at least 1 semester of PE required for each grade, willingness to sign a memorandum of understanding and to accept random assignment of the school School exclusion criteria: none Student inclusion criteria: Grades 6, 7, and 8 female students Student exclusion criteria: limited English‐speaking skills, inability to participate in PE classes due to a medical condition or disability, contraindication for participating in a submaximal exercise test (2005 measurements only) Setting: community, school Age group: adolescents Gender distribution: females Country/Countries where trial was performed: USA |
|
| Interventions |
Intervention: Trial of Activity for Adolescent Girls health education included 6 lessons in each of Grades 7 and 8 designed to enhance behavioural skills known to influence PA participation. Activity challenges associated with lessons reinforced the contents, encouraged self‐monitoring, and set goals for behaviour change. To meet varying formats in which health education was taught at the school, Trial of Activity for Adolescent Girls health education was offered in 2 forms: 1 for a traditional classroom setting and 1 for a PE class. Trial of Activity for Adolescent Girls PE class promoted MVPA for at least 50% of class time and encouraged teachers to promote PA outside of class. Activities targeted to create:
Specifically, the intervention was designed to establish more opportunities, improve social support and norms, and increase self‐efficacy, outcome expectations, and behavioural skills to foster greater MVPA. 35 to 40 girls were the focus of the intervention; however, health and PE classes were part of the usual school curriculum, and most included boys as well. An innovative feature of the intervention was linking school and community agencies to develop and promote PA programmes for girls. These programmes were delivered both on and off school property, in most cases before or after school Comparator: — Duration of intervention: 2 years Duration of follow‐up: 2 years Number of schools: 36 Theoretical framework: social cognitive theory, diffusion of innovation, operant learning theory |
|
| Outcomes | PA duration Sedentary time BMI | |
| Study registration | NCT00006409 | |
| Publication details |
Language of publication: English Funding: non‐commercial funding (National Heart, Lung, and Blood Institute) Publication status: peer‐reviewed journal |
|
| Stated aim for study | "The primary aim of Trial of Activity for Adolescent Girls was to test an intervention to reduce by half the observed decline in MVPA experienced by adolescent girls" | |
| Notes | ||
| Risk of bias | ||
| Bias | Authors' judgement | Support for judgement |
| Random sequence generation (selection bias) | Low risk | Comment: computer generated [author communication] |
| Allocation concealment (selection bias) | Low risk | Comment: all participants were allocated at a single point in time following recruitment, so at time of recruitment, allocation was not known |
| Blinding of participants and personnel (performance bias) All outcomes | Unclear risk | Comment: no information given |
| Blinding of outcome assessment (detection bias) All outcomes | Low risk | Quote from publication: “Trial of Activity for Adolescent Girls staff was blinded to the study outcomes until the 2006 data collection was complete. Also, separate intervention and measurement staff were employed” (Webber 2008, p174) |
| Incomplete outcome data (attrition bias) Anthropometrics, Fitness | High risk | Comment: incomplete outcome data; not addressed adequately Quote from publication: “in a study such as Trial of Activity for Adolescent Girls, efforts to obtain a complete set of measurements on the girls assigned to each treatment condition would require considerable resources, as it is expensive to track and measure students who have left a school. Furthermore, despite extraordinary efforts, ascertainment of measurements in every girl in the cohort is unlikely” (Stevens 2005, p226) |
| Incomplete outcome data (attrition bias) Physical activity and sedentary time | High risk | Comment: incomplete outcome data; not addressed adequately Quote from publication: “in a study such as Trial of Activity for Adolescent Girls, efforts to obtain a complete set of measurements on the girls assigned to each treatment condition would require considerable resources, as it is expensive to track and measure students who have left a school. Furthermore, despite extraordinary efforts, ascertainment of measurements in every girl in the cohort is unlikely” (Stevens 2005, p226) |
| Selective reporting (reporting bias) | Low risk | Comment: all outcomes identified a priori were reported on |
| Cluster RCT ‐ Recruitment bias | Low risk | Quote from publication: "schools at each of the six field centres were randomised in equal numbers to either intervention or control condition after baseline measurements were collected" |
| Cluster RCT ‐ Baseline imbalance | Low risk | Comment: baseline differences were compared using mixed models, with students nested within schools nested within intervention [author communication] |
| Cluster RCT ‐ Loss of clusters | Low risk | Comment: no clusters lost to follow‐up |
| Cluster RCT ‐ Incorrect analysis | Low risk | Comment: clustering accounted for in the analysis |
Weeks 2008.
| Study characteristics | ||
| Methods | Study design: RCT | |
| Participants |
Student inclusion criteria: students of sound general health, fully ambulatory, with written consent of a parent or guardian Student exclusion criteria: metabolic bone disease, endocrine disorder, or chronic renal pathology; taking medications known to affect bone; recovering from lower limb fracture or other immobilised injury; were affected by any condition not compatible with PAs likely to raise heart rate for up to 10 minutes Setting: school Age group: adolescents Gender distribution: females and males Country/Countries where trial was performed: Australia |
|
| Interventions |
Intervention: 10 minutes of directed jumping activity at the beginning of every PE class (twice/week). Activities designed to apply loads to the skeleton at high strain magnitude, frequency, and rate; included jumps, hops, tuck‐jumps, jump‐squats, stride jumps, star jumps, lunges, side lunges, and skipping. Jumps were occasionally supplemented with upper body strengthening activities, including pushups and exercises with resistive latex bands (AusBand; Ausmedic Australia) Comparator: regular PE warm‐ups and stretching directed by the usual PE teacher at the beginning of every PE class (twice/week). Activities focused on improving flexibility and general preparedness for PA without specifically loading the skeleton at higher rates than normal, including: brisk walking, light jogging, and stretching Duration of intervention: 8 months Duration of follow‐up: 8 months Number of schools: 1 Theoretical framework: — |
|
| Outcomes | BMI | |
| Study registration | — | |
| Publication details |
Language of publication: English Funding: — Publication status: peer‐reviewed journal |
|
| Stated aim for study | "The aim of the Preventing Osteoporosis With Exercise Regimes in Physical Education study was to determine the effect of a practical, evidence‐based exercise regimen (10 min of jumping activity twice/week for 8 months) on parameters of bone and muscle strength in healthy adolescent boys and girls in comparison with age‐ and sex‐matched controls" | |
| Notes | ||
| Risk of bias | ||
| Bias | Authors' judgement | Support for judgement |
| Random sequence generation (selection bias) | Low risk | Comment: block randomisation using a list produced by a random number generator [author communication] |
| Allocation concealment (selection bias) | Low risk | Comment: all participants were allocated at a single point in time following recruitment, so at time of recruitment, allocation was not known |
| Blinding of participants and personnel (performance bias) All outcomes | High risk | Comment: participants not blinded |
| Blinding of outcome assessment (detection bias) All outcomes | Low risk | Comment: most of the assessment process was blinded, except dual‐energy X‐ray absorptiometry measures [author communication] |
| Incomplete outcome data (attrition bias) Anthropometrics, Fitness | High risk | Comment: intention‐to‐treat analysis was not completed on outcomes of interest |
| Selective reporting (reporting bias) | Unclear risk | Comment: no protocol published; cannot assess |
Barbeau 2007.
| Study characteristics | ||
| Methods | Study design: RCT | |
| Participants |
Student inclusion criteria: black girls 8 to 12 years of age (Grades 3, 4, and 5) from 8 local elementary schools who weighed < 300 lbs; were not taking any medication known to affect body composition or fat distribution; and were able to participate in regular PA Student exclusion criteria: — Setting: school Age group: children Gender distribution: females Country/Countries where trial was performed: USA |
|
| Interventions |
Intervention: 10‐month after‐school PA programme on body composition and cardiovascular fitness in young black girls, offered every school day during the school year, with transportation (i.e. school bus service) provided to encourage participation. 30 minutes of homework time while students received a free, healthy snack and 80 minutes of PA. Snacks were individually packaged, and every day offered something salty (e.g. crackers and cheese), something sweet (e.g. low‐fat cookies), or a fruit or vegetable. Students chose 1 snack with the option of another if they wished. The PA included 25 minutes of skill development, 35 minutes of MVPA, with 20 minutes of toning and stretching. Students wore Polar Accurex Plus HR monitors (Port Washington, NY) every day and were instructed to maintain their heart rate above 150 beats/min during MVPA. MVPA activities included games such as basketball, tag, softball, relay races, etc., modified for activity of all students through the 35‐minute period. Students received small weekly prizes for behaviour and attitude, and for having no more than 1 unexcused absence. A student of the month at each school received a slightly larger prize, with prizes intended to reward good behaviour, participation, and effort. Parents were called when students had 2 consecutive unexcused absences, with reasons discussed and parents encouraged to send their daughter back to the programme. Teachers most often worked the intervention at their own school and in some cases were assigned to work at a different school. Teachers received formal training with background information on childhood obesity, PA, and cardiovascular risk factors, study goals, and the study protocol and types of activities appropriate for each segment of the intervention. Role‐playing was a large component of training; teachers were asked to prepare a lesson plan for 1 day and did a shortened simulation of it, so feedback could be provided. A Manual of Procedures for each school included all information needed to implement the intervention, including several potential activities. Teachers hired after training received 1‐on‐1 training on theoretical aspects and observed several sessions before their own implementation Comparator: — Duration of intervention: 10 months Duration of follow‐up: 10 months Number of schools: 8 Theoretical framework: — |
|
| Outcomes | BMI Fitness |
|
| Study registration | — | |
| Publication details |
Language of publication: English Funding: non‐commercial funding (National Institutes of Health) Publication status: peer‐reviewed journal |
|
| Stated aim for study | "This study targeted the prevention of further accretion of undesirable levels of adipose tissue in black girls through regular PA" | |
| Notes | ||
| Risk of bias | ||
| Bias | Authors' judgement | Support for judgement |
| Random sequence generation (selection bias) | Unclear risk | Comment: randomisation process not reported |
| Allocation concealment (selection bias) | Low risk | Comment: allocation occurred after testing; therefore concealed. It was not known or determined at time of study entry which group the next participant would go to |
| Blinding of participants and personnel (performance bias) All outcomes | Unclear risk | Comment: no information given; likely not done |
| Blinding of outcome assessment (detection bias) All outcomes | Unclear risk | Comment: no information given; likely not done |
| Incomplete outcome data (attrition bias) Anthropometrics, Fitness | High risk | Comment: incomplete outcome data not addressed |
| Selective reporting (reporting bias) | Unclear risk | Comment: no protocol published; cannot assess |
Williamson 2007.
| Study characteristics | ||
| Methods | Study design: cluster‐RCT | |
| Participants |
School inclusion criteria: 4 private Catholic schools School exclusion criteria: — Student inclusion criteria: students in Grades 2 to 6 during Year 1 were enrolled in the programme by written informed consent by students and their parents Student exclusion criteria: — Setting: school Age group: children Gender distribution: females and males Country/Countries where trial was performed: USA |
|
| Interventions |
The Healthy Eating and Exercise and Alcohol/Tobacco/Drug abuse prevention programmes were developed as environmental approaches for weight gain. The primary components of the programmes were to alter the physical and social environment of schools. Both programmes were rationally linked to a “Wise Mind” concept, which was a central feature of both programs, thus allowing the use of Wise Mind as the name for the programme (as a whole), as opposed to just 1 intervention arm of the study. The Wise Mind concept represents the idea that with knowledge and environmental changes, students can make wise decisions about nutrition, PA, and substance use or abuse. Environmental changes were designed to alter the ecology of the school environment, including policy, personal, social, cultural, and physical environmental changes Intervention: Healthy Eating and Exercise programme, designed with the goal of preventing inappropriate weight gain by modifying the school environment to improve healthy eating habits, increase PA, and decrease sedentary behaviour at school, and to encourage these same behavioural changes outside the school environment. The goal of the PA programme was to increase PA during the school day and at home. Teachers were provided containers filled with indoor play supplies (e.g. balloons, bean bags) and outdoor play supplies (e.g. balls, jump ropes) to promote active play during class time and recess. Posters encouraged the use of these physical activity centres, and brief lesson plans provided academic games that used the supplies provided at physical activity centres Comparator: Alcohol/Tobacco/Drug abuse prevention programme, designed with the goal of modifying children's beliefs and attitudes regarding use and abuse of tobacco, alcohol, and illicit drugs, so that they reflected "healthier" values Duration of intervention: 2 years Duration of follow‐up: 2 years Number of schools: 4 Theoretical framework: — |
|
| Outcomes | BMI | |
| Study registration | — | |
| Publication details |
Language of publication: English Funding: non‐commercial funding (National Institutes of Health Grant R01 DK063453–01) Publication status: peer‐reviewed journal |
|
| Stated aim for study | "The primary aim of the Wise Mind pilot project was to test whether an environmental approach for weight gain prevention, delivered in schools, was more effective for weight gain prevention in comparison with an active control program that used an environmental approach to prevent substance use. Secondary aims were to test for changes in percentage body fat, dietary habits, PA, and psychosocial variables associated with the weight gain prevention program" | |
| Notes | ||
| Risk of bias | ||
| Bias | Authors' judgement | Support for judgement |
| Random sequence generation (selection bias) | Low risk | Comment: random draw [author communication] |
| Allocation concealment (selection bias) | Low risk | Comment: all participants were allocated at a single point in time following recruitment, so at time of recruitment, allocation was not known |
| Blinding of participants and personnel (performance bias) All outcomes | Low risk | Comment: participants were blinded to group allocation [author communication] |
| Blinding of outcome assessment (detection bias) All outcomes | High risk | Comment: outcome assessors were not blinded [author communication] |
| Incomplete outcome data (attrition bias) Anthropometrics, Fitness | Low risk | Comment: missing values were replaced with calculated estimates |
| Selective reporting (reporting bias) | Unclear risk | Comment: no protocol published; cannot assess |
| Cluster RCT ‐ Recruitment bias | Low risk | Comment: randomisation occurred after baseline data collected [author communication] |
| Cluster RCT ‐ Baseline imbalance | High risk | Comment: not compared [author communication] |
| Cluster RCT ‐ Loss of clusters | Low risk | Comment: no clusters lost to follow‐up [author communication] |
| Cluster RCT ‐ Incorrect analysis | Low risk | Comment: clustering accounted for in analysis |
Haerens 2006.
| Study characteristics | ||
| Methods | Study design: cluster‐RCT | |
| Participants |
School inclusion criteria: random sample of 15 schools out of the 65 schools with technical and vocational education in West Flanders (Belgium) School exclusion criteria: — Student inclusion criteria: pupils in Grades 7 and 8 Student exclusion criteria: — Setting: school, urban Age group: adolescents Gender distribution: females and males Country/Countries where trial was performed: Belgium |
|
| Interventions |
Intervention 1: PA and nutrition intervention. PA intervention focused on increasing levels of MVPA to at least 60 minutes/d. Schools received an intervention box with sports materials such as ropes, balls, and beach ball sets and were encouraged to create more non‐competitive opportunities for students to be physically active during breaks, at noon, or during after‐school hours, and to vary content of PAs offered. Children received a physical fitness test at the beginning of the second intervention year, where all children had to cycle for 10 minutes on a computerised cycle ergometer, then were given information on their fitness level and possible ways to improve it. The computer‐tailored portion of the intervention was completed once each school year during 1 class hour. Children completed PA questions on a computer screen, which was immediately followed by tailored feedback on the screen (e.g. normative feedback regarding activity levels, PA recommendations). The nutrition intervention focused on 3 behavioural changes:
Schools were asked to sell fruit at very low prices or for free at least once/week, to offer fruit for dessert at lunch, and to offer free water via drinking fountains Intervention 2: PA and nutrition intervention (same as Intervention 1 group) plus parental involvement. Schools invited parents for an interactive meeting on healthy food, PA, and the relationship with overweight and health. 3 times/y, information on healthy food and PA was published in school papers and newsletters for parents, and parents received a free CD with the adult computer‐tailored intervention for fat intake and PA (same as the children's computer‐tailored intervention) for use at home and were asked to discuss results with their child and to give their child support to create a healthier lifestyle Comparator: no PA and nutrition intervention Duration of intervention: 2 years Duration of follow‐up: 2 years Number of schools: 15 Theoretical framework: trans theoretical model |
|
| Outcomes | PA duration Sedentary time BMI |
|
| Study registration | — | |
| Publication details |
Language of publication: English Funding: non‐commercial funding (Policy Research Centre Sport, Physical Activity and Health, funded by the Flemish Government) Publication status: peer‐reviewed journal |
|
| Stated aim for study | "The purpose of this study was to evaluate the 2‐year effects of an intervention targeting PA and healthy eating in middle schools" | |
| Notes | ||
| Risk of bias | ||
| Bias | Authors' judgement | Support for judgement |
| Random sequence generation (selection bias) | Unclear risk | Comment: randomisation process not reported |
| Allocation concealment (selection bias) | Low risk | Comment: all participants were allocated at a single point in time following recruitment, so at time of recruitment, allocation was not known |
| Blinding of participants and personnel (performance bias) All outcomes | Unclear risk | Comment: no information given; likely not done |
| Blinding of outcome assessment (detection bias) All outcomes | Unclear risk | Comment: no information given; likely not done |
| Incomplete outcome data (attrition bias) Anthropometrics, Fitness | High risk | Comment: incomplete outcome data; not adequately addressed |
| Selective reporting (reporting bias) | Unclear risk | Comment: no protocol published; cannot assess |
| Cluster RCT ‐ Recruitment bias | Unclear risk | Comment: unclear whether students were enrolled before randomisation |
| Cluster RCT ‐ Baseline imbalance | Unclear risk | Comment: baseline characteristics not described |
| Cluster RCT ‐ Loss of clusters | High risk | Comment: 704 participants lost to follow‐up; differences between those who dropped out and those who stayed in |
| Cluster RCT ‐ Incorrect analysis | Low risk | Comment: clustering accounted for in analysis |
Young 2006.
| Study characteristics | ||
| Methods | Study design: RCT | |
| Participants |
Student inclusion criteria: Grade 9 girls enrolled in an all‐girl public magnet high school and also enrolled in 2 consecutive semesters of required PE Student exclusion criteria: excused from meeting Maryland state PE requirements, pregnant or breastfeeding, planning to leave the geographic area, having a sister enrolled in the trial Setting: school, urban Age group: adolescents Gender distribution: females Country/Countries where trial was performed: USA |
|
| Interventions |
Intervention: the intervention was taught by a teacher hired by the project. Intervention content included information to make an informed decision about personal benefits of a physically active lifestyle, develop problem‐solving skills, and obtain support from others. Specific strategies that were taught and reinforced included goal‐setting, problem‐solving barriers, communication skills, reinforcement of goal achievement through internal and external rewards, and learning from relevant role models. Skills were taught using class lectures and discussions, small‐group discussions, and homework activities. PA self‐monitoring was given a strong focus. Students were encouraged to keep weekly exercise logs from which the teacher provided feedback on progress toward goal attainment and reward strategies. All students in class received the intervention, irrespective of whether they were trial participants. The intervention was also designed to maximise PA during PE class. The format was congruent with the school’s PE curriculum ‐ 1 semester of individual sports and 1 semester of team sports ‐ taught 5 days/week. Classes were optimised for PA by teaching units that were active in nature (e.g. soccer instead of softball (personal fitness unit), breaking skills training into small‐group activities, and playing games in small groups (e.g. 3‐on‐3 basketball). Skills training was limited to that needed for competency rather than proficiency. Written tests focused on health‐related PA and fitness concepts and behavioural skills. The family support component consisted of a family workshop, monthly newsletters, and adult‐child homework assignments. A 2‐hour family workshop, scheduled shortly after randomisation, featured tips on how parents could provide support to their daughters. As an in‐class activity, students worked on skits illustrating support strategies that were videotaped and viewed at the workshop. Families who did not attend were mailed copies. Families also received a 2‐page family support newsletter each month that contained an article on ways families can support PA with their daughter Comparator: standard PE class was a curriculum in which students were taught skills in individual and team sports. For example, during the basketball unit, students were taught how to dribble, shoot, and pass, and were tested on concepts such as game rules and defence strategies. Similar to the intervention structure, 1 semester focused on individual sports and the other on team sports. Classes were taught by certified PE teachers employed by the school. Parents of participants in the standard PE class also received monthly newsletters. Topics were of general health interest and an article about PE class content that month was included Duration of intervention: 1 school year Duration of follow‐up: 1 school year Number of schools: 1 Theoretical framework: social action theory |
|
| Outcomes | BMI | |
| Study registration | — | |
| Publication details |
Language of publication: English Funding: non‐commercial funding (National Institutes of Health) Publication status: peer‐reviewed journal |
|
| Stated aim for study | "This trial tests the effectiveness of a life skills–oriented PA intervention, conducted in PE class by a teacher hired by the project, for increasing PA and fitness in ninth‐grade girls" | |
| Notes | ||
| Risk of bias | ||
| Bias | Authors' judgement | Support for judgement |
| Random sequence generation (selection bias) | Low risk | Comment: coin flip [author communication] |
| Allocation concealment (selection bias) | Low risk | Comment: all participants were allocated at a single point in time following recruitment, so at time of recruitment, allocation was not known |
| Blinding of participants and personnel (performance bias) All outcomes | High risk | Comment: no blinding of personnel or participants [author communication] |
| Blinding of outcome assessment (detection bias) All outcomes | Low risk | Comment: outcome assessors were blinded for primary outcome assessment [author communication] |
| Incomplete outcome data (attrition bias) Anthropometrics, Fitness | Low risk | Comment: less than 10% dropout rate; reasons given |
| Selective reporting (reporting bias) | Unclear risk | Comment: no protocol published or trial registry; cannot assess |
Bayne‐Smith 2004.
| Study characteristics | ||
| Methods | Study design: RCT | |
| Participants |
Student inclusion criteria: urban, multi‐ethnic teenaged girls, aged 14 to 19 years Student exclusion criteria: — Setting: school, urban Age group: adolescents Gender distribution: females Country/Countries where trial was performed: USA |
|
| Interventions |
Intervention: the Physical Activity and Teenage Health curriculum was taught as a personal wellness course that integrated vigorous exercise, health and nutrition education, and behaviour modification. Physical Activity and Teenage Health student manuals were developed to provide students with information about anatomy and physiology of the heart, cardiovascular risk factors, the heart disease process, proper exercise and nutrition, stress management, cigarette smoking avoidance and cessation techniques, and strategies for modifying high‐risk health behaviours. Physical Activity and Teenage Health teacher manuals were provided to PE teachers containing instructions for teaching the programme curriculum and assessing outcomes. PE teachers using the Physical Activity and Teenage Health curriculum received in‐service training from the investigation team before and during the intervention. The Physical Activity and Teenage Health programme consisted of 30‐minute classes conducted 5 days/week for 12 weeks. Individual classes began with a 5‐ to 10‐minute lecture and discussion featuring a topic on cardiovascular health and fitness and suggestions for modifying health behaviours. In addition, students frequently were given homework assignments designed to enhance or clarify lecture material through use of Physical Activity and Teenage Health manuals. Lecture and discussion were followed by 20 to 25 minutes of vigorous PA in the form of resistance exercise to improve muscular strength and endurance or aerobic exercise to improve cardiovascular fitness. Students alternated resistance and aerobic training each day. Resistance exercise consisted of a vigorous programme of circuit weight training at a variety of isotonic and isokinetic exercise stations. Students performed 90‐ to 120‐second bouts of weight lifting at 50% to 70% of the 1‐repetition maximum (maximum resistance that can be lifted 1 time). Aerobic training included a variety of vigorous exercises, such as stationary bicycling, stair stepping, rope jumping, fast walking, jogging, step aerobics, and aerobic dance. Students were instructed to exercise continuously at 70% to 85% of their age‐predicted maximum heart rate. Students were taught how to self‐monitor heart rates during or immediately upon cessation of exercise by palpation of the radial or carotid pulse Comparator: frequency and duration of traditional PE classes were identical to those of Physical Activity and Teenage Health classes. Because PE classes did not include lecture and discussion, they had approximately 5 minutes more PA/class than Physical Activity and Teenage Health classes Duration of intervention: 12 weeks Duration of follow‐up: 12 weeks Number of schools: 3 Theoretical framework: — |
|
| Outcomes | BMI Fitness |
|
| Study registration | — | |
| Publication details |
Language of publication: English Funding: other funding (Professional Staff Congress ‐ City University of New York, Faculty Research Awards Program, Research Foundation of City University of New York; Department of Health, State of New York; and Operation Fitkids, Inc.) Publication status: peer‐reviewed journal |
|
| Stated aim for study | "We sought to assess the effects of a school based intervention program of vigorous exercise integrated with health and nutrition education promoting behavioral change in cardiovascular disease risk factors, heart health knowledge, and fitness levels among urban, multiethnic teenaged girls" | |
| Notes | ||
| Risk of bias | ||
| Bias | Authors' judgement | Support for judgement |
| Random sequence generation (selection bias) | Unclear risk | Comment: randomisation process not reported |
| Allocation concealment (selection bias) | Low risk | Comment: all participants were allocated at a single point in time following recruitment, so at time of recruitment, allocation was not known |
| Blinding of participants and personnel (performance bias) All outcomes | Unclear risk | Comment: no information given; likely not done |
| Blinding of outcome assessment (detection bias) All outcomes | Unclear risk | Comment: no information given; likely not done |
| Incomplete outcome data (attrition bias) Anthropometrics, Fitness | Unclear risk | Comment: incomplete outcome data not addressed |
| Selective reporting (reporting bias) | Unclear risk | Comment: no protocol paper or trial registry |
Simon 2004.
| Study characteristics | ||
| Methods | Study design: cluster‐RCT | |
| Participants |
School inclusion criteria: 8 schools out of 77 public middle‐schools at the Department of Bas‐Rhin (Eastern France) were randomly selected School exclusion criteria: — Student inclusion criteria: all initially first‐level students (corresponding to USA Grade 6) at these schools Student exclusion criteria: — Setting:: community, school, urban Age group: children Gender distribution: females and males Country/Countries where trial was performed: France |
|
| Interventions |
Intervention: the Intervention Centred on Adolescents’ Physical Activity and Sedentary Behaviour programme was implemented over 4 academic years to promote PA inside and outside. The intervention includes an educational component focusing on PA and sedentary behaviours and new opportunities for PA during school hours (lunch break, recess) and after school hours. Activities implemented are either informal or academic with emphasis on fun and pleasure, well‐being, and non‐competitiveness. Sporting events and bicycle and on‐foot transport are organised, with teachers, parental organisations, and sport associations encouraged to participate in meetings and regular contact. Intervention staff are informed of study objectives and work in collaboration with different partners. The Intervention Centred on Adolescents’ Physical Activity and Sedentary Behaviour coordinators regularly visit intervention school members to inquire about difficulties and to help resolve material or personnel needs Comparator: — Duration of intervention: 40 weeks/y × 4 years Duration of follow‐up: 4 school years Number of schools: 8 Theoretical framework: — |
|
| Outcomes | BMI | |
| Study registration | NCT00498459 (registered retrospectively) | |
| Publication details |
Language of publication: English Funding: other funding (Caisse Regionale d’Assurance Maladie d’Alsace Moselle, French National Plan for Nutrition and Health, Institut national de la SNE et de la recherche médicale, Conseil General of the Bas‐Rhin, Communes of Drusenheim, Illkirch‐Graffenstaden, Obernai and Schiltigheim, and Masterfoods) Publication status: peer‐reviewed journal |
|
| Stated aim for study | "We wish to assess whether the intervention as implemented has produced a favourable influence on the activity patterns of the adolescents and on different psychological variables related to PA with a particular interest on the interconnection between these variables" | |
| Notes | ||
| Risk of bias | ||
| Bias | Authors' judgement | Support for judgement |
| Random sequence generation (selection bias) | Low risk | Comment: random numbers table [author communication] |
| Allocation concealment (selection bias) | Low risk | Comment: all participants were allocated at a single point in time following recruitment, so at time of recruitment, allocation was not known |
| Blinding of participants and personnel (performance bias) All outcomes | High risk | Comment: no participants or personnel were blinded other than data analysts [author communication] |
| Blinding of outcome assessment (detection bias) All outcomes | High risk | Comment: outcome assessors were not blinded [author communication] |
| Incomplete outcome data (attrition bias) Anthropometrics, Fitness | Low risk | Comment: outcome data complete |
| Selective reporting (reporting bias) | Low risk | Comment: all outcomes identified a priori were reported on |
| Cluster RCT ‐ Recruitment bias | High risk | Comment: students were recruited after randomisation |
| Cluster RCT ‐ Baseline imbalance | Low risk | Comment: groups equal at baseline |
| Cluster RCT ‐ Loss of clusters | Low risk | Comment: 2008 paper of complete results; 7/479 and 3/475 were lost for unknown reason; all others due to school transfer |
| Cluster RCT ‐ Incorrect analysis | Low risk | Comment: clustering accounted for in analysis |
Trevino 2004.
| Study characteristics | ||
| Methods | Study design: cluster‐RCT | |
| Participants |
School inclusion criteria: elementary schools with no previous exposure to Bienestar School exclusion criteria: alternative schools Student inclusion criteria: all Grade 4 children regardless of race and ethnicity Student exclusion criteria: those older than 12 years, students previously diagnosed with type 1 or type 2 diabetes mellitus, and students with extreme dietary values Setting: school, urban Age group: children Gender distribution: females and males Country/Countries where trial was performed: USA |
|
| Interventions |
Intervention: Bienestar Health Progam, 50 sessions of health programming across 7 months to transmit to children 3 health behaviour messages associated with diabetes mellitus control (decreased dietary saturated fat intake, increased dietary fibre intake, increased PA). Taught and reinforced through classroom, home, school cafeteria, and after school care educational activities. PE teachers, parents, school cafeteria staff, and after school care staff were asked to encourage less dietary saturated fat, greater fibre intake, and more PA, to have less saturated fat and more fibre and PA available. Children were asked to set goals aimed at accomplishing targeted behaviours and to keep records of their accomplishments. Children were also asked to encourage their peers and adult caretakers to practise 3 health behaviours. Children and parents who practised the 3 health behaviours were rewarded with coupons from a store set up at school. Students could purchase merchandise with the coupons Comparator: — Duration of intervention: 7 months Duration of follow‐up: 7 months Number of schools: 44 Theoretical framework: social cognitive theory and socioecological theory |
|
| Outcomes | Fitness | |
| Study registration | — | |
| Publication details |
Language of publication: English Funding: non‐commercial funding (National Institutes of Health ‐ National Institue of Diabetes and Digestive and Kidney Disease) Publication status: peer‐reviewed journal |
|
| Stated aim for study | "This study tested the efficacy of the Bienestar Health Program ('well‐being' in Spanish)" | |
| Notes | ||
| Risk of bias | ||
| Bias | Authors' judgement | Support for judgement |
| Random sequence generation (selection bias) | Low risk | Comment: randomisation took place via a random numbers table |
| Allocation concealment (selection bias) | Low risk | Comment: methods ensured that no one could foresee intervention assignment |
| Blinding of participants and personnel (performance bias) All outcomes | Low risk | Quote from publication: “principals of schools were informed and asked not to inform students, parents or school staff of the intervention assignment” (Trevino 2004, p912) |
| Blinding of outcome assessment (detection bias) All outcomes | Low risk | Quote from publication: "temporary staff, separate from programs and masked to the intervention, were hired and trained to collect the data" |
| Incomplete outcome data (attrition bias) Anthropometrics, Fitness | Low risk | Comment: outcome data complete |
| Selective reporting (reporting bias) | Unclear risk | Comment: no protocol published or trial registry |
| Cluster RCT ‐ Recruitment bias | Low risk | Comment: data collected before randomisation |
| Cluster RCT ‐ Baseline imbalance | Low risk | Comment: groups balanced at baseline |
| Cluster RCT ‐ Loss of clusters | High risk | Comment: 1 school withdrew after randomisation |
| Cluster RCT ‐ Incorrect analysis | Low risk | Comment: clustering accounted for in the analysis |
Stone 2003.
| Study characteristics | ||
| Methods | Study design: cluster‐RCT | |
| Participants |
School inclusion criteria: projected enrolment of at least 15 children in Grade 3, at least 90% of third‐graders were American Indians, retention rates from Grade 3 to 5 over the past 3 years at least 70%, school meals prepared and administered on‐site, existence of facilities for PA programmes and approval of the study by school, community, and tribal authorities School exclusion criteria: — Student inclusion criteria: Grade 3 students Student exclusion criteria: — Setting: school Age group: children Gender distribution: females and males Country/Countries where trial was performed: USA |
|
| Interventions |
Intervention: the intervention programme was implemented during Grades 3 through 5, with 4 components, including food service, skills‐based classroom curricula, family, and PE. The intervention combined social learning theory and principles of American Indian culture and practices, with indigenous learning modes (e.g. story telling) incorporated. Classroom component: 2 × 45‐minute lessons delivered by teachers weekly for 12 weeks during Grades 3 and 4, decreased to 8 weeks in Grade 5. Food service component consisted of nutrient guidelines and tools for reducing fat content of school meals while meeting nutrient requirements. Food service staff provided skill building for planning, purchasing, and preparing lower‐fat school meals. PE component consisted of a minimum of 3 × 30‐minute sessions/week of MVPA based on SPARK. Family component included assistance creating a supportive environment with an interactive forum to discuss Pathways and family action packs and family events at schools Comparator: — Duration of intervention: 12 weeks/year × 3 years Duration of follow‐up: 3 years Number of schools: 41 Theoretical framework: social learning theory, incorporating cultural heritage of American Indians |
|
| Outcomes | BMI | |
| Study registration | NCT00000545 (retrospectively registered) | |
| Publication details |
Language of publication: English Funding: non‐commercial funding (supported by National Heart, Lung, and Blood Institute grants) Publication status: peer‐reviewed journal |
|
| Stated aim for study | "The Pathways Study was launched in 1993 as a field trial to test the effectiveness of a multi‐component school‐based program intended to reduce the prevalence of obesity in American‐Indian students by focusing on healthy environments as well as diet and PA" | |
| Notes | ||
| Risk of bias | ||
| Bias | Authors' judgement | Support for judgement |
| Random sequence generation (selection bias) | Low risk | Comment: stratified randomisation by a central coordinating centre |
| Allocation concealment (selection bias) | Low risk | Comment: all participants were allocated at a single point in time following recruitment, so at time of recruitment, allocation was not known |
| Blinding of participants and personnel (performance bias) All outcomes | High risk | Comment: no participants or personnel were blinded to study condition [author communication] |
| Blinding of outcome assessment (detection bias) All outcomes | Unclear risk | Comment: outcome assessors were not blinded to study condition [author communication] |
| Incomplete outcome data (attrition bias) Anthropometrics, Fitness | Low risk | Comment: outcome data complete |
| Incomplete outcome data (attrition bias) Physical activity and sedentary time | Low risk | Comment: outcome data complete |
| Selective reporting (reporting bias) | Low risk | Comment: all outcomes identified a priori were reported |
| Cluster RCT ‐ Recruitment bias | Low risk | Comment: randomisation conducted after individual recruitment |
| Cluster RCT ‐ Baseline imbalance | Low risk | Comment: baseline comparison found no difference [author communication] |
| Cluster RCT ‐ Loss of clusters | Low risk | Comment: no clusters were lost to follow‐up [author communication] |
| Cluster RCT ‐ Incorrect analysis | Low risk | Comment: describe multi‐level model to account for clustering in analysis section (Caballero 2003) |
Burke 1998.
| Study characteristics | ||
| Methods | Study design: cluster‐RCT | |
| Participants |
School inclusion criteria: — School exclusion criteria: — Student inclusion criteria: — Student exclusion criteria: — Setting: school, home Age group: children Gender distribution: females and males Country/Countries where trial was performed: Australia |
|
| Interventions |
Intervention 1: standard PA and nutrition programme (West Australian Schools Physical Activity and Nutrition project) in 6 schools, which consisted of classroom lessons to establish a rationale, plus 20‐minute fitness sessions daily by means of small‐group activities that allowed for individual fitness levels and provided a range of options by means of progression through graded activities. 4 fitness sessions/week was considered a realistic expectation. The nutrition programme aimed to improve children’s diets by prompting families to review their diet; reducing consumption of fat, sugar, and salt; increasing fibre intake; and creating links between home and school for health promotion. The nutrition programme is built around 4 comic books in which 2 space creatures must discover the dietary habits of humans. It includes a Teachers’ Handbook, a Home‐based Mission Booklet, a Class Activities Booklet, incentives, and a Recipe Booklet that presents recipes written for children by children. Home‐based Missions and Class Activities are combined in activities such as planning a week’s grocery shopping on the basis of advertised prices and in learning strategies to resist peer pressure. The Incentives Booklet includes a progress chart, stickers, and a completion certificate to encourage participation of children and parents. Duration of nutrition class activities aimed for 1 hour/week Intervention 2: standard West Australian Schools Physical Activity and Nutrition programme plus a PA‐enrichment programme for higher‐risk children in 7 schools, which consisted of incorporating the teacher‐parent‐student triad and allowed PA needs and preferences to be met outside the setting of the whole class. Children kept regular, but not continuous, 7‐day PA diaries, which were used by teachers to identify preferred activities and ways these might be increased in duration or frequency. Teachers and students worked together to establish goals and decide on how these might be attained. Parents were asked to monitor completion of diaries and to encourage increased levels of PA Comparator: no programme in 5 schools Duration of intervention: 9 months Duration of follow‐up: 15 months Number of schools: 18 Theoretical framework: — |
|
| Outcomes | BMI Fitness |
|
| Study registration | — | |
| Publication details |
Language of publication: English Funding: non‐commercial funding (supported by a Program Grant from the National Health and Medical Research Council of Australia and by the Australian Rotary Health Research Fund) Publication status: peer‐reviewed journal |
|
| Stated aim for study | "In the present study, we therefore aim standard West Australian Schools Physical Activity and Nutrition program to involve higher risk children by means of principles of educational reinforcement, combining an 'enrichment' program with the previously reported..." | |
| Notes | ||
| Risk of bias | ||
| Bias | Authors' judgement | Support for judgement |
| Random sequence generation (selection bias) | Unclear risk | Comment: randomisation process not reported |
| Allocation concealment (selection bias) | Low risk | Comment: all participants were allocated at a single point in time following recruitment, so at time of recruitment, allocation was not known |
| Blinding of participants and personnel (performance bias) All outcomes | Unclear risk | Comment: no information given, likely not done |
| Blinding of outcome assessment (detection bias) All outcomes | Unclear risk | Comment: no information given, likely not done |
| Incomplete outcome data (attrition bias) Anthropometrics, Fitness | Low risk | Comment: outcome data complete |
| Selective reporting (reporting bias) | Unclear risk | Comment: no protocol published or trial registry |
| Cluster RCT ‐ Recruitment bias | Unclear risk | Comment: no indication participants were registered before randomisation |
| Cluster RCT ‐ Baseline imbalance | Low risk | Comment: baseline differences adjusted for in analysis |
| Cluster RCT ‐ Loss of clusters | Low risk | Comment: no clusters lost |
| Cluster RCT ‐ Incorrect analysis | Low risk | Comment: clustering was accounted for in analysis |
Ewart 1998.
| Study characteristics | ||
| Methods | Study design: RCT | |
| Participants |
Student inclusion criteria: after parental consent was obtained, all entering Grade 9 students were invited to participate in health screening. Girls with blood pressure in the top third of normal distribution for systolic or diastolic pressure were invited to participate Student exclusion criteria: — Setting: school, home, urban Age group: adolescents Gender distribution: females Country/Countries where trial was performed: USA |
|
| Interventions |
Intervention: 50‐minute 'Project Heart' aerobic exercise classes including didactic instruction over 18 weeks Comparator: 50‐minute standard PE classes Duration of intervention: 18 weeks Duration of follow‐up: 18 weeks Number of schools: 1 Theoretical framework: — |
|
| Outcomes | BMI | |
| Study registration | — | |
| Publication details |
Language of publication: English Funding: non‐commercial funding (RO1‐HL45139 from the National Heart, Lung, and Blood Institute to the first study author) Publication status: peer‐reviewed journal |
|
| Stated aim for study | "The present study evaluated the effectiveness of a school‐based aerobic exercise intervention, Project Heart, in increasing cardiorespiratory fitness and lowering blood pressure in adolescent girls at increased risk for hypertension" | |
| Notes | ||
| Risk of bias | ||
| Bias | Authors' judgement | Support for judgement |
| Random sequence generation (selection bias) | Unclear risk | Comment: randomisation process not reported |
| Allocation concealment (selection bias) | Low risk | Comment: all participants were allocated at a single point in time following recruitment, so at time of recruitment, allocation was not known |
| Blinding of participants and personnel (performance bias) All outcomes | Unclear risk | Comment: No information given; likely not done |
| Blinding of outcome assessment (detection bias) All outcomes | Low risk | Comment: reported that technicians taking measurements were not aware of girls' experimental status |
| Incomplete outcome data (attrition bias) Anthropometrics, Fitness | Low risk | Comment: outcome data complete |
| Selective reporting (reporting bias) | Low risk | Comment: all outcomes identified a priori were reported on |
Luepker 1996.
| Study characteristics | ||
| Methods | Study design: cluster‐RCT | |
| Participants |
School inclusion criteria: recruitment of schools was based on their distance from 1 of the 4 study centres, their ethnic diversity, their food service's potential for intervention, and their commitment to offering at least 90 minutes/week of PE and to participating in a 3‐year study School exclusion criteria: — Student inclusion criteria: initially Grade 3 students who agreed to have a blood test Student exclusion criteria: — Setting: school, home, urban Age group: children Gender distribution: females and males Country/Countries where trial was performed: USA |
|
| Interventions |
Intervention (overview): the Child and Adolescent Trial for Cardiovascular Health Intervention included school‐based (school food service, PE, classroom curricula) and family‐based (home curricula, family fun nights) components. School food service changes and PE enhancement were ongoing throughout the 3 school years, whereas classroom and home curricula were implemented (by classroom teachers) over a fixed time period during each school year and addressed eating habits (Grades 3 through 5), PA (Grades 4 and 5), and cigarette smoking (Grade 5 only). Eat Smart, the food service intervention, provided children with healthy meals that maintained recommended levels of essential nutrients and child participation in school meal programmes. Food service personnel attended a 1‐day training session at the beginning of each school year. They were provided more information, assistance in planning, and other support during monthly follow‐up visits to schools and booster sessions. PE specialists and teachers attended 1 to 1.5 days of training every school year. Classroom curricula included the Adventures of Hearty Heart and Friends (Grade 3; 15, 30‐ to 40‐minute classes during 5 weeks); Go for Healths (Grade 4; 24, 30‐ to 40‐minute classes during 12 weeks); Go for Health‐5 (Grade 5; 16; 30‐ to 40‐minute classes during 8 weeks); and F.A.C.T.S. for Five (Grade 5; 4‐session tobacco use prevention curriculum). Classroom teachers attended 1 to 1.5 days of training every year to learn how to implement the curricula. For the home curriculum, 19 activity packets (over the course of 3 school years) that complemented classroom curricula were sent home with students and required adult participation to complete. During Grades 3 and 4, students invited their family members to a "family fun night" (dance performances, food booths, recipe distribution, and games). Intervention schools were further randomised into 2 equal subgroups Intervention 1: 1 group received a school‐based programme consisting of school food service modifications, PE interventions, and Child and Adolescent Trial for Cardiovascular Health curricula Intervention 2: 1 group received the same school‐based programme plus a family‐based programme Comparator: control group received usual health curricula, PE, and food service programmes, but none of the Child and Adolescent Trial for Cardiovascular Health interventions Duration of intervention: 3 years Duration of follow‐up: 3 years Number of schools: 96 Theoretical framework: health belief model |
|
| Outcomes | BMI | |
| Study registration | NCT00000467 (retrospectively registered) | |
| Publication details |
Language of publication: English Funding: non‐commercial funding (National Heart, Lung, and Blood Institute) Publication status: peer‐reviewed journal |
|
| Stated aim for study | "The Child and Adolescent Trial for Cardiovascular Health 22 was designed to augment the research of the 1980s in cardiovascular disease prevention among young people by using a sophisticated research design involving a large number of schools, a multi‐component behavioral health intervention over 3 grades, and children of diverse communities" | |
| Notes | ||
| Risk of bias | ||
| Bias | Authors' judgement | Support for judgement |
| Random sequence generation (selection bias) | Low risk | Comment: computer‐generated random numbers table [author communication] |
| Allocation concealment (selection bias) | Low risk | Comment: all participants were allocated at a single point in time following recruitment, so at time of recruitment, allocation was not known |
| Blinding of participants and personnel (performance bias) All outcomes | High risk | Comment: no blinding [author communication] |
| Blinding of outcome assessment (detection bias) All outcomes | High risk | Comment: no blinding [author communication] |
| Incomplete outcome data (attrition bias) Anthropometrics, Fitness | Low risk | Comment: outcome data complete |
| Selective reporting (reporting bias) | Low risk | Comment: all outcomes identified a priori were reported on |
| Cluster RCT ‐ Recruitment bias | Low risk | Comment: data collected before school randomisation [author communication] |
| Cluster RCT ‐ Baseline imbalance | Low risk | Comment: baseline group balance |
| Cluster RCT ‐ Loss of clusters | Low risk | Comment: no loss of clusters |
| Cluster RCT ‐ Incorrect analysis | Low risk | Comment: clustering adjusted for in the analysis |
Bush 1989.
| Study characteristics | ||
| Methods | Study design: cluster‐RCT | |
| Participants |
School inclusion criteria: public elementary schools in Washington, DC School exclusion criteria: — Student inclusion criteria: students who were attending Grades 4 to 6 at 9 public elementary schools in 1983 Student exclusion criteria: — Setting: school, home, community, physician office, a mix of urban and rural Age group: children Gender distribution: females and males Country/Countries where trial was performed: USA |
|
| Interventions |
Intervention 1: 'Know Your Body' curriculum. Focus on nutrition, fitness, and prevention of cigarette smoking. Curriculum to motivate students to attain and maintain lifestyles that will reduce students’ risk of developing heart disease and cancer. Includes a personalised health screening, with each student receiving results in a 'health passport'. Parents are involved through several mechanisms; they are mailed 2 copies of their children’s screening results ‐ 1 copy to keep and 1 for the child’s physician ‐ and copies of a quarterly 'Know Your Body' newsletter; the programme is introduced by staff at parent‐teacher association meetings Intervention 2: received the same intervention as Intervention 1, but only parents received the results of cholesterol tests and students were not provided these results to enter into their 'health passports’ with other screening results Comparator: did not receive the 'Know Your Body’ curriculum and were not provided any screening results. Only parents of control participants received screening results Duration of intervention: 4 years Duration of follow‐up: 4 years Number of schools: 9 Theoretical framework: PRECEDE and social learning theory |
|
| Outcomes | BMI | |
| Study registration | — | |
| Publication details |
Language of publication: English Funding: non‐commercial funding (National Institutes of Health) Publication status: peer‐reviewed journal |
|
| Stated aim for study | "The goals of the study were to evaluate the effects of the curriculum by measuring changes in the prevalence of risk factors and to evaluate the effectiveness of providing individual cholesterol results to students" | |
| Notes | ||
| Risk of bias | ||
| Bias | Authors' judgement | Support for judgement |
| Random sequence generation (selection bias) | Unclear risk | Comment: no description of the randomisation process given |
| Allocation concealment (selection bias) | Low risk | Comment: all participants were allocated at a single point in time following recruitment, so at time of recruitment, allocation was not known |
| Blinding of participants and personnel (performance bias) All outcomes | Unclear risk | Comment: no information given; likely not done |
| Blinding of outcome assessment (detection bias) All outcomes | Unclear risk | Comment: no information given; likely not done |
| Incomplete outcome data (attrition bias) Anthropometrics, Fitness | High risk | Quote from publication: "only 431 (41.4%) participants were re‐screened 2 years after forming the cohort. Students who had moved from a control to an intervention school or vice versa were dropped from the analysis" (Bush 1989, p472) |
| Selective reporting (reporting bias) | Unclear risk | Comment: no protocol paper published nor trial registry |
| Cluster RCT ‐ Recruitment bias | Unclear risk | Comment: not described |
| Cluster RCT ‐ Baseline imbalance | Low risk | Comment: differences in baseline values adjusted for in analyses |
| Cluster RCT ‐ Loss of clusters | High risk | Comment: clusters lost to follow‐up |
| Cluster RCT ‐ Incorrect analysis | High risk | Comment: no adjustment for clustering in the analysis |
Walter 1988.
| Study characteristics | ||
| Methods | Study design: cluster‐RCT | |
| Participants |
School inclusion criteria: elementary schools in School District 11 in the Bronx and elementary schools in 4 school districts in Westchester County School exclusion criteria: — Student inclusion criteria: schoolchildren in 2 demographically dissimilar areas in and near New York; students in Grade 4 in the Bronx, a lower‐income borough, or Westchester County, a middle‐ and upper‐income suburb Student exclusion criteria: — Setting: school, community, urban Age group: children Gender distribution: females and males Country where trial was performed: USA |
|
| Interventions |
Intervention: a special curriculum targeting voluntary changes in risk behaviour in the area of diet, PA, and smoking. Curriculum content was designed to provide the information and motivation necessary for behavioural changes, as well as training in the skills necessary to make such changes. Intervention foci (perceived susceptibility to, and severity of, health problems; perceived benefits of, and barriers to, adopting and maintaining risk reduction types of behaviour) were derived from the health belief model; skills training strategies were derived from social learning theory. Cognitive development theory provided a framework for appropriate tailoring of these constructs to children's changing maturational stages; the study progressed over a 5‐year period. The PA component of the intervention fostered adoption of a regular programme of endurance exercise. The special curriculum was taught in classrooms by specially trained regular teachers for approximately 2 hours/week throughout each school year
Comparator: — Duration of intervention: 6 years Duration of follow‐up: 6 years Number of schools: 37 Theoretical framework: PRECEDE, health belief model, social learning theory |
|
| Outcomes | BMI | |
| Study registration | NCT00005406 (retrospectively registered) | |
| Publication details |
Language of publication: English Funding: non‐commercial funding (National Heart, Lung, and Blood Institute and National Cancer Institute) Publication status: peer‐reviewed journal |
|
| Stated aim for study | "The aims of the study were to shift favourably the population distribution of levels of blood pressure, blood lipids, body mass, and physical fitness through appropriate modifications in diet and PA, and to reduce the number of students starting to smoke cigarettes" | |
| Notes | ||
| Risk of bias | ||
| Bias | Authors' judgement | Support for judgement |
| Random sequence generation (selection bias) | Unclear risk | Comment: randomisation process not reported |
| Allocation concealment (selection bias) | Low risk | Comment: all participants were allocated at a single point in time following recruitment, so at time of recruitment, allocation was not known |
| Blinding of participants and personnel (performance bias) All outcomes | Unclear risk | Comment: no information given; likely not done |
| Blinding of outcome assessment (detection bias) All outcomes | Unclear risk | Comment: no information given; likely not done |
| Incomplete outcome data (attrition bias) Anthropometrics, Fitness | Low risk | Comment: analyses were done to see if bias would be introduced due to attrition; average risk values were imputed |
| Selective reporting (reporting bias) | Unclear risk | Comment: no protocol paper published; trial registered retrospectively |
| Cluster RCT ‐ Recruitment bias | Unclear risk | Comment: unclear when individual participants were enrolled |
| Cluster RCT ‐ Baseline imbalance | Unclear risk | Comment: no statistical test for baseline differences |
| Cluster RCT ‐ Loss of clusters | Unclear risk | Comment: not described |
| Cluster RCT ‐ Incorrect analysis | Low risk | Quote from publication: "school rather than the student was used as the unit of analysis" |
—: denotes not reported.
BMI: body mass index.
MVPA: moderate to vigorous physical activity.
PA: physical activity.
PE: physical education.
RCT: randomised controlled trial.
Characteristics of excluded studies [ordered by study ID]
| Study | Reason for exclusion |
|---|---|
| Abdukić 2015 | Intervention not aimed at promoting physical activity |
| Aceves‐Martins 2017 | No objective measure of physical activity or physical fitness |
| ACTRN12619000091101 | No objective measure of physical activity or physical fitness |
| ACTRN12619000431123 | Intervention not aimed at promoting physical activity |
| ACTRN12619000457145 | Data on outcomes from children aged 6 to 18 not reported |
| ACTRN12619000766112 | Intervention < 12 weeks |
| ACTRN12619000854134 | Data on relevant outcomes for children aged 6 to 18 years not reported |
| ACTRN12619001229167 | No objective measure of physical activity or fitness |
| Adab 2014 | Not a randomised controlled trial |
| Adkins 2017 | Not a randomised controlled trial |
| Adsiz 2012 | Data on relevant outcomes not reported |
| Agurto 2018 | Intervention not school‐based |
| Aittasalo 2019 | Intervention < 12 weeks |
| Akdemir 2017 | Data on relevant outcomes in children aged 6 to 18 not reported |
| Aleksić 2013 | No objective measure of physical activity or physical fitness |
| Alexander 2014 | Not a randomised controlled trial |
| Alievi 2019 | Data on relevant outcomes not reported |
| Allara 2018 | Not a randomised controlled trial |
| Almas 2013 | Not a randomised controlled trial |
| Androutsos 2014 | Data on relevant outcomes for children aged 6 to 18 years not reported |
| Annesi 2017 | Intervention not school‐based |
| Anselma 2019 | Data on relevant outcomes not reported |
| Araujo‐Soares 2009a | No objective measures of physical activity, physical fitness, or body composition |
| Ardic 2017 | Not a randomised controlled trial |
| Arlinghaus 2017 | No objective measure of physical activity or physical fitness reported |
| Armstrong 2016 | Not a randomised controlled trial |
| Ashanin 2018 | Not a randomised controlled trial |
| Åvitsland 2020 | Data on relevant outcomes not reported |
| Babic 2016 | Not aimed at the general population |
| Bacardi‐Gascon 2012 | Intervention not aimed at promoting physical activity |
| Bailey 2015 | Intervention < 12 weeks |
| Baranowski 2019 | Not aimed at general population |
| Barbosa 2015 | No objective measure of physical activity or physical fitness |
| Barbosa Filho 2019 | Data on relevant outcomes not reported |
| Barr‐Anderson 2012 | Not a randomised controlled trial |
| Barrett‐Williams 2017 | Not a randomised controlled trial |
| Bartholomew 2018 | Data on physical activity not reported |
| Barton 2015 | Intervention < 12 weeks |
| Batistão 2019 | Intervention < 12 weeks |
| Bechter 2019 | Intervention < 12 weeks |
| Bechter 2019a | Intervention < 12 weeks |
| Beets 2014 | Intervention not school‐based. |
| Beets 2015 | Intervention not school‐based. |
| Beets 2016 | Intervention not school‐based. |
| Belansky 2016 | Not a randomised controlled trial |
| Bell 2019 | Intervention not aimed at promoting physical activity |
| Benden 2011 | Data on relevant outcomes not reported |
| Benden 2014 | Data on relevant outcomes not reported |
| Berger‐Jenkins 2014 | Not a randomised controlled trial |
| Beyler 2014 | Data on relevant outcomes not reported |
| Bhave 2016 | Not a randomised controlled trial |
| Biddle 2015 | Intervention not school‐based. |
| Bilak‐Moconja 2018 | No objective measure of physical activity or physical fitness |
| Blaes 2013 | Intervention < 12 weeks |
| Bleeker 2015 | Data on relevant outcomes not reported |
| Bogart 2016 | Intervention < 12 weeks |
| Bonnema 2020 | Data on relevant outcomes not reported |
| Bonsergent 2013 | Intervention not aimed at promoting physical activity |
| Brandstetter 2012 | Intervention not aimed at promoting physical activity |
| Braun 2017 | Not a randomised controlled trial |
| Bremer 2018 | Not a randomised controlled trial |
| Brill 2012 | Intervention < 12 weeks |
| Bronikowski 2011 | Not a randomised controlled trial |
| Brusseau 2016 | Not a randomised controlled trial |
| Buchan 2012 | Intervention < 12 weeks |
| Bugge 2012 | Not a randomised controlled trial |
| Bundy 2017 | Data on relevant outcomes not reported |
| Bungum 2014 | Not a randomised controlled trial |
| Bunketorp 2015 | Not a randomised controlled trial |
| Burguera 2011 | Intervention not school‐based |
| Burns 2015 | Not a randomised controlled trial |
| Bustos 2016 | Primary focus not to increase physical activity |
| Børrestad 2012 | Not aimed at general population |
| Calvert 2018 | Not a randomised controlled trial |
| Cao 2015 | Intervention not aimed at promoting physical activity |
| Cao 2019 | Intervention not aimed at promoting physical activity |
| Castelli 2014 | Not a randomised controlled trial |
| Centis 2012 | Clinical intervention; not relevant to public health |
| Chase 2018 | Intervention < 12 weeks |
| Chen 2016 | Data on relevant outcomes for children aged 6 to 18 years not reported |
| Chillon 2011 | Not a randomised controlled trial |
| Christiansen 2014 | Intervention not aimed at promoting physical activity |
| Cichy 2012 | Data on relevant outcomes not reported |
| Clapham 2015 | Not a randomised controlled trial |
| Clemes 2020 | Primary purpose not to increase physical activity |
| Coknaz 2019 | Intervention not school‐based |
| Colin‐Ramirez 2010 | No objective measures of physical activity, physical fitness, or body composition |
| Collins 2014 | Not aimed at general population |
| Costa‐Urrutia 2019 | Not a randomised controlled trial |
| Costigan 2018 | Intervention < 12 weeks |
| CTRI/2019/03/018133 | Not aimed at the general population |
| CTRI/2019/04/018834 | No objective measure of physical activity or physical fitness |
| CTRI/2019/09/021452 | No objective measure of physical activity or fitness |
| Čuljak 2011 | Data on relevant outcomes not reported |
| Cunha 2017 | Data on relevant outcomes not reported |
| Cvejić 2017 | Intervention < 12 weeks |
| D'Haese 2013 | Intervention < 12 weeks |
| Dai 2014 | Intervention not school‐based |
| Dallolio 2016 | Not a randomised controlled trial |
| Danielson 2018 | Not a randomised controlled trial |
| Dannenberg 2018 | Data on relevant outcomes not reported |
| Darabi 2017 | Data on relevant outcomes for children aged 6 to 18 years not reported |
| da Silva 2013 | Not a randomised controlled trial |
| da Silva Bandeira 2019 | No objective measure of physical activity or fitness |
| de Araujo 2012 | Not a randomised controlled trial |
| de Barros 2009 | Outcomes not reported for children aged 6 to 18 |
| de Greeff 2014 | Not a randomised controlled trial |
| Del Duca 2014 | Data on relevant outcomes in children aged 6 to 18 years not reported |
| Delgado‐Floody 2018 | Not aimed at general population |
| de Meij 2011 | Not a randomised controlled trial |
| de Meij 2013 | Not a randomised controlled trial |
| Demetriou 2019a | Data on relevant outcomes not reported |
| de Souza Santos 2015 | Intervention not aimed at promoting physical activity |
| Detter 2014 | Not a randomised controlled trial |
| Detter 2014a | Not a randomised controlled trial |
| Deutsch 2019 | Not a randomised controlled trial |
| Dewar 2013 | Not aimed at general population |
| Dewar 2014 | Not aimed at general population |
| Dills 2011 | Not a randomised controlled trial |
| Dishman 2004 | No objective measures of physical activity, physical fitness, or body composition |
| Duberg 2020 | Intervention not aimed at general population |
| Ducheyne 2014 | Intervention < 12 weeks |
| Duncan 2011 | Intervention < 12 weeks |
| Duncan 2019 | Intervention < 12 weeks |
| Dzewaltowski 2011 | Intervention not school‐based. |
| Dzielska 2020 | No objective measure of physical activity or fitness |
| Efstathiou 2016 | Not relevant to public health or health promotion |
| Egger 2019 | Data on relevant outcomes not reported |
| Eichner 2016 | Not a randomised controlled trial |
| Elder 2011 | Objective measure of physical activity or physical fitness not reported |
| Elinder 2012 | Not a randomised controlled trial |
| Elinder 2018 | Not aimed at increasing physical activity |
| Elizondo‐Montemayor 2013 | Not aimed at general population |
| Engelen 2013 | Data on relevant outcomes in children aged 6 to 18 years not reported |
| Erfle 2015 | Not a randomised controlled trial |
| Ericsson 2011 | Data on relevant outcomes for children aged 6 to 18 years not reported |
| Ericsson 2014 | Data on relevant outcomes in children aged 6 to 18 years not reported |
| Erwin 2011 | Not a randomised controlled trial |
| Esquivel 2019 | Not a randomised controlled trial |
| Esquivel 2019a | Not a randomised controlled trial |
| Evans 2016 | Data on relevant outcomes in children aged 6 to 18 years not reported |
| Ezendam 2012 | Intervention < 12 weeks |
| Farias 2015 | Data on relevant outcomes in children aged 6 to 18 years not reported |
| Fedewa 2018 | Data on relevant outcomes in children aged 6 to 18 years not reported |
| Fernandes 2014 | Not a randomised controlled trial |
| Fernandez‐Jimenez 2019 | Data on relevant outcomes not reported |
| Filho 2016 | Data on relevant outcomes in children aged 6 to 18 years not reported |
| Filho 2019 | Data on relevant outcomes not reported |
| Finn 2018 | Not a randomised controlled trial |
| Fitzgibbon 2011 | Data on relevant outcomes for children aged 6 to 18 years not reported |
| Foo 2014 | Not aimed at general population |
| Ford 2012 | Not a randomised controlled trial |
| Franceschi Neto 2017 | Intervention not aimed at promoting physical activity |
| Francois 2014 | Not a randomised controlled trial |
| Friedrich 2012 | Not a randomised controlled trial |
| Fritz 2016 | Not a randomised controlled trial |
| Fritz 2016a | Not a randomised controlled trial |
| Frost 2018 | Not a randomised controlled trial |
| Fu 2016 | Not a randomised controlled trial |
| Galle 2016 | Not a randomised controlled trial |
| Gallotta 2015 | Not aimed at general population |
| Gallotta 2017 | Intervention not aimed at promoting physical activity |
| Gammon 2019 | Intervention < 12 weeks |
| Garcia‐Hermoso 2020 | Outcomes nor reported for children aged 6 to 18 years |
| Gatz 2018 | Not a randomised controlled trial |
| Geanina 2011 | Data on relevant outcomes in children aged 6 to 18 years not reported |
| Gevat 2012 | Not a randomised controlled trial |
| Gill 2019 | Data on relevant outcomes not reported |
| Giralt 2011 | Data on relevant outcomes for children aged 6 to 18 years not reported |
| Glapa 2018 | Data on relevant outcomes in children aged 6 to 18 years not reported |
| Goh 2014 | Not a randomised controlled trial |
| Goh 2017 | Not a randomised controlled trial |
| Gortmaker 2012 | Intervention not school‐based. |
| Grasten 2017 | Data on relevant outcomes in children aged 6 to 18 years not reported |
| Gray 2015 | Intervention < 12 weeks |
| Greve 2015 | Primary purpose not to increase physical activity |
| Griffiths 2019 | Data on relevant outcomes not reported |
| Grillich 2016 | Data on relevant outcomes in children aged 6 to 18 years not reported |
| Gunawardena 2016 | Data on relevant outcomes in children aged 6 to 18 years not reported |
| Ha 2014 | Intervention < 12 weeks |
| Ha 2015 | Intervention < 12 weeks |
| Ha 2020 | intervention < 12 weeks |
| Haapala 2017 | Not a randomised controlled trial |
| Habib‐Mourad 2014 | Primary purpose not to increase physical activity |
| Haerens 2009 | No objective measures of physical activity, physical fitness, or body composition |
| Hager 2018 | Intervention not aimed at promoting physical activity |
| Haible 2019 | Intervention < 12 weeks |
| Haible 2019a | Intervention < 12 weeks |
| Hamilton 2020 | Intervention < 12 weeks |
| Hankonen 2016 | Intervention < 12 weeks |
| Hankonen 2017 | Intervention < 12 weeks |
| Hannah 2018 | Data on relevant outcomes not reported |
| Hardman 2014 | Data on relevant outcomes in children aged 6 to 18 years not reported |
| Hayes 2014 | Intervention not school‐based |
| Hebden 2014 | Data on relevant outcomes in children aged 6 to 18 years not reported |
| Hejazi 2017 | Not a randomised controlled trial |
| Heo 2018 | Not a randomised controlled trial |
| Herbert 2013 | Not a randomised controlled trial |
| Hernández López 2018 | Not a randomised controlled trial |
| Hill 2015 | Intervention not aimed at promoting physical activity |
| Hillman 2014 | Intervention not school‐based |
| Hind 2014 | Not a randomised controlled trial |
| Hogg 2012 | Not a randomised controlled trial |
| Hortz 2015 | Intervention < 12 weeks |
| Huberty 2011 | Not a randomised controlled trial |
| Huberty 2014 | Data on relevant outcomes not reported |
| Hyde 2020 | Not a randomised controlled trial |
| Idris 2015 | Not a randomised controlled trial |
| Ilyasova 2014 | Intervention not aimed at promoting physical activity |
| Ilyasova 2015 | Intervention not aimed at promoting physical activity |
| Ingrida 2012 | Not a randomised controlled trial |
| ISRCTN75118772 | Intervention < 12 weeks |
| Jago 2012 | Intervention < 12 weeks |
| Jamerson 2017 | Not a randomised controlled trial |
| James 2017 | Data on relevant outcomes not reported |
| James‐Burdumy 2016 | Data on relevant outcomes in children aged 6 to 18 years not reported |
| Janssen 2015 | Data on relevant outcomes in children aged 6 to 18 years not reported |
| Jemmott 2019a | Intervention < 12 weeks |
| Jenkinson 2012 | Data on relevant outcomes in children aged 6 to 18 years not reported |
| Jian 2014 | Data on relevant outcomes in children aged 6 to 18 years not reported |
| Johnston 2013 | Not aimed at general population |
| Jones 2008 | No objective measures of physical activity, physical fitness, or body composition |
| Jones 2015 | Not aimed at general population |
| Jones 2016 | Data on relevant outcomes in children aged 6 to 18 years not reported |
| Jones 2020 | Intervention not school‐based |
| Jurak 2013 | Not a randomised controlled trial |
| Jussila 2015 | Intervention < 12 weeks |
| Kahan 2018 | Not a randomised controlled trial |
| Kahan 2019 | Intervention < 12 weeks |
| Kahlin 2014 | Not aimed at general population |
| Karachle 2017 | Data on relevant outcomes in children aged 6 to 18 years not reported |
| Kawabata 2018 | Intervention < 12 weeks |
| Keihner 2017 | Intervention < 12 weeks |
| Kelly 2014 | Intervention < 12 weeks |
| Kennedy 2018 | Intervention < 12 weeks |
| Kennedy 2019 | Intervention < 12 weeks |
| Ketelhut 2017 | Intervention not aimed at promoting physical activity |
| Kidokoro 2019 | Not a randomised controlled trial |
| Kipping 2008 | No measure of physical activity or physical fitness |
| Klakk 2013 | Not a randomised controlled trial |
| Knox 2012 | Not a randomised controlled trial |
| Kobel 2017 | Not aimed at general population |
| Koch 2019 | Intervention not aimed at general population |
| Kokkonen 2019 | No objective measure of physical activity or physical fitness |
| Kokkonen 2019a | No objective measures of physical activity or fitness |
| Kong 2016 | Data on relevant outcomes in children aged 6 to 18 years not reported |
| Konijnenberg 2018 | Not a randomised controlled trial |
| Kopaev 2015 | Data on relevant outcomes in children aged 6 to 18 years not reported |
| Krawiec 2013 | Not a randomised controlled trial |
| Kremer 2011 | Not a randomised controlled trial |
| Kriellaars 2019 | Not a randomised controlled trial |
| Ladapo 2016 | Intervention < 12 weeks |
| Lane 2018 | Intervention aim is not primarily to increase physical activity |
| Lang 2017 | Intervention not aimed at promoting physical activity |
| Larsen 2017 | Intervention not aimed at promoting physical activity |
| La Torre 2016 | Data on relevant outcomes in children aged 6 to 18 years not reported |
| Lazorick 2015 | Not a randomised controlled trial |
| Lee 2012 | Data on relevant outcomes in children aged 6 to 18 years not reported |
| Leme 2016 | Not aimed at general population |
| Lennox 2013 | Not a randomised controlled trial |
| Leung 2018 | Data on relevant outcomes in children aged 6 to 18 years not reported |
| Li 2010 | No measure of physical activity or physical fitness |
| Li 2017 | Intervention not aimed at promoting physical activity |
| Liao 2019 | Intervention not school‐based |
| Liu 2019 | Intervention not aimed at promoting physical activity |
| Llargues 2011 | Intervention not aimed at promoting physical activity |
| Llaurado 2014 | Intervention not aimed at promoting physical activity |
| Llaurado 2018 | Data on relevant outcomes in children aged 6 to 18 years not reported |
| Lloyd 2017 | Intervention not aimed at promoting physical activity |
| Lofgren 2013 | Not a randomised controlled trial |
| Lonsdale 2013 | Intervention < 12 weeks |
| Lonsdale 2019 | Data on relevant outcomes not reported |
| Lopes 2017 | Intervention not aimed at promoting physical activity |
| López Sánchez 2017 | Data on relevant outcomes in children aged 6 to 18 years not reported |
| López Sánchez 2018 | Not a randomised controlled trial |
| Lubans 2009 | Data on relevant outcomes for children aged 6 to 18 years not reported |
| Lubans 2011 | Intervention not aimed at general population (only low active boys were included in the study) |
| Lubans 2012b | Not aimed at general population |
| Lubans 2012c | Not aimed at general population |
| Lubans 2013 | Not aimed at general population |
| Lubans 2014 | Not aimed at general population |
| Lubans 2015 | Not aimed at general population |
| Lubans 2016 | Not aimed at general population |
| Lucertini 2013 | Intervention not aimed at promoting physical activity |
| Ludyga 2019 | Intervention < 12 weeks |
| Lynch 2016 | Intervention not aimed at promoting physical activity |
| Madsen 2013 | Intervention not school‐based. |
| Madsen 2020 | Intervention < 12 weeks |
| Mandarić 2011 | Intervention < 12 weeks |
| Mandigo 2019 | Intervention < 12 weeks |
| Manley 2014 | Not a randomised controlled trial |
| Marandi 2014 | Not a randomised controlled trial |
| Marin 2013 | Data on relevant outcomes in children aged 6 to 18 years not reported |
| Martin 2017 | Intervention < 12 weeks |
| Martinez 2008 | No measure of physical activity or physical fitness |
| Martinez‐Vizcaino 2019a | Data on relevant outcomes not reported |
| Martinez‐Vizcaino 2020 | Outcomes not reported for children aged 6 to 18 years |
| Masse 2012 | Not a randomised controlled trial |
| Massey 2017 | Not a randomised controlled trial |
| Maszczak 2013 | Data on relevant outcomes in children aged 6 to 18 years not reported |
| Mavilidi 2019 | Intervention < 12 weeks |
| Mayorga‐Vega 2016 | Data on relevant outcomes in children aged 6 to 18 years not reported |
| Mayorga‐Vega 2020 | Intervention < 12 weeks |
| Mazzoli 2019 | Intervention < 12 weeks |
| McCluskey 2020 | No objective measure of physical activity or fitness |
| McCreary 2012 | Not a randomised controlled trial |
| McDonald 2015 | Intervention < 12 weeks |
| McFarlin 2013 | Not aimed at general population |
| McKay 2015 | Not a randomised controlled trial |
| McLoughlin 2017 | Intervention < 12 weeks |
| McManus 2008 | Intervention < 12 weeks |
| McMinn 2012 | Not a randomised controlled trial |
| Meinhardt 2013 | Data on relevant outcomes in children aged 6 to 18 years not reported |
| Mejia 2017 | Intervention not aimed at promoting physical activity |
| Mekic 2014 | Data on relevant outcomes in children aged 6 to 18 years not reported |
| Mendoza 2011 | Intervention < 12 weeks |
| Mendoza 2017 | Intervention < 12 weeks |
| Menrath 2015 | Intervention not aimed at promoting physical activity |
| Merrotsy 2019 | Not a randomised controlled trial |
| Messiah 2015 | Intervention not school‐based. |
| Michailidis 2019 | Intervention not school‐based |
| Miller 2015 | Intervention < 12 weeks |
| Möhrle 2015 | Not a randomised controlled trial |
| Mok 2020 | Data on relevant outcomes not reported |
| Monti 2012 | Intervention not school‐based |
| Monyeki 2012 | Not a randomised controlled trial |
| Moodie 2011 | Intervention not school‐based. |
| Moreira 2012 | Intervention not school‐based |
| Morris 2013 | Not a randomised controlled trial |
| Morris 2019 | Not a randomised controlled trial |
| Moya 2011 | Intervention not school‐based |
| Moynihan 2014 | Not a randomised controlled trial |
| Muller 2019 | Intervention not aimed at promoting physical activity |
| Muntaner‐Mas 2017 | Intervention < 12 weeks |
| Murillo 2016 | Not a randomised controlled trial |
| Murtagh 2013 | Intervention < 12 weeks |
| Muzaffar 2019 | Intervention not school‐based |
| Nabors 2015 | Not a randomised controlled trial |
| Naidoo 2012 | Not a randomised controlled trial |
| Nathan 2019a | Data on relevant outcomes not reported |
| Nawi 2015 | Not aimed at general population |
| Nazieffa 2020 | Intervention not primarily aimed at increasing physical activity |
| NCT03081013 | Intervention not school‐based |
| NCT03308500 | Intervention not aimed at promoting physical activity |
| NCT03885115 | Intervention not school‐based |
| NCT03893149 | Intervention < 12 weeks |
| NCT03937336 | Intervention < 12 weeks |
| NCT03952754 | Intervention < 12 weeks |
| NCT03975335 | Intervention not aimed at promoting physical activity |
| NCT04113707 | Intervention not aimed at promoting physical activity |
| NCT04118543 | Intervention < 12 weeks |
| NCT04213014 | Not aimed at the general population |
| Nelson 2011 | Not a randomised controlled trial |
| Neto 2014 | Intervention not aimed at promoting physical activity |
| Nichols 2014 | Data on relevant outcomes in children aged 6 to 18 years not reported |
| Nigg 2019 | Not a randomised controlled trial |
| Norris 2016 | Intervention < 12 weeks |
| NTR6173 | Intervention < 12 weeks |
| O'Neill 2016 | Data on relevant outcomes in children aged 6 to 18 years not reported |
| Oli 2019 | Intervention not school‐based |
| Ostergaard 2012 | Not aimed at general population |
| PACTR201903750173871 | Not school‐based |
| Pardo 2013 | Not a randomised controlled trial |
| Pardo 2014 | Not a randomised controlled trial |
| Parrish 2016 | Data on relevant outcomes in children aged 6 to 18 years not reported |
| Parrish 2018 | Intervention not aimed at promoting physical activity |
| Penalvo 2015 | Data on relevant outcomes in children aged 6 to 18 years not reported |
| Perez 2012 | Intervention not aimed at promoting physical activity |
| Pesce 2013 | Not a randomised controlled trial |
| Petchers 1988 | No objective measures of physical activity, physical fitness, or body composition |
| Pienaar 2012 | Data on relevant outcomes in children aged 6 to 18 years not reported |
| Pinto‐Escalona 2019 | Intervention < 12 weeks |
| Plavsic 2020 | Intervention not aimed at the general population |
| Polet 2019 | Intervention < 12 weeks |
| Polevoy 2020 | Not a randomised controlled trial |
| Polo‐Oteyza 2017 | Not a randomised controlled trial |
| Post 2019 | Not a randomised controlled trial |
| Post 2019a | Not a randomised controlled trial |
| Postler 2017 | Not a randomised controlled trial |
| Powell 2013 | Intervention < 12 weeks |
| Prins 2012 | Intervention < 12 weeks |
| Puma 2013 | Not a randomised controlled trial |
| Quizan‐Plata 2014 | Data on relevant outcomes in children aged 6 to 18 years not reported |
| Radnor 2017 | Intervention < 12 weeks |
| RBR‐5fm97x | Data on relevant outcomes not reported |
| RBR‐86xv46 | No objective measure of physical activity or fitness |
| Reed 2013 | Not a randomised controlled trial |
| Rees‐Punia 2017 | Not a randomised controlled trial |
| Resal 2018 | Not a randomised controlled trial |
| Resaland 2011 | Not a randomised controlled trial |
| Resaland 2018 | Not a randomised controlled trial |
| Rexen 2015 | Not a randomised controlled trial |
| Reznik 2015 | Intervention < 12 weeks |
| Riiser 2020 | Intervention not school‐based |
| Riley 2014 | Intervention < 12 weeks |
| Robbins 2014 | Intervention < 12 weeks |
| Robbins 2020 | No objective measure of physical activity or fitness |
| Robinson 1999 | Stated aim not to increase physical activity or physical fitness |
| Romanelli 2015 | Not a randomised controlled trial |
| Ronsley 2013 | Not a randomised controlled trial |
| Rosenkranz 2012 | Intervention < 12 weeks |
| Rostami‐Moez 2017 | Intervention < 12 weeks |
| Routen 2017 | Not a randomised controlled trial |
| Ruiz‐Ariza 2019 | Data on relevant outcomes not reported |
| Ruiz‐Ariza 2019a | Data on relevant outcomes not reported |
| Sahota 2019 | No objective measure of physical activity or fitness |
| Salmoirago‐Blotcher 2015 | Intervention < 12 weeks |
| Salmon 2011 | Data on relevant outcomes in children aged 6 to 18 years not reported |
| Sanchez‐Lopez 2019 | Outcomes not reported for children aged 6 to 18 years |
| Sanchez‐Lopez 2019a | Outcomes not reported for children aged 6 to 18 years |
| Saraf 2015 | Data on relevant outcomes in children aged 6 to 18 years not reported |
| Sauder 2018 | Not aimed at general population |
| Savin 2014 | Data on relevant outcomes in children aged 6 to 18 years not reported |
| Schneider 2017 | Not aimed at general population |
| Schoerner 2014 | Data on relevant outcomes not reported |
| Schwager 2019 | Intervention not aimed at promoting physical activity |
| Sebire 2018 | Intervention < 12 weeks |
| Sebire 2019 | Intervention < 12 weeks |
| Seo 2013 | Not a randomised controlled trial |
| Shang 2020 | Intervention not aimed at promoting physical activity |
| Shang‐yi 2013 | Not a randomised controlled trial |
| Sharma 2017 | Intervention not aimed at promoting physical activity |
| Sigmund 2012 | Not a randomised controlled trial |
| Silva 2014 | Outcomes not reported for children aged 6 to 18 years |
| Silva 2018 | Not a randomised controlled trial |
| Simon 2011 | Not a randomised controlled trial |
| Singh 2009 | No measure of physical activity or physical fitness |
| Singhal 2010 | No measure of physical activity or physical fitness |
| Sinyavsky 2015 | Data on relevant outcomes in children aged 6 to 18 years not reported |
| Skoradal 2018 | Intervention < 12 weeks |
| Smedegaard 2016 | Data on relevant outcomes in children aged 6 to 18 years not reported |
| Smith 2011 | Intervention not school‐based |
| Smith 2014a | Not aimed at general population |
| Smith 2016 | Not aimed at general population |
| Smith 2017 | Not aimed at general population |
| Spencer 2013 | Not a randomised controlled trial |
| Springer 2013 | Data on relevant outcomes in children aged 6 to 18 years not reported |
| Springer 2019 | No objective measure of physical activity or physical fitness |
| Stephens 1998 | Data on relevant outcomes for children aged 6 to 18 years not reported |
| Stoepker 2018 | Not a randomised controlled trial |
| Story 2012 | Data on relevant outcomes in children aged 6 to 18 years not reported |
| Sujová 2016 | Not a randomised controlled trial |
| Sun 2011 | Intervention < 12 weeks |
| Sutherland 2019a | Data on relevant outcomes not reported |
| Swartz 2019 | Intervention < 12 weeks |
| Takehara 2019a | Data on relevant outcomes not reported |
| Tarro 2014 | Data on relevant outcomes not reported |
| Tarro 2017 | Data on relevant outcomes in children aged 6 to 18 years not reported |
| Taylor 2018 | Intervention < 12 weeks |
| Telford 2019a | Data on relevant outcomes not reported |
| Telles 2013 | Intervention not aimed at promoting physical activity |
| Tercedor 2017 | Intervention < 12 weeks |
| Thakur 2016 | Data on relevant outcomes in children aged 6 to 18 years not reported |
| Theodore 2018 | Not a randomised controlled trial |
| Tian 2017 | Not a randomised controlled trial |
| Tolano 2015 | Data on relevant outcomes in children aged 6 to 18 years not reported |
| Tomlin 2012 | Not a randomised controlled trial |
| Trajkovic 2020 | No objective measure of physical activity or fitness |
| Treu 2017 | Not a randomised controlled trial |
| Tumynaitė 2014 | Data on relevant outcomes in children aged 6 to 18 years not reported |
| Tymms 2016 | Intervention < 12 weeks |
| Uys 2016 | Data on relevant outcomes in children aged 6 to 18 years not reported |
| van den Berg 2019 | Intervention < 12 weeks |
| van den Berg 2019a | Intervention < 12 weeks |
| van der Niet 2016 | Not a randomised controlled trial |
| Vander Ploeg 2014 | Not a randomised controlled trial |
| van Dongen 2019 | Data on relevant outcomes not reported |
| Van Kann 2015 | Not a randomised controlled trial |
| van Stralen 2012 | Not a randomised controlled trial |
| Verloigne 2012 | Intervention < 12 weeks |
| Verloigne 2018 | Outcome data on outcomes relevant to this review not reported |
| Verstraete 2006 | Outcome data on outcomes relevant to this review not reported |
| Vetter 2015 | Intervention < 12 weeks |
| Vetter 2018 | Intervention < 12 weeks |
| Vetter 2020 | Intervention < 12 weeks |
| Vidoni 2012 | Not a randomised controlled trial |
| Vieira 2019 | Not a randomised controlled trial |
| Villa‐Gonzalez 2017 | Not a randomised controlled trial |
| Wade 2019 | Intervention not school‐based |
| Wadolowska 2019 | No objective measure of physical activity or physical fitness |
| Wadsworth 2015 | Not a randomised controlled trial |
| Wallinga 2014 | Intervention < 12 weeks |
| Wang 2012 | Intervention < 12 weeks |
| Wang 2017 | Not a randomised controlled trial |
| Wassenaar 2019a | Data on relevant outcomes not reported |
| Watanabe 2016 | Intervention not aimed at promoting physical activity |
| Watson 2017 | Intervention < 12 weeks |
| Watson 2019 | Intervention < 12 weeks |
| Weaver 2018 | Not a randomised controlled trial |
| Weaver 2018a | Not a randomised controlled trial |
| Weber 2017 | Not a randomised controlled trial |
| Webster 2015 | Not a randomised controlled trial |
| Weiss 2015 | Not a randomised controlled trial |
| Weiss 2019 | Not a randomised controlled trial |
| Welk 2016 | Not a randomised controlled trial |
| Wells 2014 | Not aimed at general population |
| White 2018 | Not a randomised controlled trial |
| White 2018a | Not a randomised controlled trial |
| Whitt‐Glover 2011 | Intervention < 12 weeks |
| Whooten 2018 | Not a randomised controlled trial |
| Widhalm 2018 | No objective measure of physical activity or physical fitness |
| Wilkinson 2013 | Not a randomised controlled trial |
| Williams 2014 | Not a randomised controlled trial |
| Williamson 2012 | Intervention not aimed at promoting physical activity |
| Willis 2019a | Outcomes not reported for children aged 6 to 18 years |
| Wilson 2009 | Data on relevant outcomes not reported |
| Winkler 2016 | Intervention not aimed at promoting physical activity |
| Woods‐Townsend 2015 | Intervention not aimed at promoting physical activity |
| Wyatt 2011 | Not a randomised controlled trial |
| Xu 2015 | Intervention not aimed at promoting physical activity |
| Yañez 2015 | Not a randomised controlled trial |
| Yang 2017 | Not a randomised controlled trial |
| You 2013 | Intervention < 12 weeks |
| Yu 2020 | Not aimed at general population |
| Семенов 2017 | Not a randomised controlled trial |
| 项立敏 2016 | Not a randomised controlled trial |
Characteristics of studies awaiting classification [author‐defined order]
Martinez‐Vizcaino 2019.
| Methods |
Type of trial: effectiveness Allocation: cluster‐randomised Intervention model: parallel assignment Masking: open |
| Participants |
Estimated number of schools: ‐ Number of students: 570 Inclusion criteria (schools): at least 1 full classroom for both fourth and fifth grades, approval of board of governors Exclusion criteria (schools): ‐ Inclusion criteria (students): 8 to 11 years old Exclusion criteria (students): severe Spanish language learning difficulties, serious physical or mental disorders identified by parents or teachers that would impede participation in the programme's activities or diagnoses of chronic disorders, such as heart disease, diabetes, or asthma, which in the opinion of their paediatricians would prevent their participation in the programme's activities |
| Interventions |
Intervention: high‐intensity interval training intervention that consists of (1) 4 hours/week of a standardised recreational, non‐competitive physical activity extracurricular programme; and (2) informative sessions for parents and teachers about how schoolchildren can became more active Comparator: no intervention |
| Outcomes |
Primary outcome: fitness Secondary outcomes: brain‐derived neurotrophic factor, health‐related quality of life, sleep, motor skills, physical activity, % body fat, academic achievement, arterial stiffness, pulse wave velocity, subclinical atherosclerosis, executive function, glucose profile, lipid profile, insulin profile, ultra‐sensitive protein profile Other outcomes: ‐ |
| Reason for awaiting classification | Marked as complete in ClinicalTrials.gov, but no results published |
| Stated aim of study | "The objective of this study was to assess the effectiveness of the MOVI‐daFIT! intervention in children from 9 to 11 years old on improving physical fitness, and reducing fat mass and cardiovascular risk; and improving executive function and academic achievement" |
| Notes |
Nathan 2019.
| Methods |
Type of trial: efficacy Allocation: cluster‐randomised Intervention model: parallel assignment Masking: single‐blind (data collectors) |
| Participants |
Estimated number of schools: 62 Estimated number of students: − Inclusion criteria (schools): all government and Catholic schools in the study region Exclusion criteria (schools): schools participating in another physical activity intervention, schools with both primary and secondary students (i.e. central schools), and schools catering exclusively to children with special needs Inclusion criteria (students): subset of school students (i.e. those in Grades 2 and 3) Exclusion criteria (students): − |
| Interventions |
Intervention: to support schools, scheduled physical activity across the school week a 12‐month (4‐school term) multi‐component implementation support strategy will be offered to schools. The intervention will consist of the following:
Comparator: usual practice towards physical activity in the school community |
| Outcomes |
Primary outcomes: mean minutes of physical activity scheduled by primary school teachers across the school week; mean minutes of class physical activity across the school week where > 50% of students within classes are engaged in moderate or vigorous physical activity Secondary outcomes: students' physical activity, teachers' physical activity, teachers' well‐being, students' on‐task behaviour, cost‐effectiveness Other outcomes: − |
| Reason for awaiting classification | Noted completed in clinical trials registry, but no results published |
| Stated aim of study | Quote: "the primary aim of this trial is to assess the effectiveness and cost‐effectiveness of a multi‐component implementation strategy in increasing the minutes of planned weekly physical activity scheduled by classroom teachers consistent with the New South Wales (NSW) Government School Sport and Physical Activity Policy" |
| Notes |
NCT03817047.
| Methods |
Type of trial: efficacy Allocation: cluster‐randomised Intervention model: parallel assignment Masking: none (open‐label) |
| Participants |
Estimated number of schools: − Estimated number of students: 2045 Inclusion criteria (schools): − Exclusion criteria (schools): − Inclusion criteria (students): enrolled in Grade 9 Exclusion criteria (students): − |
| Interventions |
Intervention 1: physical activity learning including 60 minutes of physical education in addition to ordinary PE lessons, 30 minutes of physical activity learning, and 30 minutes of physical activity a week to stimulate mastery, joy, and well‐being Intervention 2: don't worry ‐ be happy, including physical education (60 minutes) and physical activity (60 minutes) as self‐organised activity groups of at least 3 students developed according to activity preferences Comparators: current practice |
| Outcomes |
Primary outcome: physical activity Secondary outcomes: time spent in MVPA, time spent sedentary, sedentary behaviour, upper limb strength, explosive strength in the lower body, abdominal muscle endurance, cardiorespiratory fitness, academic performance in reading, academic performance in numeracy, overall psychosocial problems and strengths, subjective health and well‐being, self‐evaluation of competence or adequacy, anxiety and depression, learning environment, school environment Other outcomes: BMI, waist circumference, satisfaction with psychological needs, emotional responses to physical education, eagerness to join physical education |
| Reason for awaiting classification | Recorded as completed in clinical trials registry, but no results published |
| Stated aim of study | Quote: "this study evaluates the effect of 120 minutes extra of physical education (PE) or physical activity (PA) on adolescents' physical health, mental health, academic performance and learning environment. This is a cluster‐randomised controlled trial with three arms, where the participants in two of the groups will have different models of increased PE/PA during the school week, whereas the participants in the third arm is the control group including current practice" |
| Notes |
NCT03983447.
| Methods |
Type of trial: efficacy Allocation: cluster‐randomised Intervention model: parallel assignment Masking: single (investigator) |
| Participants |
Estimated number of schools: 2 Estimated number of students: 352 Inclusion criteria (schools): ‐ Exclusion criteria (schools): ‐ Inclusion criteria (students): 5 to 13 years Exclusion criteria (students): physical diseases that prevent PA |
| Interventions |
Intervention: physical (environmental) adaptation of playground, time adaptation of lunch breaks, curriculum‐based programme, workshops and newsletters for parents, meetings for teachers Comparator: no change to school |
| Outcomes |
Primary outcome: physical activity, sedentary time Secondary outcomes: anthropometry, parental information, standing broad jump, plate tapping test, shuttle run, cardiorespiratory fitness, academic achievement, attention Other outcomes: ‐ |
| Reason for awaiting classification | Listed as 'complete' in ClinicalTrials.gov, but no results published |
| Stated aim of study | "This study has many goals: 1) to propose an intervention to promote PA (Physical Activity) and reduce ST (Sedentary Time) of children aged 6 to 13 years from a primary school located in a disadvantaged neighbourhood and measures the effectiveness of this intervention (1rst grade‐5th grade). This intervention was based on the factors of socioecological model related to health behaviours. The levels of PA and ST of the experimental school will be compared to a control school with the realization of pre and post intervention measures. 2) To study the relationships between PA, ST, motors skills, attention abilities and academic achievement. 3)To real ise a descriptive analysis of PA and ST of children in 2nd and 5th grade from France and Spain (observational study). For this goal, an other school in Spain was included in the study (city of Huesca, 60 children)" |
| Notes |
Takehara 2019.
| Methods |
Type of trial: efficacy Allocation: cluster‐randomised Intervention model: parallel assignment Masking: open |
| Participants |
Estimated number of schools: 10 Estimated number of students: 2337 Inclusion criteria (schools): ‐ Exclusion criteria (schools): ‐ Inclusion criteria (students): 10 to 12 years old, attending fourth grade at 1 of 10 public schools in Sukhbaatar District with written consent and can speak, read, or understand Mongolian Exclusion criteria (students): comorbidities or contraindications prohibiting participation in exercise or attending classes with special curriculum |
| Interventions |
Intervention: school‐based 2‐minute high‐intensity interval training at least 3 times per week Comparator: no intervention |
| Outcomes |
Primary outcome: examination marks Secondary outcomes: proportion obese and overweight, physical fitness, exercise, sleep, psychosocial health, cognitive function Other outcomes: ‐ |
| Reason for awaiting classification | Marked as complete in clinical trials registry, but no data published |
| Stated aim of study | "The primary objective of our study is to investigate the effectiveness of exercise intervention on academic achievement among children using a large cluster RCT. The secondary objective is to investigate the effectiveness of exercise intervention on reducing the prevalence of obesity and overweight and on improving physical fitness performance, lifestyle, mental health, and cognitive function" |
| Notes |
Telford 2019.
| Methods |
Type of trial: efficacy Allocation: cluster‐randomised Intervention model: parallel assignment Masking: ‐ |
| Participants |
Estimated number of schools: 14 Estimated number of students: ‐ Inclusion criteria (schools): ‐ Exclusion criteria (schools): ‐ Inclusion criteria (students): ‐ Exclusion criteria (students): ‐ |
| Interventions |
Intervention: physical education and physical literacy coach assigned to schools for 1 year to improve delivery and frequency of PE, improve professional development of classroom teachers, increase opportunities for PA, and create links with community sport Comparator: usual practice |
| Outcomes |
Primary outcome: ‐ Secondary outcomes: physical activity, fundamental movement skills, student attitudes towards PE, self‐perceptions of physical abilities, classroom PA Other outcomes: acceptability from principals, teachers, and students |
| Reason for awaiting classification | Conference abstract only |
| Stated aim of study | "The aim of this study was to evaluate the feasibility and effectiveness of a jurisdiction Education Department funded multi component approach to improve the development of childhood physical literacy" |
| Notes |
Wassenaar 2019.
| Methods |
Type of trial: efficacy Allocation: cluster‐randomised Intervention model: parallel assignment Masking: single‐blind (outcome assessor) |
| Participants |
Estimated number of schools: 104 Estimated number of students: 18,261 Inclusion criteria (schools): secondary state or academy schools, but not grammar schools; mixed or single‐gender; with proportion of pupils eligible for free school meals, preferably more than 15%, which is the average for England (at the time of recruitment ); located within a pre‐defined set of local authorities, encompassing the following geographical locations: Greater London; Thames Valley; Southampton and Portsmouth; Bristol and Bath; Birmingham and Coventry; Cheltenham/Gloucester; and Luton, Bedford Milton Keynes; Year 7 pupils who will move on to Year 8 at the start of the intervention; delivery of PE as part of the curriculum; signing an agreement to send opt‐out consent forms to parents/carers of Year 7 pupils; informing the research team of pupils who have opted out of data storage Exclusion criteria (schools): − Inclusion criteria (students): all pupils in Year 8 at the start of the intervention Exclusion criteria (students): − |
| Interventions |
Intervention: the intervention requires teachers to deliver specific elements of additional vigorous physical activity, over and above normal vigorous activity, during all Year 8 PE lessons, for the whole school year. Four minutes of vigorous physical activity is incorporated into the PE lesson as part of a warm‐up, and three 2‐minute infusions per hour of PE are incorporated into the main PE class Comparator: PE as usual |
| Outcomes |
Primary outcome: academic attainment Secondary outcomes: cardiorespiratory fitness, cognitive measures, mental health, global self‐esteem, physical self‐esteem, global health, physical activity, daytime sleepiness, PE enjoyment, psychological variables linked to PA, PA during PE Other outcomes: brain imaging (sub‐sample) |
| Reason for awaiting classification | Noted as complete in clinical trials registry, but no data published |
| Stated aim of study | |
| Notes |
NCT03579810.
| Methods |
Type of trial: efficacy Allocation: randomised Intervention model: parallel assignment Masking: none (open‐label) |
| Participants |
Estimated number of schools: 9 Estimated number of students: 870 Inclusion criteria (schools): private schools located in the urban area of Bogotá with an appropriate physical activity space and infrastructure, that allowed study conduction Exclusion criteria (schools): schools that have received interventions longer than 1 month in healthy habits (nutrition and/or physical activity) during the year prior to the start of the study or during study follow‐up, schools with a history of annual dropout greater than 10% Inclusion criteria (students): aged 4 to 8 years Exclusion criteria (students): − |
| Interventions |
Intervention: a 2.5‐year pedagogical intervention to increase knowledge, attitudes, and healthy lifestyle habits about physical activity, healthy eating, and knowledge of the body and heart, targeting children, parents, and teachers. Among children, the intervention included class activities (1/week) and the use of educational materials (posters and educative guide). For parents, the intervention included 3 workshops/year (2 hours each), sending healthy notes (1/month), and celebrating healthy family day (1/year). For teachers, the intervention included 3 workshops/y (2 hours each); planning and implementing pedagogical activities with students (1/week); and conducting follow‐up visits to school (1/month) Comparators: children received the standard curriculum in health and physical activity of the national Ministry of Education. For parents and teachers, this included 3 workshops/y (2 hours each) about first aid and accident prevention |
| Outcomes |
Primary outcomes: physical activity energy expenditure, healthy food consumption Secondary outcomes: BMI, waist circumference, total cholesterol, triglycerides, fasting glucose, blood pressure, health food consumption (teachers), healthy food consumption (parents) Other outcomes: − |
| Reason for awaiting classification | Noted as complete in clinical trials registry, but no results published |
| Stated aim of study | Quote: "the objectives of this project are to evaluate changes in healthy foods consumption and energy expenditure in children from kindergarten to second grade of elementary school that receives pedagogical intervention (PI) adapted to its context, compared to another EC that develops its habitual curriculum. In addition, this study evaluates changes on cardiovascular risk factors in children. Also, it evaluates changes in healthy foods consumption in their parents and teachers" |
| Notes |
Brown 2017.
| Methods |
Type of trial: effectiveness and cost‐effectiveness Allocation: cluster‐randomised Intervention model: parallel assignment Masking: single‐blind (measurement staff) |
| Participants |
Estimated number of schools: 16 Estimated number of participants: 2400 Inclusion criteria (schools): government‐funded, non‐fee‐paying (state), all‐ability, co‐educational secondary schools including Year 9 students in Cambridgeshire and Essex, UK Exclusion criteria (schools): − Inclusion criteria (students): all Year 9 students (13 to 14 years) in participating schools Exclusion criteria (students): none |
| Interventions |
Intervention: GoActive is implemented using a tiered‐leadership system whereby mentors (older adolescents within the school) and peer‐leaders (within each class) encourage students to try these activities each week. Mentors remain paired with each class for the duration of the programme, whereas peer‐leaders (2 per class each week) change every week. Teachers are encouraged to use 1 tutor time weekly to do one of the chosen activities as a class; however, students gain points for trying these new activities in or out of school. Points are gained every time they try an activity; there is no expectation of time spent in the activity, as points are rewarded for the taking part itself. Individual students keep track of their own points privately on the study website, and their points are entered into the between‐class competition, so that each class competes against each other. Class rankings are circulated each week to encourage teacher support, and students receive small rewards (e.g. Frisbee, water bottle) for reaching points thresholds Comparator: no treatment or 'usual care' |
| Outcomes |
Primary outcome: accelerometer‐assessed change in average daily MVPA Secondary outcomes: accelerometer‐assessed sedentary, light, overall physical activity during school time, weekday evenings, weekends; self‐reported physical activity, self‐efficacy, self‐esteem, peer support, friendship quality, mood, school‐reported absence and academic performance, body fat %, BMI, waist circumference; within‐trial, long‐term cost‐effectiveness and cost‐utility analyses; mixed methods process evaluation assessing programme acceptability, uptake, maintenance, and dose; putative moderators/mediators Relevant proposed outcome measures for SoF table: physical activity duration, sedentary time, BMI |
| Reason for awaiting classification | Marked as 'completed' in trials registry, but no publication available |
| Stated aim of study | Quote: "the primary aim of this study is to assess the 10‐month effectiveness of the GoActive intervention to increase average daily objectively measured MVPA among 13–14‐year‐old adolescents" |
| Notes |
Kovalskys 2017.
| Methods |
Type of trial: effectiveness Allocation: cluster‐randomised Intervention model: parallel assignment Masking: no blinding |
| Participants |
Estimated number of schools: 12 Estimated number of participants: 405 Inclusion criteria (schools): public schools located in middle‐ to low‐income areas of Buenos Aires Exclusion criteria (schools): − Inclusion criteria (students): first grade children Exclusion criteria (students): families without Internet access |
| Interventions |
Intervention • Virtual: specially designed web‐based contents, targeting families and children, aimed at (a) encouraging improvement in eating habits for the whole family, both at home and at school, and (b) increasing mothers’ knowledge of the benefits of PA and the consequences of sedentary behaviour, and proposing pleasurable movement entailing activities for the children. Thematic goals are breakfast, PA, water intake, fruit and vegetable consumption, energy balance, parents as models, and snacking • Active breaks: activities comprising movement during school breaks are promoted with motivation as a backbone and devoid of a competitive strive; active play in which fun, pleasure, and sharing were emphasised. PA instructor‐guided activities take place 3 times a week during 2 school breaks, with the goal of promoting active play for a minimum of 20 to 30 minutes/d, depending on each school Comparator: college students of nutrition will deliver 2 educational workshops for parents once intervention and assessment are completed |
| Outcomes |
Primary outcomes • Weight measured to the nearest 0.1 kg using a portable digital scale • Height measured to the nearest 0.1 cm with a portable stadiometer • Waist circumference measured to the nearest 0.1 cm with an anthropometric tape • BMI z‐score calculated using the 2007 WHO reference growth charts • Child’s and parent’s dietary intake and habits assessed with two 24‐hour recalls using the Multiple Pass Method completed by participating parent or guardian • Child’s physical activity and sedentary behaviour assessed with accelerometers (ActiGraph wGT3X‐BT) used during 7 days • Parent’s physical activity and sedentary behaviour assessed with the Global Physical Activity Questionnaire • Blood pressure assessed with a digital automatic sphygmomanometer Secondary outcomes • Environmental characteristics assessed with a modified and adapted version of the International Study of Childhood Obesity, Lifestyle and the Environment (ISCOLE) Questionnaire, administered to the parent • Social and economic levels assessed with an adapted version of the survey elaborated by the Social Observatory of SAIMO (Argentine Society for Research of Marketing and Opinion) Relevant proposed outcome measures for SoF table: physical activity duration, BMI |
| Reason for awaiting classification | Marked as 'completed' in trials registry, but no publication available |
| Stated aim of study | Quote: "the main aim of MINI SALTEN is to assess the effects of a technology family‐based and PA school‐based intervention on (1) physical activity, and (2) quality of diet and eating behaviour in first grade children of the city of Buenos Aires" |
| Notes |
Lonsdale 2016.
| Methods |
Type of trial: effectiveness‐implementation Allocation: cluster‐randomised Intervention model: parallel assignment Masking: open |
| Participants |
Estimated number of schools: 20 Estimated number of students: 1219 Inclusion criteria (schools): − Exclusion criteria (schools): schools designated as ‘Schools for Specific Purposes’ and those that participated in the original SCORES efficacy study Inclusion criteria (students): students in Years 3 and 4 Exclusion criteria (students): − |
| Interventions |
Intervention: “Internet‐based Professional Learning to help teachers support Activity in Youth (iPLAY)” intervention. The aim of this project is to modify, scale‐up, and evaluate the effectiveness of an intervention previously shown to be efficacious in improving children’s physical activity, fundamental movement skills, and cardiorespiratory fitness. iPLAY will include 6 components to promote physical activity participation and fundamental movement skill competency. These components are (1) quality physical education and school sport; (2) classroom movement breaks; (3) physically active homework; (4) active playgrounds; (5) community physical activity links; (6) parent and caregiver engagement. Teachers will be trained in the components using a mixture of face‐to‐face workshops, online learning, and individualised observation and feedback Comparator: teacher professional learning designed to improve delivery of the NSW Kindergarten‐Year 6 Science and Technology curriculum. This programme, known as My Science, has been shown to increase teacher confidence and student engagement in science; however, it is not expected to influence outcomes of the trial. Schools allocated to the attention control will be eligible to receive iPLAY after the study has been completed (i.e. 24 months post baseline) |
| Outcomes |
Primary outcome: cardiorespiratory fitness Secondary outcomes: student physical activity, anthropometry, teacher's interpersonal style during PE and school sport, student behaviour, affect and cognition during PE and school sport, subjective well‐being, academic achievement, fundamental movement skill competency, cognitive control Other outcomes: teacher‐, principal‐, and school‐level outcomes |
| Reason for awaiting classification | Marked as 'complete' in clinical trials registry, but data not published |
| Stated aim of study | "The aim of this project is to modify, scale‐up and evaluate the effectiveness of an intervention previously shown to be efficacious in improving children’s physical activity, fundamental movement skills and cardiorespiratory fitness" |
| Notes |
Wright 2016.
| Methods |
Type of trial: efficacy trial Allocation: cluster‐randomised Intervention model: parallel assignment Masking: − |
| Participants |
Estimated number of schools: 24 Estimated number of participants: 1182 Inclusion criteria (schools): school districts with greater than 40% of students qualifying for free or reduced price lunch and/or with greater than 40% non‐Caucasian students and at least 4 elementary schools serving third through fifth graders Exclusion criteria (schools): none Inclusion criteria (students): all third and fourth grade students Exclusion criteria (students): none |
| Interventions |
Intervention 1: 100 Mile Club, a school‐based programme that encourages children to walk, run, or wheel 100 miles over the course of the school year (approximately 3 miles per week). The programme can be implemented before, during, and/or after school, depending on the school schedule, and is led by 1 or 2 champions (e.g. PE teachers), identified by school administration, who log student miles Intervention 2: Just Move, a programme of structured, classroom‐based, PA breaks that integrates high‐ and low‐intensity movements (e.g. jumping jacks, squats, stretches, yoga) with academic material to provide children with opportunities for engaging in PA while learning. Breaks are designed to be short (5 to 15 minutes), and teachers are encouraged to incorporate at least 1 break per day Comparator: delayed intervention of either programme after study completion |
| Outcomes |
Primary outcomes: schooltime and total daily MVPA Secondary outcomes: cognitive performance, academic achievement Other outcomes: physical activity, social support, self‐efficacy, dietary intake, fitness |
| Reason for awaiting classification | Marked as 'completed' in ClinicalTrials.gov, but no publication available |
| Stated aim of study | Quote: "the primary aim of the FLEX Study is to evaluate the impact of two school‐based PA programs, 100 Mile Club® and Just Move™, on children’s schooltime MVPA and total daily MVPA, compared to a control group" |
| Notes |
Chen 2015.
| Methods |
Type of trial: effectiveness Allocation: cluster‐randomised Intervention model: parallel assignment Masking: − |
| Participants |
Estimated number of schools: 12 to 16 schools per centre Estimated number of students: 70,000 Inclusion criteria (schools): schools in Liaoning, Tianjin, Ningxia, Shanghai, Chongqing, Hunan, and Guangdong Exclusion criteria (schools): − Inclusion criteria (students): students aged 7 to 18 years Exclusion criteria (students): students in the last year of primary and secondary school (Grades 6, 9, and 12) were not contacted due to their study load |
| Interventions |
Intervention: Health Lifestyles Intervention is a multi‐component school‐based and family‐involved scheme that takes place over 9 months and aims to deliver a generally healthy lifestyle message encouraging health energy balance. Four components include:
Comparator: usual health practice |
| Outcomes |
Primary outcome: change in prevalence of overweight and obesity Secondary outcomes
Other outcomes: process evaluation Relevant proposed outcome measures for SoF table: physical activity duration, sedentary time, BMI, fitness |
| Reason for awaiting classification | Marked as 'completed' in ClinicalTrials.gov, but no publication available |
| Stated aim of study | Quote: "the aim of this multi‐centred cluster randomised controlled trial (RCT) is to determine the effectiveness and cost‐effectiveness of the Health Lifestyles Interventions in preventing overweight and obesity in Chinese school children and adolescents" |
| Notes |
Friedrich 2015.
| Methods |
Type of trial: efficacy trial Allocation: cluster‐randomised Intervention model: parallel assignment Masking: single‐blind (participants) |
| Participants |
Estimated number of schools: 12 Estimated number of participants: 1041 Inclusion criteria (schools): primary municipal schools in the city of Porto Alegre/RS Exclusion criteria (schools): schools that did not offer afternoon classes for all grades, night schools, schools catering exclusively to special needs students Inclusion criteria (students): children of both genders enrolled in first through fourth grades who attended afternoon classes Exclusion criteria (students): students who were unable to undergo anthropometric assessment, who had special needs, or who were absent from school on the 2 occasions on which anthropometric measurements were taken |
| Interventions |
Intervention: TriAtiva Program: Education, Nutrition and Physical Activity, was a year‐long initiative that aimed to implement educational activities about healthy eating and physical activity, so as to develop a favourable environment for student health. Nutrition education and physical activity interventions involved in the programme were developed and implemented by a research team of nutritionists, physical education teachers, and professors of nutrition and physical education. All interventions were adapted to each school year based on a participative and playful approach. TriAtiva Program activities were performed every 15 days during school hours, and physical activity interventions were alternated with nutrition education initiatives, for a total of 6 months of activities. At the end of each TriAtiva event at school, extracurricular activities related to the topic of discussion were planned Comparator: followed regular curriculum of twice‐weekly physical education classes of 50 minutes each |
| Outcomes |
Primary outcome: body mass Secondary outcomes: waist circumference; percent body fat; blood pressure; behavioural variables such as eating habits and physical activity levels; prevalence, incidence, and remission rates of obesity Relevant proposed outcome measures for SoF table: physical activity duration, BMI |
| Reason for awaiting classification | Protocol paper published, but no results |
| Stated aim of study | Quote: "the aim of the present study was to assess the effects of an intervention program involving nutrition education and physical activity ‐ namely, the TriAtiva Program: education, nutrition and physical activity ‐ on the prevention and control of obesity in public primary school children in the city of Porto Alegre/Brazil using a randomised controlled trial" |
| Notes |
O'Malley 2011.
| Methods |
Type of trial: − Allocation: cluster‐randomised Intervention model: − Masking: − |
| Participants |
Estimated number of schools: 4 Estimated number of participants: − Inclusion criteria (schools): − Exclusion criteria (schools): − Inclusion criteria (students): − Exclusion criteria (students): − |
| Interventions |
Intervention: health promotion Comparator: − |
| Outcomes |
Primary outcome: − Secondary outcome: − Other outcome: − Relevant proposed outcome measures for SoF table: BMI, physical activity duration |
| Reason for awaiting classification | Conference abstract only |
| Stated aim of study | Quote: "the TeesCAKE project is an exploratory cluster randomised con‐trolled trial which aims to determine whether an evidence‐based health promotion intervention can improve eating behaviours and activity levels amongst socially‐deprived children in the UK" |
| Notes |
Salmon 2011a.
| Methods |
Type of trial: effectiveness Allocation: cluster‐randomised Intervention model: factorial Masking: − |
| Participants |
Estimated number of schools: 20 Estimated number of participants: 600 Inclusion criteria: primary schools within a 50‐km radius of Melbourne with enrolment of over 300 students Exclusion criteria: − Inclusion criteria: Year 3 children Exclusion criteria: − |
| Interventions |
Intervention 1: SB‐I, reducing uninterrupted time spent sitting during school hours will be aimed for in the school setting; and reducing overall sitting time and discretionary screen‐based behaviours (i.e. television viewing, computer use, and electronic games) will be aimed for in the family setting Intervention 2: PA‐I, physical activity intervention arm ‐ increasing or maintaining moderate‐ to vigorous‐intensity physical activity (e.g. active play, organised and non‐organised games) during recess and lunch breaks will be targeted in the school setting, and time spent outdoors will be targeted in the family setting Intervention 3: SB + PA‐I, combined sedentary behaviour and physical activity intervention arm ‐ a blended version of the 2 interventions, but with the same intervention ‘dose’. For example, when children in this arm complete a behavioural contract to switch off the television, they will be encouraged to participate in physical activity (SB‐I children will not be directly encouraged to participate in activity when they switch off their television). The combined intervention arm will include 18 class lessons (9 per year), standing lessons and interruptions to children’s classroom sitting time (short breaks), promotion of physical activity during recess and lunch breaks, and 18 newsletters to parents Comparator: asked to continue usual lesson delivery; will receive all intervention materials at completion of the 12‐month follow‐up period |
| Outcomes |
Primary outcomes: physical activity, sedentary behaviour Secondary outcomes: anthropometry (height, weight, waist circumference), blood pressure, biomarkers, nutritional intake Other outcome: economic evaluation Relevant proposed outcome measures for SoF table: physical activity duration, sedentary time, BMI |
| Reason for awaiting classification | Only baseline data and mid‐intervention results published |
| Stated aim of study | Quote: "the primary aim of the Transform‐Us! study is to determine whether an 18‐month, behavioral and environmental intervention in the school and family settings results in higher levels of physical activity and lower rates of sedentary behavior among 8‐9 year old children compared with usual practice (post‐intervention and 12‐months follow‐up)" |
| Notes |
Characteristics of ongoing studies [author‐defined order]
Ferreira da Silva dos Santos 2020.
| Study name | SCHOOL IN ACTION |
| Methods |
Type of trial: implementation Allocation: cluster‐randomised Intervention model: parallel assignment Masking: open |
| Participants |
Number of schools: 5 Number of students: 370 Inclusion criteria (schools): full‐time, public primary schools with integral education programmes in the state of São Paulo, Brazil Exclusion criteria (schools): ‐ Inclusion criteria (students): all students in selected schools Exclusion criteria (students): none |
| Interventions |
Intervention: based on socioecological theory, at the individual level, the intervention involved development and monitoring of physical exercise in PE classes, physical activity during lunch breaks, vegetable gardening, and a healthy life project. At the school level, the intervention involved teacher training in PE, active breaks during non‐PE classes, parent counselling, menu labelling, and changes to the physical environment Comparator: outcome assessment only |
| Outcomes |
Primary outcome: physical activity Secondary outcomes: body composition, physical fitness, eating habits, sleep Other outcomes: potential mediating factors |
| Starting date |
Trial start date: March through April 2017 Trial completion date: ‐ |
| Contact information | Responsible party/principal investigator: S. Ferreira da Silva dos Santos; sueylaf.silva@ufam.edu.br |
| Notes |
O'Kane 2020.
| Study name | Walking in ScHools (WISH) |
| Methods |
Type of trial: effectiveness Allocation: cluster‐randomised Intervention model: parallel assignment Masking: open |
| Participants |
Estimated number of schools: 18 Estimated number of students: 384 Inclusion criteria (schools): post‐primary schools in Northern Ireland and Ireland. Schools in Northern Ireland must have at least 80 girls in years 9 and 10 and must be located in Co. Derry/Londonderry. Schools in Ireland; must have enrolment of > 240 girls and must be located in Co. Donegal Exclusion criteria (schools): ‐ Inclusion criteria (students): female students in year 9/10 (North Ireland) and in first/second year (Ireland) Exclusion criteria (students): students who are unable to walk, or for whom walking is contraindicated |
| Interventions |
Intervention: peer‐led walking intervention, based on previous feasibility trial Comparator: ‐ |
| Outcomes |
Primary outcome: total physical activity Secondary outcomes: total physical activity and mid‐point and follow‐up; time spent in sedentary, light, moderate, and vigorous activity; proportion of students meeting physical activity guidelines; height, weight, BMI, waist and hip circumference; coping, resilience, and cognitive reappraisal; sleep quality, duration, and efficiency; social media use; social integration; emotional connection to social media; body weight and appearance satisfaction Other outcomes: process evaluation |
| Starting date |
Trial start date: 01/09/2019 Trial completion date: ‐ |
| Contact information | Responsible party/principal investigator: Dr Maria O’Kane; m.okane@ulster.ac.uk |
| Notes |
Szabo‐Reed 2020.
| Study name | PAAC3 |
| Methods |
Type of trial: comparative effectiveness Allocation: cluster‐randomised Intervention model: parallel assignment Masking: open |
| Participants |
Estimated number of schools: 16 Estimated number of students: ~ 1200 Inclusion criteria (schools): urban and rural schools within a 50‐mile radius of Lawrence or Kansas City, KS Exclusion criteria (schools): ‐ Inclusion criteria (students): second and third grade students Exclusion criteria (students): students who are confined to a wheelchair, are blind, or are intellectually disadvantaged, who may not be able to perform tests |
| Interventions |
Intervention: classroom activity breaks delivered remotely via a television in the classroom Comparator: classroom activity breaks delivered by the classroom teacher |
| Outcomes |
Primary outcome: MVPA during activity breaks Secondary outcomes: MVPA during the school day, total MVPA, BMI, energy expenditure Other outcomes: cardiovascular fitness, process evaluation, implementation, school environment |
| Starting date |
Trial start date: 01/03/2018 Trial completion date: 01/08/2023 |
| Contact information | Responsible party/principal investigator: Joseph Donnelly, PhD; jdonnelly2@kumc.edu |
| Notes |
van Delden 2020.
| Study name | A Good Beginning |
| Methods |
Type of trial: efficacy Allocation: cluster‐randomised Intervention model: parallel assignment Masking: open‐label |
| Participants |
Estimated number of schools: 1 Estimated number of students: 56 Inclusion criteria (schools): ‐ Exclusion criteria (schools): ‐ Inclusion criteria (students): third grade, consent to participate (child and parent), physically able to stand, no serious health issues or injuries Exclusion criteria (students): ‐ |
| Interventions |
Intervention: each student received a sit‐stand desk Comparator: ‐ |
| Outcomes |
Primary outcome: academic performance, proportion of sitting time at school Secondary outcomes: physical fitness, height, weight, body composition, cognitive function, happiness, quality of life, sleep, stool habits, satisfaction with school environment Other outcomes: ‐ |
| Starting date |
Trial start date: 01/05/2017 Trial completion date: 29/02/2020 |
| Contact information | Responsible party/principal investigator: Lex van Delden; delden@leydenacademy.nl |
| Notes |
Demetriou 2019.
| Study name | CReActivity |
| Methods |
Type of trial: effectiveness Allocation: cluster‐randomised Intervention model: parallel assignment Masking: open |
| Participants |
Estimated number of schools: ‐ Estimated number of students: 600 Inclusion criteria (schools): ‐ Exclusion criteria (schools): ‐ Inclusion criteria (students): female, ages 10 to 14 years, secondary school in the region of München Exclusion criteria (students): none |
| Interventions |
Intervention: theory‐based intervention implemented within PE classes, focused on behaviour change techniques Comparator: regular PE |
| Outcomes |
Primary outcomes: total PA and PA during PE Secondary outcomes: autonomy, competence, relatedness, self‐efficacy, social support, behavioural regulation, BMI Other outcomes: environmental factors, teacher characteristics, process evaluation |
| Starting date |
Trial start date: 18/10/01 Trial completion date: ‐ |
| Contact information | Responsible party/principal investigator: Ms. Prof. Dr. Yolanda Demetriou; yolanda.demetriou at tum.de |
| Notes |
Santos‐Beneit 2019.
| Study name | The Program SI! for Cardiovascular Health Promotion at Elementary School (PSIE) |
| Methods |
Type of trial: efficacy Allocation: cluster‐randomised Intervention model: parallel assignment Masking: none (open‐label) |
| Participants |
Estimated number of schools: Estimated number of participants: 1770 Inclusion criteria (schools): Exclusion criteria (schools): Inclusion criteria (students): Exclusion criteria (students): |
| Interventions |
Program SI! The core intervention comprises classroom activities grouped into healthy challenges (about diet, physical activity, human body and heart, and emotions management) distributed across different levels and implemented by corresponding teachers. All materials, formal training, and a teaching guide are provided to the school staff by the SHE Foundation. Families receive family challenges and key messages about their children's health. The school environment is intervened mainly through an annual Healthy Fair Intervention 1: intervention is implemented during all elementary levels Intervention 2: intervention is implemented during first 3 levels of elementary school Intervention 3: intervention is implemented during last 3 levels of elementary schools Comparator: schools in control group keep their normal curriculum and do not join any school programme about health until the end of the study |
| Outcomes |
Primary outcomes: knowledge, attitudes, and habits related to diet, physical activity, body and heart and emotion management, cardiovascular health markers (blood pressure, height, weight, waist circumference, and triceps and subscapular skin‐fold thickness) Secondary outcome: family habits, teacher habits, aspects of the school environment Other outcomes: − |
| Starting date |
Trial start date: October 2014 Trial end date: June 2020 (anticipated) |
| Contact information | Valentín Fuster, MD, PhD |
| Notes |
Sutherland 2019.
| Study name | PA4E1 Implementation |
| Methods |
Type of trial: implementation Allocation: cluster‐randomised Intervention model: parallel assignment Masking: blinded (participants, outcome assessors, data analysts) |
| Participants |
Estimated number of schools: 49 Estimated number of students: − Inclusion criteria (schools): co‐educational secondary Department of Education (DOE) and Catholic schools that enrol students in Grades 7 through 10, are located in socioeconomically disadvantaged communities (ranked in the bottom 50% of NSW suburbs based on the SEIFA Index of Relative Socioeconomic Disadvantage), are not fully selective/sports/performing arts/agriculture/boarding schools, are not participating in other major whole‐school physical activity intervention studies/initiatives, have the capacity to release a teacher to implement the intervention (school champion) student‐level measures Exclusion criteria (schools): ‐ Inclusion criteria (students): 11 to 14 years Exclusion criteria (students): severe intellectual or physical disabilities |
| Interventions |
Intervention: PA4E1 will be implemented using an in‐school champion, obtaining executive and leadership support, with teacher professional learning, tools and resources, prompts and reminders, implementation support, and implementation performance monitoring and feedback Comparator: low‐dose intervention at completion of the trial |
| Outcomes |
Primary outcome: implementation of 4 of 7 PA practices Secondary outcomes: physical activity, adiposity, cost and cost‐effectiveness Other outcomes: − |
| Starting date |
Trial start date: 18/05/2017 Trial completion date: 30/06/2020 (anticipated) |
| Contact information | Responsible party/Principal investigator: Rachel Sutherland (Responsible Party), Prof. John Wiggers (Principal Investigator) |
| Notes |
Willis 2019.
| Study name | PLAN‐A |
| Methods |
Type of trial: effectiveness Allocation: cluster‐randomised Intervention model: parallel assignment Masking: open |
| Participants |
Estimated number of schools: 20 Estimated number of students: 1583 (actual) Inclusion criteria (schools): − Exclusion criteria (schools): − Inclusion criteria (students): Year 9 girls at participating schools Exclusion criteria (students): none |
| Interventions |
Intervention: peer nomination, peer‐supporter training, peer diffusion of health messages Comparator: − |
| Outcomes |
Primary outcome: accelerometer‐determined weekday physical activity Secondary outcomes: accelerometer‐determined weekend physical activity, weekend sedentary time, cost‐effectiveness Other outcomes: − |
| Starting date |
Trial start date: 01/05/2018 Trial completion date: 21/12/2020 (anticipated) |
| Contact information | Responsible Party/Principal Investigator: Prof. Russ Jago |
| Notes |
ISRCTN74109264.
| Study name | Engaging adolescents in changing behaviour (EACH‐B): a programme of research to improve the diets and physical activity levels of adolescents |
| Methods |
Type of trial: efficacy Allocation: cluster‐randomised Intervention model: parallel assignment Masking: open |
| Participants |
Estimated number of schools: 50 Estimated number of students: 2300 Inclusion criteria (schools): state schools in Hampshire and surrounding areas Exclusion criteria (schools): single‐sex schools Inclusion criteria (students): aged 12 and 13 (Year 8) Exclusion criteria (students): ‐ |
| Interventions |
Intervention • Participation in LifeLab at the University of Southampton: a 3‐week science module linked to the National Curriculum, which helps teenagers think about science and their health • Encouragement from teachers trained to support students to improve their diets and exercise • A specially designed, interactive smartphone app that involves friends and has game features Comparator: no intervention |
| Outcomes |
Primary outcomes: dietary quality, physical activity Secondary outcomes: well‐being, self‐regulation, body composition, compliance/adherence, self‐efficacy, use of digital intervention, teachers' competence, educational outcomes, cost Other outcomes: − |
| Starting date |
Trial start date: January 2016 Trial completion date: March 2022 |
| Contact information | Responsible Party/Principal Investigator: Dr. Sofia Strommer |
| Notes |
NCT03504059.
| Study name | School‐based Behavioural Intervention to Face Obesity and Promote Cardiovascular Health Among Spanish Adolescents |
| Methods |
Type of trial: efficacy Allocation: cluster randomised Intervention model: parallel assignment Masking: none (open‐label) |
| Participants |
Estimated number of schools: − Estimated number of students: 1366 Inclusion criteria (schools): − Exclusion criteria (schools): − Inclusion criteria (students): any student in the first academic year of secondary school Exclusion criteria (‐students): none |
| Interventions |
Intervention: comprehensive educational school‐based intervention for adolescents on cardiovascular health, including obesity/adiposity and metabolic profiles, through classroom intervention and complementary intervention in the family setting, at school, and by teachers Comparator: usual educational programme |
| Outcomes |
Primary outcomes: changes in composite ICH score of adolescents from baseline to Years 2 and 4. ICH score measures cardiovascular health and includes 7 components:
Secondary outcomes: body mass index, waist circumference, percentage of body fat, distribution of body fat, dietary habits, attitudes about eating, polyphenol consumption, carotenoid consumption, energy and nutrition, metabolomics, physical activity, sedentary habits, attitudes towards abuse substances, smoking habits, self‐image, self‐esteem, emotional eating, mood, educational effectiveness, cardiovascular score Other outcomes: − |
| Starting date |
Trial start date: 1 June 2017 Trial completion date: 30 June 2021 (anticipated) |
| Contact information | Responsible Party/Principal Investigator: Rosa M Lamuela‐Raventós, PhD, Gloria Santos‐Beneit, PhD, Juan M Fernández Alvira, PhD, Valentín Fuster, PhD, MD |
| Notes |
NCT03440580.
| Study name | BOOSTH: Promoting Physical Activity in Primary Schools in Combination With Serious Gaming |
| Methods |
Type of trial: efficacy Allocation: randomised Intervent:ion model: parallel assignment Masking: none (open‐label) |
| Participants |
Estimated number of schools: − Estimated number of students: 1240 Inclusion criteria (school): located in the Limburg‐region of the Netherlands; at least 25 students enrolled in Grades 5, 6, 7; school works with a technological device with Bluetooth option to synchronise activity points Exclusion criteria (school): schools with plans to merge with another school or to relocate in the upcoming year Inclusion criteria (students): boys and girls in fifth to seventh grades Exclusion criteria (students): children who are wheelchair‐dependent |
| Interventions |
Intervention: the intervention school will receive the BOOSTH intervention: Boosth activity tracker, Boosth sync app, Boosht game app. BOOSTH as a serious game is used as a tool to motivate children to perform more PA. BOOSTH uses the combination of a smartphone game and a pedometer that assesses daily PA by measuring steps/d. The BOOSTH activity monitor is a wrist‐worn activity monitor that is able to provide online feedback on the child's PA levels. Moreover, BOOSTH is a reward‐based game, as a child is given incentive to increase PA level, to acquire activity points, which can be used later to unlock levels and to progress in the BOOSTH game Comparator: standard curriculum |
| Outcomes |
Primary outcome: moderate to vigorous physical activity (minutes/d) with accelerometer Secondary outcomes: change in step count, change in physical activity behaviour, BMI z‐score, motivation toward physical activity, screen time, quality of life, cardiovascular alterations (pulse wave velocity and retinal image), blood pressure, aerobic fitness Other outcomes: comprehensive general parenting questionnaire, parenting practices questionnaire, process evaluation |
| Starting date |
Trial start date: 17 August 2018 Trial completion date: 31 December 2020 (anticipated) |
| Contact information | Responsible Party/Principal Investigator: Dr. Anita Vreugdenhil, Dr. Gabrielle ten velde |
| Notes |
Oluwasanu 2017.
| Study name | Ibadan Active Kids Project (IBAKP) |
| Methods |
Type of trial: efficacy Allocation: cluster‐randomised Intervention model: parallel assignment Masking: − |
| Participants |
Estimated number of schools: 22 Estimated number of students: 1000 Inclusion criteria (schools): − Exclusion criteria (schools): − Inclusion criteria (students): in‐school adolescents in public and private schools Exclusion criteria (students): out‐of‐school youths, adolescents in schools for the disabled |
| Interventions |
Intervention: activities that are under consideration include educational materials for students, special dance events in schools, debates and other co‐curricular activities, experience sharing by role models/athletes, Mhealth, and peer education. Preferred interventions will be jointly developed by adolescents, school authorities, and researchers. At the school level, activities under consideration include meetings and policy dialogue forums, production of evidence‐based dissemination materials on the importance of physical activity for the health and mental well‐being of students, and advocacy visits to engage policymakers to prioritise resources aimed at promoting physical activity in schools. The policy goal for this intervention is to ensure that all in‐school adolescents participate in 30 minutes of daily structured moderate to vigorous physical activity Comparator: − |
| Outcomes |
Primary outcomes: self‐reported physical activity, step counts Secondary outcomes: anthropometric measures, fitness, knowledge, attitudes, self‐efficacy, perceived behavioural control, intention, social norms, social support, policy or programme changes Other outcomes: − |
| Starting date |
Trial start: 01 March 2016 (anticipated) Trial completion: − |
| Contact information | Principal Investigator: Mrs. Mojisola Oluwasanu |
| Notes |
Differences between protocol and review
For this update, we have limited our inclusion criteria further to include only studies that include an objective measure of physical activity, physical fitness, or body composition. Due to advancements in technology since the original review was published, there now exist a wide variety of accurate and affordable options for objective measurement of physical activity, and researchers are no longer limited to reliance on self‐report. Due to the large number of studies of school‐based physical activity interventions, we are now able to limit our criteria to those who report objectively measured outcomes. In addition, we have added measures of sedentary time in place of television watching time. Measures related to blood pressure and cholesterol have been removed, and those related to health‐related quality of life and adverse events have been added when reported. Assessments of risk of bias have been updated to align with the most recent Cochrane Handbook for Systematic Reviews of Interventions, including specific domains related to cluster‐randomised controlled trials. Given the large number of included trials, subgroup analyses were conducted for children and adolescents and types of interventions when a sufficient number of trials were identified.
Contributions of authors
All review authors contributed by reading and approving the final review draft.
Sarah Neil‐Sztramko (SNS): as lead author, oversaw all aspects of the review update process. Was responsible for assisting with update of search strategies, screening search results, screening retrieved papers against inclusion criteria, appraising the quality of papers, extracting data from papers, analysing and interpreting data, and writing the review.
Hilary Caldwell (HC): was responsible for screening search results, organising retrieval of papers, screening retrieved papers against inclusion criteria, appraising the quality of papers, extracting data from papers, and assisting with writing and editing the final draft.
Maureen Dobbins (MD): as senior author and lead author of the original review, oversaw all aspects of the original and previous update review processes. Was responsible for conceiving and designing the review, providing a methodological perspective, assisting with interpretation of data, and editing and approving the manuscript.
Sources of support
Internal sources
No sources of support provided
External sources
-
City of Hamilton Public Health Services, Canada
Previous versions of this review were conducted with support from the City of Hamilton's Public Health Services
-
Canadian Institutes of Health Research, Canada
Sarah Neil‐Sztramko was supported by a postdoctoral fellowship from the Canadian Institutes of Health Research at the time this project was undertaken
Declarations of interest
SNS: declares no known conflict of interest.
MD: declares no known conflict of interest.
HC: declares no known conflict of interest.
New search for studies and content updated (conclusions changed)
References
References to studies included in this review
Aburto 2011 {published data only}
- Aburto NJ, Fulton JE, Safdie M, Duque T, Bonvecchio A, Rivera JA. Effect of a school-based intervention on physical activity: cluster-randomized trial. Medicine and Science in Sports and Exercise 2011;43(10):1898-906. [DOI] [PubMed] [Google Scholar]
- Safdie M, Cargo M, Richard L, Levesque L. An ecological and theoretical deconstruction of a school-based obesity prevention program in Mexico. International Journal of Behavioral Nutrition and Physical Activity 2014;11:103. [DOI] [PMC free article] [PubMed] [Google Scholar]
- Safdie M, Jennings-Aburto N, Levesque L, Janssen I, Campirano-Nunez F, Lopez-Olmedo N, et al. Impact of a school-based intervention program on obesity risk factors in Mexican children. Salud Publica de Mexico 2013;55 Suppl 3:374-87. [DOI] [PubMed] [Google Scholar]
- Safdie M, Levesque L, Gonzalez-Casanova I, Salvo D, Islas A, Hernandez-Cordero S, et al. Promoting healthful diet and physical activity in the Mexican school system for the prevention of obesity in children. Salud Publica de Mexico 2013;55 Suppl 3:357-73. [DOI] [PubMed] [Google Scholar]
Adab 2018 {published data only}ISRCTN97000586
- Adab P, Barrett T, Bhopal R, Cade JE, Canaway A, Cheng KK, et al. The West Midlands ActiVe lifestyle and healthy Eating in School children (WAVES) study: a cluster randomised controlled trial testing the clinical effectiveness and cost-effectiveness of a multifaceted obesity prevention intervention programme targeted at children aged 6-7 years. Health Technology Assessment 2018;22(8):1-608. [DOI] [PMC free article] [PubMed] [Google Scholar]
- Adab P, Pallan MJ, Lancashire ER, Hemming K, Frew E, Battett T, et al. Effectiveness of a childhood obesity prevention programme delivered through schools, targeting 6 and 7 year olds: cluster randomised controlled trial (WAVES study). British Medical Journal 2018;360:K211. [DOI] [PMC free article] [PubMed] [Google Scholar]
- Adab P, Pallan MJ, Lancashire ER, Hemming K, Frew E, Griffin T, et al. A cluster-randomised controlled trial to assess the effectiveness and cost-effectiveness of a childhood obesity prevention programme delivered through schools, targeting 6-7 year old children: the WAVES study protocol. BMC Public Health 2015;15:488. [DOI] [PMC free article] [PubMed] [Google Scholar]
- Canaway A, Freq E, Lancashire E, Pallan M, Hemming K, Adab P, WAVES Trial Investigators. Economic evaluation of a childhood obesity prevention programme for children: results from the WAVES cluster randomised controlled trial conducted in schools. PLoS One 2019;14(7):e0219500. [DOI] [PMC free article] [PubMed] [Google Scholar]
- Griffin TL, Clarke JL, Lancashire ER, Pallan MJ, Adab P, et al. Process evaluation results of a cluster randomised controlled childhood obesity prevention trial: the WAVES study. BMC Public Health 2017;17:681. [DOI] [PMC free article] [PubMed] [Google Scholar]
- Griffin TL, Pallan MJ, Clarke JL, Lancashire ER, Lyon A, Parry JM, et al. Process evaluation design in a cluster randomised controlled childhood obesity prevention trial: the WAVES study. International Journal of Behavioral Nutrition and Physical Activity 2014;11(1):112. [DOI] [PMC free article] [PubMed] [Google Scholar]
Andrade 2014 {published data only}
- Andrade S, Lachat C, Cardon G, Ochoa-Aviles A, Verstraeten R, Van Camp J, et al. Two years of school-based intervention program could improve the physical fitness among Ecuadorian adolescents at health risk: subgroups analysis from a cluster-randomized trial. BMC Pediatrics 2016;16(1):51. [DOI] [PMC free article] [PubMed] [Google Scholar]
- Andrade S, Lachat C, Ochoa-Aviles A, Verstraeten R, Huybregts L, Roberfroid D, et al. A school-based intervention improves physical fitness in Ecuadorian adolescents: a cluster-randomized controlled trial. International Journal of Behavioral Nutrition and Physical Activity 2014;11:153. [DOI] [PMC free article] [PubMed] [Google Scholar]
- Andrade S, Verloigne M, Cardon G, Kolsteren P, Ochoa-Aviles A, Verstraeten R, et al. School-based intervention on healthy behaviour among Ecuadorian adolescents: effect of a cluster-randomized controlled trial on screen-time. BMC Public Health 2015;15:942. [DOI] [PMC free article] [PubMed] [Google Scholar]
Angelopoulos 2009 {published data only}
- Angelopoulos PD, Milionis HJ, Grammatikaki E, Moschonis G, Manios Y. Changes in BMI and blood pressure after a school based intervention: the CHILDREN study. European Journal of Public Health 2009;19(3):319-25. [DOI] [PubMed] [Google Scholar]
Ardoy 2011 {published data only}
- Ardoy DN, Artero EG, Ruiz JR, Labayen I, Sjostrom M, Castillo MJ, et al. Effects on adolescents' lipid profile of a fitness-enhancing intervention in the school setting: the EDUFIT study. Nutricion Hospitalaria 2013;28(1):119-26. [DOI] [PubMed] [Google Scholar]
- Ardoy DN, Fernandez-Rodriguez JM, Chillon P, Artero EG, Espana-Romero V, Jimenez-Pavon D, et al. Physical fitness enhancement through education, EDUFIT study: background, design, methodology and dropout analysis [Educando para mejorar el estado de forma fisica, estudio EDUFIT: antecedentes, diseno, metodologia y analisis del abandono/adhesion al estudio]. Revista Espanola de Salud Publica 2010;84(2):151-68. [DOI] [PubMed] [Google Scholar]
- Ardoy DN, Fernandez-Rodriguez JM, Jimenez-Pavon D, Castillo R, Ruiz JR, Ortega FB. A physical education trial improves adolescents' cognitive performance and academic achievement: the EDUFIT study. Scandinavian Journal of Medicine & Science in Sports 2014;24(1):e52-61. [DOI] [PubMed] [Google Scholar]
- Ardoy DN, Fernandez-Rodriguez JM, Ruiz JR, Chillon P, Espana-Romero V, Castillo MJ, et al. Improving physical fitness in adolescents through a school-based intervention: the EDUFIT study [Mejora de la condicion fisica en adolescentes a traves de un programa de intervencion educativa: Estudio EDUFIT]. Revista Espanola de Cardiologia 2011;64(6):484-491. [DOI] [PubMed] [Google Scholar]
Barbeau 2007 {published data only}
- Barbeau P, Johnson MH, Howe CA, Allison J, Davis CL, Gutin B, et al. Ten months of exercise improves general and visceral adiposity, bone, and fitness in black girls. Obesity 2007;15(8):2077-85. [DOI] [PubMed] [Google Scholar]
Bayne‐Smith 2004 {published data only}
- Bayne-Smith M, Fardy PS, Azzollini A, Magel J, Schmitz KH, Agin D. Improvements in heart health behaviors and reduction in coronary artery disease risk factors in urban teenaged girls through a school-based intervention: the PATH program. American Journal of Public Health 2004;94(9):1538-43. [DOI] [PMC free article] [PubMed] [Google Scholar]
Belton 2019 {published data only}
- Belton S, McCarren A, McGrane B, Powell D, Issartel J. The Youth-Physical Activity Towards Health (Y-PATH) intervention: results of a 24 month cluster randomised controlled trial. PLoS One 2019;14(9):e0221684. [DOI] [PMC free article] [PubMed] [Google Scholar]
Breheny 2020 {published data only}ISRCTN12698269
- Breheny K, Adab P, Passmore S, Martin J, Lancashire E, Hemming K, et al. A cluster randomised controlled trial evaluating the effectiveness and cost-effectiveness of the daily mile on childhood obesity and wellbeing: the Birmingham daily mile protocol. BMC Public Health 2018;18(1):126. [DOI] [PMC free article] [PubMed] [Google Scholar]
- Breheny K, Passmore S, Adab P, Martin J, Hemming K, Lancashire ER, Frew E. Effectiveness and cost-effectiveness of The Daily Mile on childhood weight outcomes and wellbeing: a cluster randomised controlled trial. International Journal of Obesity 2020;44:812-22. [DOI] [PMC free article] [PubMed] [Google Scholar]
Burke 1998 {published data only}
- Burke V, Milligan RA, Thompson C, Taggart AC, Dunbar DL, Spencer MJ, et al. A controlled trial of health promotion programs in 11-year-olds using physical activity "enrichment" for higher risk children. Journal of Pediatrics 1998;132(5):840-8. [DOI] [PubMed] [Google Scholar]
Bush 1989 {published data only}
- Bush PJ, Zuckerman AE, Theiss PK, Taggart VS, Horowitz C, Sheridan MJ, et al. Cardiovascular risk factor prevention in black schoolchildren: two-year results of the "Know Your Body" program. American Journal of Epidemiology 1989;129(3):466-82. [DOI] [PubMed] [Google Scholar]
- Taggart VS, Bush PJ, Zuckerman AE. A process evaluation of the District of Columbia "Know Your Body" project. Journal of School Health 1990;60(2):60-6. [DOI] [PubMed] [Google Scholar]
Carlin 2018 {published data only}
- Carlin A, Murphy MH, Gallagher AM. The WISH study: the effect of peer-led Walking In ScHools on school-time physical activity. In: Proceedings of the Nutrition Society. Vol. 74. 2015:E235.
- Carlin A, Murphy MH, Nevill A, Gallagher AM. Effects of a peer-led Walking In ScHools intervention (the WISH study) on physical activity levels of adolescent girls: a cluster randomised pilot study. Trials 2018;19(1):31. [DOI] [PMC free article] [PubMed] [Google Scholar]
Cohen 2015 {published data only}
- Cohen K, Lubans D, Morgan P, Plotnikoff R, Callister R. Improving fundamental movement skill competency among children attending schools in low-income communities: the SCORES cluster RCT. Journal of Science and Medicine in Sport 2014;18:e12. [Google Scholar]
- Cohen KE, Morgan PJ, Plotnikoff RC, Callister R, Lubans DR. Physical activity and skills intervention: SCORES cluster randomized controlled trial. Medicine and Science in Sports and Exercise 2015;47(4):765-74. [DOI] [PubMed] [Google Scholar]
- Cohen KE, Morgan PJ, Plotnikoff RC, Hulteen RM, Lubans DR. Psychological, social and physical environmental mediators of the SCORES intervention on physical activity among children living in low-income communities. Psychology of Sport and Exercise 2017;32:1-11. [Google Scholar]
- Cohen KE, Morgan PJ, Plotnikoff RC, Hulteen RM, Lubans DR. Psychological, social and physical environmental mediators of the SCORES intervention on physical activity among children living in low-income communities. Psychology of Sport and Exercise 2017;32:1-11. [Google Scholar]
- Lubans D, Cohen K, Plotnikoff R, Callister R, Morgan P. The SCORES physical activity intervention for children attending schools in low-income communities: a cluster RCT. Journal of Science and Medicine in Sport 2014;18:e121. [Google Scholar]
- Lubans DR, Morgan PJ, Weaver K, Callister R, Dewar DL, Costigan SA, et al. Rationale and study protocol for the supporting children’s outcomes using rewards, exercise and skills (SCORES) group randomized controlled trial: a physical activity and fundamental movement skills intervention for primary schools in low income communities. BMC Public Health 2012;12(1):427. [DOI] [PMC free article] [PubMed] [Google Scholar]
Corepal 2019 {published data only}
- Corepal R, Best P, O’Neill R, Kee F, Badham J, Dunne L, et al. A feasibility study of ‘The StepSmart Challenge’ to promote physical activity in adolescents. Pilot and Feasibility Studies 2019;5:132. [DOI] [PMC free article] [PubMed] [Google Scholar]
Daly 2016 {published data only}
- Abhayaratna W, Telford R. Elementary school physical education and lipid concentrations in community-based children: the Australian look intervention study. Heart Lung and Circulation 2013;22:S62. [Google Scholar]
- Abhayaratna WP, Telford RD. Elementary school physical education and lipid concentrations in community-cased children: the Australian LOOK intervention study. Journal of the American College of Cardiology 2013;61(10):E1408. [Google Scholar]
- Daly RM, Ducher G, Hill B, Telford RM, Eser P, Naughton G, et al. Effects of a specialist-led, school physical education program on bone mass, structure, and strength in primary school children: a 4-year cluster randomized controlled trial. Journal of Bone and Mineral Research 2016;31(2):289-98. [DOI] [PubMed] [Google Scholar]
- Olive L, Byrne D, Cunningham RB, Telford RM, Telford RD. Can physical education improve the mental health of children? The LOOK study cluster-randomized controlled trial. Journal of Educational Psychology 2019;111(7):1331–40. [Google Scholar]
- Telford RD, Bass SL, Budge MM, Byrne DG, Carlson JS, Coles D, et al. The lifestyle of our kids (LOOK) project: outline of methods. Journal of Science and Medicine in Sport 2009;12(1):156-63. [DOI] [PubMed] [Google Scholar]
- Telford RD, Cunningham RB, Telford RM, Daly RM, Olive LS, Abhayaratna WP. Physical education can improve insulin resistance: the LOOK randomized cluster trial. Medicine and Science in Sports and Exercise 2013;45(10):1956-64. [DOI] [PubMed] [Google Scholar]
- Telford RM, Olive LS, Cochrane T, Davey R, Telford RD. Outcomes of a four-year specialist-taught physical education program on physical activity: a cluster randomized controlled trial, the LOOK study. International Journal of Behavioral Nutrition and Physical Activity 2016;13:64. [DOI] [PMC free article] [PubMed] [Google Scholar]
de Greeff 2016 {published data only}
- Greeff JW, Hartman E, Mullender-Wijnsma MJ, Bosker RJ, Doolaard S, Visscher C. Effect of physically active academic lessons on body mass index and physical fitness in primary school children. Journal of School Health 2016;86(5):346-52. [DOI] [PubMed] [Google Scholar]
- Greeff JW, Hartman E, Mullender-Wijnsma MJ, Bosker RJ, Doolaard S, Visscher C. Long-term effects of physically active academic lessons on physical fitness and executive functions in primary school children. Health Education Research 2016;31(2):185-94. [DOI] [PubMed] [Google Scholar]
- Mullender-Wijnsma MJ, Hartman E, Greeff JW, Bosker RJ, Doolaard S, Visscher C. Improving academic performance of school-age children by physical activity in the classroom: 1-year program evaluation. Journal of School Health 2015;85(6):365-71. [DOI] [PubMed] [Google Scholar]
- Mullender-Wijnsma MJ, Hartman E, Greeff JW, Bosker RJ, Doolaard S, Visscher C. Moderate-to-vigorous physically active academic lessons and academic engagement in children with and without a social disadvantage: a within subject experimental design. BMC Public Health 2015;15:404. [DOI] [PMC free article] [PubMed] [Google Scholar]
- Mullender-Wijnsma MJ, Hartman E, Greeff JW, Doolaard S, Bosker RJ, Visscher C. Physically active math and language lessons improve academic achievement: a cluster randomized controlled trial. Pediatrics 2016;137(3):e20152743. [DOI] [PubMed] [Google Scholar]
- Mullender-Wijnsma MJ, Hartman E, Greef JW, Doolaard S, Bosker RJ, Visscher C. Follow-up study investigating the effects of a physically active academic intervention. Early Childhood Education Journal 2019;47:699-707. [Google Scholar]
de Heer 2011 {published data only}
- Heer HD, Koehly L, Pederson R, Morera O. Effectiveness and spillover of an after-school health promotion program for Hispanic elementary school children. American Journal of Public Health 2011;101(10):1907-13. [DOI] [PMC free article] [PubMed] [Google Scholar]
Donnelly 2009 {published data only}
- Donnelly JE, Greene JL, Gibson CA, Smith BK, Washburn RA, Sullivan DK, et al. Physical Activity Across the Curriculum (PAAC): a randomized controlled trial to promote physical activity and diminish overweight and obesity in elementary school children. Preventive Medicine 2009;49(4):336-41. [DOI] [PMC free article] [PubMed] [Google Scholar]
- DuBose KD, Eisenmann JC, Donnelly JE. Aerobic fitness attenuates the metabolic syndrome score in normal-weight at-risk-for-overweight, and overweight children. Pediatrics 2007;120:e1262-8. [DOI] [PubMed] [Google Scholar]
- DuBose KD, Mayo MS, Gibson CA, Green JL, Hill JO, Jacobsen DJ, et al. Physical activity across the curriculum (PAAC): rationale and design. Contemporary Clinical Trials 2008;29(1):83-93. [DOI] [PubMed] [Google Scholar]
- Dubose KD, Stewart EE, Charbonneau SR, Mayo MS, Donnelly JE. Prevalence of the metabolic syndrome in elementary school children. Acta Paediatrica 2006;95:1005-11. [DOI] [PubMed] [Google Scholar]
- Eisenmann JC, DuBose KD, Donnelly JE. Fatness, fitness, and insulin sensitivity among 7- to 9-year-old children. Obesity 2007;15(8):2135-44. [DOI] [PubMed] [Google Scholar]
- Gibson CA, Smith BK, DuBose KD, Greene JL, Bailey BW, Williams SL, et al. Physical activity across the curriculum: year one process evaluation results. International Journal of Behavioral Nutrition and Physical Activity 2008;5:36. [DOI] [PMC free article] [PubMed] [Google Scholar]
- Honas JJ, Washburn RA, Smith BK, Greene JL, Donnelly JE. Energy expenditure of the physical activity across the curriculum intervention. Medicine & Science in Sports & Exercise 2008;40(8):1501-5. [DOI] [PMC free article] [PubMed] [Google Scholar]
Donnelly 2017 {published data only}
- Donnelly JE, Greene JL, Gibson CA, Sullivan DK, Hansen DM, Hillman CH, et al. Physical activity and academic achievement across the curriculum (A + PAAC): rationale and design of a 3-year, cluster-randomized trial. BMC Public Health 2013;13:307. [DOI] [PMC free article] [PubMed] [Google Scholar]
- Donnelly JE, Hillman CH, Greene JL, Hansen DM, Gibson CA, Sullivan DK, et al. Physical activity and academic achievement across the curriculum: results from a 3-year cluster-randomized trial. Preventive Medicine 2017;99:140-5. [DOI] [PMC free article] [PubMed] [Google Scholar]
- Hansen DM, Herrmann SD, Lambourne K, Lee J, Donnelly JE. Linear/nonlinear relations of activity and fitness with children’s academic achievement. Medicine and Science in Sports and Exercise 2014;46(12):2279-85. [DOI] [PMC free article] [PubMed] [Google Scholar]
- Harvey SP, Lambourne K, Greene JL, Gibson CA, Lee J, Donnelly JE. The effects of physical activity on learning behaviors in elementary school children: a randomized controlled trial. Contemporary School Psychology 2018;22:303-12. [DOI] [PMC free article] [PubMed] [Google Scholar]
- Scudder MR, Drollette ES, Szabo-Reed AN, Lambourne K, Fenton CI, Donnelly JE, et al. Tracking the relationship between children’s aerobic fitness and cognitive control. Health Psychology 2016;35(9):967-78. [DOI] [PMC free article] [PubMed] [Google Scholar]
Dorgo 2009 {published data only}
- Dorgo S, King GA, Candelaria NG, Bader JO, Brickey GD, Adams CE. Effects of manual resistance training on fitness in adolescents. Journal of Strength & Conditioning Research 2009;23(8):2287-94. [DOI] [PMC free article] [PubMed] [Google Scholar]
Drummy 2016 {published data only}
- Drummy C, Murtagh EM, McKee DP, Breslin G, Davison GW, Murphy MH. The effect of a classroom activity break on physical activity levels and adiposity in primary school children. Journal of Paediatrics and Child Health 2016;52(7):745-9. [DOI] [PubMed] [Google Scholar]
Ewart 1998 {published data only}
- Ewart CK, Loftus KS, Hagberg JM. School-based exercise to lower blood pressure in high-risk African American girls: project design and baseline findings. Journal of Health Education 1995;26(2):S99-105. [Google Scholar]
- Ewart CK, Young DR, Hagberg JM. Effects of school-based aerobic exercise on blood pressure in adolescent girls at risk for hypertension. American Journal of Public Health 1998;88(6):949-51. [DOI] [PMC free article] [PubMed] [Google Scholar]
Fairclough 2013 {published data only}
- Dagger RM, Mackintosh KA, George KP, Davies IG, Stone GL, Fairclough SJ, et al. The CHANGE! project: changes in body composition and cardiorespiratory fitness in 10- to 11-year-old children after completing the CHANGE! intervention. Pediatric Exercise Science 2018;30(1):81-9. [DOI] [PubMed] [Google Scholar]
- Fairclough SJ, Hackett AF, Davies IG, Gobbi R, Mackintosh KA, Warburton GL, et al. Promoting healthy weight in primary school children through physical activity and nutrition education: a pragmatic evaluation of the CHANGE! randomised intervention study. BMC Public Health 2013;13:626. [DOI] [PMC free article] [PubMed] [Google Scholar]
Farmer 2017 {published data only}
- Farmer VL, Fitzgerald RP, Williams SM, Mann JI, Schofield G, McPhee JC, et al. What did schools experience from participating in a randomised controlled study (PLAY) that prioritised risk and challenge in active play for children while at school? Journal of Adventure Education and Outdoor Learning 2017;17(3):239-57. [Google Scholar]
- Farmer VL, Williams SM, Mann JI, Schofield G, McPhee JC, Taylor RW. The effect of increasing risk and challenge in the school playground on physical activity and weight in children: a cluster randomised controlled trial (PLAY). International Journal of Obesity 2017;41(5):793-800. [DOI] [PubMed] [Google Scholar]
Ford 2013 {published data only}
- Ford PA, Perkins G, Swaine I. Effects of a 15-week accumulated brisk walking programme on the body composition of primary school children. Journal of Sports Sciences 2013;31(2):114-22. [DOI] [PubMed] [Google Scholar]
Gentile 2009 {published data only}
- Eisenmann JC, Gentile DA, Welk GJ, Callahan R, Strickland S, Walsh M, et al. SWITCH: rationale, design, and implementation of a community, school, and family-based intervention to modify behaviors related to childhood obesity. BMC Public Health 2008;8:223. [DOI] [PMC free article] [PubMed] [Google Scholar]
- Gentile DA, Welk G, Eisenmann JC, Reimer RA, Walsh DA, Russell DW, et al. Evaluation of a multiple ecological level child obesity prevention program: Switch What you Do, View, and Chew. BMC Medicine 2009;7:49. [DOI] [PMC free article] [PubMed] [Google Scholar]
Grydeland 2013 {published data only}
- Bergh IH, Bjelland M, Grydeland M, Lien N, Andersen LF, Klepp KI, et al. Mid-way and post-intervention effects on potential determinants of physical activity and sedentary behavior, results of the HEIA study - a multi-component school-based randomized trial. International Journal of Behavioral Nutrition and Physical Activity 2012;9:63. [DOI] [PMC free article] [PubMed] [Google Scholar]
- Bergh IH, Grydeland M, Bjelland M, Lien N, Andersen LF, Klepp KI, et al. Personal and social-environmental correlates of objectively measured physical activity in Norwegian pre-adolescent children. Scandinavian Journal of Medicine & Science in Sports 2011;21(6):e315-24. [DOI] [PubMed] [Google Scholar]
- Bergh IH, Stralen MM, Bjelland M, Grydeland M, Lien N, Klepp KI, et al. Post-intervention effects on screen behaviours and mediating effect of parental regulation: the HEalth In Adolescents study - a multi-component school-based randomized controlled trial. BMC Public Health 2014;14:200. [DOI] [PMC free article] [PubMed] [Google Scholar]
- Bergh IH, Stralen MM, Grydeland M, Bjelland M, Lien N, Andersen LF, et al. Exploring mediators of accelerometer assessed physical activity in young adolescents in the Health In Adolescents Study - a group randomized controlled trial. BMC Public Health 2012;12:814. [DOI] [PMC free article] [PubMed] [Google Scholar]
- Bergh IH. Targeting change in physical activity and screen time behaviours within the HEalth In Adolescents (HEIA) intervention study: a mediating framework approach [Doctorate thesis]. Oslo (NO): Department of Coaching and Psychology at the Norwegian School of Sport Sciences (NSSS), 2013. [Google Scholar]
- Bjelland M, Bergh IH, Grydeland M, Klepp KI, Andersen LF, Anderssen SA, et al. Changes in adolescents’ intake of sugar sweetened beverages and sedentary behaviour: results at 8 month mid-way assessment of the HEIA study - a comprehensive, multi-component school-based randomized trial. International Journal of Behavioral Nutrition and Physical Activity 2011;8(1):63. [DOI] [PMC free article] [PubMed] [Google Scholar]
- Gebremariam MK, Andersen LF, Bjelland M, Klepp KI, Totland TH, Bergh IH, et al. Does the school food environment influence the dietary behaviours of Norwegian 11-year-olds? The HEIA study. Scandinavian Journal of Public Health 2012;40(5):491-7. [DOI] [PubMed] [Google Scholar]
- Grydeland M, Bergh IH, Bjelland M, Lien N, Andersen LF, Ommundsen Y, et al. Correlates of weight status among Norwegian 11-year-olds: the HEIA study. BMC Public Health 2012;12(1):1053. [DOI] [PMC free article] [PubMed] [Google Scholar]
- Grydeland M, Bergh IH, Bjelland M, Lien N, Andersen LF, Ommundsen Y, et al. Intervention effects on physical activity: the HEIA study - a cluster randomized controlled trial. International Journal of Behavioral Nutrition and Physical Activity 2013;10:17. [DOI] [PMC free article] [PubMed] [Google Scholar]
- Grydeland M, Bjelland M, Anderssen SA, Klepp KI, Bergh IH, Andersen LF, et al. Effects of a 20-month cluster randomised controlled school-based intervention trial on BMI of school-aged boys and girls: the HEIA study. British Journal of Sports Medicine 2014;48(9):768-73. [DOI] [PMC free article] [PubMed] [Google Scholar]
- Lien N, Bjelland M, Bergh IH, Grydeland M, Anderssen SA, Ommundsen Y, et al. Design of a 20-month comprehensive, multicomponent school-based randomised trial to promote healthy weight development among 11–13 year olds: the HEalth In Adolescents study. Scandinavian Journal of Public Health 2010;38(Suppl 5):38-51. [DOI] [PubMed] [Google Scholar]
Haerens 2006 {published data only}
- Haerens L, Cerin E, Maes L, Cardon G, Deforche B, De Bourdeaudhuij I. Explaining the effect of a 1-year intervention promoting physical activity in middle schools: a mediation analysis. Public Health Nutrition 2007;11(5):501-12. [DOI] [PubMed] [Google Scholar]
- Haerens L, De Bourdeaudhuij I, Maes L, Cardon G, Deforche B. School-based randomized controlled trial of a physical activity intervention among adolescents. Journal of Adolescent Health 2007;40(3):258-65. [DOI] [PubMed] [Google Scholar]
- Haerens L, Deforche B, Maes L, Cardon G, Stevens V, De Bourdeaudhuij I. Evaluation of a 2-year physical activity and healthy eating intervention in middle school children. Health Education Research 2006;2(6):911-21. [DOI] [PubMed] [Google Scholar]
- Haerens L, Deforche B, Maes L, Stevens V, Cardon G, De Bourdeaudhuij I. Body mass effects of a physical activity and healthy food intervention in middle schools. Obesity 2006;14(5):847-54. [DOI] [PubMed] [Google Scholar]
Harrington 2018 {published data only}
- Charles JM, Harrington DM, Davies MJ, Edwardson CL, Gorely T, Bodicoat DH, et al. Micro-costing and a cost-consequence analysis of the 'Girls Active' programme: a cluster randomised controlled trial. PLoS One 2019;14(8):e0221276. [DOI] [PMC free article] [PubMed] [Google Scholar]
- Edwardson CL, Harrington DM, Yates T, Bodicoat DH, Khunti K, Gorely T, et al. A cluster randomised controlled trial to investigate the effectiveness and cost effectiveness of the 'Girls Active' intervention: a study protocol. BMC Public Health 2015;15:526. [DOI] [PMC free article] [PubMed] [Google Scholar]
- Gorley T, Harrington DM, Bodicoat DH, Davies MJ, Khunti K, Sherar LB, et al. Process evaluation of the school-based Girls Active programme. BMC Public Health 2019;19:1187. [DOI] [PMC free article] [PubMed] [Google Scholar]
- Harrington DM, Davies MJ, Bodicoat DH, Charles JM, Chudasama YV, Gorely T, et al. Effectiveness of the 'Girls Active' school-based physical activity programme: a cluster randomised controlled trial. International Journal of Behavioral Nutrition and Physical Activity 2018;15(1):40. [DOI] [PMC free article] [PubMed] [Google Scholar]
Have 2018 {published data only}
- Have M, Nielse JH, Gejl AK, Ernst MT, Fredens K, Støckel JT, et al. Rationale and design of a randomized controlled trial examining the effect of classroom-based physical activity on math achievement. BMC Public Health 2016;16:304. [DOI] [PMC free article] [PubMed] [Google Scholar]
- Have M, Nielsen JH, Ernst MT, Gejl AK, Fredens K, Grøntved A, et al. Classroom-based physical activity improves children's math achievement - A randomized controlled trial. PLoS One 2018;13(12):e0208787. [DOI] [PMC free article] [PubMed] [Google Scholar]
Ickovics 2019 {published data only}
- Ickovics JR, Duffany KO, Shebl FM, Peters SM, Read MA, Gilstad-Hayden KR, et al. Implementing school-based policies to prevent obesity: cluster randomized trial. American Journal of Preventive Medicine 2019;56(1):e1-e11. [DOI] [PMC free article] [PubMed] [Google Scholar]
Jago 2011 {published data only}
- Buse J, Hirst K. The HEALTHY study: introduction. International Journal of Obesity 2009;33:S1-S2. [DOI] [PubMed] [Google Scholar]
- DeBar LL, Schneider M, Drews KL, Ford EG, Stadler DD, Moe EL, et al. Student public commitment in a school-based diabetes prevention project: impact on physical health and health behavior. BMC Public Health 2011;11:711. [DOI] [PMC free article] [PubMed] [Google Scholar]
- Drews KL, Harrell JS, Thompson D, Mazzuto SL, Ford EG, Carter M, et al. Recruitment and retention strategies and methods in the HEALTHY study. International Journal of Obesity 2009;33:S21-S28. [DOI] [PMC free article] [PubMed] [Google Scholar]
- Gillis B, Mobley C, Stadler DD, Hartstein J, Virus A, Volpe SL, et al. Rationale, design and methods of the HEALTHY study nutrition intervention component. International Journal of Obesity 2009;33:S29-S36. [DOI] [PMC free article] [PubMed] [Google Scholar]
- Hall WJ, Schneider M, Thompson D, Volpe SL, Steckler A, Hall JM, et al. School factors as barriers to and facilitators of a preventive intervention for pediatric type 2 diabetes. Translational Behavioral Medicine 2014;4:131-40. [DOI] [PMC free article] [PubMed] [Google Scholar]
- Hall WJ, Zeveloff A, Steckler A, Schneider M, Thompson D, Pham T, et al. Process evaluation results from the HEALTHY physical education intervention. Health Education Research 2012;27(2):307-18. [DOI] [PMC free article] [PubMed] [Google Scholar]
- Hartstein J, Cullen KW, Virus A, Ghormli LE, Volpe SL, Staten MA, et al. Impact of the HEALTHY study on vending machine offerings in middle schools. Journal of Child Nutrition and Management 2013;35(2):16353. [PMC free article] [PubMed] [Google Scholar]
- Hernandez AE, Marcus MD, Hirst K, Faith MS, Goldberg L, Trevino RP. Impact of implementation and conduct of the HEALTHY primary prevention trial on student performance. American Journal of Health Promotion 2014;29(1):55-8. [DOI] [PMC free article] [PubMed] [Google Scholar]
- Jago R, Drews KL, McMurray RG, Thompson D, Volpe SL, Moe EL, et al. Fatness, fitness, and cardiometabolic risk factors among sixth-grade youth. Medicine and Science in Sports and Exercise 2010;42(8):1502-10. [DOI] [PMC free article] [PubMed] [Google Scholar]
- Jago R, McMurray RG, Drews KL, Moe EL, Murray T, Pham TH, et al. HEALTHY intervention: fitness, physical activity, and metabolic syndrome results. Medicine & Science in Sports & Exercise 2011;43(8):1513-22. [DOI] [PMC free article] [PubMed] [Google Scholar]
- Kahn HS, El Ghormli L, Jago R, Foster GD, McMurray RG, Buse JB, et al. Cardiometabolic risk assessments by body mass index z-score or waist-to-height ratio in a multiethnic sample of sixth-graders. Journal of Obesity 2014;2014:ID 421658. [DOI] [PMC free article] [PubMed] [Google Scholar]
- Marcus MD, Foster GD, El Ghormli L, Baranowski T, Goldberg L, Jago R, et al. Shifts in BMI category and associated cardiometabolic risk: prospective results from HEALTHY study. Pediatrics 2012;129(4):e983-91. [DOI] [PMC free article] [PubMed] [Google Scholar]
- Marcus MD, Foster GD, El Ghormli L. Stability of relative weight category and cardiometabolic risk factors among moderately and severely obese middle school youth. Pediatric Obesity 2014;22(4):1118-25. [DOI] [PMC free article] [PubMed] [Google Scholar]
- Marcus MD, Hirst K, Kaufman F, Foster GD, Baranowski T. Lessons learned from the HEALTHY primary prevention trial of risk factors for type 2 diabetes in middle school youth. Current Diabetes Reports 2013;13:63-71. [DOI] [PMC free article] [PubMed] [Google Scholar]
- Schneider M, DeBar L, Calingo A, Hall W, Hindes K, Sleigh A, et al. The effect of a communications campaign on middle school students' nutrition and physical activity: results of the HEALTHY study. Journal of Health Communication 2013;18:649-67. [DOI] [PMC free article] [PubMed] [Google Scholar]
- Siega-Riz AM, El Ghormli L, Mobley C, Gillis B, Stadler D, Hartstein J, et al. The effects of the HEALTHY study intervention on middle school student dietary intakes. International Journal of Behavioral Nutrition and Physical Activity 2011;8:7. [DOI] [PMC free article] [PubMed] [Google Scholar]
- The Healthy Study Group, Mobley CC, Stadler DD, Staten MA, El Ghormli L, Gillis B, et al. Effect of nutrition changes on foods selected by students in a middle school-based diabetes prevention intervention program: the HEALTHY experience. Journal of School Health 2012;82(2):82-90. [DOI] [PMC free article] [PubMed] [Google Scholar]
- The Healthy Study Group. A school-based intervention for diabetes risk reduction. New England Journal of Medicine 2010;363(5):443-53. [DOI] [PMC free article] [PubMed] [Google Scholar]
- The Healthy Study Group. HEALTHY study rationale, design and methods: moderating risk of type 2 diabetes in multi-ethnic middle school students. International Journal of Obesity 2009;33(Suppl 4):S4-20. [DOI] [PMC free article] [PubMed] [Google Scholar]
- Venditti EM, Elliot DL, Faith MS, Firrell LS, Giles CM, Goldberg L, et al. Rationale, design and methods of the HEALTHY study behavior intervention component. International Journal of Obesity 2009;33:S44-S51. [DOI] [PMC free article] [PubMed] [Google Scholar]
- Venditti EM, Giles C, Firrell SL, Zeveloff AD, Hirst K, Marcus MD. Interactive learning activities for the middle school classroom to promote healthy energy balance and decrease diabetes risk in the HEALTHY primary prevention trial. Health Promotion Practice 2014;15(1):55-62. [DOI] [PMC free article] [PubMed] [Google Scholar]
- Volpe SL, Hall WJ, Steckler A, Schneider M, Thompson D, Mobley C, et al. Process evaluation results from the HEALTHY nutrition intervention to modify the total school food environment. Health Education Research 2013;28(6):970-8. [DOI] [PMC free article] [PubMed] [Google Scholar]
- Willi SM, Hirst K, Jago R, Buse J, Kaufman F, El Ghormli L, et al. Cardiovascular risk factors in multi-ethnic middle school students: the HEALTHY primary prevention trial. Pediatric Obesity 2012;7(3):230-9. [DOI] [PMC free article] [PubMed] [Google Scholar]
Jago 2014 {published data only}
- Jago R, Edwards MJ, Cooper AR, Fox KR, Powell J, Sebire SJ, et al. Action 3:30: protocol for a randomized feasibility trial of a teaching assistant led extracurricular physical activity intervention. Trials 2013;14:122. [DOI] [PMC free article] [PubMed] [Google Scholar]
- Jago R, Sebire SJ, Davies B, Wood L, Banfield K, Edwards MJ, et al. Increasing children’s physical activity through a teaching-assistant led extracurricular intervention: process evaluation of the action 3:30 randomised feasibility trial. BMC Public Health 2015;15:156. [DOI] [PMC free article] [PubMed] [Google Scholar]
- Jago R, Sebire SJ, Davies B, Wood L, Edwards MJ, Banfield K, et al. Randomised feasibility trial of a teaching assistant led extracurricular physical activity intervention for 9 to 11 year olds: Action 3:30. International Journal of Behavioral Nutrition and Physical Activity 2014;11:114. [DOI] [PMC free article] [PubMed] [Google Scholar]
- Sebire SJ, Edwards MJ, Fox KR, Davies B, Banfield K, Wood L, et al. Delivery and receipt of a self-determination-theory-based extracurricular physical activity intervention: exploring theoretical fidelity in Action 3:30. Journal of Sport & Exercise Psychology 2016;38(4):381-95. [DOI] [PubMed] [Google Scholar]
Jago 2015 {published data only}
- Edwards MJ, May T, Kesten JM, Banfield K, Bird EL, Powell JE, et al. Lessons learnt from the Bristol Girls Dance Project cluster RCT: implications for designing and implementing after-school physical activity interventions. BMJ Open 2016;6(1):e010036. [DOI] [PMC free article] [PubMed] [Google Scholar]
- Jago R, Edwards MJ, Sebire SJ, Bird EL, Tomkinson K, Kesten JM, et al. Bristol Girls Dance Project: a cluster randomised controlled trial of an after-school dance programme to increase physical activity among 11- to 12-year-old girls. Public Health Research 2016;4(6). [PubMed]
- Jago R, Edwards MJ, Sebire SJ, Cooper AR, Powell JE, Bird EL, et al. Bristol Girls Dance Project (BGDP): protocol for a cluster randomised controlled trial of an after-school dance programme to increase physical activity among 11-12 year old girls. BMC Public Health 2013;13:1003. [DOI] [PMC free article] [PubMed] [Google Scholar]
- Jago R, Edwards MJ, Sebire SJ, Tomkinson K, Bird EL, Banfield K, et al. Effect and cost of an after-school dance programme on the physical activity of 11-12 year old girls: the Bristol Girls Dance Project, a school-based cluster randomised controlled trial. International Journal of Behavioral Nutrition and Physical Activity 2015;12:128. [DOI] [PMC free article] [PubMed] [Google Scholar]
- Sebire SJ, Edwards MJ, Kesten JM, May T, Banfield KJ, Bird EL, et al. Process evaluation of the Bristol Girls Dance Project. BMC Public Health 2016;16:349. [DOI] [PMC free article] [PubMed] [Google Scholar]
- Sebire SJ, Kesten JM, Edwards MJ, May T, Banfield K, Tomkinson K, et al. Using self-determination theory to promote adolescent girls' physical activity: exploring the theoretical fidelity of the Bristol Girls Dance Project. Psychology of Sport and Exercise 2016;24:100-10. [DOI] [PMC free article] [PubMed] [Google Scholar]
Jago 2019 {published data only}
- Jago R, Tibbitts B, Sanderson E, Bird EL, Porter A, Metcalfe C, et al. Action 3:30R: results of a cluster randomised feasibility study of a revised teaching assistant-led extracurricular physical activity intervention for 8 to 10 year olds. International Journal of Environmental Research and Public Health 2019;16(1):131. [DOI] [PMC free article] [PubMed] [Google Scholar]
- Tibbitts B, Porter A, Sebire SJ, Metcalfe C, Bird E, Powell J, et al. Action 3:30R: protocol for a cluster randomised feasibility study of a revised teaching assistant-led extracurricular physical activity intervention for 8- to 10-year-olds. Pilot and Feasibility Studies 2017;3(1):69. [DOI] [PMC free article] [PubMed] [Google Scholar]
Jansen 2011 {published data only}
- Jansen W, Borsboom G, Meima A, Zwanenburg EJ, Mackenbach JP, Raat H, et al. Effectiveness of a primary school-based intervention to reduce overweight. International Journal of Pediatric Obesity 2011;6(Suppl 3):e70-7. [DOI] [PubMed] [Google Scholar]
Jarani 2016 {published data only}
- Jarani J, Grontved A, Muca F, Spahi A, Qefalia D, Ushtelenca K, et al. Effects of two physical education programmes on health- and skill-related physical fitness of Albanian children. Journal of Sports Sciences 2016;34(1):35-46. [DOI] [PubMed] [Google Scholar]
Ketelhut 2020 {published data only}
- Ketelhut S, Kircher E, Ketelhut SR, Wehlan E, Ketelhut K. Effectiveness of multi-activity, high-intensity interval training in school-aged children. International Journal of Sports Medicine 2020;41:227-32. [DOI] [PubMed] [Google Scholar]
Kipping 2014 {published data only}
- Anderson EL, Howe LD, Kipping RR, Campbell R, Jago R, Noble SM, et al. Long-term effects of the Active for Life Year 5 (AFLY5) school-based cluster-randomised controlled trial. BMJ Open 2016;6(11):e010957. [DOI] [PMC free article] [PubMed] [Google Scholar]
- Campbell R, Rawlins E, Wells S, Kipping RR, Chittleborough CR, Peters TJ, et al. Intervention fidelity in a school-based diet and physical activity intervention in the UK: Active for Life Year 5. International Journal of Behavioral Nutrition and Physical Activity 2015;12:141. [DOI] [PMC free article] [PubMed] [Google Scholar]
- Jago R, Rawlins E, Kipping RR, Wells S, Chittleborough C, Peters TJ, et al. Lessons learned from the AFLY5 RCT process evaluation: implications for the design of physical activity and nutrition interventions in schools. BMC Public Health 2015;15:946. [DOI] [PMC free article] [PubMed] [Google Scholar]
- Kipping RR, Howe LD, Jago R, Campbell R, Wells S, Chittleborough CR, et al. Effect of intervention aimed at increasing physical activity, reducing sedentary behaviour, and increasing fruit and vegetable consumption in children: Active for Life Year 5 (AFLY5) school based cluster randomised controlled trial. BMJ 2014;348:g3256. [DOI] [PMC free article] [PubMed] [Google Scholar]
- Kipping RR, Jago R, Lawlor DA. Developing parent involvement in a school-based child obesity prevention intervention: a qualitative study and process evaluation. Journal of Public Health 2011;34(2):236-44. [DOI] [PubMed] [Google Scholar]
- Lawlor DA, Howe LD, Anderson EL, Kipping RR, Campbell R, Wells S, et al. The Active for Life Year 5 (AFLY5) school-based cluster randomised controlled trial: effect on potential mediators. BMC Public Health 2016;16:68. [DOI] [PMC free article] [PubMed] [Google Scholar]
- Lawlor DA, Jago R, Noble SM, Chittleborough CR, Campbell R, Mytton J, et al. The Active for Life Year 5 (AFLY5) school based cluster randomised controlled trial: study protocol for a randomized controlled trial. Trials 2011;12:181. [DOI] [PMC free article] [PubMed] [Google Scholar]
- Lawlor DA, Peters TJ, Howe LD, Noble SM, Kipping RR, Jago R. The Active for Life Year 5 (AFLY5) school-based cluster randomised controlled trial protocol: detailed statistical analysis plan. Trials 2013;14:234. [DOI] [PMC free article] [PubMed] [Google Scholar]
Kobel 2014 {published data only}
- Dreyhaupt J, Koch B, Wirt T, Schreiber A, Brandstetter S, Kesztyus D, et al. Evaluation of a health promotion program in children: study protocol and design of the cluster-randomized Baden-Württemberg primary school study [DRKS-ID: DRKS00000494]. BMC Public Health 2012;12:157. [DOI] [PMC free article] [PubMed] [Google Scholar]
- Kesztyüs D, Lauer R, Kesztyüs T, Kilian R, Steinacker JM. Costs and effects of a state-wide health promotion program in primary schools in Germany – the Baden-Württemberg Study: a cluster-randomized, controlled trial. PLoS One 2017;12(2):e0172332. [DOI] [PMC free article] [PubMed] [Google Scholar]
- Kesztyüs D, Lauer R, Traub M, Kesztyüs T, Steinacker JM. Effects of statewide health promotion in primary schools on children's sick days, visits to a physician and parental absence from work: a cluster-randomized trial. BMC Public Health 2016;16:1244. [DOI] [PMC free article] [PubMed] [Google Scholar]
- Kobel S, Kettner S, Dreyhaupt J. Objectively determined physical activity levels in German primary school children after a one year school-based health promoting intervention. Journal of Childhood Obesity 2017;2(2):8. [Google Scholar]
- Kobel S, Lammle C, Wartha O, Kesztyüs D, Wirt T, Steinacker JM. Effects of a randomised controlled school-based health promotion intervention on obesity related behavioural outcomes of children with migration background. Journal of Immigrant and Minority Health/Center for Minority Public Health 2017;19:254-62. [DOI] [PMC free article] [PubMed] [Google Scholar]
- Kobel S, Wirt T, Schreiber A, Kesztyus D, Kettner S, Erkelenz N, et al. Intervention effects of a school-based health promotion programme on obesity related behavioural outcomes. Journal of Obesity 2014;2014:476230. [DOI] [PMC free article] [PubMed] [Google Scholar]
- Lammle C, Kobel S, Wartha O, Wirt T, Steinacker JM. Intervention effects of a school-based health promotion program on children's motor skills. Journal of Public Health 2016;24:185-92. [DOI] [PMC free article] [PubMed] [Google Scholar]
Kocken 2016 {published data only}
- Kocken PL, Scholten AM, Westhoff E, De Kok BP, Taal EM, Goldbohm RA. Effects of a theory-based education program to prevent overweightness in primary school children. Nutrients 2016;8(1):12. [DOI] [PMC free article] [PubMed] [Google Scholar]
Kriemler 2010 {published data only}
- Kriemler S, Zahner L, Schindler C, Meyer U, Hartmann T, Hebestreit H, et al. Effect of school based physical activity programme (KISS) on fitness and adiposity in primary schoolchildren: cluster randomised controlled trial. British Medical Journal 2010;340:c785. [DOI] [PMC free article] [PubMed] [Google Scholar]
- Puder J, Zahner L, Schindler C, Meyer U, Hebestreit H, Rocca H, et al. A school-based physical activity program increases fitness and decreases adiposity and cardiovascular risk factors in primary school children: a cluster-randomized trial. Diabetologia 2009;52(Suppl 1):S330-1. [Google Scholar]
Lau 2016 {published data only}
- Lau PW, Wang JJ, Maddison R. A randomized-controlled trial of school-based active videogame intervention on Chinese children's aerobic fitness, physical activity level, and psychological correlates. Games for Health Journal 2016;5(6):405-12. [DOI] [PubMed] [Google Scholar]
Leahy 2019 {published data only}
- Leahy A, Hillman C, Shigeta T, Smith J, Eather N, Morgan P, et al. Teacher facilitated high-intensity interval training intervention for older adolescents: the 'Burn 2 Learn' pilot randomised controlled trial. In: Journal of Science and Medicine in Sport. Conference: 2018 Sports Medicine Australia conference. Australia. Vol. 21. 2018:S72 C3-Embase 2001104936.
- Leahy A, Smith J, Eather N, Hillman C, Morgan P, Plotnikoff R, et al. Effects of a school-based high-intensity interval training intervention on older adolescents' cognition. In: Journal of Science and Medicine in Sport. Vol. 21. 2018:S72‐S73.
- Leahy AA, Eather N, Smith JJ, Hillman C, Morgan PJ, Nilsson M, et al. School-based physical activity intervention for older adolescents: rationale and study protocol for the Burn 2 Learn cluster randomised controlled trial. BMJ Open 2019;9(5):e026029. [DOI] [PMC free article] [PubMed] [Google Scholar]
- Leahy AA, Eather N, Smith JJ, Hillman CH, Morgan PJ, Plotnikoff RC, et al. Feasibility and preliminary efficacy of a teacher-facilitated high-intensity interval training intervention for older adolescents. Pediatric Exercise Science 2019;31(1):107-17. [DOI] [PubMed] [Google Scholar]
Lonsdale 2019a {published data only}
- Lonsdale C, Lester A, Owen KB, White RL, Moyes I, Peralta L, et al. An internet-supported school physical activity intervention in low socioeconomic status communities: results from the Activity and Motivation in Physical Education (AMPED) cluster randomised controlled trial. British Journal of Sports Medicine 2019;53:341-7. [DOI: 10.1186/s12889-015-2583-7] [DOI] [PubMed] [Google Scholar]
- Lonsdale C, Lester A, Owen KB, White RL, Moyes I, Peralta L, et al. An Internet-supported physical activity intervention delivered in secondary schools located in low socio-economic status communities: study protocol for the activity and motivation in physical education (AMPED) cluster randomized controlled trial. BMC Public Health 2016;16:17. [DOI] [PMC free article] [PubMed] [Google Scholar]
- Lubans D, Beauchamp M, Diallo T, Peralts L, Bennie A, White R, et al. Effects of a school-based physical activity intervention on adolescents' performance in mathematics: the AMPED cluster RCT. Journal of Science and Medicine in Sport 2018;21:S71‐2. [DOI] [PubMed] [Google Scholar]
- Lubans DR, Beauchamp MR, Diallo TO, Peralta LR, Bennie A, White RL, et al. School physical activity intervention effect on adolescents' performance in mathematics. Medicine and Science in Sport and Exercise 2018;50(12):2442-50. [DOI] [PubMed] [Google Scholar]
Luepker 1996 {published data only}
- Belcher JD, Ellison RC, Shepard WE, Bigelow C, Webber LS, Wilmore JH, et al. Lipid and lipoprotein distributions in children by ethnic group, gender, and geographic location - preliminary findings of the Child and Adolescent Trial for Cardiovascular Health (CATCH). Preventive Medicine 1993;22(2):143-53. [DOI] [PubMed] [Google Scholar]
- Coleman KJ, Tiller CL, Sanchez J, Heath EM, Oumar S, Milliken G, et al. Prevention of the epidemic increase in child risk of overweight in low-income schools. Archives of Pediatric and Adolescent Medicine 2005;159(3):217-24. [DOI] [PubMed] [Google Scholar]
- Edmundson E, Parcel GS, Feldman HA, Elder J, Perry CL, Johnson CC, et al. The effects of the Child and Adolescent Trial for Cardiovascular Health upon psychosocial determinants of diet and physical activity behavior. Preventive Medicine 1996;25:442-54. [DOI] [PubMed] [Google Scholar]
- Edmundson EW, Luton SC, McGraw SA, Kelder SH, Layman AK, Smyth M, et al. CATCH: classroom process evaluation in a multicenter trial. Health Education Quarterly 1994;Suppl 2:S27-50. [DOI] [PubMed] [Google Scholar]
- Elder JP, McGraw SA, Stone EJ, Reed DB, Harsha DW, Greene T, et al. CATCH: process evaluation of environmental factors and programs. Health Education Quarterly 1994;Suppl 2:S107-27. [DOI] [PubMed] [Google Scholar]
- Hoelscher DM, Feldman HA, Johnson CC, Lytle LA, Osganian SK, Parcel GS, et al. School-based health education programs can be maintained over time: results from the CATCH institution study. Preventive Medicine 2004;38:594-606. [DOI] [PubMed] [Google Scholar]
- Johnson CC, Osganian SK, Budman SB, Lytle LA, Barrera EP, Bonura SR, et al. CATCH: family process evaluation in a multicenter trial. Health Education Quarterly 1994;Suppl 2:S91-106. [DOI] [PubMed] [Google Scholar]
- Luepker RV, Perry CL, McKinlay SM, Nader PR, Parcel GS, Stone EJ, et al. Outcomes of a field trial to improve children's dietary patterns and physical activity. The Child and Adolescent Trial for Cardiovascular Health (CATCH) Collaborative Group. JAMA 1996;275(10):768-76. [DOI] [PubMed] [Google Scholar]
- Lytle LA, Ward J, Nader PR, Pedersen SA, Williston BJ. Maintenance of a health promotion program in elementary schools: results from the CATCH-ON study key informant interviews. Health Education and Behavior 2003;30(4):503-18. [DOI] [PubMed] [Google Scholar]
- Lytle LA. Lessons from the Child and Adolescent Trial for Cardiovascular Health (CATCH): interventions with children. Current Opinion in Lipidology 1998;9(1):29-33. [DOI] [PubMed] [Google Scholar]
- McGraw SA, Stone EJ, Osganian SK, Elder JP, Perry CL, Johnson CC, et al. Design of process evaluation within the Child and Adolescent Trial for Cardiovascular Health (CATCH). Health Education Quarterly 1994;Suppl 2:S5-26. [DOI] [PubMed] [Google Scholar]
- McKenzie TL, Li D, Derby CA, Webber LS, Luepker LRV, Cribb P. Maintenance of effects of the CATCH physical education program: results from the CATCH-on study. Health Education & Behavior 2003;30(4):447-62. [DOI] [PubMed] [Google Scholar]
- McKenzie TL, Nader PR, Strikmiller PK, Yang M, Stone EJ, Perry CL, et al. School physical education: effect of the Child and Adolescent Trial for Cardiovascular Health. Preventive Medicine 1996;25(4):423-31. [DOI] [PubMed] [Google Scholar]
- McKenzie TL, Stone EJ, Feldman HA, Epping JN, Yang M, Strikmiller PK, et al. Effects of the CATCH physical education intervention: teacher type and lesson location. American Journal of Preventive Medicine 2001;21(2):101-9. [DOI] [PubMed] [Google Scholar]
- McKenzie TLF, Li D, Derby C, Webber LS, Luepker LRV, Cribb P. Sustainability of a health-related physical education intervention in 76 elementary schools: CATCH. Medicine & Science in Sports & Exercise 2002;34(5):301. [Google Scholar]
- Nader PR, Sellers DE, Johnson CC, Perry CL, Stone EJ, Cook KC, et al. The effect of adult participation in a school-based family intervention to improve children's diet and physical activity: the Child and Adolescent Trial for Cardiovascular Health (CATCH). Preventive Medicine 1996;25:455-64. [DOI] [PubMed] [Google Scholar]
- Nader PR, Stone EJ, Lytle LA, Perry CL, Osganian SK, Kelder S, et al. Three-year maintenance of improved diet and physical activity: the CATCH cohort. Archives of Pediatrics & Adolescent Medicine 1999;153(7):695-704. [DOI] [PubMed] [Google Scholar]
- Perry CL, Sellers DE, Johnson CC, Pedersen SA, Bachman KJ, Parcel GS, et al. The Child and Adolescent Trial for Cardiovascular Health (CATCH): intervention, implementation, and feasibility for elementary schools in the United States. Health Education and Behavior 1997;24(6):716-35. [DOI] [PubMed] [Google Scholar]
- Perry CL, Stone EJ, Parcel GS, Ellison RC, Nader PR, Webber LS, et al. School-based cardiovascular health promotion: the Child and Adolescent Trial for Cardiovascular Health (CATCH). Journal of School Health 1990;60:406-13. [DOI] [PubMed] [Google Scholar]
- Stone EJ, Osganian SK, McKinlay SM, Wu MC, Webber LS, Luepker RV, et al. Operational design and quality control in the CATCH multicenter trial. Preventive Medicine 1996;25(4):384-99. [DOI] [PubMed] [Google Scholar]
- Webber LS, Osganian SK, Feldman HA, Wu M, McKenzie TL, Nichaman M, et al. Cardiovascular risk factors among children after a 2 1/2-year intervention: the CATCH study. Preventive Medicine 1996;25(4):432-41. [DOI] [PubMed] [Google Scholar]
Madsen 2015 {published data only}
- Madsen K, Linchey J, Gerstein D, Ross M, Myers E, Brown K, et al. Energy balance 4 kids with play: results from a two-year cluster-randomized trial. Childhood Obesity 2015;11(4):375-83. [DOI] [PubMed] [Google Scholar]
- Myers EF, Gerstein DE, Foster J, Ross M, Brown K, Kennedy E, et al. Energy balance for kids with play: design and implementation of a multi-component school-based obesity prevention program. Childhood Obesity 2014;10(3):251-9. [DOI] [PubMed] [Google Scholar]
Magnusson 2011 {published data only}
- Hrafnkelsson H, Magnusson KT, Thorsdottir I, Johannsson E, Sigurdsson EL. Result of school-based intervention on cardiovascular risk factors. Scandinavian Journal of Primary Health Care 2014;32(4):149-55. [DOI] [PMC free article] [PubMed] [Google Scholar]
- Magnusson K T, Hrafnkelsson H, Sigurgeirsson I, Johannsson E, Sveinsson T. Limited effects of a 2-year school-based physical activity intervention on body composition and cardiorespiratory fitness in 7-year-old children. Health Education Research 2012;27(3):484-94. [DOI] [PubMed] [Google Scholar]
- Magnusson KT, Sigurgeirsson I, Sveinsson T, Johannsson E. Assessment of a two-year school-based physical activity intervention among 7-9-year-old children. International Journal of Behavioral Nutrition and Physical Activity 2011;8:138. [DOI] [PMC free article] [PubMed] [Google Scholar]
Martinez‐Vizcaino 2014 {published data only}
- Díez-Fernández A, Sánchez-López M, Gulías-González R, Notario-Pacheco B, García-Prieto JC, Arias-Palencia N, et al. BMI as a mediator of the relationship between muscular fitness and cardiometabolic risk in children: a mediation analysis. PLoS One 2015;10(1):e0116506. [DOI] [PMC free article] [PubMed] [Google Scholar]
- Martínez-Andrés M, García-López U, Gutiérrez-Zornoza M, Rodríguez-Martín B, Pardo-Guijarro MJ, Sánchez-López M, et al. Barriers, facilitators and preferences for the physical activity of school children. Rationale and methods of a mixed study. BMC Public Health 2012;12(1):785. [DOI] [PMC free article] [PubMed] [Google Scholar]
- Martinez-Vizcaino V, Sanchez-Lopez M, Notario-Pacheco B, Salcedo-Aguilar F, Solera-Martinez M, Franquelo-Morales P, et al. Gender differences on effectiveness of a school-based physical activity intervention for reducing cardiometabolic risk: a cluster randomized trial. International Journal of Behavioral Nutrition and Physical Activity 2014;11:154. [DOI] [PMC free article] [PubMed] [Google Scholar]
- Martinez-Vizcaino V, Sanchez-Lopez M, Salcedo-Aguilar F, Notario-Pacheco B, Solera-Martinez M, Moya-Martinez P, et al. Protocol of a randomized cluster trial to assess the effectiveness of the MOVI-2 program on overweight prevention in schoolchildren. Revista Espanola de Cardiologia (Enlgish Edition) 2012;65(5):427-33. [DOI] [PubMed] [Google Scholar]
Melnyk 2013 {published data only}
- Kelly SA, Oswalt K, Melnyk BM, Jacobson D. Comparison of intervention fidelity between COPE TEEN and an attention-control program in a randomized controlled trial. Health Education Research 2015;30(2):233-47. [DOI] [PMC free article] [PubMed] [Google Scholar]
- Melnyk BM, Jacobson D, Kelly S, Belyea M, Shaibi G, Small L, et al. Promoting healthy lifestyles in high school adolescents: a randomized controlled trial. American Journal of Preventive Medicine 2013;45(4):407-15. [DOI] [PMC free article] [PubMed] [Google Scholar]
- Melnyk BM, Jacobson D, Kelly SA, Belyea MJ, Shaibi G, Small L, et al. Twelve-month effects of the COPE healthy lifestyles TEEN program on overweight and depressive symptoms in high school adolescents. Journal of School Health 2015;85(12):861-70. [DOI] [PMC free article] [PubMed] [Google Scholar]
- Melnyk BM, Kelly S, Jacobson D, Belyea M, Shaibi G, Small L, et al. The COPE healthy lifestyles TEEN randomized controlled trial with culturally diverse high school adolescents: baseline characteristics and methods. Contemporary Clinical Trials 2013;36(1):41-53. [DOI] [PMC free article] [PubMed] [Google Scholar]
Müller 2019 {published data only}
- Gall S, Adams L, Joubert N, Ludyga S, Müller I, Nqweniso S, et al. Effect of a 20-week physical activity intervention on selective attention and academic performance in children living in disadvantaged neighborhoods: a cluster randomized control trial. PLoS One 2018;13(11):e0206908. [DOI] [PMC free article] [PubMed] [Google Scholar]
- Müller I, Schindler V, Adams L, Endes K, Gall S, Gerber M, et al. Effect of a multidimensional physical activity intervention on body mass index, skinfolds and fitness in South African children: results from a cluster-randomised controlled trial. International Journal of Environmental Research and Public Health 2019;16(2):232. [DOI] [PMC free article] [PubMed] [Google Scholar]
Muros 2015 {published data only}
- Muros JJ, Zabala M, Oliveras-Lopez MJ, Bouzas PR, Knox E, Rufian-Henares JA, et al. Eect of physical activity, nutritional education, and consumption of extra virgin olive oil on lipid, physiological and anthropometric proles in a pediatric population. Journal of Physical Activity & Health 2015;12(9):1245-52. [DOI] [PubMed] [Google Scholar]
Neumark‐Sztainer 2009 {published data only}
- Neumark-Sztainer D, Haines J, Robinson-O'Brien R, Hannan PJ, Robins M, Morris B, et al. 'Ready. Set. ACTION!' A theater-based obesity prevention program for children: a feasibility study. Health Education Research 2009;24(3):407-20. [DOI] [PMC free article] [PubMed] [Google Scholar]
Neumark‐Sztainer 2010 {published data only}
- Neumark-Sztainer DR, Friend SE, Flattum CF, Hannan PJ, Story MT, Bauer KW, et al. New moves - preventing weight-related problems in adolescent girls: a group-randomized study. American Journal of Preventive Medicine 2010;39(5):421-32. [DOI] [PMC free article] [PubMed] [Google Scholar]
Nogueira 2014 {published data only}
- Nogueira RC, Weeks BK, Beck B. One-year follow-up of the CAPO Kids Trial: are physical benefits maintained? Pediatric Exercise Science 2017;29(4):486-95. [DOI] [PubMed] [Google Scholar]
- Nogueira RC, Weeks BK, Beck BR. An in-school exercise intervention to enhance bone and reduce fat in girls: the CAPO Kids trial. Bone 2014;68:92-9. [DOI] [PubMed] [Google Scholar]
- Nogueira RC, Weeks BK, Beck BR. Characterisation of the mechanical loads and metabolic intensity of the CAPO kids exercise intervention for healthy primary school children. Journal of Sports Science & Medicine 2015;14:562-7. [PMC free article] [PubMed] [Google Scholar]
- Nogueira RC, Weeks BK, Beck BR. Targeting bone and fat with novel exercise for peripubertal boys: the CAPO Kids Trial. Pediatric Exercise Science 2015;27:128-39. [DOI] [PubMed] [Google Scholar]
- Nogueira RC. Exercising opportunities to prevent chronic disease: the CAPO Kids trial [Doctorate thesis]. Gold Coast (AU): Griffith University, 2014. [Google Scholar]
Okely 2011 {published data only}
- Okely AD, Cotton WG, Lubans DR, Morgan PJ, Puglisi L, Miller J, et al. A school-based intervention to promote physical activity among adolescent girls: rationale, design, and baseline data from the Girls in Sport group randomised controlled trial. BMC Public Health 2011;11:658. [DOI] [PMC free article] [PubMed] [Google Scholar]
- Okely AD, Lubans DR, Morgan PJ, Cotton W, Peralta L, Miller J, et al. Promoting physical activity among adolescent girls: the Girls in Sport group randomized trial. International Journal of Behavioral Nutrition and Physical Activity 2017;14(1):81. [DOI] [PMC free article] [PubMed] [Google Scholar]
Ordóñez Dios 2019 {published data only}
- Ordóñez Dios AF, Polo Recuero B, Calvo AL, Shaoliang Z. Effects of a school physical activity intervention in pre-adolescents [Efectes d’una intervenció escolar sobre diversos aspectes en la preadolescència]. Educació Física i Esports 2019;136:49-61. [Google Scholar]
Pablos 2018 {published data only}
- Pablos A, Nebot V, Vañó--Vicent V, Ceca D, Elvira L. Effectiveness of a school-based program focusing on diet and health habits taught through physical exercise. Applied Physiology Nutrition and Metabolism 2018;43(4):331-7. [DOI] [PubMed] [Google Scholar]
Peralta 2009 {published data only}
- Peralta LR, Jones RA, Okely AD. Promoting healthy lifestyles among adolescent boys: the Fitness Improvement and Lifestyle Awareness Program RCT. Preventive Medicine 2009;48(6):537-42. [DOI] [PubMed] [Google Scholar]
Reed 2008 {published data only}
- Ahamed Y, Macdonald H, Reed K, Naylor P-J, Liu-Ambrase T, McKay H. School-based physical activity does not compromise children's academic performance. Medicine & Science in Sports & Exercise 2007;39(1):371-6. [DOI] [PubMed] [Google Scholar]
- Naylor PJ, Macdonald HM, Warburton DE, Reed KE, McKay HA. An active school model to promote physical activity in elementary schools: Action Schools! BC. British Journal of Sports Medicine 2008;42(5):338-43. [DOI] [PubMed] [Google Scholar]
- Reed KE, Warburton DE, Macdonald HM, Naylor PJ, McKay HA. Action Schools! BC: a school-based physical activity intervention designed to decrease cardiovascular disease risk factors in children. Preventive Medicine 2008;46(6):525-31. [DOI] [PubMed] [Google Scholar]
Resaland 2016 {published data only}
- Aadland KN, Moe VF, Aadland E, Anderssen SA, Resaland GK, Ommundsen Y. Relationships between physical activity, sedentary time, aerobic fitness, motor skills and executive function and academic performance in children. Mental Health and Physical Activity 2017;12:10-8. [Google Scholar]
- Aadland KN, Ommundsen Y, Aadland Y, Brønnick KS, Lervåg A, Resaland GK, et al. Executive functions do not mediate prospective relations between indices of physical activity and academic performance: ahe Active Smarter Kids (ASK) Study. Frontiers in Psychology 2017;8:1088. [DOI] [PMC free article] [PubMed] [Google Scholar]
- Aadland KN, Ommundsen Y, Anderssen SA, Brønnick KS, Moe VF, Resaland GK, et al. Effects of the Active Smarter Kids (ASK) physical activity school-based intervention on executive functions: a cluster-randomized controlled trial. Scandinavian Journal of Educational Research 2017;63(2):214-28. [Google Scholar]
- Andersen JR, Natvig GK, Aadland E, Moe VF, Kolotkin RL, Anderssen SA, et al. Associations between health-related quality of life, cardiorespiratory fitness, muscle strength, physical activity and waist circumference in 10-year-old children: the ASK study. Quality of Life Research 2017;26(12):3421-8. [DOI] [PubMed] [Google Scholar]
- Resaland GK, Aadlamd E, Moe VF, Kolotkin RL, Anderssen SA, Andersen JR. Effects of a physical activity intervention on schoolchildren's health-related quality of life: the Active Smarter Kids (ASK) cluster-randomized controlled trial. Preventive Medicine Reports 2019;13:1‐4. [DOI] [PMC free article] [PubMed] [Google Scholar]
- Resaland GK, Aadland E, Moe VF, Aadland KN, Skrede T, Stavnsbo M, et al. Effects of physical activity on schoolchildren's academic performance: the Active Smarter Kids (ASK) cluster-randomized controlled trial. Preventive Medicine 2016;91:322-8. [DOI] [PubMed] [Google Scholar]
- Resaland GK, Moe VF, Aadland E, Steene-Johannessen J, Glosvik Ø, Andersen JR, et al, on behalf of the ASK Study Group. Active Smarter Kids (ASK): rationale and design of a cluster-randomized controlled trial investigating the effects of daily physical activity on children’s academic performance and risk factors for non-communicable diseases. BMC Public Health 2015;15:709. [DOI] [PMC free article] [PubMed] [Google Scholar]
- Resaland GK, Moe VF, Aadland E, Steene-Johannessen J, Glosvik O, Andersen JR, et al. Active Smarter Kids (ASK): rationale and design of a cluster-randomized controlled trial investigating the effects of daily physical activity on children’s academic performance and risk factors for non-communicable diseases. BMC Public Health 2015;15:709. [DOI] [PMC free article] [PubMed] [Google Scholar]
- Resaland GK, Moe VF, Bartholomew JB, Andersen LB, McKay HA, Anderssen SA, et al. Gender-specific effects of physical activity on children's academic performance: the Active Smarter Kids cluster randomized controlled trial. Preventive Medicine 2018;106:171-6. [DOI] [PubMed] [Google Scholar]
- Skrede T, Stavnsbo M, Aadland E, Aadland KN, Anderssen SA, Resaland GK, et al. Moderate-to-vigorous physical activity, but not sedentary time, predicts changes in cardiometabolic risk factors in 10-y-old children: the Active Smarter Kids Study. American Journal of Clinical Nutrition 2017;105:1391-8. [DOI] [PubMed] [Google Scholar]
- Stavnsbo M, Aadland E, Anderssen SA, Chinapaw M, Steene-Johannessen J, Andersen LB, et al. Effects of the Active Smarter Kids (ASK) physical activity intervention on cardiometabolic risk factors in children: a cluster-randomized controlled trial. Preventive Medicine 2019;130:105868. [DOI] [PubMed] [Google Scholar]
Robbins 2018 {published data only}
- da Cruz K. Effects of a randomized trial after-school physical activity club on the math achievement and executive functioning of girls [Doctorate thesis]. East Lansing (USA): Michigan State University School Psychology, 2017. [Google Scholar]
- Pfeiffer KA, Robbins LB, Ling J, Sharma DB, Dalimonte-Merckling DM, Voskuil VR, et al. Effects of the Girls on the Move randomized trial on adiposity and aerobic performance (secondary outcomes) in low-income adolescent girls. Pediatric Obesity 2019;14(11):e12559. [DOI] [PMC free article] [PubMed] [Google Scholar]
- Robbins LB, Ling J, Sharma DB, Dalimonte-Merckling DM, Voskuil VR, Resnicow K, et al. Intervention effects of "Girls on the Move" on increasing physical activity: a group randomized trial. Annals of Behavioral Medicine 2019;53(5):493-500. [DOI] [PMC free article] [PubMed] [Google Scholar]
- Robbins LB, Ling J, Toruner EK, Bourne KA, Pfeiffer KA. Examining reach, dose, and fidelity of the "Girls on the Move" after-school physical activity club: a process evaluation. BMC Public Health 2016;16:671. [DOI] [PMC free article] [PubMed] [Google Scholar]
- Robbins LB, Pfeiffer KA, Vermeesch A, Resnicow K, You Z, An L, et al. "Girls on the Move" intervention protocol for increasing physical activity among low-active underserved urban girls: a group randomized trial. BMC Public Health 2013;13:474. [DOI] [PMC free article] [PubMed] [Google Scholar]
- Robbins LB, Wen F, Ling J. Mediators of physical activity behavior change in the "Girls on the Move" intervention. Nursing Research 2019;68(4):257-66. [DOI] [PMC free article] [PubMed] [Google Scholar]
Sacchetti 2013 {published data only}
- Sacchetti R, Ceciliani A, Garulli A, Dallolio L, Beltrami P, Leoni E. Effects of a 2-year school-based intervention of enhanced physical education in the primary school. Journal of School Health 2013;83(9):639-46. [DOI] [PubMed] [Google Scholar]
Salmon 2008 {published data only}
- Salmon J, Ball K, Crawford D, Booth M, Telford A, Hume C, et al. Reducing sedentary behaviour and increasing physical activity among 10-year-old children: overview and process evaluation of the 'Switch-Play' intervention. Health Promotion International 2005;20(1):7-17. [DOI] [PubMed] [Google Scholar]
- Salmon J, Ball K, Hume C, Booth M, Crawford D. Outcomes of a group-randomized trial to prevent excess weight gain, reduce screen behaviours and promote physical activity in 10-year-old children: Switch-Play. International Journal of Obesity 2008;32:601-12. [DOI] [PubMed] [Google Scholar]
Santos 2014 {published data only}
- Santos RG, Durksen A, Rabbanni R, Chanoine JP, Miln AL, Mayer T, et al. Effectiveness of peer-based healthy living lesson plans on anthropometric measures and physical activity in elementary school students: a cluster randomized trial. JAMA Pediatrics 2014;168(4):330-7. [DOI] [PubMed] [Google Scholar]
- Stock S, Miranda C, Evans S, Plessis S, Ridley J, Yeh S, et al. Healthy Buddies: a novel, peer-led health promotion program for the prevention of obesity and eating disorders in children in elementary school. Pediatrics 2007;120(4):e1059-68. [DOI] [PubMed] [Google Scholar]
Seibert 2019 {published data only}
- Seibert T, Allen DB, Eickhoff JC, Carrel AL. US Centers for Disease Control and Prevention-based physical activity recommendations do not improve fitness in real-world settings. Journal of School Health 2019;89(3):159-64. [DOI] [PMC free article] [PubMed] [Google Scholar]
Seljebotn 2019 {published data only}
- Dyrstad SM, Kvalo SE, Alstveit M, Skage I. Physically active academic lessons: acceptance, barriers and facilitators for implementation. BMC Public Health 2018;18(1):322. [DOI] [PMC free article] [PubMed] [Google Scholar]
- Kvalo S, Bru E, Bronnick K, Dyrstad SM. Does increased physical activity in school affect children's executive function and aerobic fitness? Scandinavian Journal of Medicine & Science in Sports 2017;27(12):1833-41. [DOI] [PubMed] [Google Scholar]
- Seljebotn PH, Skage I, Riskedal A, Olsen M, Kvalø SE, Dyrstad SM. Physically active academic lessons and effect on physical activity and aerobic fitness. The Active School study: a cluster randomized controlled trial. Preventive Medicine Reports 2019;13:183-8. [DOI] [PMC free article] [PubMed] [Google Scholar]
Siegrist 2013 {published data only}
- Siegrist M, Lammel C, Haller B, Christle J, Halle M. Effects of a physical education program on physical activity, fitness, and health in children: the JuvenTUM project. Scandinavian Journal of Medicine & Science in Sports 2013;23(3):323-30. [DOI] [PubMed] [Google Scholar]
Siegrist 2018 {published data only}
- Siegrist M, Hanssen H, Lammel C, Haller B, Halle M. A cluster randomised school-based lifestyle intervention programme for the prevention of childhood obesity and related early cardiovascular disease (JuvenTUM 3). BMC Public Health 2011;11:258. [DOI] [PMC free article] [PubMed] [Google Scholar]
- Siegrist M, Hanssen H, Lammel C, Haller B, Koch AM, Stemp P, et al. Effects of a cluster-randomized school-based prevention program on physical activity and microvascular function (JuvenTUM 3). Atherosclerosis 2018;278:73-81. [DOI] [PubMed] [Google Scholar]
Simon 2004 {published data only}
- Simon C, Schweitzer B, Oujaa M, Wagner A, Arveiler D, Triby E, et al. Successful overweight prevention in adolescents by increasing physical activity: a 4-year randomized controlled intervention. [Erratum appears in International Journal of Obesity 2008;32(10):1606]. International Journal of Obesity 2008;32(10):1489-98. [DOI] [PubMed] [Google Scholar]
- Simon C, Wagner A, DiVita C, Rauscher E, Klein-Platat C, Arveiler D, et al. Intervention centred on adolescents' physical activity and sedentary behaviour (ICAPS): concept and 6-month results. International Journal of Obesity & Related Metabolic Disorders 2004;28(Suppl 3):S96-103. [DOI] [PubMed] [Google Scholar]
- Simon C, Wagner A, Platat C, Arveiler D, Schweitzer B, Schlienger JL, et al. ICAPS: a multilevel program to improve physical activity in adolescents. Diabetes & Metabolism 2006;32(1):41-9. [DOI] [PubMed] [Google Scholar]
Stone 2003 {published data only}
- Caballero B, Clay T, Davis SM, Ethelbah B, Rock BH, Lohman T, et al. Pathways: a school-based, randomized controlled trial for the prevention of obesity in American Indian school children. American Journal of Clinical Nutrition 2003;78(5):1030-8. [DOI] [PMC free article] [PubMed] [Google Scholar]
- Caballero B, Clay TE, Davis SM, Ethelbah R, Holyrock B, Lohman TG, et al. The Pathways obesity prevention study: overview of design and measurements. FASEB Journal 2001;15(5):A1091. [Google Scholar]
- Caballero B, Davis SM, Davis CE, Ethelbah R, Evans MA, Lohman TG, et al. Pathways: a school-based program for the primary prevention of obesity in American Indian children. Journal of Nutritional Biochemistry 1998;9(9):535-43. [DOI] [PMC free article] [PubMed] [Google Scholar]
- Davis CE, Hunsberger S, Murray DM, Fabsitz RR, Himes JH, Stephenson LK, et al. Design and statistical analysis for the Pathways study. American Journal of Clinical Nutrition 1999;69(4 Suppl):S760-3. [DOI] [PubMed] [Google Scholar]
- Davis SM. Pathways curriculum and family interventions to promote healthful eating and physical activity in American Indian schoolchildren. Preventive Medicine 2003;37(6 Pt 2):S24-34. [DOI] [PMC free article] [PubMed] [Google Scholar]
- Steckler A, Ethelbah B, Martin CJ, Stewart D, Pardilla M, Gittelsohn J, et al. Pathways process evaluation results: a school-based prevention trial to promote healthful diet and physical activity in American Indian third, fourth, and fifth grade students. Preventive Medicine 2003;37(6 part 2):S80-90. [DOI] [PubMed] [Google Scholar]
- Stevens J. The impact of the Pathways intervention on psychosocial variables related to diet and physical activity in American Indian school children. Preventive Medicine 2003;37(6 Pt 2):S70-9. [DOI] [PubMed] [Google Scholar]
- Stone EJ, Norman JE, Davis SM, Stewart D, Clay TE, Caballero B, et al. Design, implementation, and quality control in the Pathways American-Indian multicenter trial. Preventive Medicine 2003;37(Suppl):S13-23. [DOI] [PMC free article] [PubMed] [Google Scholar]
- Teufel N, Perry CL, Story M, Flint-Wagner HG, Levin S, Clay TE, et al. Pathways family intervention for third-grade American Indian children. American Journal of Clinical Nutrition 1999;69(4 Suppl):S803-9. [DOI] [PMC free article] [PubMed] [Google Scholar]
Suchert 2015 {published data only}
- Isensee B, Suchert V, Hansen J, Weisser B, Hanewinkel R. Effects of a school-based pedometer intervention in adolescents: 1-year follow-up of a cluster-randomized controlled trial. Journal of School Health 2018;88(10):717-24. [DOI] [PubMed] [Google Scholar]
- Suchert V, Hanewinkel R, Isensee B, Lauft Study Group. Sedentary behavior, depressed affect, and indicators of mental well-being in adolescence: does the screen only matter for girls? Journal of Adolescence 2015;42:50-8. [DOI] [PubMed] [Google Scholar]
- Suchert V, Hanewinkel R, Isensee B. Longitudinal relationships of fitness, physical activity, and weight status with academic achievement in adolescents. Journal of School Health 2016;86(10):734-41. [DOI] [PubMed] [Google Scholar]
- Suchert V, Hanewinkel R, Isensee B. Screen time, weight status and the self-concept of physical attractiveness in adolescents. Journal of Adolescence 2016;48:11e17. [DOI] [PubMed] [Google Scholar]
- Suchert V, Isensee B, Hansen J, Johannsen M, Krieger C, Müller K, et al. “Läuft.” - a school-based multi-component program to establish a physically active lifestyle in adolescence: study protocol for a cluster-randomized controlled trial. Trials 2013;14(1):416. [DOI] [PMC free article] [PubMed] [Google Scholar]
- Suchert V, Isensee B, Sargent J, Weisser B, Hanewinkel R. Prospective effects of pedometer use and class competitions on physical activity in youth: a cluster-randomized controlled trial. Preventive Medicine 2015;81:399-404. [DOI] [PubMed] [Google Scholar]
- Suchert V, Steinvoord K, Schwarz J, Isensee B, Krieger C. Motivational aspects and critical issues of a pedometer intervention in adolescents. Health Promotion Practice 2018;19(1):60-7. [DOI] [PubMed] [Google Scholar]
Sutherland 2016 {published data only}
- Hollis JL, Campbell R, Morgan L, Lubans P, Nathan D, Wolfenden N, et al. A socio-ecologically framed, school-based physical activity intervention has beneficial effects on obesity outcomes in adolescents from low SES communities: the PA4E1 RCT. Obesity Facts 2015;8:110. [Google Scholar]
- Hollis JL, Sutherland R, Campbell L, Morgan PJ, Lubans DR, Nathan N, et al. Effects of a 'school-based' physical activity intervention on adiposity in adolescents from economically disadvantaged communities: secondary outcomes of the 'Physical Activity 4 Everyone' RCT. International Journal of Obesity 2016;40(10):1486-93. [DOI] [PMC free article] [PubMed] [Google Scholar]
- Mclaughlin M, Duff J, Sutherland R, Campbell E, Wolfenden L, Wiggers J. Protocol for a mixed methods process evaluation of a hybrid implementation-effectiveness trial of a scaled-up whole-school physical activity program for adolescents: Physical Activity 4 Everyone (PA4E1). Trials 2020;21:268. [DOI] [PMC free article] [PubMed] [Google Scholar]
- Sutherland R, Campbell E, Lubans DR, Morgan PJ, Okely AD, Nathan N, et al. 'Physical Activity 4 Everyone' school-based intervention to prevent decline in adolescent physical activity levels: 12 month (mid-intervention) report on a cluster randomised trial. British Journal of Sports Medicine 2016;50(8):488-95. [DOI] [PMC free article] [PubMed] [Google Scholar]
- Sutherland R, Campbell E, Lubans DR, Morgan PJ, Okely AD, Nathan N, et al. A cluster randomised trial of a school-based intervention to prevent decline in adolescent physical activity levels: study protocol for the 'Physical Activity 4 Everyone' trial. BMC Public Health 2013;13:57. [DOI] [PMC free article] [PubMed] [Google Scholar]
- Sutherland R, Reeves P, Campbell E, Lubans DR, Morgan PJ, Nathan N, et al. Cost effectiveness of a multi-component school-based physical activity intervention targeting adolescents: the 'Physical Activity 4 Everyone' cluster randomized trial. International Journal of Behavioral Nutrition and Physical Activity 2016;13:94. [DOI] [PMC free article] [PubMed] [Google Scholar]
- Sutherland RL, Campbell EM, Lubans DR, Morgan PJ, Nathan NK, Wolfenden L, et al. The Physical Activity 4 Everyone cluster randomized trial: 2-year outcomes of a school physical activity intervention among adolescents. American Journal of Preventive Medicine 2016;51(2):195-205. [DOI] [PubMed] [Google Scholar]
Sutherland 2017 {published data only}
- Sutherland RL, Nathan NK, Lubans DR, Cohen K, Davies LJ, Desmet C, et al. An RCT to facilitate implementation of school practices known to increase physical activity. American Journal of Preventive Medicine 2017;53(6):818-28. [DOI] [PubMed] [Google Scholar]
Tarp 2016 {published data only}
- Bugge A, Tarp J, Østergaard L, Domazet SL, Andersen LB, Froberg K. LCoMotion – Learning, Cognition and Motion; a multicomponent cluster randomized school-based intervention aimed at increasing learning and cognition - rationale, design and methods. BMC Public Health 2014;14:967. [DOI] [PMC free article] [PubMed] [Google Scholar]
- Tarp J, Domazet SL, Froberg K, Hillman CH, Andersen LB, Bugge A. Effectiveness of a school-based physical activity intervention on cognitive performance in Danish adolescents: LCoMotion-Learning, Cognition and Motion - a cluster randomized controlled trial. PLoS One 2016;11(6):e0158087. [DOI] [PMC free article] [PubMed] [Google Scholar]
Ten Hoor 2018 {published data only}
- Ten Hoor GA, Rutten GM, Van Breukelen GVP, Kok G, Ruiter RAC, Meijer K, et al. Strength exercises during physical education classes in secondary schools improve body composition: a cluster randomized controlled trial. International Journal of Behavioral Nutrition and Physical Activity 2018;15(1):92. [DOI] [PMC free article] [PubMed] [Google Scholar]
Thivel 2011 {published data only}
- Thivel D, Isacco L, Lazaar N, Aucouturier J, Ratel S, Dore E, et al. Effect of a 6-month school-based physical activity program on body composition and physical fitness in lean and obese schoolchildren. European Journal of Pediatrics 2011;170(11):1435-43. [DOI] [PubMed] [Google Scholar]
Toftager 2014 {published data only}
- Christiansen LB, Toftager M, Boyle E, Kristensen PL, Troelsen J. Effect of a school environment intervention on adolescent adiposity and physical fitness. Scandinavian Journal of Medicine & Science in Sports 2013;23:e381-9. [DOI] [PubMed] [Google Scholar]
- Christiansen LB, Toftager M, Ersbøll AK, Troelsen J. Effects of a Danish multicomponent physical activity intervention on active school transport. Journal of Transport and Health 2014;1:174-81. [Google Scholar]
- Christiansen LB, Toftager M, Pawlowski CS, Andersen HB, Ersbøll AK, Troelsen J. Schoolyard upgrade in a randomized controlled study design - how are school interventions associated with adolescents’ perception of opportunities and recess physical activity. Health Education Research 2017;32(1):58-68. [DOI] [PMC free article] [PubMed] [Google Scholar]
- Toftager M, Christiansen LB, Ersboll AK, Kristensen PL, Due P, Troelsen J. Intervention effects on adolescent physical activity in the multicomponent SPACE study: a cluster randomized controlled trial. PLoS One 2014;9(6):e99369. [DOI] [PMC free article] [PubMed] [Google Scholar]
- Toftager M, Christiansen LB, Kristensen PL, Troelsen J. SPACE for physical activity - a multicomponent intervention study: study design and baseline findings from a cluster randomized controlled trial. BMC Public Health 2011;11:777. [DOI] [PMC free article] [PubMed] [Google Scholar]
Torbeyns 2017 {published data only}
- Torbeyns T, Geus B, Bailey S, Decroix L, Van Cutsem J, De Pauw K, et al. Bike desks in the classroom: energy expenditure, physical health, cognitive performance, brain functioning, and academic performance. Journal of Physical Activity & Health 2017;14(6):429-39. [DOI] [PubMed] [Google Scholar]
Trevino 2004 {published data only}
- Trevino RP, Yin Z, Hernandez A, Hale DE, Garcia OA, Mobley C. Impact of the Bienestar school-based diabetes mellitus prevention program on fasting capillary glucose levels: a randomized controlled trial. Archives of Pediatrics & Adolescent Medicine 2004;158(9):911-7. [DOI] [PMC free article] [PubMed] [Google Scholar]
Walter 1988 {published data only}
- Walter HJ, Hofman A, Barrett LT, Connelly PA, Kost KL, Walk EH, et al. Primary prevention of cardiovascular disease among children: three year results of a randomized intervention trial. In: Hetzel B, Berenson GS, editors(s). Cardiovascular Risk Factors in Childhood: Epidemiology and Prevention. Amsterdam: Elsevier Science Publishers B.V. (Biomedical Division), 1987:161-81. [Google Scholar]
- Walter HJ, Hofman A, Connelly PA, Barrett LT, Kost KL. Coronary heart disease prevention in childhood: one-year results of a randomized intervention study. American Journal of Preventive Medicine 1986;2(4):239-45. [PubMed] [Google Scholar]
- Walter HJ, Hofman A, Connelly PA, Barrett LT, Kost KL. Primary prevention of chronic disease in childhood: changes in risk factors after one year of intervention. American Journal of Epidemiology 1985;122(5):772-81. [DOI] [PubMed] [Google Scholar]
- Walter HJ, Hofman A, Vaughan RD, Wynder EL. Modification of risk factors for coronary heart disease: five-year results of a school-based intervention trial. New England Journal of Medicine 1988;318(17):1093-100. [DOI] [PubMed] [Google Scholar]
- Walter HJ, Wynder EL. The development, implementation, evaluation and future directions of a chronic disease prevention program for children: the "know your body" studies. Preventive Medicine 1989;18(1):59-71. [DOI] [PubMed] [Google Scholar]
Walther 2009 {published data only}
- Walther C, Gaede L, Adams V, Gelbrich G, Leichtle A, Erbs S, et al. Effect of increased exercise in school children on physical fitness and endothelial progenitor cells: a prospective randomized trial. Circulation 2009;120(22):2251-9. [DOI] [PubMed] [Google Scholar]
Wang 2008 {published data only}
- Gutin B, Yin Z, Johnson M, Barbeau P. Preliminary findings of the effect of a 3-year after-school physical activity intervention on fitness and body fat: the Medical College of Georgia Fitkid Project. International Journal of Pediatric Obesity 2008;3:3-9. [DOI] [PubMed] [Google Scholar]
- Wang LY, Gutin B, Barbeau P, Moore J, Hanes J, Johnson M, et al. Cost-effectiveness of a school-based obesity prevention program. Journal of School Health 2008;78(12):619-24. [DOI] [PubMed] [Google Scholar]
- Yin Z, Gutin B, Johnson MB, Hanes J, Moore JB, Cavnar M, et al. An environmental approach to obesity prevention in children: Medical College of Georgia FitKid project year 1 results. Obesity Research 2005;13(12):2153-61. [DOI] [PubMed] [Google Scholar]
- Yin Z, Hanes J, Moore JB, Humbles P, Barbeau P, Gutin B. An after-school physical activity program for obesity prevention in children: the Medical College of Georgia FitKid project. Evaluation & The Health Professions 2005;28(1):67-89. [DOI] [PubMed] [Google Scholar]
- Yin Z, Moore JB, Johnson MH, Barbeau P, Cavnar M, Thornburg J, Gutin B. The Medical College of Georgia Fitkid project: the relations between program attendance and changes in outcomes in year 1. International Journal of Obesity 2005;Suppl 2:S40-5. [DOI] [PubMed] [Google Scholar]
Webber 2008 {published data only}
- Elder JP, Lytle L, Sallis JF, Young DR, Steckler A, Simons-Morton D. A description of the social–ecological framework used in the Trial of Activity for adolescent Girls (TAAG). Health Education Research 2007;22(2):155-65. [DOI] [PMC free article] [PubMed] [Google Scholar]
- Elder JP, Shuler L, Moe SG, Grieser M, Pratt C, Cameron S, et al. Recruiting a diverse group of middle school girls Into the trial of activity for adolescent girls. Journal of School Health 2008;78(10):523-31. [DOI] [PMC free article] [PubMed] [Google Scholar]
- Lytle LA, Murray DM, Evenson KR, Moody J, Pratt CA, Metcalfe L, et al. Mediators affecting girls' levels of physical activity outside of school: findings from the Trial of Activity in Adolescent Girls. Annals of Behavioral Medicine 2009;38(2):124-36. [DOI] [PMC free article] [PubMed] [Google Scholar]
- McKenzie TL, Catellier DJ, Conway T, Lytle LA, Grieser M, Webber LA, et al. Girls' activity levels and lesson contexts in middle school physical education: TAAG baseline. Medicine and Science in Sports and Exercise 2006;38(7):1229-35. [DOI] [PMC free article] [PubMed] [Google Scholar]
- Moe SG, Pickrel J, McKenzie TL, Strikmiller PK, Coombs D, Murrie D. Using school-level interviews to develop a multisite PE intervention program. Health Education & Behavior 2006;33:52-65. [DOI] [PMC free article] [PubMed] [Google Scholar]
- Saunders RP, Moody J. Community agency survey formative research results from the TAAG study. Health Education & Behavior 2006;33(1):12-24. [DOI] [PMC free article] [PubMed] [Google Scholar]
- Stevens J, Murray DM, Catellier DJ, Hannan PJ, Lytele LA, Elder JP, et al. Design of the Trial of Activity in Adolescent Girls (TAAG). Contemporary Clinical Trials 2005;26:223-33. [DOI] [PMC free article] [PubMed] [Google Scholar]
- Webber LS, Catellier DJ, Lytle LA, Murray DM, Pratt CA, Young DR, et al. Outcomes of a randomized controlled field trial to promote physical activity in middle-school girls: Trial of Activity for Adolescent Girls. Circulation 2007;115(8):e221. [Google Scholar]
- Webber LS, Catellier DJ, Lytle LA, Murray DM, Pratt CA, Young DR, et al. Promoting physical activity in middle school girls: Trial of Activity for Adolescent Girls. American Journal of Preventive Medicine 2008;34(3):173-84. [DOI] [PMC free article] [PubMed] [Google Scholar]
- Young DR, Felton GM, Grieser M, Elder J, Johnson C, Lee J, et al. Policies and opportunities for physical activity in middle school environments. Journal of School Health 2007;77(1):41-7. [DOI] [PMC free article] [PubMed] [Google Scholar]
- Young DR, Johnson CC, Steckler A, Gittelsohn J, Saunders RP, Saksvig BI, et al. Data to action: using formative research to develop intervention programs to increase physical activity in adolescent girls. Health Education & Behavior 2006;33:97-111. [DOI] [PMC free article] [PubMed] [Google Scholar]
- Young DR, Steckler A, Cohen S, Pratt C, Felton G, Moe SG, et al. Process evaluation results from a school- and community-linked intervention: the Trial of Activity for Adolescent Girls (TAAG). Health Education Research 2008;23(6):976-86. [DOI] [PMC free article] [PubMed] [Google Scholar]
Weeks 2008 {published data only}
- Weeks BK, Young CM, Beck BR. Eight months of regular in-school jumping improves indices of bone strength in adolescent boys and girls: the POWER PE study. Journal of Bone & Mineral Research 2008;23(7):1002-11. [DOI] [PubMed] [Google Scholar]
Williamson 2007 {published data only}
- Williamson DA, Copeland AL, Anton SD, Champagne C, Han H, Lewis L, et al. Wise Mind project: a school-based environmental approach for preventing weight gain in children. Obesity 2007;15(4):906-17. [DOI] [PubMed] [Google Scholar]
Wilson 2011 {published data only}
- Wilson DK, Van Horn ML, Kitzman-Ulrich H, Saunders R, Pate R, Lawman HG, et al. Results of the "Active by Choice Today" (ACT) randomized trial for increasing physical activity in low-income and minority adolescents. Health Psychology 2011;30(4):463-71. [DOI] [PMC free article] [PubMed] [Google Scholar]
Young 2006 {published data only}
- Young DR, Phillips JA, Yu T, Haythornthwaite JA. Effects of a life skills intervention for increasing physical activity in adolescent girls. Archives of Pediatrics and Adolescent Medicine 2006;160(12):1255-61. [DOI] [PubMed] [Google Scholar]
Zhou 2019 {published data only}ChiCTR‐IOR‐14005388
- Zhou Z, Dong S, Yin J, Fu Q, Ren H, Yin Z. Improving physical fitness and cognitive functions in middle school students: study protocol for the Chinese Childhood Health, Activity and Motor Performance Study (Chinese CHAMPS). International Journal of Environmental Research and Public Health 2018;15(5):E976. [DOI] [PMC free article] [PubMed] [Google Scholar]
- Zhou Z, Li S, Yin J, Fu Q, Ren H, Jin T, et al. Impact on physical fitness of the Chinese CHAMPS: a cluster randomised controlled trial. International Journal of Environmental Research and Public Health 2019;16:4412. [DOI] [PMC free article] [PubMed] [Google Scholar]
References to studies excluded from this review
Abdukić 2015 {published data only}
- Abdukić M. Effects of programmed physical activity on body fat and BMI in female high school students. Homo Sporticus 2015;17(2):20-4. [Google Scholar]
Aceves‐Martins 2017 {published data only}
- Aceves-Martins M, Llaurado E, Tarro L, Morina D, Papell-Garcia I, Prades-Tena J, et al. A school-based, peer-led, social marketing intervention to engage Spanish adolescents in a healthy lifestyle ("We are cool"-som la pera study): a parallel-cluster randomized controlled study. Childhood Obesity 2017;13(4):300-13. [DOI] [PubMed] [Google Scholar]
ACTRN12619000091101 {published data only}
- A school-based intervention to promote physical activity among adolescents. 2019. http://www.who.int/trialsearch/Trial2.aspx?TrialID=ACTRN12619000091101.
ACTRN12619000431123 {published data only}
- A technology-based program to promote healthy lifestyles among secondary school students. 2019. http://www.who.int/trialsearch/Trial2.aspx?TrialID=ACTRN12619000431123.
ACTRN12619000457145 {published data only}
- Work-HIIT: a time efficient work-place physical activity program. WHO International Clinical Trials Registry Platform 2019. [ACTRN12619000457145]
ACTRN12619000766112 {published data only}
- Kick-Smart: promoting academic achievement, fitness and well-being in primary school-aged children. 2019. http://www.who.int/trialsearch/Trial2.aspx?TrialID=ACTRN12619000766112.
ACTRN12619000854134 {published data only}
- The effectiveness of integrating unstructured play activities into school-based curriculum with mindfulness-based intervention on improving children's physical, social and emotional wellbeing: a cluster randomized controlled trial. 2019. http://www.who.int/trialsearch/Trial2.aspx?TrialID=ACTRN12619000854134.
ACTRN12619001229167 {published data only}
- Preparing an effective school-based physical activity implementation strategy for scale-up: a randomized noninferiority trial. WHO International Clinical Trials Registry Platform 2019. [ACTRN12619001229167]
Adab 2014 {published data only}ISRCTN51016370
- Adab P, Pallan MJ, Cade J, Ekelund U, Barrett T, Daley A, et al. Preventing childhood obesity, phase II feasibility study focusing on South Asians: BEACHeS. BMJ Open 2014;4(4):e004579. [DOI] [PMC free article] [PubMed] [Google Scholar]
Adkins 2017 {published data only}
- Adkins M, Bice MR, Heelan K, Ball J. Enhancing physical education with a supplemental physical activity program. Journal of Physical Education Recreation and Dance 2017;88(8):28-34. [Google Scholar]
Adsiz 2012 {published data only}
- Adsiz E, Dorak F, Ozsaker M, Vurgun N. The influence of physical activity on attention in Turkish children. Healthmed 2012;6(4):1384-9. [Google Scholar]
Agurto 2018 {published data only}
- Agurto KP, Carrasco-Alarcon V, Salazar CM. Efficacy of a high-intensity interval training program in corporal variables modification on preadolescent schoolchildren of a school in the city of Temuco, Chile. Revista Espanola de Nutricion Humana y Dietetica 2018;22(2):149-56. [Google Scholar]
Aittasalo 2019 {published data only}
- Aittasalo M, Jussila AM, Tokola K, Sievanen H, Vaha-Ypya H, Vasankari T. Kids Out: evaluation of a brief multimodal cluster randomized intervention integrated in health education lessons to increase physical activity and reduce sedentary behavior among eighth graders. BMC Public Health 2019;19(1):415. [DOI] [PMC free article] [PubMed] [Google Scholar]
Akdemir 2017 {published data only}
- Akdemir M, Donmez L, Polat H. The effect of nutritional and physical activity interventions on nutritional status and obesity in primary school children: a cluster randomized controlled study. Kuwait Medical Journal 2017;49(2):105-13. [Google Scholar]
Aleksić 2013 {published data only}
- Aleksić D, Stanković S, Milenković V, Lilić L. The examination of the effects of the rhythmic teaching of physical education on speed of 9-10 years old girls [Efekat primene elemenata ritmiäœke gimnastike na razvoj brzine kod devojäœica starosti 9 i 10 godina.]. Sport Mont 2013;37:426-31. [Google Scholar]
- Aleksić D, Stanković S, Milenkovic V. Examination of effects of rhythmic gymnastics on balance development at the school classes of young elementary school female pupils. Sport Mont 2013;37:432-5. [Google Scholar]
Alexander 2014 {published data only}
- Alexander A, Grant WL, Pedrino KJ, Lyons PE. A prospective multifactorial intervention on subpopulations of predominately Hispanic children at high risk for obesity. Obesity 2014;22(1):249-53. [DOI] [PubMed] [Google Scholar]
Alievi 2019 {published data only}
- Alievi MM, Santin DRC, Portal TP, Campos P. P6140 Health education program at the “happy life, healthy heart” school: a randomized clinical trial. European Heart Journal 2019;40:3752. [Google Scholar]
Allara 2018 {published data only}
- Allara E, Angelini P, Gorini G, Bosi S, Carreras G, Gozzi C, et al. A prevention program for multiple health-compromising behaviors in adolescence: baseline results from a cluster randomized controlled trial. Preventive Medicine 2015;71:20-6. [DOI] [PubMed] [Google Scholar]
- Allara E, Beccaria F, Molinar R, Marinaro L, Ermacora A, Coppo A, Diario della Salute Evaluation Support Team. A school‑based program to promote well‑being in preadolescents: results from a cluster quasi‑experimental controlled study. Journal of Primary Prevention 2019;40(2):151-80. [DOI] [PMC free article] [PubMed] [Google Scholar]
Almas 2013 {published data only}
- Almas A, Islam M, Jafar TH. School based physical activity program in adolescent girls (9-11 years); a feasibility trial in Karachi, Pakistan. In: Circulation. Vol. 125. 2012:E707.
- Almas A, Islam M, Jafar TH. School-based physical activity programme in preadolescent girls (9-11 years): a feasibility trial in Karachi, Pakistan. Archives of Disease in Childhood 2013;98(7):515-9. [DOI] [PubMed] [Google Scholar]
Androutsos 2014 {published data only}
- Androutsos O, Katsarou C, Payr A, Birnbaum J, Geyer C, Wildgruber A, et al. Designing and implementing teachers' training sessions in a kindergarten-based, family-involved intervention to prevent obesity in early childhood. The ToyBox-study. Obesity Reviews 2014;15 Suppl 3:48-52. [DOI] [PubMed] [Google Scholar]
Annesi 2017 {published data only}
- Annesi JJ, Vaughn LL. Evidence-based referral: effects of the revised "Youth Fit 4 Life" protocol on physical activity outputs. Permanente Journal 2015;19(3):48-53. [DOI] [PMC free article] [PubMed] [Google Scholar]
- Annesi JJ, Walsh SM, Greenwood BL, Mareno N, Unruh-Rewkowski JL. Effects of the Youth Fit 4 Life physical activity/nutrition protocol on body mass index, fitness and targeted social cognitive theory variables in 9- to 12-year-olds during after-school care. Journal of Paediatrics and Child Health 2017;53(4):365-73. [DOI] [PubMed] [Google Scholar]
Anselma 2019 {published data only}
- Anselma M, Altenburg T, Chinapaw M. Kids in Action: the protocol of a Youth Participatory Action Research project to promote physical activity and dietary behaviour. BMJ Open 2019;9(3):e025584. [DOI] [PMC free article] [PubMed] [Google Scholar]
Araujo‐Soares 2009a {published data only}
- Araujo-Soares V, McIntyre T, MacLennan G, Sniehotta FF. Development and exploratory cluster-randomised opportunistic trial of a theory-based intervention to enhance physical activity among adolescents. Psychology & Health 2009;24(7):805-22. [DOI] [PubMed] [Google Scholar]
Ardic 2017 {published data only}
- Ardic A, Erdogan S. The effectiveness of the COPE healthy lifestyles TEEN program: a school-based intervention in middle school adolescents with 12-month follow-up. Journal of Advanced Nursing 2017;73(6):1377-89. [DOI] [PubMed] [Google Scholar]
Arlinghaus 2017 {published data only}
- Arlinghaus KR, Moreno JP, Reesor L, Hernandez DC, Johnston CA. Companeros: high school students mentor middle school students to address obesity among Hispanic adolescents. Preventing Chronic Disease 2017;14:E92. [DOI] [PMC free article] [PubMed] [Google Scholar]
Armstrong 2016 {published data only}
- Armstrong T, Lee HM, Napper-Owen G. Developing a before-school physical activity club: start with a power-walking program. Journal of Physical Education Recreation and Dance 2016;87(9):42-7. [Google Scholar]
Ashanin 2018 {published data only}
- Ashanin V, Filenko L, Pasko V, Tserkovna O, Filenko I, Poltoratskaya A, et al. Implementation practices of the Rugby-5 into the physical education of schoolchildren 12-13 years old using information technology. Journal of Physical Education and Sport 2018;18(2):762-8. [Google Scholar]
Åvitsland 2020 {published data only}
- Åvitsland A, Ohna SE, Dyrstad SM, Tjomsland HE, Lerum Ø, Leibinger E. The process evaluation of a school-based physical activity intervention: influencing factors and potential consequences of implementation. Health Education 2020;120(2):121-39. [Google Scholar]
Babic 2016 {published data only}
- Babic M, Morgan P, Lonsdale C, Plotnikoff R, Eather N, Skinner G, et al. Intervention to reduce recreational screen-time in adolescents: outcomes and mediators from the 'Switch-off 4 Healthy Minds' (S4HM) cluster randomized controlled trial. In: Journal of Science & Medicine in Sport. Vol. 20. 2017:e5. [DOI] [PubMed]
- Babic MJ, Smith JJ, Morgan PJ, Lonsdale C, Plotnikoff RC, Eather N, et al. Intervention to reduce recreational screen-time in adolescents: outcomes and mediators from the 'Switch-Off 4 Healthy Minds' (S4HM) cluster randomized controlled trial. Preventive Medicine 2016;91:50-7. [ACTRN12614000163606] [DOI] [PubMed] [Google Scholar]
Bacardi‐Gascon 2012 {published data only}
- Bacardi-Gascon M, Perez-Morales ME, Jimenez-Cruz A. A six month randomized school intervention and an 18-month follow-up intervention to prevent childhood obesity in Mexican elementary schools. Nutricion Hospitalaria 2012;27(3):755-62. [DOI] [PubMed] [Google Scholar]
Bailey 2015 {published data only}
- Bailey CG, DiPerna JC. Effects of classroom-based energizers on primary grade students' physical activity levels. Physical Educator 2015;72(3):480-95. [Google Scholar]
Baranowski 2019 {published data only}
- Baranowski T, Baranowski J, Chen T, Buday R, Beltran A, Dadabhoy H, et al. Videogames that encourage healthy behavior did not alter fasting insulin or other diabetes risks in children: randomized clinical trial. Games for Health Journal 2019;8(4):257-64. [DOI] [PMC free article] [PubMed] [Google Scholar]
Barbosa 2015 {published data only}
- Barbosa Filho VC, da Silva KS, Mota J, Beck C, da Silva Lopes A. A physical activity intervention for Brazilian students from low human development index areas: a cluster-randomized controlled trial. Journal of Physical Activity and Health 2016;13:1174-82. [CENTRAL: NCT0243982] [DOI] [PubMed] [Google Scholar]
- Barbosa Filho VC, Lopes AS, Lima AB, Souza EA, Gubert FA, Silva KS, et al. Rationale and methods of a cluster-randomized controlled trial to promote active and healthy lifestyles among Brazilian students: the "Fortaleca sua Saude" program. BMC Public Health 2015;15:1212. [DOI] [PMC free article] [PubMed] [Google Scholar]
- Barbosa VC, da Silva KS, Mota J, Cunha Vieira VF, do Amaral Gubert D, da Silva Lopes A. “For whom was it effective?” Moderators of the effect of a school-based intervention on potential physical activity determinants among Brazilian students. Preventive Medicine 2017;97:80-5. [CENTRAL: NCT02439827] [DOI] [PubMed] [Google Scholar]
Barbosa Filho 2019 {published data only}
- Barbosa Filho VC, Bandeira AD, Minatto G, Linard JG, Silva JA, Costa RM, et al. Effect of a multicomponent intervention on lifestyle factors among Brazilian adolescents from low human development index areas: a cluster-randomized controlled trial. International Journal of Environmental Research and Public Health 2019;16(2):E267. [DOI] [PMC free article] [PubMed] [Google Scholar]
Barr‐Anderson 2012 {published data only}
- Barr-Anderson DJ, Laska MN, Veblen-Mortenson S, Farbakhsh K, Dudovitz B, Story M. A school-based, peer leadership physical activity intervention for 6th graders: feasibility and results of a pilot study. Journal of Physical Activity & Health 2012;9(4):492-9. [DOI] [PMC free article] [PubMed] [Google Scholar]
Barrett‐Williams 2017 {published data only}
- Barrett-Williams SL, Franks P, Kay C, Meyer A, Cornett K, Mosier B. Bridging public health and education: results of a school-based physical activity program to increase student fitness. Public Health Reports 2017;132(2 Suppl):81S-7S. [DOI] [PMC free article] [PubMed] [Google Scholar]
Bartholomew 2018 {published data only}
- Assessing impact of active learning on student outcomes: Texas Initiatives for Children's Activity and Nutrition (ICAN). 2017. https://clinicaltrials.gov/show/nct03087279.
- Bartholomew JB, Golaszewski NM, Jowers E, Korinek E, Roberts G, Fall A, et al. Active learning improves on-task behaviors in 4th grade children. Preventive Medicine 2018;111:49-54. [CENTRAL: NCT03087279] [DOI] [PMC free article] [PubMed] [Google Scholar]
- Bartholomew JB, Jowers E, Roberts G, Fall A, Errisuriz VL, Vaughn S. Active learning increases children's physical activity across demographic subgroups. Translational Journal of the ACSM 2018;3(1):1-9. [CENTRAL: NCT03087279] [DOI] [PMC free article] [PubMed] [Google Scholar]
- Bartholomew JB, Jowers EM, Errisuriz VL, Vaughn S, Roberts G. A cluster randomized control trial to assess the impact of active learning on child activity, attention control, and academic outcomes: the Texas I-CAN trial. Contemporary Clinical Trials 2017;61:81-6. [DOI] [PMC free article] [PubMed] [Google Scholar]
- Bartholomew JB, Jowers EM. Physically active academic lessons in elementary children. Preventive Medicine 2011;52 Suppl 1:S51-4. [DOI] [PMC free article] [PubMed] [Google Scholar]
Barton 2015 {published data only}
- Barton J, Sandercock G, Pretty J, Wood C. The effect of playground- and nature-based playtime interventions on physical activity and self-esteem in UK school children. International Journal of Environmental Health Research 2015;25(2):196-206. [DOI] [PubMed] [Google Scholar]
Batistão 2019 {published data only}
- Batistão MV, Carnaz L, Moreira RFCarreira, Sato TO. Effects of a muscular stretching and strengthening school-based exercise program on posture, trunk mobility, and musculoskeletal pain among elementary schoolchildren - a randomized controlled trial. Fisioterapia em Movimento 2019;32(1):1‐13. [Google Scholar]
Bechter 2019 {published data only}
- Bechter NE, Dimmock JA, Jackson B. A cluster-randomized controlled trial to improve student experiences in physical education: results of a student-centered learning intervention with high school teachers. Psychology of Sport and Exercise 2019;45:101553. [Google Scholar]
Bechter 2019a {published data only}
- Bechter BE, Dimmock JA, Jackson B. A cluster-randomized controlled trial to improve student experiences in physical education: results of a student-centered learning intervention with high school teachers. Psychology of Sport and Exercise 2019;45. [Google Scholar]
Beets 2014 {published data only}
- Beets MW, Glenn Weaver R, Turner-McGrievy G, Huberty J, Ward DS, Freedman DA, et al. Making healthy eating and physical activity policy practice: the design and overview of a group randomized controlled trial in afterschool programs. Contemporary Clinical Trials 2014;38(2):291-303. [DOI] [PMC free article] [PubMed] [Google Scholar]
Beets 2015 {published data only}
- Beets MW, Weaver RG, Turner-McGrievy G, Huberty J, Ward DS, Pate RR, et al. Making policy practice in afterschool programs: a randomized controlled trial on physical activity changes. American Jouranl of Preventive Medicine 2015;48(6):694-706. [DOI] [PMC free article] [PubMed] [Google Scholar]
Beets 2016 {published data only}
- Beets MW, Weaver RG, Turner-McGrievy G, Huberty J, Ward DS, Pate RR, et al. Physical activity outcomes in afterschool programs: a group randomized controlled trial. Preventive Medicine 2016;90:207-15. [DOI] [PMC free article] [PubMed] [Google Scholar]
Belansky 2016 {published data only}
- Belansky ES, Cutforth N, Kern B, Scarbro S. Disseminating evidence-based physical education practices in rural schools: the San Luis Valley Physical Education Academy. Journal of Physical Activity and Health 2016;13(9):1002-9. [DOI] [PubMed] [Google Scholar]
Bell 2019 {published data only}
- Bell MJ, Zeiler M, Herrero R, Kuso S, Nitsch M, Etchemendy E, et al. Healthy Teens @ School: evaluating and disseminating transdiagnostic preventive interventions for eating disorders and obesity for adolescents in school settings. Internet Interventions 2019;16:65-75. [DOI] [PMC free article] [PubMed] [Google Scholar]
Benden 2011 {published data only}
- Benden ME, Blake JJ, Wendel ML, Huber JC. The impact of stand-biased desks in classrooms on calorie expenditure in children. American Journal of Public Health 2011;101(8):1433-6. [DOI] [PMC free article] [PubMed] [Google Scholar]
Benden 2014 {published data only}
- Benden ME, Zhao H, Jeffrey CE, Wendel ML, Blake JJ. The evaluation of the impact of a stand-biased desk on energy expenditure and physical activity for elementary school students. International Journal of Environvironmental Research and Public Health 2014;11(9):9361-75. [DOI] [PMC free article] [PubMed] [Google Scholar]
- Wendel ML, Benden ME, Zhao H, Jeffrey C. Stand-biased versus seated classrooms and childhood obesity: a randomized experiment in Texas. American Journal of Public Health 2016;106(10):1849-54. [DOI] [PMC free article] [PubMed] [Google Scholar]
Berger‐Jenkins 2014 {published data only}
- Berger-Jenkins E, Rausch J, Okah E, Tsao D, Nieto A, Lyda E, et al. Evaluation of a coordinated school-based obesity prevention program in a Hispanic community: choosing healthy and active lifestyles for kids/healthy schools healthy families. American Journal of Health Education 2014;45(5):261-70. [Google Scholar]
Beyler 2014 {published data only}
- Beyler N, Bleeker M, James-Burdumy S, Fortson J, Benjamin M. The impact of Playworks on students' physical activity during recess: findings from a randomized controlled trial. Preventive Medicine 2014;69 Suppl 1:S20-6. [DOI] [PubMed] [Google Scholar]
Bhave 2016 {published data only}
- Bhave S, Pandit A, Yeravdekar R, Madkaikar V, Chinchwade T, Shaikh N, et al. Effectiveness of a 5-year school-based intervention programme to reduce adiposity and improve fitness and lifestyle in Indian children; the SYM-KEM study. Archives of Disease in Childhood 2016;101(1):33-41. [DOI] [PMC free article] [PubMed] [Google Scholar]
Biddle 2015 {published data only}
- Biddle SJH, Edwardson CL, Wilmot EG, Yates T, Gorely T, Bodicoat DH, et al. A randomised controlled trial to reduce sedentary time in young adults at risk of type 2 diabetes mellitus: Project Stand (sedentary time and diabetes). PLoS One 2015;10(12):e0143398. [DOI] [PMC free article] [PubMed] [Google Scholar]
Bilak‐Moconja 2018 {published data only}
- Bilak-Moconja G, Dobraš R, Tadić G, Kukrić A, Petrović B, Stojanović D. The teacher as a factor of improving the effects of physical education classes among younger school age children [Nastavnik kao faktor poboljšanja efekata nastave fizičkog vaspitanja učenika mlađeg školskog uzrasta]. SportLogia 2018;14(1):107-15. [Google Scholar]
Blaes 2013 {published data only}
- Blaes A, Ridgers ND, Aucouturier J, Van Praagh E, Berthoin S, Baquet G. Effects of a playground marking intervention on school recess physical activity in French children. Preventive Medicine 2013;57(5):580-4. [DOI] [PubMed] [Google Scholar]
Bleeker 2015 {published data only}
- Bleeker M, Beyler N, James-Burdumy S, Fortson J. The impact of Playworks on boys' and girls' physical activity during recess. Journal of School Health 2015;85(3):171-8. [DOI] [PubMed] [Google Scholar]
Bogart 2016 {published data only}
- Bogart LM, Elliott MN, Cowgill BO, Klein DJ, Hawes-Dawson J, Uyeda K, et al. Two-year BMI outcomes from a school-based intervention for nutrition and exercise: a randomized trial. Pediatrics 2016;137(5):e20152493. [DOI] [PMC free article] [PubMed] [Google Scholar]
Bonnema 2020 {published data only}
- Bonnema J, Coetzee DÉ, Lennox A. Effect of a three-month HOPSports Brain Breaks® intervention programme on the attitudes of Grade 6 learners towards physical activities and fitness in South Africa. Journal of Physical Education & Sport 2020;20(1):196-205. [Google Scholar]
Bonsergent 2013 {published data only}
- Bonsergent E, Agrinier N, Thilly N, Tessier S, Legrand K, Lecomte E, et al. Overweight and obesity prevention for adolescents: a cluster randomized controlled trial in a school setting. American Journal of Preventive Medicine 2013;44(1):30-9. [DOI] [PubMed] [Google Scholar]
Brandstetter 2012 {published data only}
- Brandstetter S, Klenk J, Berg S, Galm C, Fritz M, Peter R, et al. Overweight prevention implemented by primary school teachers: a randomised controlled trial. Obesity Facts 2012;5(1):1-11. [DOI] [PubMed] [Google Scholar]
Braun 2017 {published data only}
- Braun HA, Kay CM, Cheung P, Weiss PS, Gazmararian JA. Impact of an elementary school-based intervention on physical activity time and aerobic capacity, Georgia, 2013-2014. Public Health Reports 2017;132(2 Suppl):24S-32S. [DOI] [PMC free article] [PubMed] [Google Scholar]
Bremer 2018 {published data only}
- Bremer E, Graham JD, Veldhuizen S, Cairney J. A program evaluation of an in-school daily physical activity initiative for children and youth. BMC Public Health 2018;18(1):1023. [DOI] [PMC free article] [PubMed] [Google Scholar]
Brill 2012 {published data only}
- Brill MF, Kinsey J, Hughes L, Cirignano S, Grenci A, Morgan K. Examining the effects of activity bursts and pedometers in the elementary school classroom. Journal of Nutrition Education & Behavior 2012;44(4):S46. [Google Scholar]
Bronikowski 2011 {published data only}
- Bronikowski M, Bronikowska M. Will they stay fit and healthy? A three-year follow-up evaluation of a physical activity and health intervention in Polish youth. Scandinavian Journal of Public Health 2011;39(7):704-13. [DOI] [PubMed] [Google Scholar]
Brusseau 2016 {published data only}
- Brusseau TA, Hannon J, Burns R. The effect of a comprehensive school physical activity program on physical activity and health-related fitness in children from low-income families. Journal of Physical Activity and Health 2016;13(8):888-94. [DOI] [PubMed] [Google Scholar]
Buchan 2012 {published data only}
- Buchan DS, Young JD, Simpson AD, Thomas NE, Cooper SM, Baker JS. The effects of a novel high intensity exercise intervention on established markers of cardiovascular disease and health in Scottish adolescent youth. Journal of Public Health Research 2012;1(2):155-7. [DOI] [PMC free article] [PubMed] [Google Scholar]
Bugge 2012 {published data only}
- Bugge A, El-Naaman B, Dencker M, Froberg K, Holme I M, McMurray RG, et al. Effects of a three-year intervention: the Copenhagen School Child Intervention Study. Medicine and Science in Sports and Exercise 2012;44(7):1310-7. [DOI] [PubMed] [Google Scholar]
Bundy 2017 {published data only}
- Bundy A, Engelen L, Wyver S, Tranter P, Ragen J, Bauman A, et al. Sydney Playground Project: a cluster-randomized trial to increase physical activity, play, and social skills. Journal of School Health 2017;87(10):751-9. [DOI] [PubMed] [Google Scholar]
Bungum 2014 {published data only}
- Bungum TJ, Clark S, Aguilar B. The effect of an active transport to school intervention at a suburban elementary school. American Journal of Health Education 2014;45(4):205-9. [Google Scholar]
Bunketorp 2015 {published data only}
- Bunketorp Käll L, Malmgren H, Olsson E, Lindén T, Nilsson M. Effects of a curricular physical activity intervention on children's school performance, wellness, and brain development. Journal of School Health 2015;85(10):704-13. [DOI] [PubMed] [Google Scholar]
Burguera 2011 {published data only}
- Burguera B, Colom A, Pinero E, Yanez A, Caimari M, Tur J, et al. ACTYBOSS: activity, behavioral therapy in young subjects - after-school intervention pilot project on obesity prevention. Obesity Facts 2011;4(5):400-6. [DOI] [PMC free article] [PubMed] [Google Scholar]
Burns 2015 {published data only}
- Burns RD, Brusseau TA, Hannon JC. Effect of a comprehensive school physical activity program on school day step counts in children. Journal of Physical Activity and Health 2015;12(12):1536-42. [DOI] [PubMed] [Google Scholar]
Bustos 2016 {published data only}32136790
- Bustos N, Olivares S, Leyton B, Cano M, Albala C. Impact of a school-based intervention on nutritional education and physical activity in primary public schools in Chile (KIND) programme study protocol: cluster randomised controlled trial. BMC Public Health 2016;16(1):1217. [DOI] [PMC free article] [PubMed] [Google Scholar]
Børrestad 2012 {published data only}
- Børrestad LAB, Østergaard L, Andersen LB, Bere E. Experiences from a randomised, controlled trial on cycling to school: does cycling increase cardiorespiratory fitness? Scandinavian Journal of Public Health 2012;40(3):245-52. [DOI] [PubMed] [Google Scholar]
Calvert 2018 {published data only}
- Calvert HG, Mahar MT, Flay B, Turner L. Classroom-based physical activity: minimizing disparities in school-day physical activity among elementary school students. Journal of Physical Activity & Health 2018;15(3):161-8. [DOI] [PubMed] [Google Scholar]
Cao 2015 {published data only}
- Cao ZJ, Wang SM, Chen Y. A randomized trial of multiple interventions for childhood obesity in China. American Journal of Preventive Medicine 2015;48(5):552-60. [DOI] [PubMed] [Google Scholar]
Cao 2019 {published data only}
- Cao Z, Hua J, Zhang D, Thapa J R, Wang S. A cohort study assessing the sustainable long-term effectiveness of a childhood-obesity intervention in China. International Journal of Epidemiology 2019;48(1):108-15. [DOI] [PubMed] [Google Scholar]
Castelli 2014 {published data only}
- Castelli DM, Centeio EE, Beighle AE, Carson RL, Nicksic HM. Physical literacy and comprehensive school physical activity programs. Preventive Medicine 2014;66:95-100. [DOI] [PubMed] [Google Scholar]
Centis 2012 {published data only}
- Centis E, Marzocchi R, Di Luzio R, Moscatiello S, Salardi S, Villanova N, et al. A controlled, class-based multicomponent intervention to promote healthy lifestyle and to reduce the burden of childhood obesity. Pediatric Obesity 2012;7(6):436-45. [DOI] [PubMed] [Google Scholar]
Chase 2018 {published data only}
- Chase B, Hall M, Brusseau TA. Impact of goal setting on physical activity in physical education. Journal of Physical Education and Sport 2018;18(2):757-61. [Google Scholar]
Chen 2016 {published data only}
- Chen S, Zhu X, Androzzi J, Nam YH. Evaluation of a concept-based physical education unit for energy balance education. Journal of Sport and Health Science 2016;22:353-62. [DOI] [PMC free article] [PubMed] [Google Scholar]
Chillon 2011 {published data only}
- Chillon P, Ortega FB, Ruiz JR, De Bourdeaudhuij I, Martinez-Gomez D, Vicente-Rodriguez G, et al. Active commuting and physical activity in adolescents from Europe: results from the HELENA study. Pediatric Exercise Science 2011;23(2):207-17. [DOI] [PubMed] [Google Scholar]
Christiansen 2014 {published data only}
- Christiansen LB, Toftager M, Troelsen J. Can schoolyard improvements increase physical activity for the least active students, or just provide better opportunities for the most active? Science & Sports 2014;29:S52. [Google Scholar]
Cichy 2012 {published data only}
- Cichy I, Rokita A. The use of the 'Eduball' educational ball in rural and urban primary schools and the physical fitness levels of children. Human Movement 2012;13(3):247-57. [Google Scholar]
Clapham 2015 {published data only}
- Clapham ED, Sullivan EC, Ciccomascolo LE. Effects of a physical education supportive curriculum and technological devices on physical activity. Physical Educator 2015;72(1):102-16. [Google Scholar]
Clemes 2020 {published data only}
- Clemes SA, Bingham DD, Pearson N, Chen YL, Edwardson CL, McEachan RRC, et al. Stand Out in Class: restructuring the classroom environment to reduce sitting time - findings from a pilot cluster randomised controlled trial. International Journal of Behavioral Nutrition and Physical Activity 2020;17(1):55. [DOI] [PMC free article] [PubMed] [Google Scholar]
Coknaz 2019 {published data only}
- Coknaz D, Mirzeoglu AD, Atasoy HI, Alkoy S, Coknaz H, Goral K. A digital movement in the world of inactive children: favourable outcomes of playing active video games in a pilot randomized trial. European Journal of Pediatrics 2019;178(10):1567-76. [DOI] [PubMed] [Google Scholar]
Colin‐Ramirez 2010 {published data only}
- Colin-Ramirez E, Castillo-Martinez L, Orea-Tejeda A, Vergara A, Villa AR. Impact of a school-based intervention to cardiovascular risk factors prevention (RESCATE) on physical activity and diet in Mexican children aged 8-10 years [Efecto de una intervencion escolar basada en actividad fisica y dieta para la prevencion de factores de riesgo cardiovascular (RESCATE) en ninos mexicanos de 8 a 10 anos]. Revista Espanola de Nutricion Comunitaria 2009;15(2):71-80. [Google Scholar]
- Colin-Ramirez E, Castillo-Martinez L, Orea-Tejeda A, Vergara-Castaneda A, Keirns-Davis C, Villa-Romero A. Outcomes of a school-based intervention (RESCATE) to improve physical activity patterns in Mexican children aged 8-10 years. Health Education Research 2010;25(6):1042-9. [DOI] [PubMed] [Google Scholar]
Collins 2014 {published data only}
- Collins CE, Dewar DL, Schumacher TL, Finn T, Morgan PJ, Lubans DR. 12 month changes in dietary intake of adolescent girls attending schools in low-income communities following the NEAT Girls cluster randomized controlled trial. Appetite 2014;73:147-55. [DOI] [PubMed] [Google Scholar]
Costa‐Urrutia 2019 {published data only}
- Costa-Urrutia P, Alvarez-Farina R, Abud C, Franco-Trecu V, Esparza-Romero J, Lopez-Morales CM, et al. Effect of multi-component school-based program on body mass index, cardiovascular and diabetes risks in a multi-ethnic study. BMC Pediatrics 2019;19(1):401. [DOI] [PMC free article] [PubMed] [Google Scholar]
Costigan 2018 {published data only}
- Costigan SA, Ridgers ND, Eather N, Plotnikoff RC, Harris N, Lubans DR. Exploring the impact of high intensity interval training on adolescents' objectively measured physical activity: findings from a randomized controlled trial. Journal of Sports Science 2018;36(10):1087-94. [DOI] [PubMed] [Google Scholar]
CTRI/2019/03/018133 {published data only}
- A multicomponent intervention to promote healthy eating habits and physical activity among primary school children of urban Puducherry – a cluster randomized trial. 2019. http://www.ctri.nic.in/Clinicaltrials/pmaindet2.php?trialid=31785.
CTRI/2019/04/018834 {published data only}
- Effect of a structured multifactorial program on physical activity levels and body composition in obese and overweight adolescent. 2019. http://www.ctri.nic.in/Clinicaltrials/pmaindet2.php?trialid=31539.
CTRI/2019/09/021452 {published data only}
- To prevent the unhealthy lifestyle choices, as unbalanced diet, physical inactivity, tobacco and alcohol use that leads to various long term diseases later in life, as diabetes and hypertension among school going adolescents, their parents and teachers through an intervention. WHO International Clinical Trials Registry Platform. 2019. [CTRI/2019/09/021452]
Čuljak 2011 {published data only}
- Čuljak Z, Ćavar M, Crnjac D, Marić K, Ćorluka M. Effectiveness of the school of gymnastics in 7 years old children [Utjecaj å kole gimnastike na sedmogodiå njake]. Sport Scientific & Practical Aspects 2011;8(2):41-5. [Google Scholar]
Cunha 2017 {published data only}
- Cunha DB, Verly Junior E, Paravidino VB, Araujo MC, Mediano MFF, Sgambato MR, et al. Design of a school randomized trial for nudging students towards healthy diet and physical activity to prevent obesity: PAAPAS Nudge study protocol. Medicine (Baltimore) 2017;96(50):e8898. [DOI] [PMC free article] [PubMed] [Google Scholar]
Cvejić 2017 {published data only}
- Cvejić D, Ostojić S. Effects of the FITT program on physical activity and health-related fitness in primary school age children [Efekti fitt programa na fizičku aktivnost i fizičku formu povezanu sa zdravljem dece mlađeg školskog uzrasta]. Physical Education and Sport 2017;15(3):437-51. [Google Scholar]
D'Haese 2013 {published data only}
- D'Haese S, Van Dyck D, De Bourdeaudhuij I, Cardon G. Effectiveness and feasibility of lowering playground density during recess to promote physical activity and decrease sedentary time at primary school. BMC Public Health 2013;13:1154. [DOI] [PMC free article] [PubMed] [Google Scholar]
Dai 2014 {published data only}
- Dai CL, Nabors LA, King KA, Vidourek RA, Chen CC, Hoang N, Mastro KG. Evaluation of an afterschool children’s healthy eating and exercise program. International Journal of Child Health and Nutrition 2014;3(4):1-8. [Google Scholar]
Dallolio 2016 {published data only}
- Dallolio L, Ceciliani A, Sanna T, Garulli A, Leoni E. Proposal for an enhanced physical education program in the primary school: evaluation of feasibility and effectiveness in improving physical skills and fitness. Journal of Physical Activity and Health 2016;13(10):1025-34. [DOI] [PubMed] [Google Scholar]
Danielson 2018 {published data only}
- Danielson A, Thorsson O, Karlsson MK, Wollmer P, Andersen LB, Dencker M. School-based study found that physical activity and aerobic fitness predicted increases in total body fat and abdominal fat at a mean age of 9.8 years. Acta Paediatrica 2018;107(10):1810-7. [DOI] [PubMed] [Google Scholar]
Dannenberg 2018 {published data only}
- Dannenberg AL, Huang C, Mendoza Haal JA. Changes in self-efficacy and outcome expectations from child participation in bicycle trains for commuting to and from school. Health Education & Behavior 2018;45(5):748-55. [DOI] [PMC free article] [PubMed] [Google Scholar]
Darabi 2017 {published data only}
- Darabi F, Kaveh MH, Majlessi F, Farahani FKA, Yaseri M, Shojaeizadeh D. Effect of theory-based intervention to promote physical activity among adolescent girls: a randomized control trial. Electron Physician 2017;9(4):4238-47. [DOI] [PMC free article] [PubMed] [Google Scholar]
da Silva 2013 {published data only}
- Silva LSM, Fisberg M, Pires MMD, Nassar SM, Sottovia CB. The effectiveness of a physical activity and nutrition education program in the prevention of overweight in schoolchildren in Criciuma, Brazil. European Journal of Clinical Nutrition 2013;67(11):1200-4. [DOI] [PubMed] [Google Scholar]
da Silva Bandeira 2019 {published data only}
- da Silva Bandeira A, Silva KS, Bastos JLD, Silva DAS, Lopes ADS, Filho VC Barbosa. Psychosocial mediators of screen time reduction after an intervention for students from schools in vulnerable areas: a cluster-randomized controlled trial. Journal of Science and Medicine in Sport 2019;23(3):264-9. [DOI] [PubMed] [Google Scholar]
de Araujo 2012 {published data only}
- Araujo MP, Barela JA, Celestino MA, Barela AMF. Contribution of different contents of physical education classes in elementary school for the development of basic motor skills. Revista Brasileira de Medicina do Esporte 2012;18(3):153-7. [Google Scholar]
de Barros 2009 {published data only}
- Barros MV, Nahas MV, Hallal PC, e Farias Junior JC, Florindo AA, Honda de Barros SS. Effectiveness of a school-based intervention on physical activity for high school students in Brazil: the Saude na Boa project. Journal of Physical Activity and Health 2009;6(2):163-9. [DOI] [PubMed] [Google Scholar]
de Greeff 2014 {published data only}
- Greeff JW, Hartman E, Mullender-Wijnsma MJ, Bosker RJ, Doolaard S, Visscher C. Physical fitness and academic performance in primary school children with and without a social disadvantage. Health Education Research 2014;29(5):853-60. [DOI] [PubMed] [Google Scholar]
Del Duca 2014 {published data only}
- Del Duca G, Gomes de Barros MV, Samara Silva K, Totaro Garcia LM, Bezerra J, et al. Effectiveness on physical activity indicators of an intervention delivered to high school students [Efetividade em indicadores de atividade física de uma intervenção com estudantes do ensino médio]. Brazilian Journal of Kineanthropometry & Human Performance 2014;16:13-24. [Google Scholar]
Delgado‐Floody 2018 {published data only}
- Delgado-Floody P, Espinoza-Silva M, Garcia-Pinillos F, Latorre-Roman P. Effects of 28 weeks of high-intensity interval training during physical education classes on cardiometabolic risk factors in Chilean schoolchildren: a pilot trial. European Journal of Pediatrics 2018;177(7):1019-27. [DOI] [PubMed] [Google Scholar]
de Meij 2011 {published data only}
- Meij JS, Chinapaw MJ, Stralen MM, Wal MF, Dieren L, Mechelen W. Effectiveness of JUMP-in, a Dutch primary school-based community intervention aimed at the promotion of physical activity. British Journal of Sports Medicine 2011;45(13):1052-7. [DOI] [PubMed] [Google Scholar]
de Meij 2013 {published data only}
- Meij JS, Wal MF, Mechelen W, Chinapaw MJ. A mixed methods process evaluation of the implementation of JUMP-in, a multilevel school-based intervention aimed at physical activity promotion. Health Promotion and Practice 2013;14(5):777-90. [DOI] [PubMed] [Google Scholar]
Demetriou 2019a {published data only}
- Demetriou Y, Bachner J. A school-based intervention based on self-determination theory to promote girls' physical activity: study protocol of the CReActivity cluster randomised controlled trial. BMC Public Health 2019;19(1):519. [DOI] [PMC free article] [PubMed] [Google Scholar]
de Souza Santos 2015 {published data only}
- Souza Santos D, de Oliveira E, Pereira CA, Evangelista AL, Bocalini DS, Rica RL, et al. Does a calisthenics-based exercise program applied in school improve morphofunctional parameters in youth? Journal of Exercise Physiology Online 2015;18(6):52-61. [Google Scholar]
Detter 2014 {published data only}
- Detter F, Nilsson JA, Karlsson C, Dencker M, Rosengren BE, Karlsson MK. A 3-year school-based exercise intervention improves muscle strength - a prospective controlled population-based study in 223 children. BMC Musculoskeletal Disorders 2014;15:353. [DOI] [PMC free article] [PubMed] [Google Scholar]
Detter 2014a {published data only}
- Detter F, Rosengren BE, Dencker M, Lorentzon M, Nilsson JA, Karlsson MK. A 6-year exercise program improves skeletal traits without affecting fracture risk: a prospective controlled study in 2621 children. Journal of Bone and Mineral Research 2014;29(6):1325-36. [DOI] [PubMed] [Google Scholar]
Deutsch 2019 {published data only}
- Deutsch J, Waldera R, Mahoney S, Martinez M. Project Fit America's impact on youth fitness levels: second year curriculum. ICHPER-SD Journal of Research 2019;10(2):28-32. [Google Scholar]
Dewar 2013 {published data only}
- Dewar DL, Morgan PJ, Plotnikoff RC, Okely AD, Collins CE, Batterham M, et al. The nutrition and enjoyable activity for teen girls study: a cluster randomized controlled trial. American Journal of Preventive Medicine 2013;45(3):313-7. [DOI] [PubMed] [Google Scholar]
Dewar 2014 {published data only}
- Dewar DL, Morgan PJ, Plotnikoff RC, Okely AD, Batterham M, Lubans DR. Exploring changes in physical activity, sedentary behaviors and hypothesized mediators in the NEAT girls group randomized controlled trial. Journal of Science and Medicine in Sport 2014;17(1):39-46. [DOI] [PubMed] [Google Scholar]
Dills 2011 {published data only}
- Dills AK, Morgan HN, Rotthoff KW. Recess, physical education, and elementary school student outcomes. Economics of Education Review 2011;30(5):889-900. [Google Scholar]
Dishman 2004 {published data only}
- Dishman RK, Motl RK, Saunders R, Felton G, Ward DS, Dowda M. Self-efficacy partially mediates the effect of a school-based physical-activity intervention among adolescent girls. Preventive Medicine 2004;38(5):628-36. [DOI] [PubMed] [Google Scholar]
- Pate RR, Ward DS, Saunders RP. Promotion of physical activity among high-school girls: a randomized controlled trial. American Journal of Public Health 2005;95:1582-7. [DOI] [PMC free article] [PubMed] [Google Scholar]
- Saunders RP, Ward D, Felton GM, Dowda M, Pate RR. Examining the link between program implementation and behavior outcomes in the Lifestyle Education for Activity Program (LEAP). Evaluation and Program Planning 2006;29(4):352-63. [DOI] [PubMed] [Google Scholar]
- Ward DS, Saunders R, Felton GM, Williams E, Epping JN, Pate RR. Implementation of a school environment intervention to increase physical activity in high school girls. Health Education Research 2006;21(6):896-910. [DOI] [PubMed] [Google Scholar]
Duberg 2020 {published data only}
- Duberg A, Jutengren G, Hagberg L, Moller M. The effects of a dance intervention on somatic symptoms and emotional distress in adolescent girls: a randomized controlled trial. Journal of Interantional Medical Research 2020;48(2):300060520902610. [DOI] [PMC free article] [PubMed] [Google Scholar]
Ducheyne 2014 {published data only}
- Ducheyne F, De Bourdeaudhuij I, Lenoir M, Cardon G. Effects of a cycle training course on children's cycling skills and levels of cycling to school. Accident Analysis & Prevention 2014;67:49-60. [DOI] [PubMed] [Google Scholar]
Duncan 2011 {published data only}
- Duncan S, McPhee JC, Schluter PJ, Zinn C, Smith R, Schofield G. Efficacy of a compulsory homework programme for increasing physical activity and healthy eating in children: the healthy homework pilot study. International Journal of Behavioral Nutrition and Physical Activity 2011;8:127. [DOI] [PMC free article] [PubMed] [Google Scholar]
Duncan 2019 {published data only}
- Duncan S, Stewart T, McPhee J, Borotkanics R, Prendergast K, Zinn C, et al. Efficacy of a compulsory homework programme for increasing physical activity and improving nutrition in children: a cluster randomised controlled trial. International Journal of Behavioral Nutrition and Physical Activity 2019;16(1):80. [DOI] [PMC free article] [PubMed] [Google Scholar]
Dzewaltowski 2011 {published data only}
- Dzewaltowski DA, Geller KS, Rosenkranz RR, Coleman KJ, Welk GJ, Hastmann TJ. HOP'N After-School Project: intervention description and process evaluation of an obesity prevention randomized controlled trial. Medicine and Science in Sports and Exercise 2011;43(5):23. [Google Scholar]
Dzielska 2020 {published data only}
- Dzielska A, Mazur J, Nalecz H, Oblacinska A, Fijalkowska A. Importance of self-efficacy in eating behavior and physical activity change of overweight and non-overweight adolescent girls participating in Healthy Me: a lifestyle intervention with mobile technology. Nutrients 2020;12(7):2128. [DOI] [PMC free article] [PubMed] [Google Scholar]
Efstathiou 2016 {published data only}
- Efstathiou NT, Risvas GS, Theodoraki EMM, Galanaki EP, Zampelas AD. Health education: effects on classroom climate and physical activity. Health Education Journal 2016;75(7):799-810. [Google Scholar]
Egger 2019 {published data only}
- Egger F, Benzing V, Conzelmann A, Schmidt M. Boost your brain, while having a break! The effects of long-term cognitively engaging physical activity breaks on children's executive functions and academic achievement. PLoS One 2019;14(3):e0212482. [DOI] [PMC free article] [PubMed] [Google Scholar]
Eichner 2016 {published data only}
- Eichner JE, Folorunso OA, Moore WE. A physical activity intervention and changes in body mass index at a middle school with a large American Indian population, Oklahoma, 2004-2009. Preventing Chronic Disease 2016;13:E163. [DOI] [PMC free article] [PubMed] [Google Scholar]
Elder 2011 {published data only}
- Elder JP, McKenzie TL, Arredondo EM, Crespo NC, Ayala GX. Effects of a multi-pronged intervention on children's activity levels at recess: the Aventuras para Ninos study. Advances in Nutrition 2011;2(2):171S-6S. [DOI] [PMC free article] [PubMed] [Google Scholar]
Elinder 2012 {published data only}
- Elinder LS, Heinemans N, Hagberg J, Quetel AK, Hagstromer M. A participatory and capacity-building approach to healthy eating and physical activity - SCIP-school: a 2-year controlled trial. International Journal of Behavioural Nutrition and Physical Activity 2012;9:145. [DOI] [PMC free article] [PubMed] [Google Scholar]
Elinder 2018 {published data only}
- Elinder LS, Patterson E, Nyberg G, Norman Å. A Healthy School Start Plus for prevention of childhood overweight and obesity in disadvantaged areas through parental support in the school setting - study protocol for a parallel group cluster randomised trial. BMC Public Health 2018;18:459. [DOI] [PMC free article] [PubMed] [Google Scholar]
Elizondo‐Montemayor 2013 {published data only}
- Elizondo-Montemayor L, Gutierrez NG, Moreno DM, Martinez U, Tamargo D, Trevino M. School-based individualised lifestyle intervention decreases obesity and the metabolic syndrome in Mexican children. Journal of Human Nutrition and Dietetics 2013;26 Suppl 1:82-9. [DOI] [PubMed] [Google Scholar]
Engelen 2013 {published data only}
- Engelen L, Bundy AC, Naughton G, Simpson JM, Bauman A, Ragen J, et al. Increasing physical activity in young primary school children-it's child's play: a cluster randomised controlled trial. Preventive Medicine 2013;56(5):319-25. [DOI] [PubMed] [Google Scholar]
Erfle 2015 {published data only}
- Erfle SE, Gamble A. Effects of daily physical education on physical fitness and weight status in middle school adolescents. Journal of School Health 2015;85(1):27-35. [DOI] [PubMed] [Google Scholar]
Ericsson 2011 {published data only}
- Ericsson I. Effects of increased physical activity on motor skills and marks in physical education: an intervention study in school years 1 through 9 in Sweden. Physical Education & Sport Pedagogy 2011;16(3):313-29. [Google Scholar]
Ericsson 2014 {published data only}
- Ericsson IR. Effects of motor skills training and daily physical education: research results in the Swedish Bunkeflo project. International Journal of Physical Education 2014;51(2):19-29. [Google Scholar]
Erwin 2011 {published data only}
- Erwin HE, Beighle A, Morgan CF, Noland M. Effect of a low-cost, teacher-directed classroom intervention on elementary students' physical activity. Journal of School Health 2011;81(8):455-61. [DOI] [PubMed] [Google Scholar]
Esquivel 2019 {published data only}
- Esquivel CH, Garney WR, Nelon J, Garcia KM. A process evaluation of a fitness curriculum to meet physical activity policy requirements: a pilot study. Journal of Adolescent Health 2019;64(2):S88. [Google Scholar]
Esquivel 2019a {published data only}
- Esquivel CH, Garney WR, Nelon J, Garcia KM. 171. A process evaluation of a fitness curriculum to meet physical activity policy requirements: a pilot study. Journal of Adolescent Health 2019;64(2):S88. [Google Scholar]
Evans 2016 {published data only}
- Evans A, Ranjit N, Hoelscher D, Jovanovic C, Lopez M, McIntosh A, et al. Impact of school-based vegetable garden and physical activity coordinated health interventions on weight status and weight-related behaviors of ethnically diverse, low-income students: study design and baseline data of the Texas, Grow! Eat! Go! (TGEG) cluster-randomized controlled trial. BMC Public Health 2016;16:973. [DOI] [PMC free article] [PubMed] [Google Scholar]
Ezendam 2012 {published data only}
- Ezendam NP, Brug J, Oenema A. Evaluation of the Web-based computer-tailored FATaintPHAT intervention to promote energy balance among adolescents: results from a school cluster randomized trial. Archives of Pediatrics and Adolescent Medicine 2012;166(3):248-55. [DOI] [PubMed] [Google Scholar]
Farias 2015 {published data only}
- Farias Edos S, Goncalves EM, Morcillo AM, Guerra-Junior G, Amancio OM. Effects of programmed physical activity on body composition in post-pubertal schoolchildren. Jornal de Pediatria 2015;91(2):122-9. [DOI] [PubMed] [Google Scholar]
Fedewa 2018 {published data only}
- Fedewa AL, Fettrow E, Erwin H, Ahn S, Farook M. Academic-based and aerobic-only movement breaks: are there differential effects on physical activity and achievement? Research Quarterly for Exercise and Sport 2018;89(2):153-63. [DOI] [PubMed] [Google Scholar]
Fernandes 2014 {published data only}
- Fernandes L, Oliveira T, Oliveira J, Rebelo A, Ribeiro JC, Brito J. Young school children engaged with regular after-school soccer practice present improved physical fitness and cardiovascular risk. Brazilian Journal of Soccer Science/Revista Brasileira de Futebol 2014;7(1):73-81. [Google Scholar]
Fernandez‐Jimenez 2019 {published data only}
- Fernandez-Jimenez R, Santos-Beneit G, Tresserra-Rimbau A, Bodega P, Miguel M de, Cos-Gandoy A de, et al. Rationale and design of the school-based SI! Program to face obesity and promote health among Spanish adolescents: a cluster-randomized controlled trial. American Heart Journal 2019;215:27-40. [DOI] [PubMed] [Google Scholar]
Filho 2016 {published data only}
- Filho VC, da Silva KS, Mota J, Beck C, da Silva Lopes A. A physical activity intervention for Brazilian students from low human development index areas: a cluster-randomized controlled trial. Journal of Physical Activity and Health 2016;13(11):1174-82. [DOI] [PubMed] [Google Scholar]
Filho 2019 {published data only}
- Filho VC Barbosa, Bandeira ADS, Minatto G, Linard JG, Silva JAD, Costa RMD, et al. Effect of a multicomponent intervention on lifestyle factors among Brazilian adolescents from low human development index areas: a cluster-randomized controlled trial. International Journal of Environmental Research and Public Health 2019;16(2):267. [DOI] [PMC free article] [PubMed] [Google Scholar]
Finn 2018 {published data only}
- Finn KE, Yan Z, McInnis KJ. Promoting physical activity and science learning in an outdoor education program. Journal of Physical Education Recreation and Dance 2018;89(1):35-9. [Google Scholar]
Fitzgibbon 2011 {published data only}
- Fitzgibbon ML, Stolley MR, Schiffer LA, Braunschweig CL, Gomez SL, Van Horn L, et al. Hip-Hop to Health Jr. obesity prevention effectiveness trial: postintervention results. Obesity 2011;19(5):994-1003. [DOI] [PMC free article] [PubMed] [Google Scholar]
Foo 2014 {published data only}
- Foo TJ, Krasilshchikov O, Shaw BS, Shaw I. Effect of concurrent physical education and obesity-prevention training programme on anthropometry and cardiorespiratory fitness in children. African Journal for Physical Health Education Recreation & Dance 2014;Suppl 2:74-81. [Google Scholar]
Ford 2012 {published data only}
- Ford P, Swaine I. Continuous versus accumulated brisk walking in children aged 8-11 years. European Journal of Sport Science 2012;12(1):89-95. [Google Scholar]
Franceschi Neto 2017 {published data only}
- Franceschi Neto C, Rodrigues Neto G, Araújo Júnior AT, do Socorro Cirilo-Sousa M, Sousa JB, Ricarte Batista G, et al. Effects of the practice of self-selected and programmed physical activity on anthropometric and biochemical components. Journal of Exercise Physiology Online 2017;20(2):35-44. [Google Scholar]
Francois 2014 {published data only}
- Francois P, Guyomard A, Baudet D, Dubois-Fabing D, Boussuges S, Perrin F, et al. Evaluation of an obesity prevention program for school-aged children in deprived urban areas [Évaluation d’un dispositif de prévention de l’obésité chez des enfants scolarisés dans des zones urbaines sensibles]. Archives de Pédiatrie 2014;21(7):727-35. [DOI] [PubMed] [Google Scholar]
Friedrich 2012 {published data only}
- Friedrich RR, Schuch I, Wagner MB. Effect of interventions on the body mass index of school-age students. Revista de Saúde Pública 2012;46(3):551-60. [DOI] [PubMed] [Google Scholar]
Fritz 2016 {published data only}
- Fritz J, Coster ME, Stenevi-Lundgren S, Nilsson JA, Dencker M, Rosengren BE, et al. A 5-year exercise program in children improves muscle strength without affecting fracture risk. European Journal of Applied Physiology 2016;116(4):707-15. [DOI] [PubMed] [Google Scholar]
Fritz 2016a {published data only}
- Fritz J, Coster ME, Nilsson JA, Rosengren BE, Dencker M, Karlsson MK. The associations of physical activity with fracture risk - a 7-year prospective controlled intervention study in 3534 children. Osteoporosis International 2016;27(3):915-22. [DOI] [PubMed] [Google Scholar]
Frost 2018 {published data only}
- Frost MC, Kuo ES, Harner LT, Landau KR, Baldassar K. Increase in physical activity sustained 1 year after playground intervention. American Journal of Preventive Medicine 2018;54(5 Suppl 2):S124-9. [DOI] [PubMed] [Google Scholar]
Fu 2016 {published data only}
- Fu Y, Burns RD, Brusseau TA, Hannon JC. Comprehensive school physical activity programming and activity enjoyment. American Journal of Health Behavior 2016;40(4):496-502. [DOI] [PubMed] [Google Scholar]
Galle 2016 {published data only}
- Galle F, Di Onofrio V, Barbone F, Calimeri BI, Carraro S, et al. Investigating the role of physical education in physical activity promotion: an Italian multicenter study. Journal of Physical Activity and Health 2016;13(8):854-60. [DOI] [PubMed] [Google Scholar]
Gallotta 2015 {published data only}
- Gallotta MC, Emerenziani GP, Iazzoni S, Meucci M, Baldari C, Guidetti L. Impacts of coordinative training on normal weight and overweight/obese children's attentional performance. Frontiers in Human Neuroscience 2015;9(577):577. [DOI] [PMC free article] [PubMed] [Google Scholar]
Gallotta 2017 {published data only}
- Gallotta MC, Emerenziani GP, Iazzoni S, Iasevoli L, Guidetti L, Baldari C. Effects of different physical education programmes on children's skill- and health-related outcomes: a pilot randomised controlled trial. Journal of Sports Sciences 2017;35(15):1547-55. [DOI] [PubMed] [Google Scholar]
Gammon 2019 {published data only}
- Gammon C, Morton K, Atkin A, Corder K, Daly-Smith A, Quarmby T, et al. Introducing physically active lessons in UK secondary schools: feasibility study and pilot cluster-randomised controlled trial. BMJ Open 2019;9(5):e025080. [DOI] [PMC free article] [PubMed] [Google Scholar]
Garcia‐Hermoso 2020 {published data only}
- Garcia-Hermoso A, Hormazabal-Aguayo I, Fern ez-Vergara O, Gonzalez-Calderon N, Russell-Guzman J, Vicencio-Rojas S, et al. A before-school physical activity intervention to improve cognitive parameters in children: the Active-Start study. Scandinavian Journal of Medicine & Science in Sports 2020;30(1):108-16. [DOI] [PubMed] [Google Scholar]
Gatz 2018 {published data only}
- Gatz J, Kelly AM, Clark SL. Improved executive function and science achievement for at-risk middle school girls in an aerobic fitness program. Journal of Early Adolescence 2018;39(3):453-69. [Google Scholar]
Geanina 2011 {published data only}
- Geanina T. Development methodology overthrow accuracy of leisure primary school pupils using the techniques of specific intervention. Gymnasium: Journal of Physical Education and Sports 2011;12(2):51-6. [Google Scholar]
Gevat 2012 {published data only}
- Gevat C, Larion A, Sabau E, Niculescu G. Identify the physical abilities of 11-12 years old students from middle school. Ovidius University Annals, Series Physical Education & Sport/Science, Movement & Health 2012;12(2):331-6. [Google Scholar]
Gill 2019 {published data only}
- Gill M, Roth SE, Chan-Golston AM, Rice LN, Crespi CM, Koniak-Griffin D, et al. Evaluation of an intervention to increase physical activity in low-income, urban middle schools. Journal of School Health 2019;89(9):705-14. [DOI] [PMC free article] [PubMed] [Google Scholar]
Giralt 2011 {published data only}
- Giralt M, Albaladejo R, Tarro L, Morina D, Arija V, Sola R. A primary-school-based study to reduce prevalence of childhood obesity in Catalunya (Spain) - EDAL-Educacion en alimentacion: study protocol for a randomised controlled trial. Trials 2011;12:54. [DOI] [PMC free article] [PubMed] [Google Scholar]
Glapa 2018 {published data only}
- Glapa A, Grzesiak J, Laudanska-Krzeminska I, Chin MK, Edginton CR, Mok MM, et al. The impact of brain breaks classroom-based physical activities on attitudes toward physical activity in Polish school children in third to fifth grade. International Journal of Environmental Research and Public Health 2018;15(2):368. [DOI] [PMC free article] [PubMed] [Google Scholar]
Goh 2014 {published data only}
- Goh TL, Hannon J, Podlog LW, Brusseau T, Webster CA, Newton M. Effects of a classroom-based physical activity program on children's physical activity levels. Journal of Teaching in Physical Education 2014;33(4):558-72. [Google Scholar]
Goh 2017 {published data only}
- Goh TL. Children’s physical activity and on-task behavior following active academic lessons. Quest 2017;69(2):177-86. [Google Scholar]
Gortmaker 2012 {published data only}
- Gortmaker SL, Lee RM, Mozaffarian RS, Sobol AM, Nelson TF, Roth BA, et al. Effect of an after-school intervention on increases in children's physical activity. Medicine & Science in Sport & Exercise 2012;44(3):450-7. [DOI] [PubMed] [Google Scholar]
Grasten 2017 {published data only}
- Grasten A, Watt A, Liukkonen J, Jaakkola T. Effects of school-based physical activity program on students' moderate-to-vigorous physical activity and perceptions of physical competence. Journal of Physical Activity and Health 2017;14(6):455-64. [DOI] [PubMed] [Google Scholar]
Gray 2015 {published data only}
- Gray HL, Contento IR, Koch PA. Linking implementation process to intervention outcomes in a middle school obesity prevention curriculum, 'Choice, Control and Change'. Health Education and Research 2015;30(2):248-61. [DOI] [PMC free article] [PubMed] [Google Scholar]
Greve 2015 {published data only}
- Greve J, Heinesen E. Evaluating the impact of a school-based health intervention using a randomized field experiment. Economics and Human Biology 2015;18:41-56. [DOI] [PubMed] [Google Scholar]
Griffiths 2019 {published data only}
- Griffiths LA, Griffiths MA. Evaluation of a school–community linked physical activity intervention targeting 7- to 12-year-olds: a sociocultural perspective. American Journal of Health Education 2019;50(2):112-26. [Google Scholar]
Grillich 2016 {published data only}
- Grillich L, Kien C, Takuya Y, Weber M, Gartlehner G. Effectiveness evaluation of a health promotion programme in primary schools: a cluster randomised controlled trial. BMC Public Health 2016;16:679. [DOI] [PMC free article] [PubMed] [Google Scholar]
Gunawardena 2016 {published data only}
- Gunawardena N, Kurotani K, Indrawansa S, Nonaka D, Mizoue T, Samarasinghe D. School-based intervention to enable school children to act as change agents on weight, physical activity and diet of their mothers: a cluster randomized controlled trial. International Journal of Behavioural Nutrition and Physical Activity 2016;13:45. [DOI] [PMC free article] [PubMed] [Google Scholar]
Ha 2014 {published data only}
- Ha AS, Lonsdale C, Ng JY, Lubans DR. A school-based rope skipping intervention for adolescents in Hong Kong: protocol of a matched-pair cluster randomized controlled trial. BMC Public Health 2014;14:535. [DOI] [PMC free article] [PubMed] [Google Scholar]
Ha 2015 {published data only}
- Ha AS, Burnett A, Sum R, Medic N, Ng JY. Outcomes of the rope skipping 'STAR' programme for schoolchildren. Journal of Human Kinetics 2015;45(1):233-40. [DOI] [PMC free article] [PubMed] [Google Scholar]
Ha 2020 {published data only}ACTRN12615000633583
- Ha AS, Lonsdale C, Lubans DR, Ng JY. Increasing students' physical activity during school physical education: rationale and protocol for the SELF-FIT cluster randomized controlled trial. BMC Public Health 2017;18(1):11. [DOI] [PMC free article] [PubMed] [Google Scholar]
- Ha AS, Lonsdale C, Lubans DR, Ng JYY. Increasing students’ activity in physical education: results of the self-determined exercise and learning for FITness trial. Medicine & Science in Sports & Exercise 2020;52(3):696-704. [DOI] [PubMed] [Google Scholar]
Haapala 2017 {published data only}
- Haapala HL, Hirvensalo MH, Kulmala J, Hakonen H, Kankaanpaa A, Laine K, et al. Changes in physical activity and sedentary time in the Finnish Schools on the Move program: a quasi-experimental study. Scandinavian Journal of Medicine & Science in Sports 2017;27(11):1442-53. [DOI] [PubMed] [Google Scholar]
Habib‐Mourad 2014 {published data only}
- Habib-Mourad C, Ghandour LA, Moore HJ, Nabhani-Zeidan M, Adetayo K, Hwalla N, et al. Promoting healthy eating and physical activity among school children: findings from Health-E-PALS, the first pilot intervention from Lebanon. BMC Public Health 2014;14:940. [NCT03040271] [DOI] [PMC free article] [PubMed] [Google Scholar]
Haerens 2009 {published data only}
- Haerens L, Maes L, Vereecken C, De Henauw S, Moreno L, De Bourdeaudhuij I. Effectiveness of a computer tailored physical activity intervention in adolescents compared to a generic advice. Patient Education & Counseling 2009;77(1):38-41. [DOI] [PubMed] [Google Scholar]
Hager 2018 {published data only}
- Hager ER, Song HJ, Lane HG, Guo HH, Jaspers LH, Lopes MA. Pilot-testing an intervention to enhance wellness policy implementation in schools: wellness champions for change. Journal of Nutrition Education and Behavior 2018;50(8):765-75. [DOI] [PMC free article] [PubMed] [Google Scholar]
Haible 2019 {published data only}
- Haible S, Volk C, Demetriou Y, Honer O, Thiel A, Trautwein U, et al. Promotion of physical activity-related health competence in physical education: study protocol for the GEKOS cluster randomized controlled trial. BMC Public Health 2019;19(1):396. [DOI] [PMC free article] [PubMed] [Google Scholar]
Haible 2019a {published data only}
- Haible S, Volk C, Demetriou Y, Honer O, Thiel A, Trautwein U, et al. Promotion of physical activity-related health competence in physical education: study protocol for the GEKOS cluster randomized controlled trial. BMC Public Health 2019;19(1):396. [DOI] [PMC free article] [PubMed] [Google Scholar]
Hamilton 2020 {published data only}
- Hamilton KC, Richardson MT, McGraw S, Owens T, Higginbotham JC. A controlled evaluation of a CBPR intervention's effects on physical activity and the related psychosocial constructs among minority children in an underserved community. Journal of Physical Activity and Health 2020;17(1):37-44. [DOI] [PubMed] [Google Scholar]
Hankonen 2016 {published data only}
- Hankonen N, Heino MT, Araujo-Soares V, Sniehotta FF, Sund R, Vasankari T, et al. 'Let's Move It' - a school-based multilevel intervention to increase physical activity and reduce sedentary behaviour among older adolescents in vocational secondary schools: a study protocol for a cluster-randomised trial. BMC Public Health 2016;16:451. [DOI] [PMC free article] [PubMed] [Google Scholar]
Hankonen 2017 {published data only}
- Hankonen N, Heino MT, Hynynen ST, Laine H, Araujo-Soares V, Sniehotta FF, et al. Randomised controlled feasibility study of a school-based multi-level intervention to increase physical activity and decrease sedentary behaviour among vocational school students. International Journal of Behavioral Nutrition and Physical Activity 2017;14:37. [DOI] [PMC free article] [PubMed] [Google Scholar]
Hannah 2018 {published data only}
- Calvert HG, Mahar MT, Flay B, Turner L. Classroom-based physical activity: minimizing disparities in school-day physical activity among elementary school students. Journal of Physical Activity & Health 2018;15(3):161-8. [DOI] [PubMed] [Google Scholar]
Hardman 2014 {published data only}
- Hardman CM, Barros MVG, Lopes AS, Lima, RA, Bezerra J, Nahas MV. Effectiveness of a school-based intervention regarding screen time in high school students [Efetividade de uma intervenção de base escolar sobre o tempo de tela em estudantes do ensino médio]. Brazilian Journal of Kineanthropometry & Human Performance 2014;16:26-35. [Google Scholar]
Hayes 2014 {published data only}
- Hayes A, Lung T, Wen LM, Baur L, Rissel C, Howard K. Economic evaluation of 'healthy beginnings' an early childhood intervention to prevent obesity. Obesity 2014;22(7):1709-15. [DOI] [PubMed] [Google Scholar]
Hebden 2014 {published data only}
- Hebden L, Cook A, Ploeg HP, King L, Bauman A, Allman-Farinelli M. A mobile health intervention for weight management among young adults: a pilot randomised controlled trial. Journal of Human Nutrition and Dietetics 2014;27(4):322-32. [DOI] [PubMed] [Google Scholar]
Hejazi 2017 {published data only}
- Hejazi S, Peyman N, Esmaily H. Effect of educational intervention based on self-efficacy on preventive behaviors of overweight and obesity among secondary-school female students in Mashhad. Iranian Journal of Endocrinology and Metabolism 2017;19(4):261-9. [Google Scholar]
Heo 2018 {published data only}
- Heo M, Jimenez CC, Lim J, Isasi CR, Blank AE, Lounsbury DW, et al. Effective nationwide school-based participatory extramural program on adolescent body mass index, health knowledge and behaviors. BMC Pediatrics 2018;18(7):87. [DOI] [PMC free article] [PubMed] [Google Scholar]
Herbert 2013 {published data only}
- Herbert PC, Lohrmann DK, Seo DC, Stright AD, Kolbe LJ. Effectiveness of the energize elementary school program to improve diet and exercise. Journal of School Health 2013;83(11):780-6. [DOI] [PubMed] [Google Scholar]
Hernández López 2018 {published data only}
- Hernández López JR, Fierro-Suero S, Fernández-Ozcorta EJ, Sáenz-López Buñuel P. Effects of a biodanza program in relation to physical and psychological parameters in Primary Education [Efectos de un programa de biodanza en relación a parámetros físicos y psicológicos en educación primaria]. Journal of Sport Science 2018;14(1):55-64. [Google Scholar]
Hill 2015 {published data only}
- Hill G, Downing A. Effect of frequent peer-monitored testing and personal goal setting on Fitnessgram scores of Hispanic middle school students. Physical Educator 2015;72(2):193-205. [Google Scholar]
Hillman 2014 {published data only}
- Hillman CH, Pontifex MB, Castelli DM, Khan NA, Raine LB, Scudder MR, et al. Effects of the FITKids randomized controlled trial on executive control and brain function. Pediatrics 2014;134(4):e1063-71. [DOI] [PMC free article] [PubMed] [Google Scholar]
Hind 2014 {published data only}
- Hind K, Torgerson D, McKenna J, Ashby R, Daly-Smith A, Truscott J, et al. Developing Interventions for Children's Exercise (DICE): a pilot evaluation of school-based exercise interventions for primary school children aged 7 to 8 years. Journal of Physical Activity and Health 2014;11(4):699-704. [DOI] [PubMed] [Google Scholar]
Hogg 2012 {published data only}
- Hogg J, Diaz A, Del Cid M, Mueller C, Lipman EG, Cheruvu S, et al. An after-school dance and lifestyle education program reduces risk factors for heart disease and diabetes in elementary school children. Journal of Pediatric Endocrinology and Metabolism 2012;25(5-6):509-16. [DOI] [PMC free article] [PubMed] [Google Scholar]
Hortz 2015 {published data only}
- Hortz B, Petosa RL, Grim ML, Stevens E. Building self-efficacy for exercise among rural high school students: it takes ongoing practice. American Journal of Health Education 2015;46(6):351-6. [Google Scholar]
Huberty 2011 {published data only}
- Huberty JL, Siahpush M, Beighle A, Fuhrmeister E, Silva P, Welk G. Ready for recess: a pilot study to increase physical activity in elementary school children. Journal of School Health 2011;81(5):251-7. [DOI] [PubMed] [Google Scholar]
Huberty 2014 {published data only}
- Ehlers DK, Huberty JL, Beseler CL. Is school community readiness related to physical activity before and after the Ready for Recess intervention? Health Education Research 2013;28(2):192-204. [DOI] [PubMed] [Google Scholar]
- Huberty JL, Beets MW, Beighle A, Saint-Maurice PF, Welk G. Effects of ready for recess, an environmental intervention, on physical activity in third- through sixth-grade children. Journal of Physical Activity and Health 2014;11(2):384-95. [DOI] [PubMed] [Google Scholar]
- Huberty JL, Beets MW, Beighle A, Welk G. Environmental modifications to increase physical activity during recess: preliminary findings from ready for recess. Journal of Physical Activity and Health 2011;8 Suppl 2:S249-56. [PubMed] [Google Scholar]
- Saint-Maurice PF, Welk GJ, Russell DW, Huberty J. Moderating influences of baseline activity levels in school physical activity programming for children: the Ready for Recess project. BMC Public Health 2014;14:103. [DOI] [PMC free article] [PubMed] [Google Scholar]
Hyde 2020 {published data only}
- Hyde ET, Gazmararian JA, Barrett-Williams SL, Kay CM. Health empowers you: impact of a school-based physical activity program in elementary school students, Georgia, 2015-2016. Journal of School Health 2020;90(1):32-8. [DOI] [PubMed] [Google Scholar]
Idris 2015 {published data only}
- Idris NS, Evelein AM, Geerts CC, Sastroasmoro S, Grobbee DE, Uiterwaal CS. Effect of physical activity on vascular characteristics in young children. European Journal of Preventive Cardiology 2015;22(5):656-64. [DOI] [PubMed] [Google Scholar]
Ilyasova 2014 {published data only}
- Ilyasova A, Erzhanov Z. Optimization of physical fitness development for primary school learners in physical education lessons. Baltic Journal of Sport and Health Sciences 2014;93(2):21-8. [Google Scholar]
Ilyasova 2015 {published data only}
- Ilyasova A, Kovalenko V, Erzhanov Z. Optimization methods in physical education lessons for girls in the second and the third grades. Baltic Journal of Sport & Health Sciences 2015;96(1):16-22. [Google Scholar]
Ingrida 2012 {published data only}
- Ingrida S. Teacher role model and students' physical activity. Polish Journal of Sport & Tourism 2012;19(4):281-6. [Google Scholar]
ISRCTN75118772 {published data only}
- Moving Maths: physically active maths lessons. 2019. http://www.who.int/trialsearch/Trial2.aspx?TrialID=ISRCTN75118772.
Jago 2012 {published data only}
- Jago R, Sebire SJ, Cooper AR, Haase AM, Powell J, Davis L, et al. Bristol girls dance project feasibility trial: outcome and process evaluation results. International Journal of Behavioral Nutrition and Physical Actvity 2012;9:83. [DOI] [PMC free article] [PubMed] [Google Scholar]
Jamerson 2017 {published data only}
- Jamerson T, Sylvester R, Jiang Q, Corriveau N, DuRussel-Weston J, Kline-Rogers E, et al. Differences in cardiovascular disease risk factors and health behaviors between black and non-black students participating in a school-based health promotion program. American Journal of Health Promotion 2017;31(4):318-24. [DOI] [PubMed] [Google Scholar]
James 2017 {published data only}
- James M, Christian D, Scott S, Todd C, Stratton G, Demmler J, et al. Active children through individual vouchers evaluation: a mixed-method RCT. American Journal of Preventive Medicine 2020;58(2):232-43. [DOI] [PMC free article] [PubMed] [Google Scholar]
- James M, Christian D, Scott S, Todd C, Stratton G, McCoubrey S, et al. Active children through individual vouchers - evaluation (ACTIVE): protocol for a mixed method randomised control trial to increase physical activity levels in teenagers. BMC Public Health 2017;18(1):7. [DOI] [PMC free article] [PubMed] [Google Scholar]
James‐Burdumy 2016 {published data only}
- James-Burdumy S, Beyler N, Borradaile K, Bleeker M, Maccarone A, Fortson J. The Impact of Playworks on students' physical activity by race/ethnicity: findings from a randomized controlled trial. Journal of Physical Activity and Health 2016;13(3):275-80. [DOI] [PubMed] [Google Scholar]
Janssen 2015 {published data only}
- Janssen M, Twisk JW, Toussaint HM, Mechelen W, Verhagen EA. Effectiveness of the PLAYgrounds programme on PA levels during recess in 6-year-old to 12-year-old children. British Journal of Sports Medicine 2015;49(4):259-64. [DOI] [PubMed] [Google Scholar]
Jemmott 2019a {published data only}
- Jemmott JB, Zhang J, Jemmott LS, Icard LD, Ngwane Z, Makiwane M, et al. Intervention increases physical activity and healthful diet among South African adolescents over 54 months: a randomized controlled trial. Journal of Adolescent Health 2019;65(1):139-46. [DOI] [PMC free article] [PubMed] [Google Scholar]
Jenkinson 2012 {published data only}
- Jenkinson KA, Naughton G, Benson AC. The GLAMA (Girls! Lead! Achieve! Mentor! Activate!) physical activity and peer leadership intervention pilot project: a process evaluation using the RE-AIM framework. BMC Public Health 2012;12:55. [DOI] [PMC free article] [PubMed] [Google Scholar]
Jian 2014 {published data only}
- Jian Y. An experimental research on the effect of exercise intervention on primary school pupils' body shape and composition. Journal of Chengdu Sport University 2014;40(9):77-82. [Google Scholar]
Johnston 2013 {published data only}
- Johnston CA, Moreno JP, Gallagher MR, Wang J, Papaioannou MA, Tyler C, et al. Achieving long-term weight maintenance in Mexican-American adolescents with a school-based intervention. Journal of Adolescent Health 2013;53(3):335-41. [DOI] [PubMed] [Google Scholar]
Jones 2008 {published data only}
- Jones D, Hoelscher DM, Kelder SH, Hergenroeder A, Sharma SV. Increasing physical activity and decreasing sedentary activity in adolescent girls - the Incorporating More Physical Activity and Calcium in Teens (IMPACT) Study. International Journal of Behavioral Nutrition and Physical Activity 2008;5:42. [DOI] [PMC free article] [PubMed] [Google Scholar]
Jones 2015 {published data only}
- Jones RA, Kelly J, Cliff DP, Batterham M, Okely AD. Acceptability and potential efficacy of single-sex after-school activity programs for overweight and at-risk children: the Wollongong SPORT RCT. Pediatric Exercise Science 2015;27(4):535-45. [DOI] [PubMed] [Google Scholar]
Jones 2016 {published data only}
- Jones RA, Okely AD, Hinkley T, Batterham M, Burke C. Promoting gross motor skills and physical activity in childcare: a translational randomized controlled trial. Journal of Science and Medicine in Sport 2016;19(9):744-9. [DOI] [PubMed] [Google Scholar]
Jones 2020 {published data only}
- Jones E, Zuest L, Bulger S, Elliott E, Cho K, Lilly C. Initial findings of a multicomponent school health intervention in rural Appalachia: the Greenbrier CHOICES project. Health Education Behavior 2020;47(2):332-43. [DOI] [PMC free article] [PubMed] [Google Scholar]
Jurak 2013 {published data only}
- Jurak G, Cooper A, Leskosek B, Kovac M. Long-term effects of 4-year longitudinal school-based physical activity intervention on the physical fitness of children and youth during 7-year followup assessment. Central European Journal of Public Health 2013;21(4):190-5. [DOI] [PubMed] [Google Scholar]
Jussila 2015 {published data only}
- Jussila AM, Vasankari T, Paronen O, Sievanen H, Tokola K, Vaha-Ypya H, et al. KIDS OUT! Protocol of a brief school-based intervention to promote physical activity and to reduce screen time in a sub-cohort of Finnish eighth graders. BMC Public Health 2015;15:634. [DOI] [PMC free article] [PubMed] [Google Scholar]
Kahan 2018 {published data only}
- Kahan D, McKenzie TL. Physical activity and psychological correlates during an after-school running club. American Journal of Health Education 2018;49(2):113-23. [Google Scholar]
Kahan 2019 {published data only}
- Kahan D, Lorenz KA, Kawwa E, Rioveros A. Changes in school-day step counts during a physical activity for Lent intervention: a cluster randomized crossover trial of the Savior's Sandals. BMC Public Health 2019;19(1):141. [DOI] [PMC free article] [PubMed] [Google Scholar]
Kahlin 2014 {published data only}
- Kahlin Y, Werner S, Alricsson M. A physical activity program for Swedish physically inactive female high school students: a controlled intervention study. Journal of Physical Activity and Health 2014;11(6):1162-9. [DOI] [PubMed] [Google Scholar]
Karachle 2017 {published data only}
- Karachle N, Dania A, Venetsanou F. Effects of a recreational gymnastics program on the motor proficiency of young children. Science of Gymnastics Journal 2017;9(1):17-25. [Google Scholar]
Kawabata 2018 {published data only}
- Kawabata M, Chua KL, Chatzisarantis NL. A school-based intervention program in promoting leisure-time physical activity: trial protocol. BMC Public Health 2018;18(1):433. [DOI] [PMC free article] [PubMed] [Google Scholar]
Keihner 2017 {published data only}
- Keihner A, Rosen N, Wakimoto P, Goldstein L, Sugerman S, Hudes M, et al. Impact of California Children's Power Play! campaign on fruit and vegetable intake and physical activity among fourth- and fifth-grade students. American Journal of Health Promotion 2017;31(3):189-91. [DOI] [PubMed] [Google Scholar]
Kelly 2014 {published data only}
- Kelly LA, McNeil AS, Kennedy B, Carney B, Atkins A, Mostoles BM, et al. Group randomized trial of a novel physical activity program to increase physical fitness and motor skills In children. Journal of Athletic Enhancement 2014;3:2. [Google Scholar]
Kennedy 2018 {published data only}
- Kennedy SG, Smith JJ, Morgan PJ, Peralta LR, Hilland TA, Eather N, et al. Implementing resistance training in secondary schools: a cluster randomized controlled trial. Medicine & Science in Sport & Exercise 2018;50(1):62-72. [DOI] [PubMed] [Google Scholar]
Kennedy 2019 {published data only}
- Kennedy SG, Peralta LR, Lubans DR, Foweather L, Smith JS. Implementing a school-based physical activity program: process evaluation and impact on teachers' confidence, perceived barriers and self-perceptions. Physical Education & Sport Pedagogy 2019;24(3):233-48. [Google Scholar]
Ketelhut 2017 {published data only}
- Ketelhut SR, Ketelhut S, Riedel S, Willich S, Meyer-Sabellek W, Müssig K, et al. Effects of moderate interval training on heart rate variability among primary school children [Auswirkung einer moderaten Intervallbelastung auf die Herzfrequenzvariabilität bei Grundschulkindern]. Deutsche Zeitschrift für Sportmedizin 2017;68(11):269-74. [Google Scholar]
Kidokoro 2019 {published data only}
- Kidokoro T, Shimizu Y, Edamoto K, Annear M. Classroom standing desks and time-series variation in sedentary behavior and physical activity among primary school children. International Journal of Environmental Research and Public Health 2019;16(11):1892. [DOI] [PMC free article] [PubMed] [Google Scholar]
Kipping 2008 {published data only}
- Kipping RR, Payne C, Lawlor DA. Randomised controlled trial adapting US school obesity prevention to England. Archives of Disease in Childhood 2008;93(6):469-73. [DOI] [PubMed] [Google Scholar]
Klakk 2013 {published data only}
- Klakk H, Chinapaw M, Heidemann M, Andersen LB, Wedderkopp N. Effect of four additional physical education lessons on body composition in children aged 8-13 years - a prospective study during two school years. BMC Pediatrics 2013;13:170. [DOI] [PMC free article] [PubMed] [Google Scholar]
Knox 2012 {published data only}
- Knox GJ, Baker JS, Davies B, Rees A, Morgan K, Cooper SM, et al. Effects of a novel school-based cross-curricular physical activity intervention on cardiovascular disease risk factors in 11- to 14-year-olds: the activity knowledge circuit. American Journal of Health Promotion 2012;27(2):75-83. [DOI] [PubMed] [Google Scholar]
Kobel 2017 {published data only}
- Kobel S, Lammle C, Wartha O, Kesztyus D, Wirt T, Steinacker JM. Effects of a randomised controlled school-based health promotion intervention on obesity related behavioural outcomes of children with migration background. Journal of Immigrant and Minority Health 2017;19(2):254-62. [DOI] [PMC free article] [PubMed] [Google Scholar]
Koch 2019 {published data only}
- Koch PA, Contento IR, Gray HL, Burgermaster M, Bandelli L, Abrams E, et al. Food, health, & choices: curriculum and wellness interventions to decrease childhood obesity in fifth-graders. Journal of Nutrition Education and Behavior 2019;51(4):440-55. [DOI] [PubMed] [Google Scholar]
Kokkonen 2019 {published data only}
- Kokkonen J, Yli-Piipari S, Kokkonen M, Quay J. Effectiveness of a creative physical education intervention on elementary school students’ leisure-time physical activity motivation and overall physical activity in Finland. European Physical Education Review 2019;25(3):796-815. [Google Scholar]
Kokkonen 2019a {published data only}
- Kokkonen J, Yli-Piipari S, Kokkonen M, Quay J. Effectiveness of a creative physical education intervention on elementary school students' leisure-time physical activity motivation and overall physical activity in Finland. European Physical Education Review 2019;25(3):796-815. [Google Scholar]
Kong 2016 {published data only}
- Kong A, Buscemi J, Stolley MR, Schiffer LA, Kim Y, Braunschweig CL, et al. Hip-Hop to Health Jr. randomized effectiveness trial: 1-year follow-up results. American Journal of Preventive Medicine 2016;50(2):136-44. [DOI] [PMC free article] [PubMed] [Google Scholar]
Konijnenberg 2018 {published data only}
- Konijnenberg C, Fredriksen PM. The effects of a school-based physical activity intervention programme on children's executive control: the Health Oriented Pedagogical Project (HOPP). Scandinavian Journal of Public Health 2018;46(21 Suppl):82-91. [DOI] [PubMed] [Google Scholar]
Kopaev 2015 {published data only}
- Kopaev VP, Bryl DA. The effect of combination of general education and sports related physical education of primary school children. Teoria i Praktika Fiziceskoj Kultury 2015;6:62-4. [Google Scholar]
Krawiec 2013 {published data only}
- Krawiec K, McClurg King K. Rural elementary school strategies to promote outdoor physical activity. KAHPERD Journal 2013;50(2):46. [Google Scholar]
Kremer 2011 {published data only}
- Kremer P, Waqa G, Vanualailai N, Schultz JT, Roberts G, Moodie M, et al. Reducing unhealthy weight gain in Fijian adolescents: results of the Healthy Youth Healthy Communities study. Obesity Reviews 2011;12 Suppl 2:29-40. [DOI] [PubMed] [Google Scholar]
Kriellaars 2019 {published data only}
- Kriellaars DJ, Cairney J, Bortoleto MAC, Kiez TKM, Dudley D, Aubertin P. The impact of circus arts instruction in physical education on the physical literacy of children in grades 4 and 5. Journal of Teaching in Physical Education 2019;38(2):162-70. [Google Scholar]
Ladapo 2016 {published data only}
- Ladapo JA, Bogart LM, Klein DJ, Cowgill BO, Uyeda K, Binkle DG, et al. Cost and cost-effectiveness of Students for Nutrition and eXercise (SNaX). Academic Pediatrics 2016;16(3):247-53. [DOI] [PMC free article] [PubMed] [Google Scholar]
Lane 2018 {published data only}
- Lane HG, Deitch R, Wang Y, Black MM, Dunton FG, Aldoory L, et al. "Wellness Champions for Change," a multi-level intervention to improve school-level implementation of local wellness policies: study protocol for a cluster randomized trial. Contemporary Clinical Trials 2018;75:29-39. [DOI: ] [DOI] [PMC free article] [PubMed] [Google Scholar]
Lang 2017 {published data only}
- Lang C, Feldmeth AK, Brand S, Holsboer-Trachsler E, Puhse U, Gerber M. Effects of a physical education-based coping training on adolescents' coping skills, stress perceptions and quality of sleep. Physical Education and Sport Pedagogy 2017;22(3):213-30. [Google Scholar]
Larsen 2017 {published data only}
- Larsen MN, Nielsen CM, Orntoft C, Randers MB, Helge EW, Madsen M, et al. Fitness effects of 10-month frequent low-volume ball game training or interval running for 8-10-year-old school children. Biomedical Research International 2017;2017:2719752. [DOI] [PMC free article] [PubMed] [Google Scholar]
La Torre 2016 {published data only}
- La Torre G, Mannocci A, Saulle R, Sinopoli A, D'Egidio V, Sestili C, et al. GiochiAMO! The protocol of a school based intervention for the promotion of physical activity and nutrition among children [GiochiAMO! Muoviamoci e mangiamo sano! La promozione dell’attività fisica e della piramide alimentare per i bambini: protocollo di una sperimentazione di campo]. Clinical Therapeutics 2016;167(5):152-5. [DOI] [PubMed] [Google Scholar]
- La Torre G, Mannocci A, Saulle R, Sinopoli A, D’Egidio V, Sestili C, et al. Improving knowledge and behaviors on diet and physical activity in children: results of a pilot randomized field trial. Annali di Igiene: Medicina Preventiva e di Comunita 2017;29:584-94. [DOI] [PubMed] [Google Scholar]
- La Torre G, Sinopoli A, Sestili C, D'Egidio V, di Bella O, Cocchiara R, et al. “GiochiAMO”: a school-based smoking and alcohol prevention program for children – a pilot randomized field trial. Part 2. Annali di Igiene: Medicina Preventiva e di Comunita 2018;30(4):273-84. [DOI] [PubMed] [Google Scholar]
Lazorick 2015 {published data only}
- Lazorick S, Fang X, Hardison GT, Crawford Y. Improved body mass index measures following a middle school-based obesity intervention-the MATCH Program. Journal of School Health 2015;85(10):680-7. [DOI] [PubMed] [Google Scholar]
Lee 2012 {published data only}
- Lee LL, Kuo YC, Fanaw D, Perng SJ, Juang IF. The effect of an intervention combining self-efficacy theory and pedometers on promoting physical activity among adolescents. Journal of Clinical Nursing 2012;21(7-8):914-22. [DOI] [PubMed] [Google Scholar]
Leme 2016 {published data only}
- Leme AC, Lubans DR, Guerra PH, Dewar D, Toassa EC, Philippi ST. Preventing obesity among Brazilian adolescent girls: six-month outcomes of the Healthy Habits, Healthy Girls-Brazil school-based randomized controlled trial. Preventive Medicine 2016;86:77-83. [DOI] [PubMed] [Google Scholar]
Lennox 2013 {published data only}
- Lennox A, Pienaar AE. Effects of an after-school physical activity programme on aerobic fitness and physical activity levels of adolescents from a disadvantaged community: PLAY study. African Journal for Physical, Health Education, Recreation & Dance 2013;19(1):154-68. [Google Scholar]
Leung 2018 {published data only}
- Leung W, Jung J, Kang S, Cardinal BJ. Does movement integration into classroom lessons work? And are teachers receptive? Journal of Physical Education, Recreation & Dance 2018;89(5):70-1. [Google Scholar]
Li 2010 {published data only}
- Li YP, Hu XQ, Schouten EG, Liu AL, Du SM, Li LZ, et al. Report on childhood obesity in China (8): effects and sustainability of physical activity intervention on body composition of Chinese youth. Biomedical and Environmental Sciences 2010;23:180-7. [DOI] [PubMed] [Google Scholar]
Li 2017 {published data only}
- Li B, Liu W J, Adab P, Pallan M, Hemming K, Frew E, et al. Cluster-randomised controlled trial to assess the effectiveness and cost-effectiveness of an obesity prevention programme for Chinese primary school-aged children: the CHIRPY DRAGON study protocol. BMJ Open 2017;7(11):e018415. [DOI] [PMC free article] [PubMed] [Google Scholar]
Liao 2019 {published data only}
- Liao T, Li L, Wang YT. Effects of functional strength training program on movement quality and fitness performance among girls aged 12-13 years. Journal of Strength and Conditioning Research 2019;33(6):1534-41. [DOI] [PubMed] [Google Scholar]
Liu 2019 {published data only}
- Liu Z, Wu Y, Niu W Y, Feng X, Lin Y, Gao A, et al. A school-based, multi-faceted health promotion programme to prevent obesity among children: protocol of a cluster-randomised controlled trial (the DECIDE-Children study). BMJ Open 2019;9(11):e027902. [DOI] [PMC free article] [PubMed] [Google Scholar]
Llargues 2011 {published data only}
- Llargues E, Franco R, Recasens A, Nadal A, Vila M, Perez MJ, et al. Assessment of a school-based intervention in eating habits and physical activity in school children: the AVall study. Journal of Epidemiology and Community Health 2011;65(10):896-901. [DOI] [PMC free article] [PubMed] [Google Scholar]
Llaurado 2014 {published data only}
- Llaurado E, Tarro L, Morina D, Queral R, Giralt M, Sola R. EdAl-2 (Educacio en Alimentacio) programme: reproducibility of a cluster randomised, interventional, primary-school-based study to induce healthier lifestyle activities in children. BMJ Open 2014;4(11):e005496. [DOI] [PMC free article] [PubMed] [Google Scholar]
Llaurado 2018 {published data only}
- Llaurado E, Tarro L, Morina D, Aceves-Martins M, Giralt M, Sola R. Follow-up of a healthy lifestyle education program (the EdAl study): four years after cessation of randomized controlled trial intervention. BMC Public Health 2018;18(1):104. [DOI] [PMC free article] [PubMed] [Google Scholar]
Lloyd 2017 {published data only}
- Lloyd J, Creanor S, Price L, Abraham C, Dean S, Green C, et al. Trial baseline characteristics of a cluster randomised controlled trial of a school-located obesity prevention programme; the Healthy Lifestyles Programme (HeLP) trial. BMC Public Health 2017;17(1):291. [DOI] [PMC free article] [PubMed] [Google Scholar]
- Lloyd JJ, Wyatt KM, Creanor S. Behavioural and weight status outcomes from an exploratory trial of the Healthy Lifestyles Programme (HeLP): a novel school-based obesity prevention programme. BMJ Open 2012;2(3):e000390. [DOI] [PMC free article] [PubMed] [Google Scholar]
Lofgren 2013 {published data only}
- Lofgren B, Daly RM, Nilsson JA, Dencker M, Karlsson MK. An increase in school-based physical education increases muscle strength in children. Medicine & Science in Sports & Exercise 2013;45(5):997-1003. [DOI] [PubMed] [Google Scholar]
Lonsdale 2013 {published data only}
- Lonsdale C, Rosenkranz RR, Sanders T, Peralta LR, Bennie A, Jackson B, et al. A cluster randomized controlled trial of strategies to increase adolescents' physical activity and motivation in physical education: results of the Motivating Active Learning in Physical Education (MALP) trial. Preventive Medicine 2013;57(5):696-702. [DOI] [PubMed] [Google Scholar]
Lonsdale 2019 {published data only}
- Lonsdale C, Lubans D, Sanders T, Noetel M, McKay H, Morgan P, et al. Scaling-up an efficacious comprehensive school-based physical activity intervention: development, evaluation and dissemination of the iPLAY program. Journal of Science and Medicine in Sport 2019;22:S14. [Google Scholar]
Lopes 2017 {published data only}
- Lopes VP, Stodden DF, Rodrigues LP. Effectiveness of physical education to promote motor competence in primary school children. Physical Education and Sport Pedagogy 2017;22(6):589-602. [Google Scholar]
López Sánchez 2017 {published data only}
- López Sánchez GF, Díaz Suárez A, Radzimiński Ł, Jastrzębski Z. Effects of a 12-week physical education program on the body composition of 10- and 11-year-old children [Effets d’un programme d’éducation physique de 12 semaines sur la composition corporelle d’enfants de 10 et 11 ans]. Science & Sports 2017;32(4):e155-61. [Google Scholar]
López Sánchez 2018 {published data only}
- López Sánchez G, Felipe N, López J, Díaz Suárez A. Effects of a program through vigorous-intensity physical activity on blood pressure and heart rate of 10-11 year-old school children [Efectos de un Programa de Actividad Física Vigorosa en la Tensión Arterial y Frecuencia Cardiaca de Escolares de 10-11 Años]. Journal of Sport and Health Research 2018;10(1):13-24. [Google Scholar]
Lubans 2009 {published data only}
- Lubans D, Morgan P. Evaluation of an extra-curricular school sport programme promoting lifestyle and lifetime activity for adolescents. Journal of Sports Sciences 2008;26(5):519-29. [DOI] [PubMed] [Google Scholar]
- Lubans D, Morgan P. The 'Learning to Enjoy Activity with Friends' programme. Education & Health 2007;25(1):10-4. [Google Scholar]
- Lubans DR, Morgan PJ, Callister R, Collins CE, Plotnikoff RC. Exploring the mechanisms of physical activity and dietary behavior change in the Program X intervention for adolescents. Journal of Adolescent Health 2010;47(1):83-91. [DOI] [PubMed] [Google Scholar]
- Lubans DR, Morgan PJ, Callister R, Collins CE. Effects of integrating pedometers, parental materials, and E-mail support within an extracurricular school sport intervention. Journal of Adolescent Health 2009;44(2):176-83. [DOI] [PubMed] [Google Scholar]
- Lubans DR, Sylva K. Mediators of change following a senior school physical activity intervention. Journal of Science & Medicine in Sport 2009;12(1):134-40. [DOI] [PubMed] [Google Scholar]
Lubans 2011 {published data only}
- Lubans DR, Morgan PJ, Aguiar EJ, Callister R. Randomized controlled trial of the Physical Activity Leaders (PALs) program for adolescent boys from disadvantaged secondary schools. Preventive Medicine 2011;52(3-4):239-46. [DOI] [PubMed] [Google Scholar]
Lubans 2012b {published data only}
- Lubans DR, Morgan PJ, Okely AD, Dewar D, Collins CE, Batterham M, et al. Preventing obesity among adolescent girls: one-year outcomes of the nutrition and enjoyable activity for teen girls (NEAT Girls) cluster randomized controlled trial. Archives of Pediatrics and Adolescent Medicine 2012;166(9):821-7. [DOI] [PubMed] [Google Scholar]
Lubans 2012c {published data only}
- Lubans D, Morgan P, Okely A, Dewar D, Collins C, Batterham M, et al. Preventing obesity among adolescent girls in low income secondary schools: One-year outcomes of the NEAT Girls cluster randomized controlled trial. Obesity Research and Clinical Practice 2012;6:39. [DOI] [PubMed] [Google Scholar]
Lubans 2013 {published data only}
- Lubans D, Dewar D, Morgan P, Plotnikoff R, Okely A, Collins C, et al. Two-year outcomes from the NEAT Girls obesity prevention cluster randomized controlled trial. Journal of Science and Medicine in Sport 2013;16:e34. [Google Scholar]
Lubans 2014 {published data only}
- Lubans D, Smith J, Plotnikoff R, Dally K, Salmon J, Okely A, et al. Outcomes from the ATLAS school-based intervention incorporating smartphone technology for adolescent boys: a cluster RCT. Journal of Science and Medicine in Sport 2014;18:e63. [Google Scholar]
Lubans 2015 {published data only}
- Lubans D, Smith J, Morgan P, Beauchamp M, Miller A, Lonsdale C, et al. Improving muscular fitness enhances psychological well-being in low-income adolescent boys: findings from the ATLAS cluster RCT. Journal of Science and Medicine in Sport 2015;19:e75. [Google Scholar]
Lubans 2016 {published data only}
- Lubans DR, Smith JJ, Plotnikoff RC, Dally KA, Okely AD, Salmon J, et al. Assessing the sustained impact of a school-based obesity prevention program for adolescent boys: the ATLAS cluster randomized controlled trial. International Journal of Behavioral Nutrition and Physical Activity 2016;13:92. [DOI] [PMC free article] [PubMed] [Google Scholar]
Lucertini 2013 {published data only}
- Lucertini F, Spazzafumo L, De Lillo F, Centonze D, Valentini M, Federici A. Effectiveness of professionally-guided physical education on fitness outcomes of primary school children. European Journal of Sport Science 2013;13(5):582-90. [DOI] [PubMed] [Google Scholar]
Ludyga 2019 {published data only}
- Luyga S, Koutsandreou F, Reuter EM, Voelcker-Rehage C, Budde H. Additional exercise at school - effects on cognitive performance, emotional well-being and steroid hormones: effects on brain activity during a cognitive inhibition task. Journal of Clinical Medicine 2019;8(2):184. [DOI] [PMC free article] [PubMed] [Google Scholar]
Lynch 2016 {published data only}
- Lynch BA, Gentile N, Maxson J, Quigg S, Swenson L, Kaufman T. Elementary school-based obesity intervention using an educational curriculum. Journal of Primary Care & Community Health 2016;7(4):265-71. [DOI] [PMC free article] [PubMed] [Google Scholar]
Madsen 2013 {published data only}
- Madsen K, Thompson H, Adkins A, Crawford Y. School-community partnerships: a cluster-randomized trial of an after-school soccer program. JAMA Pediatrics 2013;167(4):321-6. [DOI] [PMC free article] [PubMed] [Google Scholar]
Madsen 2020 {published data only}
- Madsen M, Elbe AM, Madsen EE, Ermidis G, Ryom K, Wikman JM, et al. The "11 for Health in Denmark" intervention in 10- to 12-year-old Danish girls and boys and its effects on well-being - a large-scale cluster RCT. Scandinavian Journal of Medicine & Science in Sports 2020;30(9):1787-95. [DOI] [PubMed] [Google Scholar]
Mandarić 2011 {published data only}
- Mandarić S, Sibinović A, Stojiljković S. Effects of a high-low aerobic program on the morphological features, functional and motor abilities of female elementary school eighth graders. Facta Universitatis: Series Physical Education & Sport 2011;9(3):307-19. [Google Scholar]
Mandigo 2019 {published data only}
- Mandigo J, Lodeqyk K, Tredway J. Examining the impact of a teaching games for understanding approach on the development of physical literacy using the passport for life assessment tool. Journal of Teaching in Physical Education 2019;38(2):136-45. [Google Scholar]
Manley 2014 {published data only}
- Manley D, Cowan P, Graff C, Perlow M, Rice P, Richey P, et al. Self-efficacy, physical activity, and aerobic fitness in middle school children: examination of a pedometer intervention program. Journal of Pediatric Nursing 2014;29(3):228-37. [DOI] [PubMed] [Google Scholar]
Marandi 2014 {published data only}
- Marandi S, Minasian V, Kelishadi R, Khalighinejad P, Borojeni MM, Borghi SH. Short-term effects of a physical activity intervention on obesity and cardiovascular fitness of 12-14-year-old boy students. International Journal of Preventive Medicine 2014;5:S114-9. [DOI] [PMC free article] [PubMed] [Google Scholar]
Marin 2013 {published data only}
- Marin F. Conditional motor capacity - resistance at pupils of 13-14 ages during the physical education lesson. Ovidius University Annals, Series Physical Education & Sport/Science, Movement & Health 2013;13:460-5. [Google Scholar]
Martin 2017 {published data only}
- Martin R, Murtagh E. Active classrooms: a cluster randomized controlled trial evaluating the effects of a movement integration intervention on the physical activity levels of primary school children. Journal of Physical Activity and Health 2017;14(4):290-300. [DOI] [PubMed] [Google Scholar]
Martinez 2008 {published data only}
- Martinez VM, Aguilar FS, Gutierrez RF, Martinez MS, Lopez MS, Martinez SS, et al. Assessment of an after-school physical activity program to prevent obesity among 9- to 10-year-old children: a cluster randomized trial. International Journal of Obesity 2008;32:12-22. [DOI] [PubMed] [Google Scholar]
- Moya Martinez P, Sánchez López M, López Bastida J, Escribano Sotos F, Notario Pacheco B, Salcedo Aguilar F, et al. Cost-effectiveness of an intervention to reduce overweight and obesity in 9-10-year-olds. The Cuenca study [Coste-efectividad de un programa de actividad física de tiempo libre para prevenir el sobrepeso y la obesidad en ninos de 9-10 a ˜ nos]. Gaceta Sanitaria 2011;25(3):198-204. [DOI] [PubMed] [Google Scholar]
Martinez‐Vizcaino 2019a {published data only}
- Martinez-Vizcaino V, Alvarez-Bueno C, Cavero-Redondo I, Pozuelo-Carrascosa DP, Garrido-Miguel M, Martinez-Hortelano JA, et al. MOVI-daFIT! Intervention: rationale and design of a cluster randomized controlled trial testing the effects on improving adiposity, cognition, and subclinical atherosclerosis by increasing cardiorespiratory fitness in children. Medicine (Baltimore) 2019;98(9):e14737. [DOI] [PMC free article] [PubMed] [Google Scholar]
Martinez‐Vizcaino 2020 {published data only}
- Martinez-Vizcaino V, Pozuelo-Carrascosa DP, Garcia-Prieto JC, Cavero-Redondo I, Solera-Martinez M, Garrido-Miguel M, et al. Effectiveness of a school-based physical activity intervention on adiposity, fitness and blood pressure: MOVI-KIDS study. British Journal of Sports Medicine 2020;54(5):279-85. [DOI] [PubMed] [Google Scholar]
Masse 2012 {published data only}
- Masse LC, McKay H, Valente M, Brant R, Naylor PJ. Physical activity implementation in schools: a 4-year follow-up. American Journal of Preventive Medicine 2012;43(4):369-77. [DOI] [PubMed] [Google Scholar]
Massey 2017 {published data only}
- Massey WV, Stellino MB, Holliday M, Godbersen T, Rodia R, Kucher G, et al. The impact of a multi-component physical activity programme in low-income elementary schools. Health Education Journal 2017;76(5):517-30. [Google Scholar]
Maszczak 2013 {published data only}
- Maszczak T. On the project of National Center for Research on Physical Fitness [O projekcie Narodowego Centrum Badania Kondycji Fizycznej]. Rozprawy Naukowe 2013;40:14-6. [Google Scholar]
Mavilidi 2019 {published data only}
- Mavilidi MF, Lubans DR, Morgan PJ, Miller A, Eather N, Karayanidis F, et al. Integrating physical activity into the primary school curriculum: rationale and study protocol for the "Thinking while Moving in English" cluster randomized controlled trial. BMC Public Health 2019;19(1):379. [DOI] [PMC free article] [PubMed] [Google Scholar]
Mayorga‐Vega 2016 {published data only}
- Mayorga-Vega D, Montoro-Escano J, Merino-Marban R, Viciana J. Effects of a physical education-based programme on health-related physical fitness and its maintenance in high school students: a cluster-randomized controlled trial. European Physical Education Review 2016;22(2):243-59. [Google Scholar]
Mayorga‐Vega 2020 {published data only}
- Mayorga-Vega D, Montoro-Escaño J, Guijarro-Romero S, Viciana J. Does baseline self-determined motivation toward physical education influence cardiorespiratory endurance improvement? A controlled intervention study [¿El nivel basal de motivación autodeterminada hacia la Educación Física influye en la mejora de la resistencia cardiorrespiratoria? Un estudio de intervención controlado]. Retos: Nuevas Perspectivas de Educación Física, Deporte y Recreación 2020;37:344-50. [Google Scholar]
Mazzoli 2019 {published data only}
- Mazzoli E, Salmon J, Teo W, Pesce C, He J, Ben-Soussan T, et al. The mediating effects of breaking up classroom sitting with cognitively engaging or simple active breaks on children's cognition. Journal of Science and Medicine in Sport 2019;22:S22-3. [Google Scholar]
McCluskey 2020 {published data only}
- McCluskey M, Bridges J, Gilson N, Buurke JH, Hermens HJ, Yan AD. The effects of physical activity on weight gain and educational attainment in primary school children. Physiotherapy 2020;107:e215. [Google Scholar]
McCreary 2012 {published data only}
- McCreary LL, Park CG, Gomez L, Peterson S, Pino D, McElmurry BJ. A mixed-methods evaluation of school-based active living programs. American Journal of Preventive Medicine 2012;43(5 Suppl 4):S395-8. [DOI] [PubMed] [Google Scholar]
McDonald 2015 {published data only}
- McDonald SM, Trost SG. The effects of a goal setting intervention on aerobic fitness in middle school students. Journal of Teaching in Physical Education 2015;34(4):576-87. [Google Scholar]
McFarlin 2013 {published data only}
- McFarlin BK, Johnston CJ, Carpenter KC, Davidson T, Moreno JL, Strohacker K, et al. A one-year school-based diet/exercise intervention improves non-traditional disease biomarkers in Mexican-American children. Maternal & Child Nutrition 2013;9(4):524-32. [DOI] [PMC free article] [PubMed] [Google Scholar]
McKay 2015 {published data only}
- McKay HA, Macdonald HM, Nettlefold L, Masse LC, Day M, Naylor PJ. Action Schools! BC implementation: from efficacy to effectiveness to scale-up. British Journal of Sports Medicine 2015;49(4):210-8. [DOI] [PubMed] [Google Scholar]
McLoughlin 2017 {published data only}
- McLoughlin G, Edwards C, Covello A, Baumgartner N, Curran M, Graber K, et al. School lunch and physical activity during recess: interactive effects of health behaviors in the school setting. FASEB Journal 2017;31:149. [Google Scholar]
McManus 2008 {published data only}
- McManus AM, Masters RSW, Laukkanen RMT, Yu CCW, Sit CHP, Ling FCM. Using heart-rate feedback to increase physical activity in children. Preventive Medicine 2008;47(4):402-8. [DOI] [PubMed] [Google Scholar]
McMinn 2012 {published data only}
- McMinn D, Rowe DA, Murtagh S, Nelson NM. The effect of a school-based active commuting intervention on children's commuting physical activity and daily physical activity. Preventive Medicine 2012;54(5):316-8. [DOI] [PubMed] [Google Scholar]
Meinhardt 2013 {published data only}
- Meinhardt U, Witassek F, Petro R, Fritz C, Eiholzer U. Strength training and physical activity in boys: a randomized trial. Pediatrics 2013;132(6):1105-11. [DOI] [PubMed] [Google Scholar]
Mejia 2017 {published data only}
- Mejia MA, Coria-Navia A, Uriegas-Mejia G, Brown-Fraser SC, Uriegas SE, Martinez MD, et al. The Victoria trial: a school-based health education program to reduce the risk of obesity among a high-risk population. Faseb Journal 2017;31:641.1. [Google Scholar]
Mekic 2014 {published data only}
- Mekic B, Aleksic D, Toskic L. Examination of effects of rhythmic gymnastics teaching of physical education on functional abilities of 3rd & 4th grade pupils of elementary schools. Research in Kinesiology 2014;42(1):80-4. [Google Scholar]
Mendoza 2011 {published data only}
- Mendoza JA, Watson K, Baranowski T, Nicklas TA, Uscanga DK, Hanfling MJ. The walking school bus and children's physical activity: a pilot cluster randomized controlled trial. Pediatrics 2011;128(3):e537-44. [DOI] [PMC free article] [PubMed] [Google Scholar]
Mendoza 2017 {published data only}
- Mendoza JA, Haaland W, Jacobs M, Abbey-Lambertz M, Miller J, Salls D, et al. Bicycle trains, cycling, and physical activity: a pilot cluster RCT. American Journal of Preventive Medicine 2017;53(4):481-9. [DOI] [PMC free article] [PubMed] [Google Scholar]
Menrath 2015 {published data only}
- Menrath I, Prüßmann M, Müller-Godeffroy E, Prüßmann C, Ottova V, Ravens-Sieberer U, et al. Effectiveness of school-based life skills programmes on secondary schoolchildren in a high risk sample [Überprüfung der Effektivität schulischer Gesundheitsprogramme bei Schülerinnen und Schülern der Sekundarstufe I mit besonderen sozialen Belastungen]. Gesundheitswesen 2015;77 Suppl 1:S76-7. [DOI] [PubMed] [Google Scholar]
Merrotsy 2019 {published data only}
- Merrotsy A, McCarthy AL, Flack J, Lacey S, Coppinger T. Project Spraoi: a two-year longitudinal study on the effectiveness of a school-based nutrition and physical activity intervention on dietary intake, nutritional knowledge and markers of health of Irish schoolchildren. Public Health and Nutrition 2019;22(13):2489-99. [DOI] [PMC free article] [PubMed] [Google Scholar]
Messiah 2015 {published data only}
- Messiah SE, Diego A, Kardys J, Kirwin K, Hanson E, Nottage R, et al. Effect of a park-based after-school program on participant obesity-related health outcomes. American Journal of Health Promotion 2015;29(4):217-25. [DOI] [PubMed] [Google Scholar]
Michailidis 2019 {published data only}
- Michailidis Y, Metaxas TI, Stefanidis P, Christoulas K. Fitness effects of one-year soccer training of 8-10 and 10-12-year-old school children. Journal of Sports Medicine and Physical Fitness 2019;59(5):725-32. [DOI] [PubMed] [Google Scholar]
Miller 2015 {published data only}
- Miller A, Christensen EM, Eather N, Sproule J, Annis-Brown L, Lubans DR. The PLUNGE randomized controlled trial: evaluation of a games-based physical activity professional learning program in primary school physical education. Preventive Medicine 2015;74:1-8. [DOI] [PubMed] [Google Scholar]
Möhrle 2015 {published data only}
- Möhrle B, Steinacker JM, Szagun B, Kobel S. Physical activity promotion at primary schools - playgrounds and physical activity of children [Bewegungsförderung an Grundschulen – Pausenhof und körperliche Aktivität von Kindern]. Deutsche Zeitschrift Für Sportmedizin 2015;66(6):141-6. [Google Scholar]
Mok 2020 {published data only}
- Mok MMC, Chin MK, Korcz A, Popeska B, Edginton CR, Uzunoz FS, et al. Brain Breaks(R) physical activity solutions in the classroom and on attitudes toward physical activity: a randomized controlled trial among primary students from eight countries. International Journal of Environmental Research and Public Health 2020;17(5):1666. [DOI] [PMC free article] [PubMed] [Google Scholar]
Monti 2012 {published data only}
- Monti JM, Hillman CH, Cohen NJ. Aerobic fitness enhances relational memory in preadolescent children: the FITKids randomized control trial. Hippocampus 2012;22(9):1876-82. [DOI] [PMC free article] [PubMed] [Google Scholar]
Monyeki 2012 {published data only}
- Monyeki MA, De Ridder JH, Preez SM, Toriola AL, Malan DD. The effect of a ten month physical activity intervention programme on body composition of 9-13 year-old boys. African Journal for Physical Health Education Recreation & Dance 2012;18(2):241-50. [Google Scholar]
Moodie 2011 {published data only}
- Moodie M, Haby MM, Swinburn B, Carter R. Assessing cost-effectiveness in obesity: active transport program for primary school children - TravelSMART schools curriculum program. Journal of Physical Activity & Health 2011;8(4):503-15. [DOI] [PubMed] [Google Scholar]
Moreira 2012 {published data only}
- Moreira RF, Akagi FH, Wun PY, Moriguchi CS, Sato TO. Effects of a school based exercise program on children's resistance and flexibility. Work 2012;41:922-8. [DOI] [PubMed] [Google Scholar]
Morris 2013 {published data only}
- Morris JG, Gorely T, Sedgwick MJ, Nevill A, Nevill ME. Effect of the Great Activity Programme on healthy lifestyle behaviours in 7-11 year olds. Journal of Sports Sciences 2013;31(12):1280-93. [DOI] [PubMed] [Google Scholar]
Morris 2019 {published data only}
- Morris JL, Daly-Smith A, Archbold VSJ, Wilkins EL, McKenna J. The Daily Mile™ initiative: exploring physical activity and the acute effects on executive function and academic performance in primary school children. Psychology of Sport and Exercise 2019;45. [Google Scholar]
Moya 2011 {published data only}
- Moya MP, Sanchez LM, Lopez BJ, Escribano SF, Notario PB, Salcedo AF, et al. Cost-effectiveness of an intervention to reduce overweight and obesity in 9-10-year-olds. The Cuenca study [Coste-efectividad de un programa de actividad física de tiempo libre para prevenir el sobrepeso y la obesidad en niños de 9-10 años]. Gaceta Sanitaria 2011;25(3):198-204. [DOI] [PubMed] [Google Scholar]
Moynihan 2014 {published data only}
- Moynihan Ã, McMahon T. An investigation of the youth development effects of a school-based, multi-sport initiative for first-year boys. International Journal of Sport & Society 2014;4(3):33-45. [Google Scholar]
Muller 2019 {published data only}
- Muller I, Smith D, Adams L, Aerts A, Damons BP, Degen J, et al. Effects of a school-based health intervention program in marginalized communities of Port Elizabeth, South Africa (the KaziBantu study): protocol for a randomized controlled trial. JMIR Research Protocol 2019;8(7):e14097. [DOI] [PMC free article] [PubMed] [Google Scholar]
Muntaner‐Mas 2017 {published data only}
- Muntaner-Mas A, Palou P. Effects of high intensity interval training (HIIT) intervention amongst school adolescents. Journal of Physical Education & Health - Social Perspective 2017;6(10):19-25. [Google Scholar]
Murillo 2016 {published data only}
- Murillo PB, García BE, Julián Clemente JA, Generelo LE. Motivational outcomes and predictors of moderate-to-vigorous physical activity and sedentary time for adolescents in the Sigue la Huella intervention. International Journal of Behavioral Medicine 2016;23(2):135-42. [DOI] [PubMed] [Google Scholar]
Murtagh 2013 {published data only}
- Murtagh E, Mulvihill M, Markey O. Bizzy Break! The effect of a classroom-based activity break on in-school physical activity levels of primary school children. Pediatric Exercise Science 2013;25(2):300-7. [DOI] [PubMed] [Google Scholar]
Muzaffar 2019 {published data only}
- Muzaffar H, Nikolaus CJ, Ogolsky BG, Lane A, Liguori C, Nickols-Richardson SM. Promoting cooking, nutrition, and physical activity in afterschool settings. American Journal of Health Behavior 2019;43(6):1050-63. [DOI] [PubMed] [Google Scholar]
Nabors 2015 {published data only}
- Nabors L, Burbage M, Woodson KD, Swoboda C. Implementation of an after-school obesity prevention program: helping young children toward improved health. Issues in Comprehensive Pediatric Nursing 2015;38(1):22-38. [DOI] [PubMed] [Google Scholar]
Naidoo 2012 {published data only}
- Naidoo R, Coopoo Y. The impact of a primary school physical activity intervention in KwaZulu-Natal, South Africa. African Journal for Physical Health Education Recreation & Dance 2012;18(1):75-85. [Google Scholar]
Nathan 2019a {published data only}
- Nathan N, Wiggers J, Bauman AE, Rissel C, Searles A, Reeves P, et al. A cluster randomised controlled trial of an intervention to increase the implementation of school physical activity policies and guidelines: study protocol for the physically active children in education (PACE) study. BMC Public Health 2019;19(1):170. [DOI] [PMC free article] [PubMed] [Google Scholar]
Nawi 2015 {published data only}
- Nawi AM, Jamaludin FI. Effect of Internet-based intervention on obesity among adolescents in Kuala Lumpur: a school-based cluster randomised trial. Malaysian Journal of Medical Science 2015;22(4):47-56. [PMC free article] [PubMed] [Google Scholar]
Nazieffa 2020 {published data only}
- Nazieffa FNF, Anuar HH. The effects of integrating physical activity into mathematic lessons on mathematic test performance, body mass index and short term memory among 10 year old children. Journal of Physical Education & Sport 2020;20:425-9. [Google Scholar]
NCT03081013 {published data only}
- Randomized controlled trial of a physical activity program for teenagers. 2017. https://clinicaltrials.gov/ct2/show/NCT03081013.
NCT03308500 {published data only}
- Effect of high-intensity intermittent games on cardiorespiratory fitness and body composition in children. 2017. https://clinicaltrials.gov/ct2/show/NCT03308500.
NCT03885115 {published data only}
- Lace up and move: structured after school intervention for Hispanic and African American youth. 2019. https://clinicaltrials.gov/show/NCT03885115.
NCT03893149 {published data only}
- Attention capacity and before-school physical activity intervention program. 2019. https://clinicaltrials.gov/show/NCT03893149.
NCT03937336 {published data only}
- The PACO study, "Pedalea y Anda al COlegio". 2019. https://clinicaltrials.gov/show/NCT03937336.
NCT03952754 {published data only}
- Effect of hip hop nutrition-math curriculum. 2019. https://clinicaltrials.gov/show/NCT03952754.
NCT03975335 {published data only}
- Reducing behavioral risk factors of NCDs: protocol for a school-based health education program in Bangladesh. 2019. https://clinicaltrials.gov/show/NCT03975335. [DOI] [PMC free article] [PubMed]
NCT04113707 {published data only}
- Building long-term academic success through ongoing fun fitness program. 2019. https://clinicaltrials.gov/show/NCT04113707.
NCT04118543 {published data only}
- Oxfordshire sedentariness, obesity & cardiometabolic risk in adolescents - a trial of exercise in schools. 2019. https://clinicaltrials.gov/show/NCT04118543.
NCT04213014 {published data only}
- Guys/Girls Opt for Activities for Life Trial (GOAL) to increase young adolescents' physical activity and healthy eating. 2019. ClinicalTrials.gov. [NCT04213014]
Nelson 2011 {published data only}
- Nelson L, Evans M, Guess W, Morris M, Olson T, Buckwalter J. Heart rates of elementary physical education students during the dancing classrooms program. Research Quarterly for Exercise and Sport 2011;82(2):256-63. [DOI] [PubMed] [Google Scholar]
- Nelson LP, Wilson A. Impact of dancing classrooms on elementary physical education: a school climate study of personal and social development. TAHPERD Journal 2011;79(3):12-6. [Google Scholar]
Neto 2014 {published data only}
- Neto CF, Neto GR, Araújo AT, Sousa MS, Sousa JB, Batista GR, Reis VM. Can programmed or self-selected physical activity affect physical fitness of adolescents? Journal of Human Kinetics 2014;43:125-30. [DOI] [PMC free article] [PubMed] [Google Scholar]
Nichols 2014 {published data only}
- Nichols SD, Francis MP, Dalrymple N. Sustainability of a curriculum-based intervention on dietary behaviours and physical activity among primary school children in Trinidad and Tobago. West Indian Medical Journal 2014;63(1):68-77. [DOI] [PMC free article] [PubMed] [Google Scholar]
Nigg 2019 {published data only}
- Nigg CR, Kutchman E, Amato K, Schaefer CA, Zhang G, Ul Answar MM, et al. Recess environment and curriculum intervention on children’s physical activity: IPLAY. Translational Behavioral Medicine 2019;9:202-16. [DOI] [PMC free article] [PubMed] [Google Scholar]
Norris 2016 {published data only}
- Norris E, Dunsmuir S, Duke-Williams O, Stamatakis E, Shelton N. Protocol for the 'Virtual Traveller' cluster-randomised controlled trial: a behaviour change intervention to increase physical activity in primary-school math and English lessons. BMJ Open 2016;6(6):e011982. [DOI] [PMC free article] [PubMed] [Google Scholar]
NTR6173 {published data only}
- Promoting physical activity among youth: strategic places in the classroom. WHO International Clinical Trials Registry Platform 2016. [NTR6173]
O'Neill 2016 {published data only}
- O'Neill JM, Clark JK, Jones JA. Promoting fitness and safety in elementary students: a randomized control study of the Michigan model for health. Journal of School Health 2016;86(7):516-25. [DOI] [PubMed] [Google Scholar]
Oli 2019 {published data only}
- Oli N, Vaidya A, Eiben G, Krettek A. Effectiveness of health promotion regarding diet and physical activity among Nepalese mothers and their young children: the Heart-health Associated Research, Dissemination, and Intervention in the Community (HARDIC) trial. Global Health Action 2019;12(1):1670033. [DOI] [PMC free article] [PubMed] [Google Scholar]
Ostergaard 2012 {published data only}
- Ostergaard L, Borrestad LA, Tarp J, Andersen LB. Bicycling to school improves the cardiometabolic risk factor profile: a randomised controlled trial. BMJ Open 2012;2(6):e001307. [DOI] [PMC free article] [PubMed] [Google Scholar]
PACTR201903750173871 {published data only}
- Bukhali: building knowledge, optimising physical and mental health, and setting up healthier life trajectories in South Africa. WHO International Clinical Trials Registry Platform 2019. [PACTR201903750173871]
Pardo 2013 {published data only}
- Pardo BM, Bengoechea EG, Lanaspa EG, Bush PL, Casterad JZ, Clemente JA, et al. Promising school-based strategies and intervention guidelines to increase physical activity of adolescents. Health Education Research 2013;28(3):523-38. [DOI] [PubMed] [Google Scholar]
Pardo 2014 {published data only}
- Pardo BM, Bengoechea EG, Clemente JA, Lanaspa EG. Empowering adolescents to be physically active: three-year results of the Sigue la Huella intervention. Preventive Medicine 2014;66:6-11. [DOI] [PubMed] [Google Scholar]
Parrish 2016 {published data only}
- Parrish AM, Okely AD, Batterham M, Cliff D, Magee C. PACE: a group randomised controlled trial to increase children's break-time playground physical activity. Journal of Science and Medicine in Sport 2016;19(5):413-8. [DOI] [PubMed] [Google Scholar]
Parrish 2018 {published data only}
- Parrish AM, Trost SG, Howard SJ, Batterham M, Cliff D, Salmon J, et al. Evaluation of an intervention to reduce adolescent sitting time during the school day: the 'Stand Up for Health' randomised controlled trial. Journal of Science and Medicine in Sport 2018;21(12):1244-9. [DOI] [PubMed] [Google Scholar]
Penalvo 2015 {published data only}
- Penalvo JL, Santos-Beneit G, Sotos-Prieto M, Bodega P, Oliva B, Orrit X, et al. The SI! program for cardiovascular health promotion in early childhood: a cluster-randomized trial. Journal of the American College of Cardiology 2015;66(14):1525-34. [DOI] [PubMed] [Google Scholar]
Perez 2012 {published data only}
- Perez Lopez IJ, Delgado Fernandez M. [A school breaks card game improves eating habits in adolescents]. Nutricion Hospitalaria 2012;27(6):2055-65. [DOI] [PubMed] [Google Scholar]
Pesce 2013 {published data only}
- Pesce C, Faigenbaum A, Crova C, Marchetti R, Bellucci M. Benefits of multi-sports physical education in the elementary school context. Health Education Journal 2013;72(3):326-36. [Google Scholar]
Petchers 1988 {published data only}
- Petchers MK, Hirsch EZ, Bloch BA. A longitudinal study of the impact of a school heart health curriculum. Journal of Community Health 1988;13(2):85-94. [DOI] [PubMed] [Google Scholar]
Pienaar 2012 {published data only}
- Pienaar AE, Salome Kruger H, Steyn HS, Naude D. Change over three years in adolescents' physical activity levels and patterns after a physical activity intervention: play study. Journal of Sports Medicine and Physical Fitness 2012;52(3):300-10. [PubMed] [Google Scholar]
Pinto‐Escalona 2019 {published data only}
- Pinto-Escalona T, Martínez-de-Quel Ó. Ten minutes of interdisciplinary physical activity improve academic performance [Diez minutos de actividad física interdisciplinaria mejoran el rendimiento académico]. Apunts: Educació Física i Esports 2019;138:82-94. [Google Scholar]
Plavsic 2020 {published data only}
- Plavsic L, Knezevic OM, Sovtic A, Minic P, Vukovic R, Mazibrada I, et al. Effects of high-intensity interval training and nutrition advice on cardiometabolic markers and aerobic fitness in adolescent girls with obesity. Applied Physiology Nutrition and Metabolism 2020;45(3):294-300. [DOI] [PubMed] [Google Scholar]
Polet 2019 {published data only}ISRCTN39374060
- Polet J, Hassandra M, Lintunen T, Laukkanen A, Hankonen N, Hirvensalo M, et al. Using physical education to promote out-of school physical activity in lower secondary school students - a randomized controlled trial protocol. BMC Public Health 2019;19(1):157. [DOI] [PMC free article] [PubMed] [Google Scholar]
Polevoy 2020 {published data only}
- Polevoy G. Development of coordination and speed-power abilities in children 8-9 years with the help of exercise classics. Physical Activity Review 2020;8(1):46-50. [Google Scholar]
Polo‐Oteyza 2017 {published data only}
- Polo-Oteyza E, Ancira-Moreno M, Rosel-Pech C, Sanchez-Mendoza MT, Salinas-Martinez V, Vadillo-Ortega F. An intervention to promote physical activity in Mexican elementary school students: building public policy to prevent noncommunicable diseases. Nutrition Review 2017;75(Suppl 1):70-8. [DOI] [PubMed] [Google Scholar]
Post 2019 {published data only}
- Post P, Palacios R. Aggie play: a gender-relevant physical activity program for girls. Journal of Sport and Exercise Psychology 2019;41(4):194-205. [DOI] [PubMed] [Google Scholar]
Post 2019a {published data only}
- Post P, Palacios R. Aggie play: a gender-relevant physical activity program for girls. Journal of Sport and Exercise Psychology 2019;41(4):194-205. [DOI] [PubMed] [Google Scholar]
Postler 2017 {published data only}
- Postler T, Schulz T, Oberhoffer R. Skipping Hearts goes to school: short-term effects [Skipping Hearts macht schule: kurzzeiteffekte des projekts]. German Journal of Sports Medicine 2017;68(6):148-56. [Google Scholar]
Powell 2013 {published data only}
- Powell JE, Carroll FE, Sebire SJ, Haase AM, Jago R. Bristol Girls Dance Project feasibility study: using a pilot economic evaluation to inform design of a full trial. BMJ Open 2013;3(12):e003726. [DOI] [PMC free article] [PubMed] [Google Scholar]
Prins 2012 {published data only}
- Prins RG, Brug J, Empelen P, Oenema A. Effectiveness of YouRAction, an intervention to promote adolescent physical activity using personal and environmental feedback: a cluster RCT. PLoS One 2012;7(3):e32682. [DOI] [PMC free article] [PubMed] [Google Scholar]
Puma 2013 {published data only}
- Puma J, Romaniello C, Crane L, Scarbro S, Belansky E, Marshall JA. Long-term student outcomes of the Integrated Nutrition and Physical Activity Program. Journal of Nutrition Education and Behavior 2013;45(6):635-42. [DOI] [PubMed] [Google Scholar]
Quizan‐Plata 2014 {published data only}
- Quizan-Plata T, Villarreal Meneses L, Esparza Romero J, Bolanos Villar AV, Diaz Zavala RG. Educational program had a positive effect on the intake of fat, fruits and vegetables and physical activity in students attending public elementary schools of Mexico [Programa educativo afecta positivamente el consumo de grasa, frutas, verduras y actividad física en escolares Mexicanos]. Nutrición Hospitalaria 2014;30(3):552-61. [DOI] [PubMed] [Google Scholar]
Radnor 2017 {published data only}
- Radnor JM, Lloyd RS, Oliver JL. Individual response to different forms of resistance training in school-aged boys. Journal of Strength and Conditioning Research 2017;31(3):787-97. [DOI] [PubMed] [Google Scholar]
RBR‐5fm97x {published data only}
- Effect of active video games on students during physical education classes in school. World Health Orgnaization International Clinical Trials Registry Database 2019. [CENTRAL: RBR‐5fm97x]
RBR‐86xv46 {published data only}
- Effects of a school intervention on adolescent health. WHO International Clinical Trials Registry Platform 2019. [RBR-86xv46]
Reed 2013 {published data only}
- Reed JA, Maslow AL, Long S, Hughey M. Examining the impact of 45 minutes of daily physical education on cognitive ability, fitness performance, and body composition of African American youth. Journal of Physical Activity and Health 2013;10(2):185-97. [DOI] [PubMed] [Google Scholar]
Rees‐Punia 2017 {published data only}
- Rees-Punia E, Holloway A, Knauft D, Schmidt MD. Effects of school gardening lessons on elementary school children's physical activity and sedentary time. Journal of Physical Activity and Health 2017;14(12):959-64. [DOI] [PubMed] [Google Scholar]
Resal 2018 {published data only}
- Resal GK, Aadl E, Nilsen AKO, Bartholomew JB, Andersen LB, Anderssen SA. The effect of a two-year school-based daily physical activity intervention on a clustered CVD risk factor score - the Sogndal school-intervention study. Scandinavian Journal of Medicine & Science in Sports 2018;28(3):1027-35. [DOI] [PubMed] [Google Scholar]
Resaland 2011 {published data only}
- Resaland G, Andersen L, Mamen A, Anderssen S. Effects of a 2-year school-based daily physical activity intervention on cardiorespiratory fitness: the Sogndal school-intervention study. Scandinavian Journal of Medicine & Science in Sports 2011;21(2):302-9. [DOI] [PubMed] [Google Scholar]
Resaland 2018 {published data only}
- Resaland GK, Aadland E, Nilsen AK, Bartholomew JB, Andersen LB, Anderssen SA. The effect of a two-year school-based daily physical activity intervention on a clustered CVD risk factor score - the Sogndal school-intervention study. Scandinavian Journal of Medicine & Science in Sports 2018;28(3):1027-35. [DOI] [PubMed] [Google Scholar]
Rexen 2015 {published data only}
- Rexen CT, Ersboll AK, Moller NC, Klakk H, Wedderkopp N, Andersen LB. Effects of extra school-based physical education on overall physical fitness development - the CHAMPS study DK. Scandinavian Journal of Medicine & Science in Sports 2015;25(5):706-15. [DOI] [PubMed] [Google Scholar]
Reznik 2015 {published data only}
- Reznik M, Wylie-Rosett J, Kim M, Ozuah PO. A classroom-based physical activity intervention for urban kindergarten and first-grade students: a feasibility study. Childhood Obesity 2015;11(3):314-24. [DOI] [PMC free article] [PubMed] [Google Scholar]
Riiser 2020 {published data only}
- Riiser K, Richardsen KR, Haugen ALH, Lund S, Londal K. Active play in ASP – a matched-pair cluster-randomized trial investigating the effectiveness of an intervention in after-school programs for supporting children’s physical activity. BMC Public Health 2020;20(1):500. [DOI] [PMC free article] [PubMed] [Google Scholar]
Riley 2014 {published data only}
- Riley N, Lubans DR, Holmes K, Morgan PJ. Rationale and study protocol of the EASY Minds (Encouraging Activity to Stimulate Young Minds) program: cluster randomized controlled trial of a primary school-based physical activity integration program for mathematics. BMC Public Health 2014;14:816. [DOI] [PMC free article] [PubMed] [Google Scholar]
Robbins 2014 {published data only}
- Robbins LB, Pfeiffer KA, Wesolek SM, Lo YJ. Process evaluation for a school-based physical activity intervention for 6th- and 7th-grade boys: reach, dose, and fidelity. Evaluation and Program Planning 2014;42:21-31. [DOI] [PubMed] [Google Scholar]
Robbins 2020 {published data only}
- Robbins LB, Ling J, Wen F. Moderators in a physical activity intervention for adolescent girls. Pediatric Research 2020;88(5):810-7. [DOI] [PMC free article] [PubMed] [Google Scholar]
Robinson 1999 {published data only}
- Robinson TN, James KS. Can a school-based intervention to reduce television use decrease adiposity in children in grades 3 and 4? Western Journal of Medicine 2000;173(1):40. [DOI] [PMC free article] [PubMed] [Google Scholar]
- Robinson TN. Reducing children's television viewing to prevent obesity: a randomized controlled trial. Journal of the American Medical Association 1999;282(16):1561-7. [DOI] [PubMed] [Google Scholar]
Romanelli 2015 {published data only}
- Romanelli MMC, Ermetici F, Briganti S, Zelaschi R, Dozio E, Morricone L, et al. Effectiveness of a multicomponent environmental intervention on adiposity and behavioural measures in middle school adolescents: a randomized school-based controlled study. FASEB Journal 2015;29:731.4. [Google Scholar]
Ronsley 2013 {published data only}
- Ronsley R, Lee AS, Kuzeljevic B, Panagiotopoulos C. Healthy Buddies™ reduces body mass index z-score and waist circumference in Aboriginal children living in remote coastal communities. Journal of School Health 2013;83(9):605-13. [DOI] [PubMed] [Google Scholar]
Rosenkranz 2012 {published data only}
- Rosenkranz RR, Lubans DR, Peralta LR, Bennie A, Sanders T, Lonsdale C. A cluster-randomized controlled trial of strategies to increase adolescents' physical activity and motivation during physical education lessons: the Motivating Active Learning in Physical Education (MALP) trial. BMC Public Health 2012;12:834. [DOI] [PMC free article] [PubMed] [Google Scholar]
Rostami‐Moez 2017 {published data only}
- Rostami-Moez M, Rezapur-Shahkolai F, Hazavehei SM, Karami M, Karimi-Shahanjarini A, Nazem F. Effect of educational program, based on PRECEDE and Trans-Theoretical Models, on preventing decline in regular physical activity and improving it among students. Journal of Research in Health Sciences 2017;17(2):e00375. [PubMed] [Google Scholar]
Routen 2017 {published data only}
- Routen AC, Biddle SJ, Bodicoat DH, Cale L, Clemes S, Edwardson CL, et al. Study design and protocol for a mixed methods evaluation of an intervention to reduce and break up sitting time in primary school classrooms in the UK: the CLASS PAL (Physically Active Learning) programme. BMJ Open 2017;7(11):e019428. [DOI] [PMC free article] [PubMed] [Google Scholar]
Ruiz‐Ariza 2019 {published data only}
- Ruiz-Ariza A, Suárez-Manzano S, López-Serrano S, Martínez-López EJ. The effect of cooperative high-intensity interval training on creativity and emotional intelligence in secondary school: a randomised controlled trial. European Physical Education Review 2019;25(2):355-73. [Google Scholar]
Ruiz‐Ariza 2019a {published data only}
- Ruiz-Ariza A, Suárez-Manzano S, López-Serrano S, Martínez-López EJ. The effect of cooperative high-intensity interval training on creativity and emotional intelligence in secondary school: a randomised controlled trial. European Physical Education Review 2019;25(2):355-73. [Google Scholar]
Sahota 2019 {published data only}
- Sahota P, Christian M, Day R, Cocks K. The feasibility and acceptability of a primary school-based programme targeting diet and physical activity: the PhunkyFoods Programme. Pilot Feasibility Studies 2019;5(1):152. [DOI] [PMC free article] [PubMed] [Google Scholar]
Salmoirago‐Blotcher 2015 {published data only}
- Salmoirago-Blotcher E, Druker S, Meyer F, Bock B, Crawford S, Pbert L. Design and methods for "Commit to Get Fit" - a pilot study of a school-based mindfulness intervention to promote healthy diet and physical activity among adolescents. Contemporary Clinical Trials 2015;41:248-58. [DOI] [PMC free article] [PubMed] [Google Scholar]
Salmon 2011 {published data only}
- Salmon J, Jorna M, Hume C, Arundell L, Chahine N, Tienstra M, et al. A translational research intervention to reduce screen behaviours and promote physical activity among children: Switch-2-Activity. Health Promotion International 2011;26(3):311-21. [DOI] [PubMed] [Google Scholar]
Sanchez‐Lopez 2019 {published data only}
- Sanchez-Lopez M, Cavero-Redondo I, Alvarez-Bueno C, Ruiz-Hermosa A, Pozuelo-Carrascosa DP, Diez-Fernandez A, et al. Impact of a multicomponent physical activity intervention on cognitive performance: the MOVI-KIDS study. Scandinavian Journal of Medicine & Science in Sports 2019;29(5):766-75. [DOI] [PubMed] [Google Scholar]
Sanchez‐Lopez 2019a {published data only}
- Sanchez-Lopez M, Ruiz-Hermosa A, Redondo-Tebar A, Visier-Alfonso ME, Jimenez-Lopez E, Martinez-Andres M, et al. Rationale and methods of the MOVI-da10! Study - a cluster-randomized controlled trial of the impact of classroom-based physical activity programs on children's adiposity, cognition and motor competence. BMC Public Health 2019;19(1):417. [DOI] [PMC free article] [PubMed] [Google Scholar]
Saraf 2015 {published data only}
- Saraf DS, Gupta SK, Pandav CS, Nongkinrih B, Kapoor SK, Pradhan SK, et al. Effectiveness of a school based intervention for prevention of non-communicable diseases in middle school children of rural North India: a randomized controlled trial. Indian Journal of Pediatrics 2015;82(4):354-62. [DOI] [PubMed] [Google Scholar]
Sauder 2018 {published data only}
- Sauder KA, Dabelea D, Bailey-Callahan R, Kanott Lambert S, Powell J, James R, et al. Targeting risk factors for type 2 diabetes in American Indian youth: the Tribal Turning Point pilot study. Pediatric Obesity 2018;13(5):321-9. [DOI] [PMC free article] [PubMed] [Google Scholar]
Savin 2014 {published data only}
- Savin L. Efficiency of movement games for the development of motor skills in middle-school students [Eficienå¢a jocurilor de miåžcare ãžn dezvoltarea calitä‚å¢ilor motrice la elevii ciclului gimnazial]. Studia Universitatis Vasile Goldis, Physical Education & Physical Therapy Series 2014;3(2):31-5. [Google Scholar]
Schneider 2017 {published data only}
- Schneider M, Schmalbach P, Godkin S. Impact of a personalized versus moderate-intensity exercise prescription: a randomized controlled trial. Journal of Behavioral Medicine 2017;40(2):239-48. [DOI] [PMC free article] [PubMed] [Google Scholar]
Schoerner 2014 {published data only}
- Schoerner CL, Grisham AC, Spear BA, Dunnaway D, Hester D, Swaid C. Changing health of children using HEAL, a school based intervention. Journal of the Academy of Nutrition and Dietetics 2014;114(9):A78. [Google Scholar]
Schwager 2019 {published data only}
- Schwager S, Berger U, Glaeser A, Strauss B, Wick AK. Evaluation of "Healthy Learning. Together", an easily applicable mental health promotion tool for students aged 9 to 18 years. International Journal of Environmental Research in Public Health 2019;16(3):487. [DOI] [PMC free article] [PubMed] [Google Scholar]
Sebire 2018 {published data only}
- Sebire SJ, Jago R, Banfield K, Edwards MJ, Campbell R, Kipping R, et al. Results of a feasibility cluster randomised controlled trial of a peer-led school-based intervention to increase the physical activity of adolescent girls (PLAN-A). International Journal of Behavioral Nutrition and Physical Activity 2018;15(1):50. [DOI] [PMC free article] [PubMed] [Google Scholar]
Sebire 2019 {published data only}
- Sebire S J, Banfield K, Jago R, Edwards MJ, Campbell R, Kipping R, et al. A process evaluation of the PLAN-A intervention (Peer-Led physical Activity iNtervention for Adolescent girls). BMC Public Health 2019;19(1):1203. [DOI] [PMC free article] [PubMed] [Google Scholar]
Seo 2013 {published data only}
- Seo DC, King MH, Kim N, Sovinski D, Meade R, Lederer AM. Predictors for moderate- and vigorous-intensity physical activity during an 18-month coordinated school health intervention. Preventive Medicine 2013;57(5):466-70. [DOI] [PubMed] [Google Scholar]
Shang 2020 {published data only}
- Shang X, Li Y, Xu H, Zhang Q, Hu X, Liu A, et al. Effect of multidimensional lifestyle interventions on metabolic risk reduction in children: a cluster randomised controlled trial. Preventive Medicine 2020;133:106010. [DOI] [PubMed] [Google Scholar]
Shang‐yi 2013 {published data only}
- Shang-yi G, Wei-mo ZH. Dose-effect relations between cardiometabolic health risks and physical activities of teenagers. Journal of Physical Education/Tiyu Xuekan 2013;20(6):120-5. [Google Scholar]
Sharma 2017 {published data only}
- Sharma VK, Subramanian SK, Radhakrishnan K, Rajendran R, Ravindran BS, Arunachalam V. Comparison of structured and unstructured physical activity training on predicted VO2max and heart rate variability in adolescents - a randomized control trial. Journal of Basic and Clinical Physiology and Pharmacology 2017;28(3):225-38. [DOI] [PubMed] [Google Scholar]
Sigmund 2012 {published data only}
- Sigmund E, El Ansari W, Sigmundová D. Does school-based physical activity decrease overweight and obesity in children aged 6–9 years? A two-year non-randomized longitudinal intervention study in the Czech Republic. BMC Public Health 2012;12:570. [DOI] [PMC free article] [PubMed] [Google Scholar]
- Sigmundová D, Sigmund E. The effect of physical activity program at school on reducing childhood obesity: results of four-year longitudinal study [Efekt pohybového programu ve školním prostředí na zmírnění výskytu dětské obezity: výsledky 4leté longitudinální studie]. In: Medicina Sportiva Bohemica et Slovaca. Vol. 21. 2012:129-41.
Silva 2014 {published data only}
- Silva KS, Barros MVG, Barbosa Filho VC, Garcia L, Martin Totaro E Júnior, Souza Beck R, et al. Implementação da intervenção “Saúde na Boa”: avaliação de processo e características dos estudantes permanecentes e não permanecentes. Revista Brasileira de Cineantropometria e Desempenho Humano 2014;16:1-12. [Google Scholar]
Silva 2018 {published data only}
- Silva DR, Minderico CS, Pinto F, Collings PJ, Cyrino ES, Sardinha LB. Impact of a classroom standing desk intervention on daily objectively measured sedentary behavior and physical activity in youth. Journal of Science in Medicine and Sport 2018;21(9):919-24. [DOI] [PubMed] [Google Scholar]
Simon 2011 {published data only}
- Simon C, Schweitzer B, Drai J, Kellou N, Sandalinas F, Reitzer C, et al. Overweight prevention in adolescents by increasing physical activity: 6-year results of the randomized ICAPS study. Obesity Reviews 2011;12:26. [Google Scholar]
Singh 2009 {published data only}
- Singh AS, Chin A, Paw MJ, Brug J, Mechelen W. Dutch obesity intervention in teenagers: effectiveness of a school-based program on body composition and behavior. Archives of Pediatrics & Adolescent Medicine 2009;163(4):309-17. [DOI] [PubMed] [Google Scholar]
Singhal 2010 {published data only}
- Singhal N, Misra A, Shah P, Gulati S. Effects of controlled school-based multi-component model of nutrition and lifestyle interventions on behavior modification, anthropometry and metabolic risk profile of urban Asian Indian adolescents in North India. European Journal of Clinical Nutrition 2010;64(6):364-73. [DOI] [PubMed] [Google Scholar]
Sinyavsky 2015 {published data only}
- Sinyavsky NI, Beznosko NN, Obukhov SM, Rodionov VA, Mikhel OI. System-activity approach implemented at physical education lessons. Teoria i Praktika Fiziceskoj Kul'tury 2015;4:90-2. [Google Scholar]
Skoradal 2018 {published data only}
- Skoradal MB, Purkhús E, Steinholm H, Olsen MH, Ørntoft C, Larsen MN, et al. "FIFA 11 for Health" for Europe in the Faroe Islands: effects on health markers and physical fitness in 10- to 12-year-old schoolchildren.. Scandinavian Journal of Medicine & Science in Sports 2018;28(Suppl 1):8-17. [DOI] [PubMed] [Google Scholar]
Smedegaard 2016 {published data only}
- Smedegaard S, Christiansen LB, Lund-Cramer P, Bredahl T, Skovgaard T. Improving the well-being of children and youths: a randomized multicomponent, school-based, physical activity intervention. BMC Public Health 2016;16(1):1127. [DOI] [PMC free article] [PubMed] [Google Scholar]
Smith 2011 {published data only}
- Smith LH. Piloting the use of teen mentors to promote a healthy diet and physical activity among children in Appalachia. Journal for Specialists in Pediatric Nursing 2011;16(1):16-26. [DOI] [PubMed] [Google Scholar]
Smith 2014a {published data only}
- Smith JJ, Morgan PJ, Plotnikoff RC, Dally KA, Salmon J, Okely AD, et al. Rationale and study protocol for the 'active teen leaders avoiding screen-time' (ATLAS) group randomized controlled trial: an obesity prevention intervention for adolescent boys from schools in low-income communities. Contemporary Clinical Trials 2014;37(1):106-19. [DOI] [PubMed] [Google Scholar]
Smith 2016 {published data only}
- Smith JJ, Morgan PJ, Plotnikoff RC, Stodden DF, Lubans DR. Mediating effects of resistance training skill competency on health-related fitness and physical activity: the ATLAS cluster randomised controlled trial. Journal of Sports Sciences 2016;34(8):772-9. [DOI] [PubMed] [Google Scholar]
Smith 2017 {published data only}
- Smith JJ, Morgan PJ, Lonsdale C, Dally K, Plotnikoff RC, Lubans DR. Mediators of change in screen-time in a school-based intervention for adolescent boys: findings from the ATLAS cluster randomized controlled trial. Journal of Behavioral Medicine 2017;40(3):423-33. [DOI] [PubMed] [Google Scholar]
Spencer 2013 {published data only}
- Spencer R, Bower J, Yates G, Kirk SF, Hancock FC. Adding peer mentors to a school-based physical activity pilot: the Heart Healthy Kids program. Physical & Health Education Journal 2013;79(3):14-21. [Google Scholar]
Springer 2013 {published data only}
- Springer AE, Kelder SH, Byrd-Williams CE, Pasch KE, Ranjit N, Delk JE, et al. Promoting energy-balance behaviors among ethnically diverse adolescents: overview and baseline findings of The Central Texas CATCH Middle School Project. Health Education and Behavior 2013;40(5):559-70. [DOI] [PubMed] [Google Scholar]
Springer 2019 {published data only}
- Springer AE, Harrell MB, Gomensoro L, Martinez J, Traversa FM, Rogers S, et al. ¡Activate Ya! Co-learning about school-based tobacco prevention and physical activity promotion in secondary school students in Uruguay. Global Health Promotion 2019;Epub ahead of print:1757975918813049. [DOI] [PubMed] [Google Scholar]
Stephens 1998 {published data only}
- Stephens M, Wentz S. Supplemental fitness activities and fitness in urban elementary school classrooms. Family Medicine 1998;30(3):220-3. [PubMed] [Google Scholar]
Stoepker 2018 {published data only}
- Stoepker P, Dauenhauer B, McCall T. Effects of a classroom walking program on physical activity accrual and on-task behavior. Physical Educator-US 2018;75(3):498-514. [Google Scholar]
Story 2012 {published data only}
- Story M, Hannan PJ, Fulkerson JA, Rock BH, Smyth M, Arcan C, et al. Bright Start: description and main outcomes from a group-randomized obesity prevention trial in American Indian children. Obesity (19307381) 2012;20(11):2241-9. [DOI] [PMC free article] [PubMed] [Google Scholar]
Sujová 2016 {published data only}
- Sujová L, Vladovičová N. School physical education and its impact on the development of motoric performance and physical fitness of third grade pupils in primary school in Banská Bystrica in Slovakia [Vplyv školskej telesnej výchovy na rozvoj pohybovej výkonnosti a telesnej zdatnosti žiakov 3. ročníka ZŠ v Banskej Bystrici v Slovenskej republike]. Physical Culture/Telesna Kultura 2016;39(1):48-59. [Google Scholar]
Sun 2011 {published data only}
- Sun MX, Huang XQ, Yan Y, Li BW, Zhong WJ, Chen JF, et al. One-hour after-school exercise ameliorates central adiposity and lipids in overweight Chinese adolescents: a randomized controlled trial. Chinese Medical Journal (Engl) 2011;124(3):323-9. [PubMed] [Google Scholar]
Sutherland 2019a {published data only}
- Sutherland R, Campbell E, Nathan N, Wolfenden L, Lubans DR, Morgan PJ, et al. A cluster randomised trial of an intervention to increase the implementation of physical activity practices in secondary schools: study protocol for scaling up the Physical Activity 4 Everyone (PA4E1) program. BMC Public Health 2019;19(1):883. [DOI] [PMC free article] [PubMed] [Google Scholar]
Swartz 2019 {published data only}
- Swartz AM, Tokarek NR, Lisdahl K, Maeda H, Strath SJ, Cho CC. Do stand-biased desks in the classroom change school-time activity and sedentary behavior? International Journal of Environmental Research and Public Health 2019;16(6):933. [DOI] [PMC free article] [PubMed] [Google Scholar]
Takehara 2019a {published data only}
- Takehara K, Ganchimeg T, Kikuchi A, Gundegmaa L, Altantsetseg L, Aoki A, et al. The effectiveness of exercise intervention for academic achievement, cognitive function, and physical health among children in Mongolia: a cluster RCT study protocol. BMC Public Health 2019;19(1):697. [DOI] [PMC free article] [PubMed] [Google Scholar]
Tarro 2014 {published data only}
- Tarro L, Llaurado E, Morina D, Sola R, Giralt M. Follow-up of a healthy lifestyle education program (the Educacio en Alimentacio Study): 2 years after cessation of intervention. Journal of Adolescent Health 2014;55(6):782-9. [DOI] [PubMed] [Google Scholar]
Tarro 2017 {published data only}
- Tarro L, Aceves-Martins M, Papell-Garcia I, Arola L, Giralt M, Llaurado E, et al. A youth-led, social marketing intervention run by adolescents to encourage healthy lifestyles among younger school peers (EYTO-Kids project): a protocol for pilot cluster randomized controlled trial (Spain). International Journal of Environmental Research and Public Health 2017;14(8):923. [DOI] [PMC free article] [PubMed] [Google Scholar]
Taylor 2018 {published data only}
- Taylor SL, Noonan RJ, Knowles ZR, Owen MB, McGrane B, Curry WB, et al. Evaluation of a pilot school-based physical activity clustered randomised controlled trial - Active Schools: Skelmersdale. International Journal of Environmental Research and Physical Activity 2018;15(5):E1011. [DOI] [PMC free article] [PubMed] [Google Scholar]
Telford 2019a {published data only}
- Telford R, Olive L, Keegan R, Barnett L, Telford R. The physical education and physical literacy (PEPL) approach: a multicomponent primary school intervention targeting physical literacy. Journal of Science and Medicine in Sport 2019;22:2019 ASICS SMA Conference. Novotel Twin Waters, Australia. 22 (Suppl 2) (p S21). [Google Scholar]
Telles 2013 {published data only}
- Telles S, Singh N, Bhardwaj A K, Kumar A, Balkrishna A. Effect of yoga or physical exercise on physical, cognitive and emotional measures in children: a randomized controlled trial. Child and Adolescent Psychiatry and Mental Health 2013;7(1):37. [DOI] [PMC free article] [PubMed] [Google Scholar]
Tercedor 2017 {published data only}
- Tercedor P, Villa-Gonzalez E, Avila-Garcia M, Diaz-Piedra C, Martinez-Baena A, Soriano-Maldonado A, et al. A school-based physical activity promotion intervention in children: rationale and study protocol for the PREVIENE Project. BMC Public Health 2017;17(1):748. [DOI] [PMC free article] [PubMed] [Google Scholar]
Thakur 2016 {published data only}
- Thakur JS, Bharti B, Tripathy JP, Dhawan V, Bhansali A. Impact of 20 week lifestyle intervention package on anthropometric biochemical and behavioral characteristics of schoolchildren in North India. Journal of Tropical Pediatrics 2016;62(5):368-76. [DOI] [PMC free article] [PubMed] [Google Scholar]
Theodore 2018 {published data only}
- Theodore FL, Moreno-Saracho JE, Bonvecchio A, Morales-Ruan MD, Tolentino-Mayo L, Lopez-Olmedo N, et al. Lessons learned and insights from the implementation of a food and physical activity policy to prevent obesity in Mexican schools: an analysis of nationally representative survey results. PLoS One 2018;13(6):e0198585. [DOI] [PMC free article] [PubMed] [Google Scholar]
Tian 2017 {published data only}
- Tian HL, Du Toit D, Toriola AL. The effects of an enhanced quality physical education programme on the physical activity levels of Grade 7 learners in Potchefstroom, South Africa. Physical Education and Sport Pedagogy 2017;22(1):35-50. [Google Scholar]
Tolano 2015 {published data only}
- Tolano Fierros EJ, Dórame Chávez DC, Preciado Flores MD, Toledo Domínguez ID, Serna Gutiérrez A, Omar Iván GN. Effect of a sports initiation school program in conditional physical capabilities [Efecto de un programa de iniciación deportiva escolar en las capacidades físicas condicionales]. E-balonmano.com: Journal of Sports Science 2015;11(2):177-83. [Google Scholar]
Tomlin 2012 {published data only}
- Tomlin D, Naylor PJ, McKay H, Zorzi A, Mitchell M, Panagiotopoulos C. The impact of Action Schools! BC on the health of Aboriginal children and youth living in rural and remote communities in British Columbia. International Journal of Circumpolar Health 2012;71(1):17999. [DOI] [PMC free article] [PubMed] [Google Scholar]
Trajkovic 2020 {published data only}
- Trajkovic N, Madic DM, Milanovic Z, Macak D, Padulo J, Krustrup P, et al. Eight months of school-based soccer improves physical fitness and reduces aggression in high-school children. Biology of Sport 2020;37(2):185-93. [DOI] [PMC free article] [PubMed] [Google Scholar]
Treu 2017 {published data only}
- Treu JA, Doughty K, Reynolds JS, Njike VY, Katz DL. Advancing school and community engagement now for disease prevention (ASCEND). American Journal of Health Promotion 2017;31(2):143-52. [DOI] [PubMed] [Google Scholar]
Tumynaitė 2014 {published data only}
- Tumynaitė L, Miežienė B, Ching Mok MM, Chin M, Putriūtė V, Rupainienė V, et al. Effects of intervention “Hopsport Brain Breaks” program on physical fitness and sedentary behaviour in primary school. Education Physical Training Sport 2014;94(3):57-66. [Google Scholar]
Tymms 2016 {published data only}
- Tymms PB, Curtis SE, Routen AC, Thomson KH, Bolden DS, Bock S, et al. Clustered randomised controlled trial of two education interventions designed to increase physical activity and well-being of secondary school students: the MOVE Project. BMJ Open 2016;6(1):e009318. [DOI] [PMC free article] [PubMed] [Google Scholar]
Uys 2016 {published data only}
- Uys M, Draper CE, Hendricks S, Villiers A, Fourie J, Steyn NP, et al. Impact of a South African school-based intervention, Healthkick, on fitness correlates. American Journal of Health Behavior 2016;40(1):55-66. [DOI] [PubMed] [Google Scholar]
van den Berg 2019 {published data only}
- den Berg V, Saliasi E, Groot RH, Chinapaw MJ, Singh AS. Improving cognitive performance of 9-12 years old children: just dance? A randomized controlled trial. Frontiers in Psychology 2019;10:174. [DOI] [PMC free article] [PubMed] [Google Scholar]
van den Berg 2019a {published data only}
- den Berg V, Singh AS, Komen A, Hazelebach C, Hilvoorde I, Cinapaw MJ. Integrating juggling with math lessons: a randomized controlled trial assessing effects of physically active learning on maths performance and enjoyment in primary school children. International Journal of Environmental Research and Public Health 2019;16(14):E2452. [DOI] [PMC free article] [PubMed] [Google Scholar]
van der Niet 2016 {published data only}
- Niet AG, Smith J, Oosterlaan J, Scherder EJ, Hartman E, Visscher C. Effects of a cognitively demanding aerobic intervention during recess on children's physical fitness and executive functioning. Pediatric Exercise Science 2016;28(1):64-70. [DOI] [PubMed] [Google Scholar]
Vander Ploeg 2014 {published data only}
- Vander Ploeg KA, McGavock J, Maximova K, Veugelers PJ. School-based health promotion and physical activity during and after school hours. Pediatrics 2014;133(2):e371-8. [DOI] [PubMed] [Google Scholar]
van Dongen 2019 {published data only}
- Dongen BM, Ridder MAM, Steenhuis IHM, Renders CM. Background and evaluation design of a community-based health-promoting school intervention: Fit Lifestyle at School and at Home (FLASH). BMC Public Health 2019;19(1):784. [DOI] [PMC free article] [PubMed] [Google Scholar]
Van Kann 2015 {published data only}
- Van Kann DH, Jansen MW, Vries SI, Vries NK, Kremers SP. Active Living: development and quasi-experimental evaluation of a school-centered physical activity intervention for primary school children. BMC Public Health 2015;15:1315. [DOI] [PMC free article] [PubMed] [Google Scholar]
van Stralen 2012 {published data only}
- Stralen MM, Meij J, te Velde SJ, Wal MF, Mechelen W, Knol DL, et al. Mediators of the effect of the JUMP-in intervention on physical activity and sedentary behavior in Dutch primary schoolchildren from disadvantaged neighborhoods. International Journal of Behavioral Nutrition and Physical Activity 2012;9:131. [DOI] [PMC free article] [PubMed] [Google Scholar]
Verloigne 2012 {published data only}
- Verloigne M, Bere E, Van Lippevelde W, Maes L, Lien N, Vik FN, et al. The effect of the UP4FUN pilot intervention on objectively measured sedentary time and physical activity in 10-12 year old children in Belgium: the ENERGY-project. BMC Public Health 2012;12:805. [DOI] [PMC free article] [PubMed] [Google Scholar]
Verloigne 2018 {published data only}
- Verloigne M, Ridgers ND, De Bourdeaudhuiji I, Cardon G. Effect and process evaluation of implementing standing desks in primary and secondary schools in Belgium: a cluster-randomised controlled trial. International Journal of Behavioral Nutrition and Physical Activity 2018;15:94. [DOI] [PMC free article] [PubMed] [Google Scholar]
Verstraete 2006 {published data only}
- Verstraete SJ, Cardon GM, De Clercq DL, De Bourdeaudhuij IMM. Increasing children's physical activity levels during recess periods in elementary schools: the effects of providing game equipment. European Journal of Public Health 2006;16(4):415-9. [DOI] [PubMed] [Google Scholar]
Vetter 2015 {published data only}
- Vetter M, O'Connor H, O'Dwyer N, Orr R. Active learning: effectiveness of learning a numeracy skill with physical activity, reducing sedentary time in school children. Journal of Science & Medicine in Sport 2015;19:e12. [Google Scholar]
Vetter 2018 {published data only}
- Vetter M, O'Connor H, O'Dwyer N, Orr R. Learning "Math on the Move": effectiveness of a combined numeracy and physical activity program for primary school children. Journal of Physical Activity & Health 2018;15(7):492-8. [DOI] [PubMed] [Google Scholar]
Vetter 2020 {published data only}
- Vetter M, O'Connor HT, O'Dwyer N, Chau J, Orr R. 'Maths on the move': effectiveness of physically-active lessons for learning maths and increasing physical activity in primary school students. Journal of Science & Medicine in Sport 2020;23(8):735-9. [DOI] [PubMed] [Google Scholar]
Vidoni 2012 {published data only}
- Vidoni C, Azevedo L, Eberline A. Effects of a group contingency strategy on middle school physical education students' heart rates. European Physical Education Review 2012;18(1):78-96. [Google Scholar]
Vieira 2019 {published data only}
- Vieira M, Carvalho GS. Costs and benefits of a school-based health intervention in Portugal. Health Promotion International 2019;34(6):1141-8. [DOI] [PubMed] [Google Scholar]
Villa‐Gonzalez 2017 {published data only}
- Villa-Gonzalez E, Ruiz JR, Mendoza JA, Chillon P. Effects of a school-based intervention on active commuting to school and health-related fitness. BMC Public Health 2017;17(1):20. [DOI] [PMC free article] [PubMed] [Google Scholar]
Wade 2019 {published data only}
- Wade L, Smith J, Lubans D, Duncan M. The influence of exercise in the natural environment on adolescents’ sustained attention and working memory: a randomised controlled trial. Journal of Science and Medicine in Sport 2019;22:S20-1. [Google Scholar]
Wadolowska 2019 {published data only}
- Wadolowska L, Hamulka J, Kowalkowska J, Ulewicz N, Hoffmann M, Gornicka M, et al. Changes in sedentary and active lifestyle, diet quality and body composition nine months after an education program in Polish students aged 11(-)12 years: report from the ABC of Healthy Eating study. Nutrients 2019;11(2):E331. [DOI] [PMC free article] [PubMed] [Google Scholar]
Wadsworth 2015 {published data only}
- Wadsworth DD, Rudisill ME, Russell JA, McDonald JR, Pascoe DD. Providing access to physical activity: the intersection of teaching, outreach, and scholarship. Kinesiology Review 2015;4(4):409-15. [Google Scholar]
Wallinga 2014 {published data only}
- Wallinga M, Takahashi S, Fischer J, Carr T, Anderson-Knott M, De Guzman M, et al. Effectiveness of Kidquest, an in-classroom nutrition and physical activity program, on physical activity behaviors of middle school youth. Journal of the Academy of Nutrition & Dietetics 2014;114(9):A93. [Google Scholar]
Wang 2012 {published data only}
- Wang C, Seo D, Geib R, Wroblewski N, Van Puymbroeck M, Kolbe L. OA13.04. Physical health benefits of health Qigong and Energize programs in American elementary school classrooms. BMC Complementary and Alternative Medicine 2012;12:1-1. [Google Scholar]
Wang 2017 {published data only}
- Wang H, Li T, Siahpush M, Chen LW, Huberty J. Cost-effectiveness of Ready for Recess to promote physical activity in children. Journal of School Health 2017;87(4):278-85. [DOI] [PubMed] [Google Scholar]
Wassenaar 2019a {published data only}
- Wassenaar TM, Wheatley CM, Beale N, Salvan P, Meaney A, Possee JB, et al. Effects of a programme of vigorous physical activity during secondary school physical education on academic performance, fitness, cognition, mental health and the brain of adolescents (Fit to Study): study protocol for a cluster-randomised trial. Trials 2019;20(1):189. [DOI] [PMC free article] [PubMed] [Google Scholar]
Watanabe 2016 {published data only}
- Watanabe J, Watanabe M, Yamaoka K, Adachi M, Nemoto A, Tango T. Effect of school-based home-collaborative lifestyle education on reducing subjective psychosomatic symptoms in adolescents: a cluster randomised controlled trial. PLoS One 2016;11(10):e0165285. [DOI] [PMC free article] [PubMed] [Google Scholar]
Watson 2017 {published data only}
- Watson A, Timperio A, Brown H, Hesketh KD. A primary school active break programme (ACTI-BREAK): study protocol for a pilot cluster randomised controlled trial. Trials 2017;18(1):433. [DOI] [PMC free article] [PubMed] [Google Scholar]
Watson 2019 {published data only}
- Watson A, Timperio TA, Brown H, Hesketh KD. Process evaluation of a classroom active break (ACTI-BREAK) program for improving academic-related and physical activity outcomes for students in years 3 and 4. BMC Public Health 2019;19:633. [DOI] [PMC free article] [PubMed] [Google Scholar]
Weaver 2018 {published data only}
- Weaver RG, Webster CA, Beets MW, Brazendale K, Chandler J, Schisler L, et al. Initial outcomes of a participatory-based, competency-building approach to increasing physical education teachers' physical activity promotion and students' physical activity: a pilot study. Health Education and Behavior 2018;45(3):359-70. [DOI] [PubMed] [Google Scholar]
Weaver 2018a {published data only}
- Weaver RG, Webster CA, Egan C, Campos CM, Michael RD, Vazou S. Partnerships for active children in elementary schools: outcomes of a 2-year pilot study to increase physical activity during the school day. American Journal of Health Promotion 2018;32(3):621-30. [DOI] [PubMed] [Google Scholar]
Weber 2017 {published data only}
- Weber KS, Sporkel O, Mertens M, Freese A, Strassburger K, Kemper B, et al. Positive effects of promoting physical activity and balanced diets in a primary school setting with a high proportion of migrant school children. Experimental & Clinical Endocrinology & Diabetes 2017;125(8):554-62. [DOI] [PubMed] [Google Scholar]
Webster 2015 {published data only}
- Webster CA, Beets M, Weaver RG, Vazou S, Russ L. Rethinking recommendations for implementing comprehensive school physical activity programs: a partnership model. Quest 2015;67(2):185-202. [Google Scholar]
Weiss 2015 {published data only}
- Weiss MR, Phillips AC, Kipp LE. Effectiveness of a school-based fitness program on youths' physical and psychosocial health outcomes. Pediatric Exercise Science 2015;27(4):546-57. [DOI] [PubMed] [Google Scholar]
Weiss 2019 {published data only}
- Weiss MR, Kipp LE, Phillips Reichter A, Espinoza SM, Bolter ND. Girls on the Run: impact of a physical activity youth development program on psychosocial and behavioral outcomes. Pediatric Exercise Science 2019;31(3):330-40. [DOI] [PubMed] [Google Scholar]
Welk 2016 {published data only}
- Welk GJ, Bai Y, Saint-Maurice PF, Allums-Featherston K, Candelaria N. Design and evaluation of the NFL PLAY 60 FITNESSGRAM partnership project. Research Quarterly for Exercise and Sport 2016;87(1):1-13. [DOI] [PubMed] [Google Scholar]
Wells 2014 {published data only}
- Wells NM, Myers BM, Henderson CR. Study protocol: effects of school gardens on children's physical activity. Archives of Public Health 2014;72(1):43. [DOI] [PMC free article] [PubMed] [Google Scholar]
White 2018 {published data only}
- White ML, Renfrow MS, Farley RS, Fuller DK, Eveland-Sayers BM, Caputo JL. A cross-training program does not alter self-reported physical activity levels in elementary school children. International Journal of Exercise Science 2018;11(5):308-18. [DOI] [PMC free article] [PubMed] [Google Scholar]
White 2018a {published data only}
- White ML, Renfrow MS, Farley RS, Fuller DK, Sayers EB, Caputo MJL. A cross-training program does not alter self-reported physical activity levels in elementary school children. International Journal of Exercise Science 2018;11(5):308-18. [DOI] [PMC free article] [PubMed] [Google Scholar]
Whitt‐Glover 2011 {published data only}
- Whitt-Glover MC, Ham SA, Yancey AK. Instant Recess(R): a practical tool for increasing physical activity during the school day. Progress in Community Health Partnerships 2011;5(3):289-97. [DOI] [PubMed] [Google Scholar]
Whooten 2018 {published data only}
- Whooten RC, Perkins ME, Gerber MW, Taveras EM. Effects of before-school physical activity on obesity prevention and wellness. American Journal of Preventive Medicine 2018;54(4):510-8. [DOI] [PMC free article] [PubMed] [Google Scholar]
Widhalm 2018 {published data only}
- Widhalm K, Helk O, Pachinger O. The Viennese EDDY study as a role model for obesity: prevention by means of nutritional and lifestyle interventions. Obesity Facts 2018;11(3):247-56. [DOI] [PMC free article] [PubMed] [Google Scholar]
Wilkinson 2013 {published data only}
- Wilkinson S, Colin J. Effective use of the physical education and school sport premium. Physical Education Matters 2013;8(2):8-10. [Google Scholar]
Williams 2014 {published data only}
- Williams AS, Wright BK, Williams CT. Juxtaposing sport and public health: the case of Fit University, Inc. Choregia 2014;10(1):57-69. [Google Scholar]
Williamson 2012 {published data only}
- Williamson DA, Champagne CM, Harsha DW, Han H, Martin CK, Newton RL, et al. Effect of an environmental school-based obesity prevention program on changes in body fat and body weight: a randomized trial. Obesity (Silver Spring) 2012;20(8):1653-61. [DOI] [PMC free article] [PubMed] [Google Scholar]
Willis 2019a {published data only}
- Willis K, Tibbitts B, Sebire SJ, Reid T, MacNeill SJ, Sanderson E, et al. Protocol for a cluster randomised controlled trial of a Peer-Led physical Activity iNtervention for Adolescent girls (PLAN-A). BMC Public Health 2019;19(1):644. [DOI] [PMC free article] [PubMed] [Google Scholar]
Wilson 2009 {published data only}
- Wilson DK, Griffin S, Saunders RP, Kitzman-Ulrich H, Meyers DC, Mansard L. Using process evaluation for program improvement in dose, fidelity and reach: the ACT trial experience. International Journal of Behavioral Nutrition and Physical Activity 2009;6:79. [DOI] [PMC free article] [PubMed] [Google Scholar]
Winkler 2016 {published data only}
- Winkler L, Thoreux P, Lhuissier FJ. Lien entre le score de fatigue de l’enfant sportif et la présence de blessures en section sportive scolaire. Science & Sports 2016;31(3):135-44. [Google Scholar]
Woods‐Townsend 2015 {published data only}
- Woods-Townsend K, Bagust L, Barker M, Christodoulou A, Davey H, Godfrey K, et al. Engaging teenagers in improving their health behaviours and increasing their interest in science (Evaluation of LifeLab Southampton): study protocol for a cluster randomized controlled trial. Trials 2015;16:372. [DOI] [PMC free article] [PubMed] [Google Scholar]
Wyatt 2011 {published data only}
- Wyatt KM, Lloyd J. Is the healthy lifestyle programme an acceptable and feasible school-based intervention to prevent obesity? Obesity Reviews 2011;12:270-1. [Google Scholar]
Xu 2015 {published data only}
- Xu F, Ware RS, Leslie E, Tse LA, Wang ZY, Li JQ, et al. Effectiveness of a randomized controlled lifestyle intervention to prevent obesity among Chinese primary school students: CLICK-Obesity study. PLoS One 2015;10(10):e0141421. [DOI] [PMC free article] [PubMed] [Google Scholar]
Yañez 2015 {published data only}
- Yañez MV, Alarcón VC, Salazar CM. Effect of a physical activity intervention program on BMI and distance covered in the 6-minute walk test in children at Transition Level 2 (NT2) in Collipulli, Araucanía region [Efecto de un programa de intervención de actividad física sobre el imc y la distancia recorrida en el test de 6 min en niños y niñas de Nivel Transición 2 (nt2) en la comuna de Collipulli, región de la Araucanía]. Revista Ciencias de la Actividad Física UCM 2015;16(2):47-56. [Google Scholar]
Yang 2017 {published data only}
- Yang Y, Kang B, Lee EY, Yang HK, Kim HS, Lim SY, et al. Effect of an obesity prevention program focused on motivating environments in childhood: a school-based prospective study. International Journal of Obesity 2017;41(7):1027-34. [DOI] [PubMed] [Google Scholar]
You 2013 {published data only}
- You F, Zan G, Hannon J, Shultz B, Newton M, Sibthorp J. Influence of a health-related physical fitness model on students' physical activity, perceived competence, and enjoyment. Perceptual & Motor Skills 2013;117(3):956-70. [DOI] [PubMed] [Google Scholar]
Yu 2020 {published data only}
- Yu HJ, Li F, Hu YF, Li CF, Yuan S, Song Y, et al. Improving the metabolic and mental health of children with obesity: a school-based nutrition education and physical activity intervention in Wuhan, China. Nutrients 2020;12(1):194. [DOI] [PMC free article] [PubMed] [Google Scholar]
Семенов 2017 {published data only}
- Семенов, Л А. Effects of third physical education lesson on primary pupils' physical conditioning process [Влияние третьего урока физической культуры на кондиционную подготовленность учащихся младших класс ов]. Teoria i Praktika Fiziceskoj Kul'tury 2017;5:100-2. [Google Scholar]
项立敏 2016 {published data only}
- 项立敏. A study of the connotations of implementing compulsory physical education in schools in China [我国学校实施强制体育的内涵]. Journal of Physical Education/Tiyu Xuekan 2016;23(2):107-11. [Google Scholar]
References to studies awaiting assessment
Brown 2017 {published data only}ISRCTN31583496
- Brown HE, Whittle F, Jong ST, Croxson C, Sharp SJ, Wilkinson P, et al. A cluster randomised controlled trial to evaluate the effectiveness and cost-effectiveness of the GoActive intervention to increase physical activity among adolescents aged 13-14 years. BMJ Open 2017;7(9):e014419. [DOI] [PMC free article] [PubMed] [Google Scholar]
- Jong ST, Croxson CHD, Guell C, Lawlor ER, Foubister C, Brown HE, et al. Adolescents’ perspectives on a school-based physical activity intervention: a mixed method study. Journal of Sport and Health Sciences 2020;9(1):28-40. [DOI] [PMC free article] [PubMed] [Google Scholar]
Chen 2015 {published data only}
- Chen Y, Ma L, Ma Y, Wang H, Luo J, Zhang X, et al. A national school-based health lifestyles interventions among Chinese children and adolescents against obesity: rationale, design and methodology of a randomized controlled trial in China. BMC Public Health 2015;15:210. [DOI] [PMC free article] [PubMed] [Google Scholar]
Friedrich 2015 {published data only}
- Friedrich RR, Caetano LC, Schiffner MD, Wagner MB, Schuch I. Design, randomization and methodology of the TriAtiva Program to reduce obesity in school children in Southern Brazil. BMC Public Health 2015;15:363. [DOI] [PMC free article] [PubMed] [Google Scholar]
Kovalskys 2017 {published data only}ISRCTN58093412
- Kovalskys I, Rausch Herscovici C, Indart Rougier P, De Gregorio MJ, Zonis L, Orellana L. Study protocol of MINI SALTEN: a technology-based multi-component intervention in the school environment targeting healthy habits of first grade children and their parents. BMC Public Health 2017;17(1):401. [DOI] [PMC free article] [PubMed] [Google Scholar]
Lonsdale 2016 {published data only}ACTRN12616000731493
- Lonsdale C, Sanders T, Cohen KE, Parker P, Noetel M, Hartwig T, et al. Scaling-up an efficacious school-based physical activity intervention: study protocol for the 'Internet-based Professional Learning to help teachers support Activity in Youth' (iPLAY) cluster randomized controlled trial and scale-up implementation evaluation. BMC Public Health 2016;16(1):873. [DOI] [PMC free article] [PubMed] [Google Scholar]
Martinez‐Vizcaino 2019 {published data only}NCT03236337
- Martinez-Vizcaino V, Alvarez-Bueno C, Cavero-Redondo I, Pozuelo-Carrascosa DP, Garrido-Miguel M, Martinez-Hortelano JA, et al. MOVI-daFIT! Intervention: rationale and design of a cluster randomized controlled trial testing the effects on improving adiposity, cognition, and subclinical atherosclerosis by increasing cardiorespiratory fitness in children. Medicine (Baltimore) 2019;98(9):e14737. [DOI] [PMC free article] [PubMed] [Google Scholar]
Nathan 2019 {published data only}ACTRN12617001265369
- Nathan N, Wiggers J, Bauman AE, Rissel C, Searles A, Reeves P, et al. A cluster randomised controlled trial of an intervention to increase the implementation of school physical activity policies and guidelines: study protocol for the physically active children in education (PACE) study. BMC Public Health 2019;19(1):170. [DOI] [PMC free article] [PubMed] [Google Scholar]
NCT03579810 {published data only}
NCT03817047 {published data only}
NCT03983447 {published data only}
- School intervention to promote physical activity and reduce the sedentary time of low-income children aged 6-13 years. 2019. https://clinicaltrials.gov/show/NCT03983447.
O'Malley 2011 {published data only}
- O'Malley CL, Douthwaite W, Moore HJ, Summerbell CD, Batterham AM. TeesCAKE (teesside consumption and activity for kids experience) project: effectiveness of an evidence-based health promotion intervention in children aged 9-10 years living within a socially deprived area of the UK. Obesity Reviews 2011;12:74-5. [Google Scholar]
Salmon 2011a {published data only}
- Salmon J, Arundell L, Hume C, Brown H, Hesketh K, Dunstan DW, et al. A cluster-randomized controlled trial to reduce sedentary behavior and promote physical activity and health of 8-9 year olds: the Transform-Us! study. BMC Public Health 2011;11:759. [ISRCTN83725066] [DOI] [PMC free article] [PubMed] [Google Scholar]
Takehara 2019 {published data only}
- Takehara K, Ganchimeg T, Kikuchi A, Gundegmaa L, Altantsetseg L, Aoki A, et al. The effectiveness of exercise intervention for academic achievement, cognitive function, and physical health among children in Mongolia: a cluster RCT study protocol. BMC Public Health 2019;19(1):697. [DOI] [PMC free article] [PubMed] [Google Scholar]
Telford 2019 {published data only}
- Telford R, Olive L, Keegan R, Barnett L, Telford R. The physical education and physical literacy (PEPL) approach: a multicomponent primary school intervention targeting physical literacy. Journal of Science and Medicine in Sport 2019;22:2019 ASICS SMA Conference. Novotel Twin Waters, Australia. 22 (Suppl 2) (p S21). [Google Scholar]
Wassenaar 2019 {published data only}
- Wassenaar TM, Wheatley CM, Beale N, Salvan P, Meaney A, Possee JB, et al. Effects of a programme of vigorous physical activity during secondary school physical education on academic performance, fitness, cognition, mental health and the brain of adolescents (Fit to Study): study protocol for a cluster-randomised trial. Trials 2019;20(1):189. [DOI] [PMC free article] [PubMed] [Google Scholar]
Wright 2016 {published data only}
- Wright CM, Chomitz VR, Duquesnay PJ, Amin SA, Economos CD, Sacheck JM. The FLEX study school-based physical activity programs - measurement and evaluation of implementation. BMC Public Health 2019;19:73. [DOI] [PMC free article] [PubMed] [Google Scholar]
- Wright CM, Duquesnay PJ, Anzman-Frasca S, Chomitz VR, Chui K, Economos CD, et al. Study protocol: the Fueling Learning through Exercise (FLEX) study - a randomized controlled trial of the impact of school-based physical activity programs on children's physical activity, cognitive function, and academic achievement. BMC Public Health 2016;16(1):1078. [DOI] [PMC free article] [PubMed] [Google Scholar]
References to ongoing studies
Demetriou 2019 {published data only}
- Demetriou Y, Bachner J. A school-based intervention based on self-determination theory to promote girls' physical activity: study protocol of the CReActivity cluster randomised controlled trial. BMC Public Health 2019;19(1):519. [DRKS00015723] [DOI] [PMC free article] [PubMed] [Google Scholar]
Ferreira da Silva dos Santos 2020 {published data only}
- Ferreira da Silva dos Santos S, Bordin D, Fernanda Dornelas de Souza E, Forte Freitas Júnior I. Study protocol and baseline characteristics of “SCHOOL IN ACTION” program on support to physical activity and healthy lifestyles in adolescents. Contemporary Clinical Trials Communications 2020;17:100505. [CLINICALTRIALS.GOV: NCT03153176] [DOI] [PMC free article] [PubMed] [Google Scholar]
ISRCTN74109264 {published data only}
- ISRCTN. Engaging adolescents in changing behaviour: a programme of research to improve the diets and physical activity levels of adolescents. 2019. http://www.who.int/trialsearch/Trial2.aspx?TrialID=ISRCTN74109264.
NCT03440580 {published data only}
- BOOSTH: Promoting Physical Activity in Primary Schools in Combination With Serious Gaming. Ongoing study. 17 August 2018 31 December 2020 (anticipated). Contact author for more information.
NCT03504059 {published data only}
- School-based Behavioural Intervention to Face Obesity and Promote Cardiovascular Health Among Spanish Adolescents. Ongoing study. 1 June 2017 30 June 2021 (anticipated). Contact author for more information.
O'Kane 2020 {published data only}
- O'Kane SM, Carlin A, Gallagher AM, Lahart IM, Jago R, Faulkner M, et al. A study protocol for a clustered randomised controlled trial to evaluate the effectiveness of a peer-led school-based walking intervention on adolescent girls’ physical activity: the Walking In ScHools (WISH) study. BMC Public Health 2020;20:541. [ISRCTN: ISRCTN12847782] [DOI] [PMC free article] [PubMed] [Google Scholar]
Oluwasanu 2017 {published data only}PACTR201706002224335
- Oluwasanu MM, Oladepo O. Effects of a multi-level intervention on the pattern of physical activity among in-school adolescents in Oyo state Nigeria: a cluster randomised trial. BMC Public Health 2017;17(1):833. [DOI] [PMC free article] [PubMed] [Google Scholar]
Santos‐Beneit 2019 {published data only}
- Fernandez-Jimenez R, Santos-Beneit G, Tresserra-Rimbau A, Bodega P, Miguel M, Cos-Gandoy A, et al. Rationale and design of the school-based SI! Program to face obesity and promote health among Spanish adolescents: a cluster-randomized controlled trial.. American Heart Journal 2019;215:27-40. [DOI] [PubMed] [Google Scholar]
- Santos-Beneit G, Bodega P, Miguel M, Rodriguez C, Carral V, Orrit X, Haro D, et al. Rationale and design of the SI! Program for health promotion in elementary students aged 6 to 11 years: a cluster randomized trial. American Heart Journal 2019;210:9-17. [DOI] [PubMed] [Google Scholar]
Sutherland 2019 {published data only}
- Sutherland R, Campbell E, Nathan N, Wolfenden L, Lubans DR, Morgan PJ, et al. A cluster randomised trial of an intervention to increase the implementation of physical activity practices in secondary schools: study protocol for scaling up the Physical Activity 4 Everyone (PA4E1) program. BMC Public Health 2019;19(1):883. [DOI] [PMC free article] [PubMed] [Google Scholar]
Szabo‐Reed 2020 {published data only}
- Szabo-Reed AN, Washburn RA, Leon Greene J, Ptomey LT, Gorczyca A, Lee RH, et al. Physical activity across the curriculum (PAAC3): testing the application of technology delivered classroom physical activity breaks. Contemporary Clinical Trials 2020;90:105952. [DOI] [PMC free article] [PubMed] [Google Scholar]
van Delden 2020 {published data only}
- Delden AEQ, Band GPH, Slaets JPJ. A good beginning: study protocol for a group-randomized trial to investigate the effects of sit-to-stand desks on academic performance and sedentary time in primary education. BMC Public Health 2020;20:70. [DOI] [PMC free article] [PubMed] [Google Scholar]
Willis 2019 {published data only}
- Willis K, Tibbitts B, Sebire SJ, Reid T, MacNeill SJ, Sanderson E, et al. Protocol for a cluster randomised controlled trial of a Peer-Led physical Activity iNtervention for Adolescent girls (PLAN-A). BMC Public Health 2019;19(1):644. [DOI] [PMC free article] [PubMed] [Google Scholar]
Additional references
Aubert 2018
- Aubert S, Barnes JD, Abdeta C, Abi Nader P, Adeniyi AF, Aguilar-Farias N, et al. Global Matrix 3.0 Physical Activity Report Card Grades for Children and Youth: results and analysis from 49 countries. Journal of Physical Activity and Health 2018;15(S2):S251-73. [DOI] [PubMed] [Google Scholar]
Baranowski 1990
- Baranowski T, Simons-Morton B, Hooks P, Henske J, Tiernan K, Dunn JK, et al. A center based program for exercise change among Black-American families. Health Education Quarterly 1990;17(2):179-86. [DOI] [PubMed] [Google Scholar]
Bedard 2019
- Bedard C, St John L, Bremer E, Graham JD, Cairney J. A systematic review and meta-analysis on the effects of physically active classrooms on educational and enjoyment outcomes in school age children. PLoS One 2019;14(6):e0218633. [DOI] [PMC free article] [PubMed] [Google Scholar]
Beni 2017
- Beni S, Fletcher T, Ni Chroinin D. Meaningful experiences in physical education and youth sport: a review of the literature. Quest 2017;69(3):291-313. [Google Scholar]
Borenstein 2017a
- Borenstein M, Higgins JP, Hedges LV, Rothstein HR. Basics of meta-analysis: I² is not an absolute measure of heterogeneity. Research Synthesis Methods 2017;8(1):5-18. [DOI] [PubMed] [Google Scholar]
Borenstein 2017b
- Borenstein M. Prediction intervals. www.meta-analysis.com/prediction (accessed 3 July 2017).
Boutron 2014
- Boutron I, Altman DG, Hopewell S, Vera-Badillo F, Tannock I, Ravaud P. Impact of spin in the abstracts of articles reporting results of randomized controlled trials in the field of cancer: the SPIIN randomized controlled trial. Journal of Clinical Oncology 2014;32:4120-6. [DOI] [PubMed] [Google Scholar]
Brown 2009
- Brown AS. Promoting physical activity amongst adolescent girls. Issues in Comprehensive Pediatric Nursing 2009;32(2):49-64. [DOI] [PubMed] [Google Scholar]
Buch 2011
- Buch MH, Aletaha D, Emery P, Smolen JS. Reporting of long-term extension studies: lack of consistency calls for consensus. Annals of the Rheumatic Diseases 2011;70(6):886-90. [DOI] [PubMed] [Google Scholar]
Cain 2013
- Cain KL, Sallis JF, Conway TL, Van Dyck D, Calhoon L. Using accelerometers in youth physical activity studies: a review of methods. Journal of Physical Activity and Health 2013;10(3):437-50. [DOI] [PMC free article] [PubMed] [Google Scholar]
Carson 2017
- Carson V, Chaput JP, Janssen I, Tremblay MS. Health associations with meeting new 24-hour movement guidelines for Canadian children and youth. Preventive Medicine 2017;95:7-13. [DOI] [PubMed] [Google Scholar]
CDC 1999
- Centers for Disease Control. Chapter 6: understanding and promoting physical activity. Surgeon General's Report on Physical Activity & Health 1999:210-59.
CDC 2011
- Centers for Disease Control & Prevention. School health guidelines to promote healthy eating and physical activity. Recommendations and Reports 2011. [PubMed]
Centers for Disease Control and Prevention, 2021
- Centers for Disease Control and Prevention. Child Development Basics, 22 February 2021. https://www.cdc.gov/ncbddd/childdevelopment/facts.html.
Cesa 2014
- Cesa CC, Sbruzzi G, Ribeiro RA, Barbiero SM, Oliveira Petkowicz R, Eibel B, et al. Physical activity and cardiovascular risk factors in children: meta-analysis of randomized clinical trials. Preventive Medicine 2014;69:54-62. [DOI] [PubMed] [Google Scholar]
Chaput 2020
- Chaput JP, Willumsen J, Bull F, Chou R, Ekelund U, Firth J, et al. 2020 WHO guidelines on physical activity and sedentary behaviour for children and adolescents aged 5–17 years: summary of the evidence. International Journal of Behavioral Nutrition and Physical Activity 2020;17:141. [DOI] [PMC free article] [PubMed] [Google Scholar]
CONSORT 2018
- Consolidated Standards of Reporting Trials (CONSORT). The CONSORT statement. www.consort-statement.org (accessed 25 July 2018).
Corbett 2014
- Corbett MS, Higgins JP, Woolacott NF. Assessing baseline imbalance in randomised trials: implications for the Cochrane risk of bias tool. Research Synthesis Methods 2014;5:79-85. [DOI] [PubMed] [Google Scholar]
Deeks 2021
- Deeks JJ, Higgins JPT, Altman DG (editors), on behalf of the Cochrane Statistical Methods Group. Chapter 10. Analysing data and undertaking meta-analyses. In: Higgins JT, Churchill R, Chandler J, Cumpston MS (editors). Cochrane Handbook for Systematic Reviews of Interventions version 6.2.0 (updated February 2021). Cochrane, 2021. Available from www.training.cochrane.org/handbook.
Ding Ding 2016
- Ding Ding D, Lawson KD, Kolbe-Alexander TL, Finkelstein EA, Katzmarzyk PT, Mechelen W, for the Lancet Physical Activity Series 2 Executive Committee. The economic burden of physical inactivity: a global analysis of major non-communicable diseasesAuthor links open overlay panel. The Lancet 2016;388(10051):24-30. [DOI] [PubMed] [Google Scholar]
Freedson 1992
- Freedson PS, Rowland TW. Youth activity versus youth fitness: let's redirect our efforts. Research Quarterly for Exercise and Sport 1992;63(2):133-6. [DOI] [PubMed] [Google Scholar]
Glanville 2019a
- Glanville J, Foxlee R, Wisniewski S, Noel-Storr A, Edwards M, Dooley G. Translating the Cochrane EMBASE RCT filter from the Ovid interface to Embase.com: a case study. Health Information and Libraries Journal 2019;36:264-77. [DOI] [PubMed] [Google Scholar]
Glanville 2019b
- Glanville J, Dooley G, Wisniewski S, Foxlee R, Noel-Storr A. Development of a search filter to identify reports of controlled clinical trials within CINAHL Plus. Health Information and Libraries Journal 2019;36:73-90. [DOI] [PubMed] [Google Scholar]
Granger 2017
- Granger E, Di Nardo F, Harrison A, Patterson L, Holmes R, Verma A. A systematic review of the relationship of physical activity and health status in adolescents. European Journal of Public Health 2017;27(Suppl_2):100-6. [DOI] [PubMed] [Google Scholar]
Guthold 2020
- Guthold R, Stevens GA, Riley LM, Bull FC. Global trends in insufficient physical activity among adolescents: a pooled analysis of 298 population-based surveys with 1·6 million participants. Lancet Child & Adolescent Health 2020;4(1):25-35. [DOI: 10.1016/S2352-4642(19)30323-2] [DOI] [PMC free article] [PubMed] [Google Scholar]
Hayes 2019
- Hayes G, Dowd KP, MacDonncha C, Donnelly AE. Tracking of physical activity and sedentary behavior from adolescence to young adulthood: a systematic literature review. Journal of Adolescent Health 2019;65(4):446-54. [DOI] [PubMed] [Google Scholar]
Higgins 2002
- Higgins JT, Thompson SG. Quantifying heterogeneity in a meta-analysis. Statistics in Medicine 2002;21(11):1539-58. [DOI] [PubMed] [Google Scholar]
Higgins 2003
- Higgins JT, Thompson SG, Deeks JJ, Altman DG. Measuring inconsistency in meta-analyses. BMJ 2003;327(7414):557-60. [DOI] [PMC free article] [PubMed] [Google Scholar]
Higgins 2009
- Higgins JT, Thompson SG, Spiegelhalter DJ. A re-evaluation of random-effects meta-analysis. Journal of the Royal Statistical Society. Series A (Statistics in Society) 2009;172(1):137-59. [DOI] [PMC free article] [PubMed] [Google Scholar]
Higgins 2011
- Higgins JT, Deeks JJ, Altman DG, editor(s), on behalf of the Cochrane Statistical Methods Group. Chapter 16. Special topics in statistics. In: Higgins JT, Green S (editors). Cochrane Handbook for Systematic Reviews of Interventions, version 5.1.0 (updated March 2011). The Cochrane Collaboration, 2011. Available from www.handbook.cochrane.org.
Higgins 2017
- Higgins JT, Altman DG, Sterne JAC (editors). Chapter 8. Assessing risk of bias in included studies. In: Higgins JT, Churchill R, Chandler J, Cumpston MS (editors). Cochrane Handbook for Systematic Reviews of Interventions version 5.2.0 (updated June 2017). Cochrane, 2017. Available from training.cochrane.org/handbook.
Hills 2011
- Hills AP, Andersen LB, Byrne NM. Physical activity and obesity in children. British Journal of Sports Medicine 2011;45:866-70. [DOI] [PubMed] [Google Scholar]
Ho 2012
- Ho M, Garnett SP, Baur L, Burrows T, Stewart L, Neve M, Collins C. Effectiveness of lifestyle interventions in child obesity: systematic review with meta-analysis. Pediatrics 2012;130(6):e1647-71. [DOI] [PubMed] [Google Scholar]
Ho 2013
- Ho M, Garnett SP, Baur LA, Burrows T, Stewart L, Neve M, Collins C. Impact of dietary and exercise interventions on weight change and metabolic outcomes in obese children and adolescents: a systematic review and Meta-analysis of randomized trials. JAMA Pediatrics 2013;167(8):759-68. [DOI] [PubMed] [Google Scholar]
Hoffmann 2014
- Hoffmann TC, Glasziou PP, Boutron I, Milne R, Perera R, Moher D, et al. Better reporting of interventions: template for intervention description and replication (TIDieR) checklist and guide. BMJ 2014;348:g1687. [DOI] [PubMed] [Google Scholar]
IUHPE 2010
- International Union for Health Promotion and education. Promoting health in schools from evidence to action. IUHPE thematic resources 2010. [https://www.iuhpe.org/images/PUBLICATIONS/THEMATIC/HPS/Evidence-Action_ENG.pdf]
Janssen 2010
- Janssen I, LeBlanc AG. Systematic review of the health benefits of physical activity and fitness in school-aged children and youth. International Journal of Behavioral Nutrition and Physical Activity 2010;7(40):1-16. [DOI] [PMC free article] [PubMed] [Google Scholar]
Jones 2015a
- Jones CW, Keil LG, Holland WC, Caughey MC, Platts-Mills TF. Comparison of registered and published outcomes in randomized controlled trials: a systematic review. BMC Medicine 2015;13:282. [DOI: 10.1186/s12916-015-0520-3] [DOI] [PMC free article] [PubMed] [Google Scholar]
Jones 2019
- Jones RA, Blackburn NE, Woods C, Byrne M, Nassau F, Tully MA. Interventions promoting active transport to school in children: a systematic review and meta-analysis. Preventive Medicine 2019;123:232-41. [DOI] [PubMed] [Google Scholar]
King 2002
- King AC, Stokols D, Talen E, Brassington GS, Killingsworth R. Theoretical approaches to the promotion of physical activity: forging a transdisciplinary paradigm. American Journal of Preventive Medicine 2002;23(2 Suppl):15-25. [DOI] [PubMed] [Google Scholar]
Kirkham 2010
- Kirkham JJ, Dwan KM, Altman DG, Gamble C, Dodd S, Smyth R et al. The impact of outcome reporting bias in randomised controlled trials on a cohort of systematic reviews. BMJ 2010;340:c365. [DOI: 10.1136/bmj.c365] [DOI] [PubMed] [Google Scholar]
Kriemler 2011a
- Kriemler S, Meyer U, Martin E, Sluijs EM, Andersen LB, Martin BW. Effect of school-based interventions on physical activity and fitness in children and adolescents: a review of reviews and systematic update. British Journal of Sports Medicine 2011;45(11):923-30. [DOI] [PMC free article] [PubMed] [Google Scholar]
Ladwig 2018
- Ladwig MA, Vazou S, Ekkekakis P. “My best memory is when I was done with it”: PE memories are associated with adult sedentary behavior. Translational Journal of the ACSM 2018;3(16):119-29. [Google Scholar]
Lee 2012a
- Lee I, Shiroma EJ, Lobelo F, Puska P, Blair SN, Katzmarzyk PT, Lancet Physical Activity Series Working Group. Effect of physical inactivity on major non-communicable diseases worldwide: an analysis of burden of disease and life expectancy. Lancet 2012;380(9838):219-29. [DOI] [PMC free article] [PubMed] [Google Scholar]
Lefebvre 2019
- Lefebvre C, Glanville J, Briscoe S, Littlewood A, Marshall C, Metzendorf M-I, et al. Technical supplement to Chapter 4. Searching for and selecting studies. I. In: Higgins JT, Thomas J, Chandler J, Cumpston MS, Li T, Page MJ, et al, editors(s). Cochrane Handbook for Systematic Reviews of Interventions. 6th edition. Cochrane, 2019. [Google Scholar]
Liberati 2009
- Liberati A, Altman DG, Tetzlaff J, Mulrow C, Gøtzsche PC, Ioannidis JPA, et al. The PRISMA statement for reporting systematic and meta-analyses of studies that evaluate interventions: explanation and elaboration. PLoS Medicine 2009;6(7):1-28. [DOI: 10.1371/journal.pmed.1000100] [DOI] [PMC free article] [PubMed] [Google Scholar]
Love 2019
- Love R, Adams J, Sluijs EMF. Are school-based physical activity interventions effective and equitable? A meta-analysis of cluster randomized controlled trials with accelerometer-assessed activity. Obesity Reviews 2019;20(6):859-70. [DOI] [PMC free article] [PubMed] [Google Scholar]
Macnab 2014
- Macnab AJ, Gagnon FA, Stewart D. Health promoting schools: consensus, strategies, and potential. Health Education 2014;114(3):170-85. [Google Scholar]
Marker 2016
- Marker AM, Steele RG, Noser AE. Physical activity and health-related quality of life in children and adolescents: a systematic review and meta-analysis. Health Psychology 2018;37(10):893-903. [DOI] [PubMed] [Google Scholar]
Masini 2020
- Masini A, Marini S, Gori D, Leoni E, Rochira A, Dallolio L. Evaluation of school-based interventions of active breaks in primary schools: a systematic review and meta-analysis. Journal of Science & Medicine in Sport 2020;23(4):377-84. [DOI] [PubMed] [Google Scholar]
Mathieu 2009
- Mathieu S, Boutron I, Moher D, Altman DG, Ravaud P. Comparison of registered and published primary outcomes in randomized controlled trials. JAMA 2009;302:977-84. [DOI] [PubMed] [Google Scholar]
McKenzie 2021
- McKenzie JE, Brennan SE. Chapter 12. Synthesizing and presenting findings using other methods. In: Higgins JT, Thomas J, Chandler J, Cumpston M, Li T, Page MJ, et al, editors(s). Cochrane Handbook for Systematic Reviews of Interventions, version 6.2 (updated February 2021). Cochrane, 2021. Available at www.training.cochrane.org/handbook. [Google Scholar]
Megan 2012
- Megan B, Pickering RM, Weatherall M. Design, objectives, execution and reporting of published open-label extension studies. Journal of Evaluation in Clinical Practice 2012;18(2):209-15. [DOI] [PubMed] [Google Scholar]
Menschik 2008
- Menschik D, Ahmed S, Alexander MH, Blum RW. Adolescent physical activities as predictors of young adult weight. Archives of Pediatrics & Adolescent Medicine 2008;162(1):29-33. [DOI] [PubMed] [Google Scholar]
Morris 1994
- Morris JN. Exercise in the prevention of coronary heart disease: today's best buy in public health. Medicine and Science in Sports and Exercise 1994;26(7):807-14. [PubMed] [Google Scholar]
Murray 2006
- Murray DM, Stevens J, Hannan, PJ, Catellier DJ, Schmitz KH, Dowda M, et al. School-level intraclass correlation for physical activity in sixth grade girls. Medicine & Science in Sports & Exercise 2006;38(5):926-36. [DOI] [PMC free article] [PubMed] [Google Scholar]
Naylor 2009
- Naylor PJ, McKay HA. Prevention in the first place: schools - a setting for action on physical inactivity. British Journal of Sports Medicine 2009;43(1):10-3. [DOI] [PubMed] [Google Scholar]
Nevill 2020
- Nevill AM, Duncan MJ, Sandercock G. Modeling the dose – response rate/associations between VO2max and self-reported Physical Activity Questionnaire in children and adolescents. Journal of Sport and Health Science 2020;9(1):90-5. [DOI] [PMC free article] [PubMed] [Google Scholar]
Poitras 2016
- Poitras VJ, Gray CE, Borghese MM, Carson V, Chaput JP, Janssen I, et al. Systematic review of the relationships between objectively measured physical activity and health indicators in school-aged children and youth. Applied Physiology Nutrition and Metabolsim 2016;41(6 Suppl 3):S197-239. [DOI] [PubMed] [Google Scholar]
RevMan 2014 [Computer program]
- Review Manager (RevMan). Version 5.3. Copenhagen: The Nordic Cochrane Centre, The Cochrane Collaboration, 2014.
Scherer 2007
- Scherer RW, Langenberg P, von EE. Full publication of results initially presented in abstracts. Cochrane Database of Systematic Reviews 2007, Issue 2. Art. No: MR000005. [DOI: 10.1002/14651858.MR000005.pub3] [DOI] [PubMed] [Google Scholar]
Schünemann 2021
- Schünemann HJ, Higgins JT, Vist GE, Glasziou P, Akl E, Skoetz N, Guyatt GH, on behalf of the Cochrane GRADEing Methods Group (formerly Applicability and Recommendations Methods Group) and the Cochrane Statistical Methods Group. Cochrane Handbook for Systematic Reviews of Interventions, February 2021. 6.2 edition. Available from www.training.cochrane.org/handbook. [Google Scholar]
Shephard 1997
- Shephard RJ. What is the optimal type of physical activity to enhance health? Journal of Sports Medicine 1997;31:277-84. [DOI] [PMC free article] [PubMed] [Google Scholar]
Singh 2017
- Singh A, Bassi S, Nazar GP, Saluja K, Park M, Kinra S, et al. Impact of school policies on non-communicable disease risk factors - a systematic review. BMC Public Health 2017;17(1):292. [DOI] [PMC free article] [PubMed] [Google Scholar]
Sriram 2021
- Sriram K, Mulder HS, Frank HR, Santanam TS, Skinner AC, Perrin EM, et al. The dose-response relationship between physical activity and cardiometabolic health in adolescents. American Journal of Preventive Medicine 2021;60(1):95-103. [DOI] [PMC free article] [PubMed] [Google Scholar]
Sterne 2017
- Sterne JAC, Egger M, Moher D, Boutron I (editors). Chapter 10. Addressing reporting biases. In: Higgins JT, Churchill R, Chandler J, Cumpston MS (editors). Cochrane Handbook for Systematic Reviews of Interventions, version 5.2.0 (updated June 2017). Cochrane, 2017. Available from training.cochrane.org/handbook.
Story 2009
- Story M, Nanney MS, Schwartz MB. Schools and obesity prevention: creating school environments and policies to promote healthy eating and physical activity. The Milbank Quarterly 2009;87(1):71-100. [DOI] [PMC free article] [PubMed]
Telama 2005
Tolfrey 2000
- Tolfrey K, Jones AM, Campbell IG. The effect of aerobic exercise training on the lipid-lipoprotein profile of children and adolescents. Sports Medicine 2000;29(2):99-112. [DOI] [PubMed] [Google Scholar]
Twisk 2000
Warburton 2017
- Warburton DER, Bredin SSD. Health benefits of physical activity: a systematic review of current systematic reviews. Current Opinion in Cardiology 2017;32(5):541-56. [DOI] [PubMed] [Google Scholar]
Watson 2017a
- Watson A, Timperio A, Brown H, Best K, Hesketh KD. Effect of classroom-based physical activity interventions on academic and physical activity outcomes: a systematic review and meta-analysis. International Journal of Behavior Nutrition and Physical Activity 2017;14(1):114. [DOI] [PMC free article] [PubMed] [Google Scholar]
WHO 2008
- World Health Organization (WHO). Global Strategy on Diet, Physical Activity and Health, 2008. https://www.who.int/dietphysicalactivity/factsheet_inactivity/en/ (accessed 12 December 2019).
References to other published versions of this review
Dobbins 2009
- Dobbins M, De Corby K, Robeson P, Husson H, Tirilis D. School-based physical activity programs for promoting physical activity and fitness in children and adolescents aged 6-18. Cochrane Database of Systematic Reviews 2009, Issue 1. Art. No: CD007651. [DOI: 10.1002/14651858.CD007651] [DOI] [PubMed] [Google Scholar]
Dobbins 2013
- Dobbins M, Husson H, DeCorby K, LaRocca RL. School-based physical activity programs for promoting physical activity and fitness in children and adolescents aged 6 to 18. Cochrane Database of Systematic Reviews 2013, Issue 2. Art. No: CD007651. [DOI: 10.1002/14651858.CD007651.pub2] [DOI] [PMC free article] [PubMed] [Google Scholar]