

Abstract
Extracellular vesicles (EVs) are important mediators of intercellular communication. Their role in disease processes, uncovered mostly over the last two decades, makes them potential biomarkers, leading to a need to fundamentally understand EV biology. Direct visualization of EVs can provide insights into EV behavior, but current labeling techniques are often restricted by false-positive signals and rapid photobleaching. Hence, we developed a method of labeling EVs through conjugation with quantum dots (QDs)—high photoluminescent nanosized semi-conductors—using click chemistry. We showed that QD-EV conjugation could be tailored by altering QD to EV ratio or by using a catalyst. This conjugation chemistry was stable in a biological environment and upon storage for up to a week. Using size-exclusion chromatography, QD-EV conjugates could be separated from unconjugated QDs, enabling EV-specific signal detection. We demonstrate that these QD-EV conjugates can be live- and fixed-imaged in high resolution on cells and in tissue sheets, and the conjugates have better photostability compared with the commonly used EV dye DiI. We labeled two distinct EV populations: human semen EVs (sEVs) from fresh semen samples donated by healthy volunteers and brain EVs (bEVs) from excised rat brain tissues. We visualized QD-sEVs in epithelial sheets isolated from human vaginal mucosa and time-lapse imaged QD-bEV interactions with microglial BV-2 cells. The development of the QD-EV conjugate will benefit the study of EV localization, movement, and function and accelerate their potential use as biomarkers, therapeutic agents, or drug-delivery vehicles.
Keywords: extracellular vesicles, quantum dots, click chemistry, labeling, live imaging
Graphical Abstract

INTRODUCTION
Extracellular vesicles (EVs), including exosomes, microvesicles, and apoptotic bodies, are membranous small vesicles released from almost all cell types. EVs are important mediators of intercellular communication.1 EVs carry diverse molecules, ranging from small nucleic acids, including noncoding microRNA (miRNA) and mRNA to large protein structures.2 EVs have the capability to merge with target cells and release their genetic or functional cargo, resulting in local and/or remote influence on biological processes.
The important role EVs play in physiology and pathophysiology has only come to light within the last two decades. Recent evidence demonstrates EVs are involved in immune modulation,3,4 infection and autoimmune diseases,5 and neuroinflammatory processes in neurological diseases.6 Because of the role of EVs in intercellular communication, there is emerging interest in the potential application of EVs in the clinic, as biomarkers,7 drug-delivery vehicles,8 or therapeutics.9 However, fundamental knowledge of EV behavior is still required to further the understanding and clinical potential of EVs. Therefore, direct visualization of EVs can be useful to understand EV trafficking and function between cells and within tissues.
Current techniques for labeling and imaging EVs, however, have several challenges and limitations.10 Commonly used lipophilic dyes, including R18, DiI, PKH26, PKH67, or CellMask, target the lipid membrane of EVs; yet, these dyes can also form dye aggregates that are of similar size to EVs and therefore hard to distinguish.11,12 Lipoproteins and other proteins coisolated with EVs can also be stained with lipophilic dyes, which can transfer dye to the target cell, resulting in false-positive stains that could imply EV uptake.12 RNA-based labeling methods have similar vesicle or dye aggregation challenges as lipophilic dyes.13 Optical reporters including green fluorescence protein (GFP) are successfully engineered to be fused to EVs within cells for EV labeling and are useful for studying the genesis and distribution in vivo;14 however, GFP-transfected cells currently have limited translational potential to humans. In addition, these dyes often suffer from fast photobleaching. A universal, robust, highly photo-luminescent, and easily controllable method is thus required to fill in the technological gap of direct EV tagging and visualization.
Quantum dots (QDs) are one excellent candidate label because of their unique physiochemical properties and extensive use in biological imaging. QDs have tunable excitation/emission spectra, robust photostability compared with organic dye, and efficient luminescence, favoring longer-exposure imaging.15 There are numerous studies that utilize QDs to label and monitor molecules or cells of interest in vitro16 or in vivo.17 Our previous work shows QDs functionalized with poly(ethylene glycol) (PEG) exhibit minimal toxicity (<15%) in the developing brain, are stable in biological aqueous settings, and can be easily imaged in tissues.18 Here, we propose using 4-formylbenzoate (4FB) to 6-hydrazinonicotinate acetone hydrazone (HyNic) click chemistry to label EVs with QDs. 4FB-HyNic click chemistry can provide control over nuanced stoichiometry and labeling efficiency for QD conjugation.19 We investigate the optimization of the formation of the QD-EV bond to design the most reproducible and stable QD-EV conjugate for imaging in vitro and ex vivo. We compare the photostability of QD-EV conjugates and DiI-labeled EVs to demonstrate the advantages of QD-EV conjugates over traditional EV labeling methods. We also explore the universality of this QD-EV conjugation by applying QD modification to diverse EV sources, including EVs isolated from human semen (sEVs) and the whole rat brain (bEVs). Moreover, we utilize QD-sEV conjugates on human vaginal epithelial sheet and QD-bEV conjugates on BV-2 murine microglial cells to image cellular interaction of EVs. This comprehensive approach establishes a robust system for individual EV visualization, which can benefit a fundamental understanding of EV function and further the potential clinical application of EVs.
RESULTS AND DISCUSSION
Chemistry for QD-EV Conjugation.
The method for linking nanoparticles to EVs needs to be carefully chosen to be easily tailored and to minimally disrupt EV structural integrity. QDs have been previously tagged to EVs via immune-reaction either through cell-specific molecules20–24 or EV-characteristic antigens such as CD63.25–28 However, EVs labeled with antibodies may become immunogenic,29,30 and the QD coupled to the antibody can be far from the EV surface.27,31 More importantly, molecules such as CD63 are not present on all EV populations,32 so any method based on immunoaffinity would only capture a subpopulation of EVs. Another approach of nanotechnology-based EV labeling involves internalizing either gold,33 iron oxide nanoparticles,34,35 or QDs36,37 into EVs, which can be nonuniform, diffusion driven, and disruptive to EV biofunction.
We chose a hydrazine-aldehyde-based strategy to label EVs with QDs through the click chemistry 4FB to HyNic (Figure 1). This chemistry is reactive under mild conditions and is tailorable, resulting in high labeling efficiency and preservation of QD optical properties and biological target function.38 The 4FB-HyNic coupling reaction has successfully linked different molecules in previous studies,39,40 including linking antibodies to polymersomes41 and QDs to viruses,38 which share comparable size and structure with EVs.42 We used Sulfo-S-4FB and Sulfo-S-HyNic because they contain Sulfo-NHS esters, making this linker water-soluble without needing organic solvent, which might be harmful to EVs. We modified commercially available PEG-NH2 functionalized QDs (QD-PEG-NH2) with Sulfo-S-4FB and EVs with Sulfo-S-HyNic utilizing the amine-reactive NHS-ester. The protein-enriched membrane of EVs is an advantage for amine-based coupling of HyNic, which can be generic to all sources of EVs.
Figure 1.

Schematic of QD-EV conjugation chemistry. PEG-NH2-modified QDs are first conjugated with Sulfo-S-4FB (QD-4FB). EVs, which contain a surface rich in primary amines, are modified with Sulfo-S-HyNic (EV-HyNic). Under mild conditions at room temperature, the QD-4FB and EV-HyNic are reacted together to form a stable bis-aryl bond.
Characterization of Purified sEVs and QD-sEV Conjugates.
We first chose human sEVs to study the QD-EV conjugation because they are isolated from a body fluid and have been studied quite extensively. We isolated sEVs from healthy male volunteers by ultracentrifugation over sucrose cushions and characterized sEVs via Western blot and transmission electron microscopy (TEM).43 One concern for our QD-EV conjugation chemistry is that the NHS-ester used for QD and EV modification can react with any primary amine, which are abundant on proteins that can be coisolated with EVs purified by ultracentrifugation.12 Therefore, we took into account that coisolated proteins were smaller than EVs and separated them by size-exclusion chromatography (SEC) before conjugation (Figure 2A). We used the qEV column to further purify ultracentrifuge-isolated sEVs, and collected fractions (f) 1–25 to test the sEV particle quantity and protein concentrations. It has been previously established that purity of isolated EVs can be defined by the EV particle/protein ratio.44 Based on the sEV and protein distribution measured in f1–f25, f7–f11 contained 97% of the sEVs, while f14–f23 contained 86% of proteins without detectable sEVs (Figure 2A). To minimize labeling of non-EV protein particles for QD-EV conjugation, we used f7–f10, which contain high-purity sEVs.
Figure 2.

Characterization of purified sEVs and QD-sEV conjugates. (A) Representative data of sEV particle quantity (black) and protein concentration (red) distribution in elution f1-f25 of qEV column purification. f7-f11 contain ~97% of EVs with only 11% of protein, while f14-f23 contain 86% of protein. (B) Absorbance intensity at 354 nm of Sulfo-S-4FB (green), sEV-HyNic (orange), and sEV-HyNic + Sulfo-S-4FB (gray) during the first 30 min after chemical addition and mixing. sEV-HyNic modification was confirmed by increased absorbance at 354 nm (n = 3). (C) Absorbance intensity at 354 nm of Sulfo-S-4FB (green), Sulfo-S-HyNic (orange), and Sulfo-S-4FB + Sulfo-S-HyNic (gray) during the first 30 min after chemical mixing (n = 3). (D) Hydrodynamic sizes (left) and zeta potential (right) of QD-PEG-NH2 (black) and QD-4FB (green) in 1×PBS (n = 3). (E) Representative data of QD-sEV conjugates (blue) and QD-4FB alone (green) fluorescence intensity at 585 nm in elution f7–30 of qEV column purification of QD-sEV conjugates. (F) Size distribution of sEV-HyNic and QD-sEV (n = 3) - black lines represent SEM for each size reported. (G) Zeta potential of sEV-HyNic and QD-sEV conjugates in 1×PBS (n = 3). (H) Representative fluorescence spectra of QD-PEG-NH2 and QD-sEVs.
During the QD-EV conjugation reaction, we first characterized the modification of QD-4FB and EV-HyNic, to ensure the labeling of EVs and QDs was successful. We confirmed the existence of HyNic on sEVs by successfully reacting with 4FB and forming a detectable bond that can be measured by absorbance at 354 nm.38 Using ultraviolet-visible spectroscopy (UV-vis), we observed an increased absorbance signal at 354 nm after mixing of sEV-HyNic and free Sulfo-S-4FB during the first 30 min (Figure 2B). This matches the trend shown by conjugating free Sulfo-S-4FB to free Sulfo-S-HyNic (Figure 2C). Previous literature has shown a decrease in zeta potential indicates 4FB conjugation to a free amine group.38 We confirmed the modification of QD-PEG-NH2 with Sulfo-S-4FB by a decrease in zeta potential of QD-4FB (−3.7 mV) compared with QD-PEG-NH2 (0.9 mV) (Figure 2D). This reduction of zeta potential is likely due to the conversion of a few protonated PEG-NH3+ to 4FB after modification. The average hydrodynamic size of QD-PEG-NH2 and QD-4FB was 17.0 and 17.4 nm, respectively (Figure 2D), which indicates the modification of 4FB on QDs did not change the size of QDs.
To remove free QDs (~10–20 nm) from the QD-EV (~80–200 nm) conjugates and reduce signal from unconjugated QDs, we took advantage of the conjugate size difference and utilized SEC for further separation. We confirmed the successful separation of unconjugated QDs from conjugated QD-EVs after SEC by fluorescence spectroscopy. QD signal appeared in f7-f10 and f11-f28 for QD-sEV conjugate samples, while QD-alone samples only showed fluorescent signal in f10-f28 (Figure 2E). Since we identified f7-f10 as the fractions that contain the majority of sEVs (Figure 2A), the QD signal in f7-f10 detected from QD-sEV conjugate samples was considered to be derived from the QD-sEVs rather than unconjugated QDs. To minimize the retention of unconjugated QDs that can interfere with the signal from QD-sEVs, we only collected f7-f9 for further analysis and application.
We then measured the size and zeta potential of sEV-HyNic and QD-sEV conjugates after conjugation (Figure 2F,G). The average size of sEV-HyNic was 159.7 nm, and the average size of QD-sEV was 164.0 nm, characterized by NanoSight (Figure 2F). The zeta potential was −7.7 mV for sEV-HyNic and −9.1 mV for QD-sEVs (Figure 2G), as compared with −3.7 mV for QD-4FB (Figure 2D). These zeta potentials are all near-neutral.45 We confirmed the fluorescence spectra of QDs remained the same before and after conjugating to EVs (Figure 2H). This result further supports previous studies that the application of 4FB-HyNic chemistry does not diminish QD optical properties.38 On the basis of these findings and prior literature, we do not expect the optical properties of QDs to be significantly different before and after EV labeling.
Visualization, Confirmation, and Stability of QD-sEV Conjugates.
We directly visualized QD-EV conjugates through TEM and fluorescent imaging to confirm successful labeling. TEM images show colocalization of QD and sEVs, with QDs on the surface of sEVs (white arrow, Figure 3A). QDs presented as black dots with great contrast (Figure 3A left panel), while sEVs presented as cap or circular shape membrane structures (Figure 3A middle panel), as described in the literature.1 QD-sEV conjugates presented as low-contrast EVs with size 100–200 nm containing black dots of QDs (Figure 3A right panel). At a higher resolution, QDs were shown to be distributed around the surface of an individual EV (Figure 3A right panel insert). sEVs displayed similar morphology before and after QD tagging. Colocalization of QD-sEVs was also confirmed with fluorescence microscopy by visualizing overlapping signals of SYTO RNASelect stained sEVs (green) and the QDs (red) (Figure S1). Additionally, we visually confirmed QD-sEVs can be imaged in a biologically relevant system. QD-sEV treated human vaginal epithelial sheets presented distinctive fluorescent dots (Figure S2A). Tissue treated with purified QDs (pQDs), taken from f7-f9 from SEC on QD-4FB samples, did not show signal (Figure S2B). Note the vaginal tissue has autofluorescence which can be detected as diffuse signal under the same laser setting as QDs. However, compared with tissue autofluorescence, QD-sEVs were punctate and brighter in fluorescence intensity.
Figure 3.

TEM imaging of QDs, sEVs, and QD-sEVs. (A) QDs, sEVs, and QD-sEVs conjugates were imaged using TEM. QDs alone (left panel), sEVs alone (middle panel), and QD-sEV conjugates (right panel) were presented. QDs on the surface of sEVs are pointed out by white arrows. A magnified TEM image further indicates colocalization of QDs and sEVs at the single EV level (right insert). Scale bar: 100 nm in left panel, 200 nm in middle and right pane, and 100 nm in right insert. (B) QDs were conjugated to sEVs using click chemistry in varying ratios of QD to sEV and imaged using TEM. QD:sEV ratios of 40:1 (left), 70:1 (middle), 100:1 (right) were evaluated. Altering QD:sEV ratio changes the uniformity of QD distribution on the sEV surface. White arrows point to QDs on the surface of sEVs. Scale bars: 100 nm in left panel, 200 nm in middle and right panel.
The QD-EV conjugates must remain stable in physiological media over a time relevant to imaging applications. In addition, the QD-EV conjugates need to be stable during storage. Our previous publication indicates PEGylated QDs should remain stable without significant aggregation at physiological temperature for at least 24 h.18 Previous literature shows EVs are physically stable when stored at 4 °C for months.46,47 We confirmed sEVs remain stable at 4 °C after a 25-day storage period (Figure S3). In addition to the stability of QDs and EVs, the bonds that connect QDs and EVs should remain intact during application or storage. We tested the 4FB-HyNic bond stability by measuring the change of bond quantity, which was indicated by the ratio of the bond detected at different time points to the bond detected at 0 h. We tested the bond stability in three different media, including 1×PBS, 1×PBS+10%FBS as a serum-rich environment, and in artificial cerebrospinal fluid (aCSF) for a more complex multi-ion condition. Stability was tested at 4, 23, and 37 °C temperature for all media (Figure S4). The 4FB-HyNic bond was relatively stable in all conditions over 1 week of incubation or storage (Figure S4A–C). In several testing conditions, we found an increase in bond quantity over the initial 24 h, which could be due to the continuous 4FB and HyNic reaction (Figure S4D–E). In 1×PBS+10%FBS conditions, the % bond began to drop at 2 d (Figure S4B), while in 1×PBS conditions, especially at 4 °C, the % bond remained approximately the same, with a slight increase from 1 d to 1 week (Figure S4A). The decrease in the % bond after 1 d at 37 °C is likely due to hydrolysis of hydrophilic Sulfo-NHS ester, which results in an unstable sulfo-NHS reactive group. When the sulfo group is hydrolyzed, the bis-aryl hydrazone becomes more hydrophobic, decreasing hydrazone stability in solution. However, when there is an amine present during QD-EV conjugation, a stable amide linker will be formed,48 minimizing the effect of hydrolysis. Although this stability study was only done on the bonds without QDs or EVs present, the results indicate that QDs and EVs should remain conjugated with a stable 4FB-HyNic bond in storage conditions such as 1×PBS at 4 °C for at least 1 week. Moreover, QDs and EVs should remain stably labeled during imaging on cells or ex vivo tissue, or even in vivo, in a physiologically preferred environment in a 24-h window.
Optimizing QD-EV Conjugation by Altering QD Distribution on EVs and Increasing Reaction Efficiency.
For optimal performance of QD-EV conjugates in biological applications, we proposed that the QD distribution on EVs needs to be uniform and nonaggregated. We hypothesized the QD to EV ratio may influence the final QD-EV conjugate distribution. To look at this, we engineered the stoichiometric ratio of input QD-PEG-NH2 and sEVs as 40:1, 70:1, 100:1. To make the ratio of QDs to sEVs the only variable throughout the experiment, we kept the number of Sulfo-S-4FB per QD (3.58 × 10⁵) and Sulfo-S-HyNic per EV (1.28 × 10⁶) constant across all three experimental groups during reaction. TEM images were taken to identify the QD distribution on sEVs (Figure 3B). No QD-sEV conjugates were visualized in the 40:1 sample (Figure 3B left panel), while a rather uniform distribution of QDs to sEVs was achieved in the 70:1 sample, as indicated by the white arrows showing fully intact sEVs with QDs present (Figure 3B middle panel). At higher QD:sEV ratios (100:1), aggregation of QDs on the sEV surface occurred, as indicated by the white arrow (Figure 3B right panel). These findings indicate that altering QD to EV ratio can change the QD distribution on sEVs. For further experiments in this study, we used the 70:1 ratio during QD-EV conjugation because of the uniform distribution of QDs on the EV surface achieved at that ratio.
We next explored the use of catalysts to increase the conjugation efficiency. We used two catalysts in the reaction: 3,5-diaminobenzoic acid (3,5-DABA) and 2-amino-5-methyl-benzoic acid (5-MA), both of which accelerate the hydrazone formation process.49 We tested catalyst impact on the 4FB-HyNic bond formation efficiency by monitoring the absorbance at 354 nm for 2 h as an indicator of quantity of bonds. A high concentration (10 mM) of both catalysts accelerated the reaction immediately and increased the final bond yield 2-fold, while a low concentration (1 mM) of both catalysts gradually increased bond formation during 2 h of testing, with a doubled bond yield at the end of the incubation window (Figure S5A). We found 10 mM 5-MA resulted in precipitation during 3 h incubation with the 4FB and HyNic mixture; thus, we chose to pursue the catalyst study with 1 mM of both catalysts. We then evaluated the impact of pH on 4FB-HyNic bond formation at a pH range of 6–7 (Figure S5B,C). A wider range of pH was not tested because of the potential impact on EV integrity.50 No significant difference in bond formation efficiency was observed at different pH values. Therefore, we chose the combination of pH 7.4 and 1 mM 5-MA as the catalyst condition. We estimated an average 6.5 QDs on each sEV with a catalyzed reaction, which is a 3-fold increase QD to EV ratio compared with QD-sEV conjugates without catalyst (an average of 2 QDs on each sEV). However, because an additional purification step was needed for catalyzed QD-EVs to separate out excess catalyst, final sEV retention—the amount of sEVs in the final conjugate compared with the initial input of sEVs—in catalyzed QD-EV conjugates was only 2.7%, which is 2-fold lower compared to a recovery of 4.4% in uncatalyzed QD-EV conjugates. Considering that it is necessary to reduce conjugate loss following the conjugation process, we proceeded to conjugate QDs and EVs without catalyst for further study. Nevertheless, for QD-EV applications that require higher conjugation efficiency, utilizing catalysts such as 1 mM 5-MA to boost hydrazone formation is an option.
Investigating bEVs Interaction with BV-2 Cells through QD-bEV Conjugates.
After confirming QD-EV conjugates are tailorable and stable, we expanded the investigation to imaging capability. We demonstrated the ability to tag QDs on EVs using human sEVs as model EVs. We next sought to confirm that our conjugation scheme could be applied to other EV populations. Here, we isolated bEVs from excised whole rat brain using a modified protocol,51 detailed in our methods. Isolating EVs from the whole animal brain is different from commonly studied cell- or fluid-derived EVs but enables us to study tissue-based EVs representative of heterogeneous EV populations. Sucrose density gradient purification of EVs often suffers from protein contamination52 that could lead to false-positive signals, so we opted to use SEC for final purification of bEVs.13 Thus, we opted to use SEC for final purification of bEVs. f7-f10 contained the majority of bEVs (Figure 4A) and also had the highest particle to protein ratio (Figure 4B). We confirmed successful modification on bEV-HyNic by UV-vis; similar to sEV-HyNic (Figure 2B), an increase of absorbance of bEV-HyNic + 4FB was observed (Figure 4C). The average size of bEV-HyNic measured by NanoSight was 195.8 nm and the average size of QD-bEVs was 277.9 nm (Figure 4D). The broad size distribution of bEV-HyNic and QD-bEVs could be due to the heterogeneities of tissue-based EVs (Figure 4D). The zeta potential of bEV-HyNic was −16.4 mV and the zeta potential of QD-bEV was −10.6 mV (Figure 4E).
Figure 4.
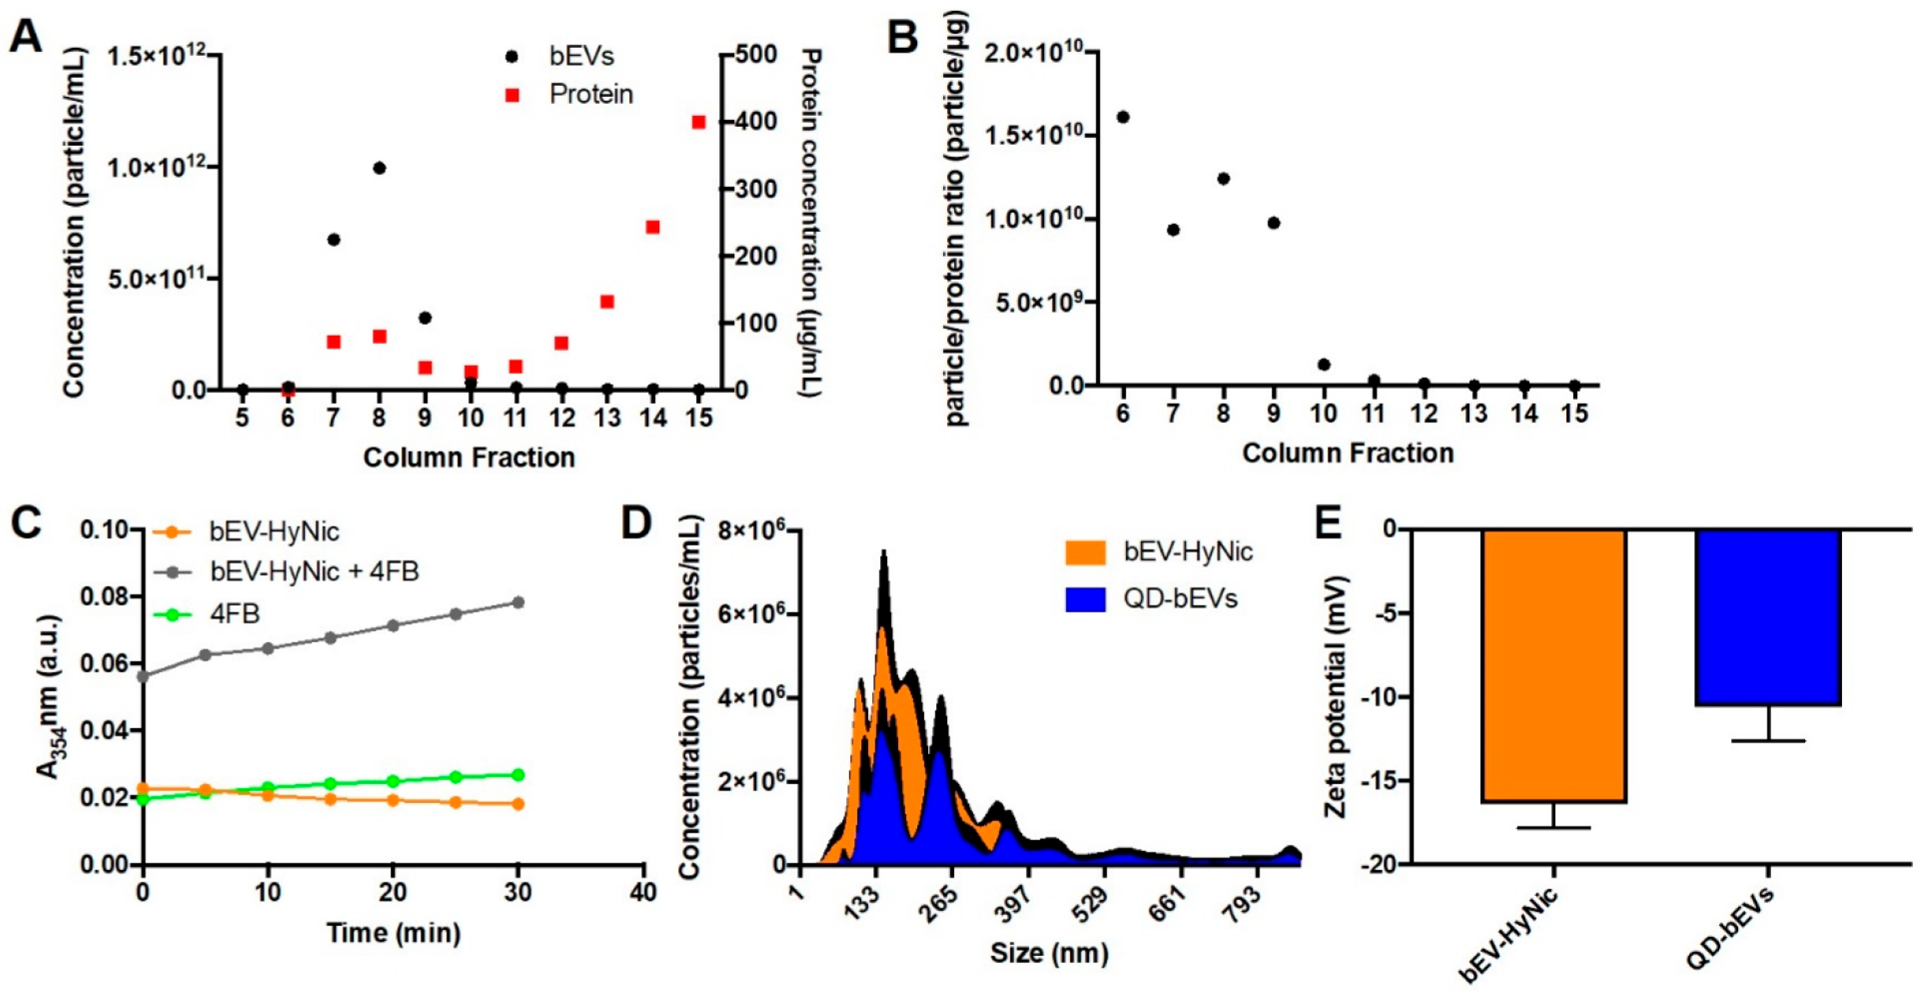
Characterization of QD-bEV conjugates. (A) Representative data of bEV particle quantity (black) and protein concentration (red) in f5-f15 of qEV column purification. f7-f10 contained both bEVs and proteins, while f12-f15 only contain proteins. (B) Representative data of particle/protein ratio of bEVs in f6-f15. f7-f10 contain the majority of pure bEVs and were collected for further conjugation experiments. (C) Absorbance intensity at 354 nm of Sulfo-S-4FB, bEV-HyNic, and Sulfo-S-4FB + bEV-HyNic during the first 30 min after chemical mixing (n = 3). bEV-HyNic modification was confirmed by increased absorbance at 354 nm. (D) Size distribution of bEV-HyNic and QD-bEV (n = 3) - black lines represent SEM for each size reported. (E) Zeta potential of bEV-HyNic and QD-bEV conjugates in 1×PBS (n = 3).
The greatest advantage of using QDs for bioimaging over traditional organic dye is the strong resistance to photobleaching.15 We compared the photostability of QD-bEVs and bEVs labeled with the commonly used lipophilic membrane dye DiI (DiI-bEVs). Both labeled bEVs were incubated with BV-2 cells for 24 h, followed by 10 min imaging under continuous laser exposure. The fluorescence intensity of QD-bEVs remained the same, while the intensity of DiI-bEVs dropped ~50% during the imaging window (Figure 5A,B). This shows that QD-EV conjugates could favor in vitro or in vivo studies that necessitate long-term or repetitive imaging.
Figure 5.
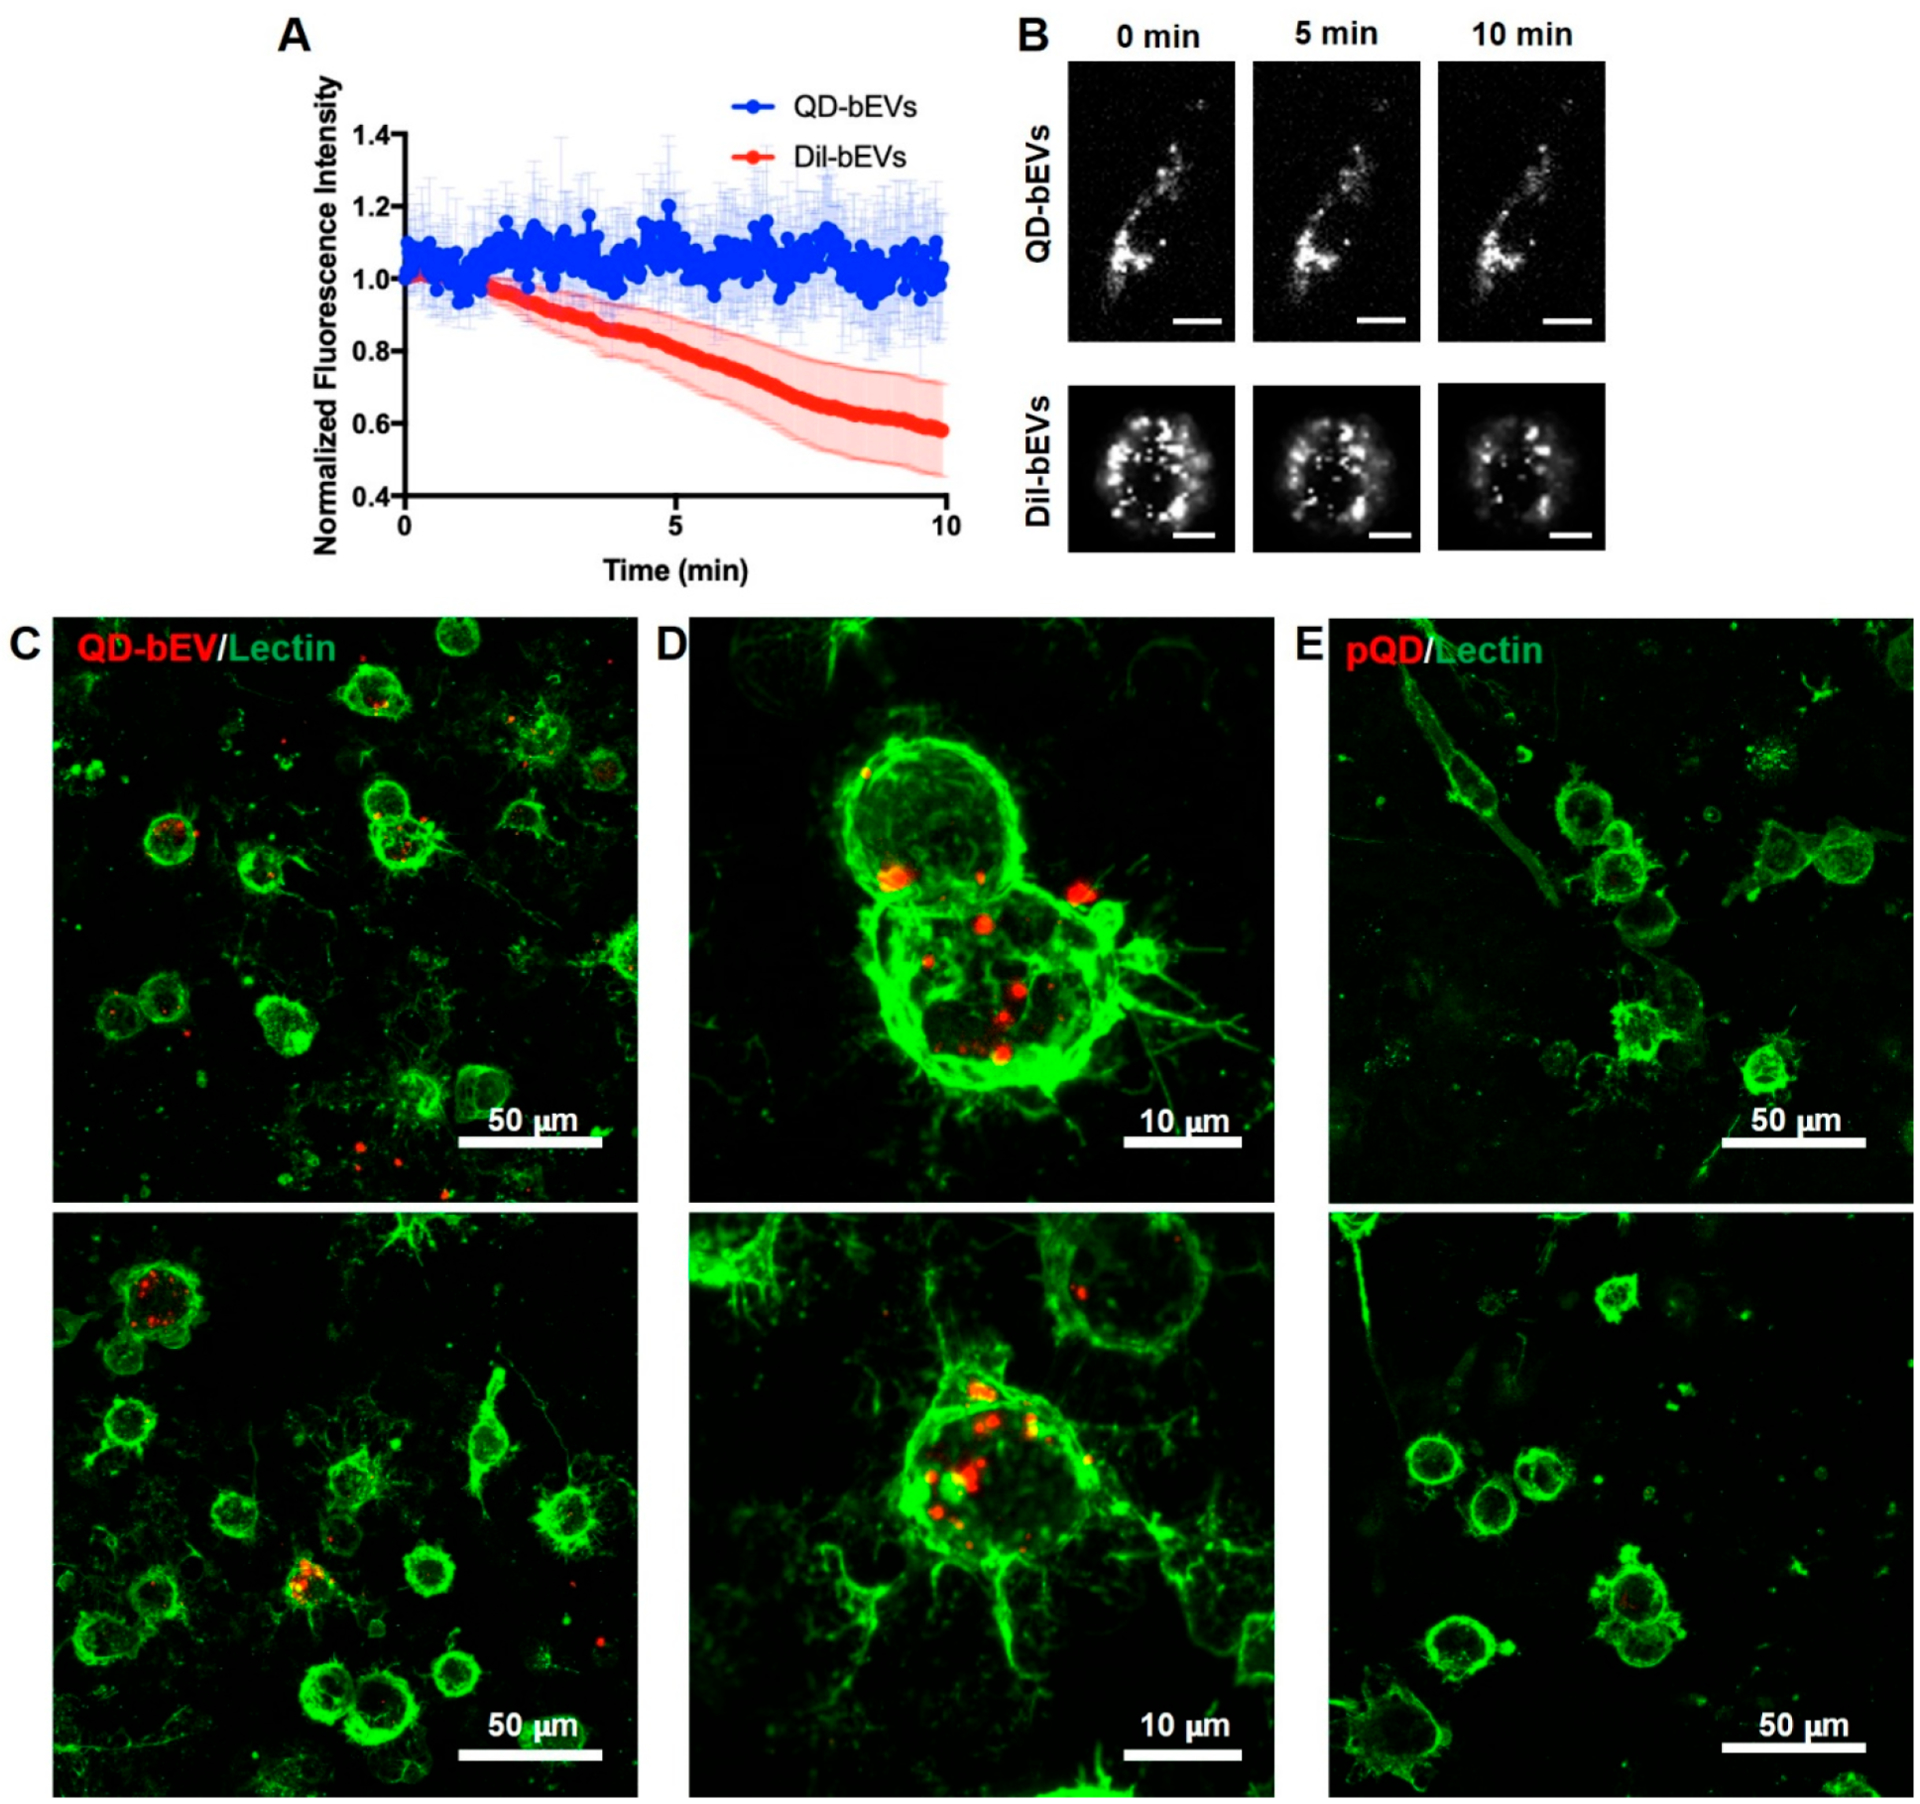
Photostability and imaging of QD-bEVs on BV-2 cells. (A) The fluorescence intensity of QD-bEVs (n = 6) and DiI-bEVs (n = 3) during 10 min laser exposure under the same laser power. (B) Representative images of QD-bEVs on single BV-2 cell (top) and DiI-bEVs on single BV-2 cell (bottom) at 0, 5, and 10 min of laser exposure. Images were converted to grayscale for better visualization. Scale bars: 10 μm. (C) Representative 60× maximum intensity projection images of QD-bEVs (red) distribution and cellular interaction on Lectin stained BV-2 cells (green). Scale bars: 50 μm. (D) Higher magnification of an area in (C). QD-bEVs localized on the BV-2 cell membrane and throughout the individual cell. Scale bars: 10 μm. (E) Representative 60× maximum intensity projection images of pQDs (red) negative control distribution and cellular interaction on Lectin stained BV-2 cells (green). No obvious QD signals were found on BV-2 cells using the same laser power and imaging settings as (C-D), indicating unconjugated QDs can be successfully removed through SEC purification. Scale bars: 50 μm.
As an example, QD labeling of bEVs can contribute to studying single bEV-single cell interaction with cells in the central nervous system (CNS). Brain-derived EVs play an important role in modulating neuroinflammation and the progression of neurological diseases,6,7,53–55 motivating the study of brain EVs for potential treatment or early diagnosis of brain disorders. Within the CNS, microglia are the brains’ innate immune cells and are known regulators of neuroinflammation,56 which are of particular interest for studying CNS diseases and neurotherapeutic targets. These cells also serve as an important source for and recipient of EVs in the brain.57 We chose microglial BV-2 cells, a commonly used murine microglia cell line, to study the interaction with QD-bEVs. When applied to BV-2 cells, QD-bEVs were observed as individual bright dots well-distributed on the surface of BV-2 cells after 24 h of incubation (Figure 5C,D). To determine if unconjugated QDs were able to elute in EV fractions during SEC, we also treated BV-2 cells for 24 h with pQDs that are the same fractions collected from the QD alone samples as if they were QD-EV conjugates. As expected, pQD treated BV-2 cells did not present any distinctive QD signals under the same imaging settings compared to QD-bEV treated BV-2 cells (Figure 5E). This indicated that SEC successfully separates QD-bEVs and unconjugated QDs, resulting in SEC purified QD-bEVs that can be used for imaging without unconjugated QDs generating false-positive signals. In addition, we were able to visualize bEVs colocalizing with the BV-2 cell membrane at a single cell resolution (Figure 5D).
Another beneficial application of the QD-EV conjugate is for live sample imaging, which can monitor the interaction of QD-EVs with cells under a microscope over hours. To gain a preliminary insight into the ability to time-lapse image QD-EV conjugates, we acquired time-lapse videos of QD-bEVs interaction with microglial cells at multiple time points of incubation. QD-bEVs were observed to move toward BV-2 cells and interact with the cell surface within 1 h of incubation, while a subfraction of bEVs were found already associated with BV-2 cells (Movie 1, Figure S6A). After 4 h of incubation, QD-bEVs continued to associate with BV-2 cells (Movie 2, Figure S6B). Moreover, BV-2 cells that have QD-bEVs associated on their surface continued to migrate, indicating QD-bEVs did not interfere with the mobility of BV2 cells (Movie 3, Figure S6C). Quantitative analysis of these videos indicated bEVs exhibited a significantly higher cumulative interaction with BV-2 cells at 4 h compared with 1 h of contact (Figure S7). More studies need to be done to further investigate the mechanism of this time-dependent EV-cell interaction, including considering cell proliferation, synthesis, and release of new QD-EVs after QD-EVs integration on cell membrane, and potential QD degradation in lysosomes. Future use of QD-EV conjugates can also include single or multiple particle tracking of QD-labeled EVs at high frame rates, which can capture the kinetic profile of EV mobility as well as more detailed interaction with cells. The high photostability of QD-EVs compared to traditionally labeled EVs thus could be a benefit for this application.
CONCLUSIONS
Using 4FB-HyNic click chemistry, we developed a robust, universal, controllable, and biologically stable QD-EV conjugate. This QD-EV conjugate showed greater resistance to photobleaching compared with EVs labeled with DiI, a commonly used EV staining dye. The successful conjugation of QDs and EVs was confirmed through TEM, UV-vis spectroscopy, DLS, and confocal microscopy. The QD-EV conjugation can be optimized through altering the initial QD to EV ratio as well as utilizing catalysts for accelerating the hydrazone formation process. The QD-EV conjugation bonds were stable in various biological media and storage conditions for at least a week, providing flexibility for applications. In addition, we showed that SEC was able to separate EVs from free proteins, as well as QD-EV conjugates from unconjugated QDs. More importantly, the QD-EV conjugates demonstrated high-resolution live-imaging ability on EVs in vitro and fixed-imaging ability ex vivo. We were able to live image the association of bEVs with BV-2 microglial cell membrane and image the colocalization of sEVs with human vaginal cells in fixed tissue sections. This method of labeling EVs provides a new way of visualizing and studying EV behavior, which can be an important tool for the fundamental understanding of EVs and their potential clinical application.
METHODS
Isolation of EVs from Human Semen and Rat Brain.
Semen EVs (sEVs).
sEVs were isolated on the basis of a published paper.43 Semen samples were obtained from this clinic or from the University of Washington Male Fertility Program. Written informed consent was obtained from each donor. All protocols were approved by the Institutional Review Boards of the University of Washington and the Fred Hutchinson Cancer Research Center (IR file numbers 5690 and 4323). Seminal plasma was separated from collected semen samples by a series of centrifugation followed by filtration through a 0.22 μm syringe filter. sEVs were purified by ultracentrifugation over sucrose cushions. The 30% and 25% sucrose cushions containing the EV fraction were pooled and washed by centrifugation through an Amicon Ultracel 100 kDa cellulose centrifugal filter and concentrated to a final 425 μL-3.2 mL. To deplete proteins in sEVs for later QD-sEV conjugation, qEV column (iZon) was used to further purify sEVs.
Brain EVs (bEVs).
This study was performed in strict accordance with the recommendations in the Guide for the Care and Use of Laboratory Animals of the National Institutes of Health. All of the animals were handled according to approved institutional animal care and use committee (IACUC) protocols (#4383–02) of the University of Washington. The University of Washington has an approved Animal Welfare Assurance (#A3464–01) on file with the NIH Office of Laboratory Animal Welfare (OLAW), is registered with the United States Department of Agriculture (USDA, certificate #91-R-0001), and is accredited by AAALAC International. Every effort was made to minimize suffering. Time-mated pregnant female Sprague-Dawley rats (virus antibody free CD (SD) IGS, Charles River Laboratories) were purchased and arrived on estrous day 17 (E17). All animals used in these studies were housed individually and allowed to acclimate to their environment for a minimum of 5 days prior to delivering (E22). Day of birth was defined as postnatal day 0 (P0). P14-P16 healthy SD rats were decapitated after euthanasia by a pentobarbital overdose >100 mg kg−1. Brains were frozen at −80 °C until bEV extraction.
bEVs were isolated from the whole rat brain tissue based on adaptations from a published protocol.51 Frozen rat brain was sliced on ice to generate 2–3 mm wide sections of brain. The cut tissue was transferred while partially frozen to a 50 mL tube containing 75 U/mL of collagenase type 3 (Worthington Biomedical) in Hibernate-E at a ratio of 800 μL per 100 mg of brain. The tissue was incubated in a water bath at 37 °C for a total of 20 min, with a mix of gentle inversion and gentle pipetting during the incubation. The tissue was returned to ice immediately after incubation and PBS protease inhibitor containing EDTA (PI, Sigma) and PhosSTOP (PS, Sigma) were added to tissue homogenate to a final concentration of 1×. The dissociated tissue was spun at 300g for 5 min at 4 °C, following transfer of the supernatant to a fresh tube and spun at 2000g for 10 min at 4 °C. Then the supernatant was spun at 10 000g for 30 min at 4 °C. The collected supernatant was further purified through a qEV size-exclusion chromatography (SEC) column (iZon) following vendor specifications. Fractions (f) 5–15 were collected for characterization.
Quantification, Size Distribution, and Purity Characterization of EVs.
Nanoparticle Tracking Analysis (NTA).
Isolated EVs quantification and size were determined by NanoSight NS300 (Malvern Panalytical). EVs were gently vortexed and serially diluted to a concentration that allow 20–50 particles/frame in NanoSight. Each sample analysis was conducted for 60 s using NanoSight automatic analysis settings and were evaluated in triplicate.
EV Purity Analysis.
The purity of isolated EVs was determined based on accepted EV concentration/protein concentration ratio.44 The EV concentration was determined by NTA as described above, and the protein concentration in the EV samples was measured by the bicinchoninic acid assay (BCA assay) (ThermoFisher). A simple calculation was conducted to a final unit of particle/μg, and the calculated ratio was compared with the standard set by the literature.44
Conjugation of QDs to sEVs or bEVs.
QDs functionalized with PEG-NH2 (QD-PEG-NH2) (ThermoFisher) were conjugated to EVs via a modified version of a previously published protocol,38 as outlined in Figure 1. Briefly, 8 μM QD-PEG-NH2 was quickly mixed with 1.25 mg of Sulfo-S-4FB (TriLink BioTechnologies) in 1×PBS to make a 500 μL mixture and incubated for 2 h at room temperature to modify 4FB ligand on QDs (QD-4FB). A total of 6 × 10¹² EVs were quickly mixed with 0.5 mg of Sulfo-S-HyNic (TriLink BioTechnologies) in 1×PBS to make a 700 μL mixture and incubated for 2 h at room temperature to modify HyNic ligand on EVs (sEV-HyNic). After incubation, QD-4FB was purified by NAP-5 column (GE Healthcare) following the manufacturer’s instruction to remove excess unreacted Sulfo-S-4FB. EV-HyNic was purified by Amicon 100 kDa centrifugal filter unit (Millipore) at 3000g for 30 min (sEV) or Amicon 50 kDa centrifugal filter unit (Millipore) at 3000g for 15 min (bEV) to remove excess Sulfo-S-HyNic (Millipore Sigma). Purified QD-4FB and EV-HyNic was mixed and reacted for 2 h at room temperature. After incubation, QD-EVs were separated from unconjugated QD-4FB by qEV SEC column (iZon). To identify QD-EV conjugate containing fractions, both QD-EVs and QD-4FB were excluded through qEV columns and f1-f30 were collected, and then the fluorescence signal was measured at 585 with excitation at 405 nm. When a higher concentration of final QD-EVs were needed, Amicon 50 kDa centrifugal filter units (Millipore) were used to concentrate the collected fractions at 3000g for 30 min.
Characterization of QD-EV Conjugates.
Characterization of QD-4FB by Dynamic Light Scattering (DLS).
Modification of 4FB on the QDs was confirmed by a zeta potential shift, based on a previous literature.38 Hydrodynamic particle size and zeta potential of both QD-PEG-NH2 before modification and QD-4FB after modification and purification were determined by DLS.
Characterization of EV-HyNic by Ultraviolet-Visible Spectroscopy (UV-vis).
Modification of HyNic on the EVs from both sEVs and bEVs was confirmed by the presence of an absorbance bond of 4FB-HyNic measured by UV-vis based on a previous paper.38 Briefly, 125 μL of EV-HyNic was mixed with 1×PBS to make a final 300 μL suspension, and 0.3 mg of Sulfo-S-4FB was mixed with 1×PBS to make a final 300 μL of 4FB suspension. Half of the EV solution and half of the 4FB solution were mixed well, and another 150 μL of 1×PBS was added into EV-HyNic and 4FB solution, respectively, to make a final 300 μL. The 3 samples and 1×PBS were added to 96-well plate in triplicate with 95 μL in each well, and the absorbance of the 4FB-HyNic bond was measured every 5 min at 354 nm by the SpectraMax M5Microplate Reader (Molecular Devices), up to 30 min.
Characterization of QD-EV by Transmission Electron Microscope (TEM).
Preparation for TEM analysis was done with small modification of a described method.58 In brief, EV samples were mixed with an equal volume of 4% PFA and deposited by airfuge onto Formvar/Carbon coated EM grids (Ted Pella). Samples were contrasted and embedded by treatment with uranyl-oxalate solution (Electron Microscopy Services) for 5 min, followed by methyl-cellulose-uranyl-acetate (Sigma) on ice for 10 min.
Characterization of the Hydrodynamic Size and Zeta Potential.
The size and size distribution of EV-HyNic and QD-EVs were characterized by NanoSight, as described above. The zeta potential of EV-HyNic and QD-EVs were characterized by DLS in 1×PBS.
Characterization of QD-EV Fluorescence Spectra.
The fluorescence intensity of 200 μL of 0.8 nM QD-PEG-NH2 and 200 μL of QD-sEV conjugates were measured every 5 nm from 400 to 700 nm using a Cytation 3 Imaging Reader (BioTek). The intensities were normalized to the highest value.
Calculation of QD-EV Labeling Efficiency.
The QD-EV labeling efficiency was characterized by the percentage of QDs remaining in QD-EV conjugates and the percentage of EVs remaining in QD-EV conjugates. A QD-PEG-NH2 calibration curve was made by measuring the fluorescence at 585 nm for various QD concentration. By measuring the final QD-EV conjugates fluorescence at 585 nm, the concentration of QDs retained in the conjugates were determined, and the percentage was calculated through % QDs . The amount of the EVs retained in QD-EV conjugates were quantified by NTA and the percent of EVs retained was calculated through%EVs . The final average QD:EV ratio in QD-EV conjugates was estimated through .
Optimization of QD-EV Conjugation.
Optimization of QD Distribution on EVs by Altering Initial QD:EV Ratio.
QD-sEV conjugates were made in varying ratios of QD to sEVs: 40:1, 70:1, and 100:1. Five microliters of 8 μM QD-PEG-NH2 was reacted with 0.5 mg Sulfo-S-4FB (QD-4FB1), and 12.5 μL of 8 μM QD-PEG-NH2 was reacted with 1.25 mg Sulfo-S-4FB (QD-4FB2) for 2 h. A total of 6 × 10¹² sEVs were mixed with 0.5 mg fo Sulfo-S-HyNic as described above. After NAP-5 column purification of QD-4FB, 500 μL of QD-4FB1 was mixed with 500 μL of sEV-HyNic (40:1), 350 μL of QD-4FB2 was mixed with 500 μL of sEV-HyNic and 150 μL of 1×PBS (70:1), and 500 μL of QD-4FB2 was mixed with 500 μL of sEV-HyNic (100:1). After reaction, QD-sEV conjugates were imaged by TEM as above to determine the distribution of QDs on sEVs.
Optimization of 4FB-HyNic Reaction Efficiency by Catalysts.
3,5-Diaminobenzoic acid (3,5-DABA) and 2-amino-5-methylbenzoic acid (5-MA) were tested as catalyst for hydrazone formation.49 3,5-DABA and 5-MA were dissolved in DMSO to 500 mM and 50 mM. Next, 1.25 mg of Sulfo-S-4FB (final concentration 3.58 mM) and 0.5 mg of Sulfo-S-HyNic (final concentration 1.27 mM) were mixed in 1 mL of 1×PBS and immediately distributed to 50 uL/well in a 96-well plate for baseline absorbance at 354 nm by a UV-vis spectrophotometer. 3,5-DABA and 5-MA were quickly mixed in the sample to make a final 10, 5, or 1 mM catalyst concentration. The absorbance at 354 nm was monitored every 10 min for 3 h. In addition, effect of pH was tested by changing the 1×PBS pH to 7.4, 6.89, and 6.09 by adding 2 mM HCl prior to addition of Sulfo-S-4FB or Sulfo-S-HyNic. The pH was measured by a pH meter (Fisher). When making QD-sEV conjugates using catalysts, 5-MA was quickly added into the mixture of QD-4FB and sEV-HyNic to make a final 1 mM concentration at the start of 2 h QD-EV reaction. After incubation, Amicon 100 kDa centrifugal unit was used to filter out excess catalysts.
SYTO RNASelect Staining and Fluorescence Imaging of QD-sEV Conjugates.
QD-sEV conjugates were mixed with 1 mM RNASelect Green Fluorescent Cell Stain (ThermoFisher) at a ratio of 1 μL RNASelect stock per 100 μL of sample. The stained sample was incubated for 20 min at 37 °C. The sample was then washed by centrifugation using an Amicon 100 kDa centrifugal filter unit at 3000g for 20 min and eluted by centrifuging at 1000g for 2 min. One drop of stained sample was dropped on imaging slide and dried for 1h. Dako mounting media was used to mount the slide. A coverslip was then added to the slide. Imaging was performed using a Nikon A1 confocal microscope (Nikon Inc.) at 10× magnification.
Characterization of QD-EV Bond Stability under Biological and Storage Condition.
Initially, 1.25 mg of Sulfo-S-4FB (final concentration 3.58 mM) and 0.5 mg of Sulfo-S-HyNic (final concentration 1.27 mM) were mixed in 1 mL of 1×PBS and reacted at room temperature for 2 h. After 2 h, the 4FB-HyNix mixture was diluted to 1×PBS, aCSF (119 mM NaCl, 26.2 mM NaHCO3, 2.5 mM KCl, 1 mM NaH2PO4, 1.3 mM MgCl2, 10 mM glucose, 2.5 mM CaCl2, adjusted to pH 7.4), and 1×PBS+10%FBS, respectively, at 1:10 ratio. The samples were stored at 4 °C, 23 °C, or 37 °C up to 1 week. At 0 h, 4 h, 24 h, 48 h, and 1 week, the absorbance of 50 μL of each sample at 354 nm was measured by the SpectraMax M5Microplate Reader (Molecular Devices). The experiment was run in triplicate.
QD-sEV Treatment of Ex Vivo Human Vaginal Epithelial Sheets.
Tissues routinely discarded from vaginal repair surgeries were harvested from otherwise healthy adult women; placed in ice-cooled calcium- and magnesium-free phosphate-buffered saline containing 100 U/mL penicillin, 100 μg/mL streptomycin, and 2.5 μg/mL Fungizone (Life Technologies); and transported to the laboratory within 1 h of removal from the donor. Tissue harvesting and experimental procedures were approved by the Institutional Review Board of the Fred Hutchinson Cancer Research Center (IR file 4323). The deep submucosa was removed with surgical scissors and the remaining vaginal mucosa was cut into 5 × 5 mm pieces, which were incubated at 4 °C for 18 h in 5 mL of a 12.5 U/mL Dispase solution (354235; BD Biosciences). The epithelial sheets were dissected away from the underlying stroma with a dissecting microscope and placed in tissue culture dishes. Solutions of QD-sEVs or pQDs (f7-f9 collected from qEV column purified QD-4FB) were added to each well and incubated overnight. The next day, tissues were extensively rinsed with PBS and fixed overnight with 4% PFA in PBS with 1 mM EDTA. After they were rinsed, nuclei were counterstained with TOPRO-3 Iodine (ThermoFisher) and mounted on slides with Dako mounting media. Epithelial sheets were imaged on an EVOS FL Auto Imaging System (ThermoFisher).
Confocal Imaging and Time-Lapse Tracking of QD-bEVs on BV-2 Cells.
BV-2 Cell Culture.
The murine microglia cell line BV-2 was purchased from ATCC (CRL-2469) and cultured based on previous literature.18 Briefly, BV-2 cells were cultured in cell culture media (high-glucose DMEM supplemented with 10% FBS, 1% glutamine, and 1% 100U/mL penicillin-streptomycin) at 37 °C in a 5% CO2 atmosphere. After reaching 70–80% confluency, BV-2 cells were passaged and 200 000 BV-2 cells were seeded in 35 mm poly-d-lysine coverslip bottom imaging dishes (Corning) with 2 mL cell culture media.
Confocal Imaging of QD-bEVs Interaction with BV-2 Cells.
The BV-2 cells were ready for confocal imaging study after 1–2-day culturing on 35 mm imaging dish. First, 50 μL of QD-bEVs was mixed with 1950 μL of cell culture media and added to 1 dish of BV-2 cells. Then 50 μL of pQDs (f7-f9 collected from qEV column purified QD-4FB) was mixed with 1950 μL of cell culture media and added to 1 dish of BV-2 cells, as the negative control. BV-2 cells were incubated at 37 °C in a 5% CO2 atmosphere for 24 h, fixed with 10% buffered formalin (ThermoFisher) for 10 min, and then washed twice with 1×PBS. The cells were then stained with DyLight 488 Labeled Lycopersicon esculentum (Tomato) Lectin (Vector Laboratories) at 1:1000 ratio in 1×PBS for 1 h. Cells were then imaged by a Nikon A1 confocal microscope (Nikon) under same camera and laser setting. Z-stack images at 60× or 4-time zoom in at 60× were taken, and maximum-intensity projections were formed.
Time-Lapse Tracking of QD-bEVs Interaction with BV-2 Cells.
After 1–2 days of BV-2 cell culturing on 35 mm imaging dish, the cells were stained with DyLight 488 Labeled Lycopersicon esculentum (Tomato) Lectin (Vector Laboratories) at 1:1000 ratio in prewarmed cell culture media at 37 °C in a 5% CO2 atmosphere for 1 h. The cells were then washed twice with cell culture media. Then 35 μL of QD-bEVs was mixed with 950 μL of cell culture media and added to 1 dish of BV-2 cells. After 1 and 4 h incubation at 37 °C in a 5% CO2 atmosphere, the 35 mm dish of BV-2 cells was quickly moved to an incubation chamber (37 °C, 5% CO2, and over 40% humidity) to perform time-lapse imaging. Images were taken at 60× every 5 min for 1 h at various locations in the chamber.
Quantitative Analysis of Time-Lapse Videos.
The time-lapse videos were first image processed using Fiji software. Briefly, images were split into two channels. The MinError threshold was applied to cell channels and QD channels were adjusted for brightness first, then filtered for noise by Gaussian Blur with a radius of 1 pixel. The Otsu threshold was applied to QD channels for converting to binary images. Two processed channels were merged. For each individual cell that existed in more than 80% of the frames of the video, the interaction of QD-bEVs with the cell were counted in each frame and summed together as the cumulative count of bEV-cell interaction for each cell.
Photostability Comparison of QD-bEVs and DiI-bEVs.
Two μL of 2.5 mg/mL DiI (ThermoFisher) was mixed with bEVs and incubated at room temperature for 20 min, followed by SEC through qEV column. Then, 50 μL of QD-bEVs or DiI-bEVs was mixed with 1950 μL of cell culture media and added to BV-2 cells cultured on 35 mm imaging dishes, respectively. Treated BV-2 cells were incubated at 37 °C in a 5% CO2 atmosphere for 24 h, fixed with 10% buffered formalin (ThermoFisher) for 10 min, and then washed twice with 1×PBS. The cells were then imaged using Nikon A1R confocal microscope (Nikon). Time-lapse imaging with No Delay (continuous laser exposure) was performed on cells for 10 min with perfect focus turned on to keep the z-plane consistent during the imaging. Time measurement was performed real-time on each region of interest to measure the fluorescence intensity change over time. Laser 405 was used for QD-bEVs and laser 561 was used for DiI-bEVs, with the laser power held the same for both samples. The intensity was normalized by the intensity at 0 min.
Statistical Analysis.
Data were displayed using the mean value ± the standard error of the mean (SEM) for the DLS, NanoSight, and absorbance studies and using the median value with interquartile range for the bEV-cell interaction study. Statistical analysis of DLS data was performed using the sample unpaired t test. Statistical analysis of cumulative counts of bEV-cell interaction was performed using the Mann-Whitney U-test. Statistical significance was determined under type 1 error at p < 0.05. Any difference with p < 0.05 (*), p < 0.01 (**) and p < 0.0001 (****) was marked on the graphs. All statistical analyses were conducted with GraphPad Prism 7.01 (GraphPad Software Inc.).
Supplementary Material
Movie 1: Time-lapse imaging of QD-bEVs (red) interaction with Lectin stained BV-2 cells (green) after 1-h incubation; the images were taken every 5 min for 1 h (MOV)
Movie 2: Time-lapse imaging of QD-bEVs (red) moving and interacting with Lectin stained BV-2 cells (green) after 4-h incubation; the images were taken every 5 min for 1 h (MOV)
Movie 3: Time-lapse imaging of QD-bEVs (red) interaction with Lectin stained BV-2 cells (green) after 4-h incubation; the images were taken every 5 min for 1 h (MOV)
ACKNOWLEDGMENTS
E.N. and M.Z. received funding from the National Institutes of Health award R35GM124677 for experimental supplies, samples, and salary support. L.V. and F.H. received funding from the National Institutes of Health award R01DA040386 for the experimental supplies and samples.
Footnotes
Supporting Information
The Supporting Information is available free of charge at https://pubs.acs.org/doi/10.1021/acsanm.0c01553.
Fluorescence imaging of QD colocalization with sEVs after QD-sEV conjugation, imaging of QD-sEV conjugates on human vaginal tissue, size distribution of sEVs before and after storing at 4°C for 25 days, 4FB-HyNic bond stability in biological and storage conditions, catalysts accelerate HyNic-4FB bond formation, representative frames of time-lapse imaging of QD-bEVs on BV-2 cells, cumulative counts of the bEV-cell interaction per cell during 1-hour time-lapse imaging at 1 and 4 h of incubation (PDF)
Complete contact information is available at: https://pubs.acs.org/10.1021/acsanm.0c01553
The authors declare no competing financial interest.
Contributor Information
Mengying Zhang, Molecular Engineering and Sciences Institute, University of Washington, Seattle, Washington 98195-1652, United States.
Lucia Vojtech, Department of Obstetrics and Gynecology, University of Washington, Seattle, Washington 98195-6460, United States.
Ziming Ye, Department of Chemical Engineering, University of Washington, Seattle, Washington 98195-1750, United States.
Florian Hladik, Department of Obstetrics and Gynecology and Department of Medicine, Division of Allergy and Infectious Diseases, University of Washington, Seattle, Washington 98195-6460, United States; Vaccine and Infectious Disease Division, Fred Hutchinson Cancer Research Center, Seattle, Washington 98109-1024, United States.
Elizabeth Nance, Molecular Engineering and Sciences Institute, Department of Chemical Engineering, Center on Human Development and Disability, and Department of Radiology, University of Washington, Seattle, Washington 98195-1652, United States.
REFERENCES
- (1).Raposo G; Stoorvogel W Extracellular vesicles: exosomes, microvesicles, and friends. J. Cell Biol 2013, 200 (4), 373–83. [DOI] [PMC free article] [PubMed] [Google Scholar]
- (2).Kim KM; Abdelmohsen K; Mustapic M; Kapogiannis D; Gorospe M RNA in extracellular vesicles. Wiley Interdiscip Rev. RNA 2017, 8 (4), e1413. [DOI] [PMC free article] [PubMed] [Google Scholar]
- (3).Vader P; Breakefield XO; Wood MJ Extracellular vesicles: emerging targets for cancer therapy. Trends Mol. Med 2014, 20 (7), 385–93. [DOI] [PMC free article] [PubMed] [Google Scholar]
- (4).Vojtech L; Zhang M; Dave V; Levy C; Hughes SM; Wang R; Calienes F; Prlic M; Nance E; Hladik F Extracellular vesicles in human semen modulate antigen-presenting cell function and decrease downstream antiviral T cell responses. PLoS One 2019, 14 (10), No. e0223901. [DOI] [PMC free article] [PubMed] [Google Scholar]
- (5).Buzas EI; Gyorgy B; Nagy G; Falus A; Gay S Emerging role of extracellular vesicles in inflammatory diseases. Nat. Rev. Rheumatol 2014, 10 (6), 356–64. [DOI] [PubMed] [Google Scholar]
- (6).Croese T; Furlan R Extracellular vesicles in neurodegenerative diseases. Mol. Aspects Med 2018, 60, 52–61. [DOI] [PubMed] [Google Scholar]
- (7).Manek R; Moghieb A; Yang Z; Kumar D; Kobessiy F; Sarkis GA; Raghavan V; Wang KKW Protein Biomarkers and Neuroproteomics Characterization of Microvesicles/Exosomes from Human Cerebrospinal Fluid Following Traumatic Brain Injury. Mol. Neurobiol 2018, 55 (7), 6112–6128. [DOI] [PMC free article] [PubMed] [Google Scholar]
- (8).van der Meel R; Fens MH; Vader P; van Solinge WW; Eniola-Adefeso O; Schiffelers RM Extracellular vesicles as drug delivery systems: lessons from the liposome field. J. Controlled Release 2014, 195, 72–85. [DOI] [PubMed] [Google Scholar]
- (9).Chen Y; Tang Y; Fan GC; Duan DD Extracellular vesicles as novel biomarkers and pharmaceutic targets of diseases. Acta Pharmacol. Sin 2018, 39 (4), 499–500. [DOI] [PMC free article] [PubMed] [Google Scholar]
- (10).Gangadaran P; Hong CM; Ahn BC Current Perspectives on In Vivo Noninvasive Tracking of Extracellular Vesicles with Molecular Imaging. BioMed Res. Int 2017, 2017, 9158319. [DOI] [PMC free article] [PubMed] [Google Scholar]
- (11).Puzar Dominkus P; Stenovec M; Sitar S; Lasic E; Zorec R; Plemenitas A; Zagar E; Kreft M; Lenassi M PKH26 labeling of extracellular vesicles: Characterization and cellular internalization of contaminating PKH26 nanoparticles. Biochim. Biophys. Acta, Bio-membr 2018, 1860 (6), 1350–1361. [DOI] [PubMed] [Google Scholar]
- (12).Takov K; Yellon DM; Davidson SM Confounding factors in vesicle uptake studies using fluorescent lipophilic membrane dyes. J. Extracell. Vesicles 2017, 6 (1), 1388731. [DOI] [PMC free article] [PubMed] [Google Scholar]
- (13).Morales-Kastresana A; Telford B; Musich TA; McKinnon K; Clayborne C; Braig Z; Rosner A; Demberg T; Watson DC; Karpova TS; Freeman GJ; DeKruyff RH; Pavlakis GN; Terabe M; Robert-Guroff M; Berzofsky JA; Jones JC Labeling Extracellular Vesicles for Nanoscale Flow Cytometry. Sci. Rep 2017, 7 (1), 1878. [DOI] [PMC free article] [PubMed] [Google Scholar]
- (14).Lai CP; Kim EY; Badr CE; Weissleder R; Mempel TR; Tannous BA; Breakefield XO Visualization and tracking of tumour extracellular vesicle delivery and RNA translation using multiplexed reporters. Nat. Commun 2015, 6, 7029. [DOI] [PMC free article] [PubMed] [Google Scholar]
- (15).Medintz IL; Uyeda HT; Goldman ER; Mattoussi H Quantum dot bioconjugates for imaging, labelling and sensing. Nat. Mater 2005, 4 (6), 435–46. [DOI] [PubMed] [Google Scholar]
- (16).Field LD; Walper SA; Susumu K; Lasarte-Aragones G; Oh E; Medintz IL; Delehanty JB A Quantum Dot-Protein Bioconjugate That Provides for Extracellular Control of Intracellular Drug Release. Bioconjugate Chem. 2018, 29 (7), 2455–2467. [DOI] [PubMed] [Google Scholar]
- (17).Michalet X; Pinaud FF; Bentolila LA; Tsay JM; Doose S; Li JJ; Sundaresan G; Wu AM; Gambhir SS; Weiss S Quantum dots for live cells, in vivo imaging, and diagnostics. Science 2005, 307 (5709), 538–44. [DOI] [PMC free article] [PubMed] [Google Scholar]
- (18).Zhang MY; Bishop BP; Thompson NL; Hildahl K; Dang B; Mironchuk O; Chen NN; Aoki R; Holmberg VC; Nance E Quantum dot cellular uptake and toxicity in the developing brain: implications for use as imaging probes. Nanoscale Adv. 2019, 1 (9), 3424–3442. [DOI] [PMC free article] [PubMed] [Google Scholar]
- (19).Blanco-Canosa JB; Medintz IL; Farrell D; Mattoussi H; Dawson PE Rapid covalent ligation of fluorescent peptides to water solubilized quantum dots. J. Am. Chem. Soc 2010, 132 (29), 10027–33. [DOI] [PMC free article] [PubMed] [Google Scholar]
- (20).Jiang X; Zong S; Chen C; Zhang Y; Wang Z; Cui Y Gold-carbon dots for the intracellular imaging of cancer-derived exosomes. Nanotechnology 2018, 29 (17), 175701. [DOI] [PubMed] [Google Scholar]
- (21).Madhankumar AB; Mrowczynski OD; Patel SR; Weston CL; Zacharia BE; Glantz MJ; Siedlecki CA; Xu LC; Connor JR Interleukin-13 conjugated quantum dots for identification of glioma initiating cells and their extracellular vesicles. Acta Biomater. 2017, 58, 205–213. [DOI] [PubMed] [Google Scholar]
- (22).Carnell-Morris P; Tannetta D; Siupa A; Hole P; Dragovic R Analysis of Extracellular Vesicles Using Fluorescence Nanoparticle Tracking Analysis. Methods Mol. Biol 2017, 1660, 153–173. [DOI] [PubMed] [Google Scholar]
- (23).Wang J; Guo R; Yang Y; Jacobs B; Chen S; Iwuchukwu I; Gaines KJ; Chen Y; Simman R; Lv G; Wu K; Bihl JC The Novel Methods for Analysis of Exosomes Released from Endothelial Cells and Endothelial Progenitor Cells. Stem Cells Int. 2016, 2016, 2639728. [DOI] [PMC free article] [PubMed] [Google Scholar]
- (24).Rodrigues M; Richards N; Ning B; Lyon CJ; Hu TY Rapid Lipid-Based Approach for Normalization of Quantum-Dot-Detected Biomarker Expression on Extracellular Vesicles in Complex Biological Samples. Nano Lett. 2019, 19 (11), 7623–7631. [DOI] [PMC free article] [PubMed] [Google Scholar]
- (25).Boriachek K; Islam MN; Gopalan V; Lam AK; Nguyen NT; Shiddiky MJA Quantum dot-based sensitive detection of disease specific exosome in serum. Analyst 2017, 142 (12), 2211–2219. [DOI] [PubMed] [Google Scholar]
- (26).Dobhal G; Ayupova D; Laufersky G; Ayed Z; Nann T; Goreham RV Cadmium-Free Quantum Dots as Fluorescent Labels for Exosomes. Sensors 2018, 18 (10), 3308. [DOI] [PMC free article] [PubMed] [Google Scholar]
- (27).Zong S; Zong J; Chen C; Jiang X; Zhang Y; Wang Z; Cui Y Single molecule localization imaging of exosomes using blinking silicon quantum dots. Nanotechnology 2018, 29 (6), 065705. [DOI] [PubMed] [Google Scholar]
- (28).McNicholas K; Michael MZ Immuno-characterization of Exosomes Using Nanoparticle Tracking Analysis. Methods Mol. Biol 2017, 1545, 35–42. [DOI] [PubMed] [Google Scholar]
- (29).Arruebo M; Valladares M; Gonzalez-Fernandez A Antibody-Conjugated Nanoparticles for Biomedical Applications. J. Nanomater 2009, 2009, 439389. [Google Scholar]
- (30).Richards DA; Maruani A; Chudasama V Antibody fragments as nanoparticle targeting ligands: a step in the right direction. Chem. Sci 2017, 8 (1), 63–77. [DOI] [PMC free article] [PubMed] [Google Scholar]
- (31).Reth M Matching cellular dimensions with molecular sizes. Nat. Immunol 2013, 14 (8), 765–7. [DOI] [PubMed] [Google Scholar]
- (32).Kowal J; Arras G; Colombo M; Jouve M; Morath JP; Primdal-Bengtson B; Dingli F; Loew D; Tkach M; Thery C Proteomic comparison defines novel markers to characterize heterogeneous populations of extracellular vesicle subtypes. Proc. Natl. Acad. Sci. U. S. A 2016, 113 (8), E968–77. [DOI] [PMC free article] [PubMed] [Google Scholar]
- (33).Betzer O; Perets N; Angel A; Motiei M; Sadan T; Yadid G; Offen D; Popovtzer R In Vivo Neuroimaging of Exosomes Using Gold Nanoparticles. ACS Nano 2017, 11 (11), 10883–10893. [DOI] [PubMed] [Google Scholar]
- (34).Busato A; Bonafede R; Bontempi P; Scambi I; Schiaffino L; Benati D; Malatesta M; Sbarbati A; Marzola P; Mariotti R Labeling and Magnetic Resonance Imaging of Exosomes Isolated from Adipose Stem Cells. Curr. Protoc Cell Biol 2017, 75, 3441–34415. [DOI] [PubMed] [Google Scholar]
- (35).Busato A; Bonafede R; Bontempi P; Scambi I; Schiaffino L; Benati D; Malatesta M; Sbarbati A; Marzola P; Mariotti R Magnetic resonance imaging of ultrasmall superparamagnetic iron oxide-labeled exosomes from stem cells: a new method to obtain labeled exosomes. Int. J. Nanomed 2016, 11, 2481–90. [DOI] [PMC free article] [PubMed] [Google Scholar]
- (36).Zhao JY; Chen G; Gu YP; Cui R; Zhang ZL; Yu ZL; Tang B; Zhao YF; Pang DW Ultrasmall Magnetically Engineered Ag2Se Quantum Dots for Instant Efficient Labeling and Whole-Body High-Resolution Multimodal Real-Time Tracking of Cell-Derived Microvesicles. J. Am. Chem. Soc 2016, 138 (6), 1893–903. [DOI] [PubMed] [Google Scholar]
- (37).Budzinski KL; Sgro AE; Fujimoto BS; Gadd JC; Shuart NG; Gonen T; Bajjaleih SM; Chiu DT Synaptosomes as a platform for loading nanoparticles into synaptic vesicles. ACS Chem. Neurosci 2011, 2 (5), 236–241. [DOI] [PMC free article] [PubMed] [Google Scholar]
- (38).Hong ZY; Lv C; Liu AA; Liu SL; Sun EZ; Zhang ZL; Lei AW; Pang DW Clicking Hydrazine and Aldehyde: The Way to Labeling of Viruses with Quantum Dots. ACS Nano 2015, 9 (12), 11750–60. [DOI] [PubMed] [Google Scholar]
- (39).Bailey RC; Kwong GA; Radu CG; Witte ON; Heath JR DNA-encoded antibody libraries: a unified platform for multiplexed cell sorting and detection of genes and proteins. J. Am. Chem. Soc 2007, 129 (7), 1959–67. [DOI] [PMC free article] [PubMed] [Google Scholar]
- (40).Villa CH; Dao T; Ahearn I; Fehrenbacher N; Casey E; Rey DA; Korontsvit T; Zakhaleva V; Batt CA; Philips MR; Scheinberg DA Single-walled carbon nanotubes deliver peptide antigen into dendritic cells and enhance IgG responses to tumor-associated antigens. ACS Nano 2011, 5 (7), 5300–11. [DOI] [PMC free article] [PubMed] [Google Scholar]
- (41).Egli S; Nussbaumer MG; Balasubramanian V; Chami M; Bruns N; Palivan C; Meier W Biocompatible functionalization of polymersome surfaces: a new approach to surface immobilization and cell targeting using polymersomes. J. Am. Chem. Soc 2011, 133 (12), 4476–83. [DOI] [PubMed] [Google Scholar]
- (42).Nolte-’t Hoen E; Cremer T; Gallo RC; Margolis LB Extracellular vesicles and viruses: Are they close relatives? Proc. Natl. Acad. Sci. U. S. A 2016, 113 (33), 9155–61. [DOI] [PMC free article] [PubMed] [Google Scholar]
- (43).Vojtech L; Woo S; Hughes S; Levy C; Ballweber L; Sauteraud RP; Strobl J; Westerberg K; Gottardo R; Tewari M; Hladik F Exosomes in human semen carry a distinctive repertoire of small non-coding RNAs with potential regulatory functions. Nucleic Acids Res. 2014, 42 (11), 7290–304. [DOI] [PMC free article] [PubMed] [Google Scholar]
- (44).Webber J; Clayton A How pure are your vesicles? J. Extracell. Vesicles 2013, 2, 19861. [DOI] [PMC free article] [PubMed] [Google Scholar]
- (45).Curtis C; Zhang M; Liao R; Wood T; Nance E Systems-level thinking for nanoparticle-mediated therapeutic delivery to neurological diseases. Wiley Interdiscip Rev. Nanomed Nanobiotechnol 2017, 9 (2), e1422. [DOI] [PubMed] [Google Scholar]
- (46).Lorincz AM; Timar CI; Marosvari KA; Veres DS; Otrokocsi L; Kittel A; Ligeti E Effect of storage on physical and functional properties of extracellular vesicles derived from neutron-philic granulocytes. J. Extracell. Vesicles 2014, 3, 25465. [DOI] [PMC free article] [PubMed] [Google Scholar]
- (47).Kumeda N; Ogawa Y; Akimoto Y; Kawakami H; Tsujimoto M; Yanoshita R Characterization of Membrane Integrity and Morphological Stability of Human Salivary Exosomes. Biol. Pharm. Bull 2017, 40 (8), 1183–1191. [DOI] [PubMed] [Google Scholar]
- (48).Hermanson GT Bioconjugate techniques, 3rd ed.; Elsevier/AP: London; Waltham, MA, 2013; p xvii. [Google Scholar]
- (49).Crisalli P; Kool ET Water-soluble organocatalysts for hydrazone and oxime formation. J. Org. Chem 2013, 78 (3), 1184–9. [DOI] [PMC free article] [PubMed] [Google Scholar]
- (50).Cheng Y; Zeng Q; Han Q; Xia W Effect of pH, temperature and freezing-thawing on quantity changes and cellular uptake of exosomes. Protein Cell 2019, 10 (4), 295–299. [DOI] [PMC free article] [PubMed] [Google Scholar]
- (51).Vella LJ; Scicluna BJ; Cheng L; Bawden EG; Masters CL; Ang CS; Willamson N; McLean C; Barnham KJ; Hill AF A rigorous method to enrich for exosomes from brain tissue. J. Extracell. Vesicles 2017, 6 (1), 1348885. [DOI] [PMC free article] [PubMed] [Google Scholar]
- (52).Konoshenko MY; Lekchnov EA; Vlassov AV; Laktionov PP Isolation of Extracellular Vesicles: General Methodologies and Latest Trends. BioMed Res. Int 2018, 2018, 8545347. [DOI] [PMC free article] [PubMed] [Google Scholar]
- (53).Karthikeyan A; Patnala R; Jadhav SP; Eng-Ang L; Dheen ST MicroRNAs: Key Players in Microglia and Astrocyte Mediated Inflammation in CNS Pathologies. Curr. Med. Chem 2016, 23 (30), 3528–3546. [DOI] [PubMed] [Google Scholar]
- (54).Trotta T; Panaro MA; Cianciulli A; Mori G; Di Benedetto A; Porro C Microglia-derived extracellular vesicles in Alzheimer’s Disease: A double-edged sword. Biochem. Pharmacol 2018, 148, 184–192. [DOI] [PubMed] [Google Scholar]
- (55).Brites D; Fernandes A Neuroinflammation and Depression: Microglia Activation, Extracellular Microvesicles and microRNA Dysregulation. Front. Cell. Neurosci 2015, 9, 476. [DOI] [PMC free article] [PubMed] [Google Scholar]
- (56).Zhang F; Nance E; Alnasser Y; Kannan R; Kannan S Microglial migration and interactions with dendrimer nanoparticles are altered in the presence of neuroinflammation. J. Neuroinflammation 2016, 13 (1), 65. [DOI] [PMC free article] [PubMed] [Google Scholar]
- (57).Paolicelli RC; Bergamini G; Rajendran L Cell-to-cell Communication by Extracellular Vesicles: Focus on Microglia. Neuroscience 2019, 405, 148–157. [DOI] [PubMed] [Google Scholar]
- (58).Thery C; Amigorena S; Raposo G; Clayton A Isolation and characterization of exosomes from cell culture supernatants and biological fluids. Curr. Protoc Cell Biol 2006, 30, 3.22.1. [DOI] [PubMed] [Google Scholar]
Associated Data
This section collects any data citations, data availability statements, or supplementary materials included in this article.
Supplementary Materials
Movie 1: Time-lapse imaging of QD-bEVs (red) interaction with Lectin stained BV-2 cells (green) after 1-h incubation; the images were taken every 5 min for 1 h (MOV)
Movie 2: Time-lapse imaging of QD-bEVs (red) moving and interacting with Lectin stained BV-2 cells (green) after 4-h incubation; the images were taken every 5 min for 1 h (MOV)
Movie 3: Time-lapse imaging of QD-bEVs (red) interaction with Lectin stained BV-2 cells (green) after 4-h incubation; the images were taken every 5 min for 1 h (MOV)