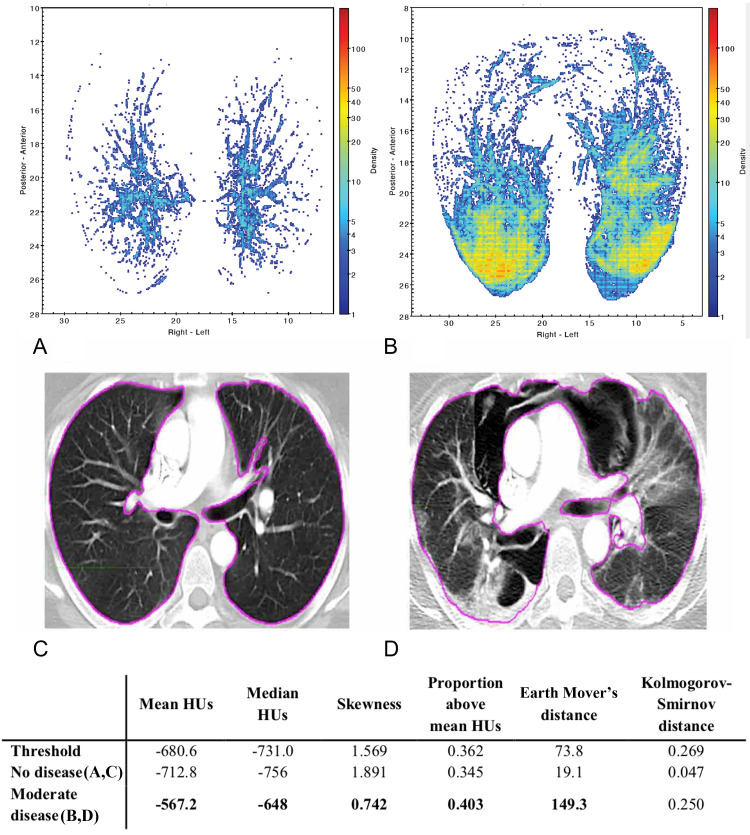
Figure 9. Comparison of scans pre- and post-COVID-19 infection in a patient.
(A, C) - no disease in March 2020; (B, D) - a moderate disease in April 2020
A bolded entry in the table signifies that the statistical measure classified the scan as abnormal based on the given threshold.
COVID-19 - Coronavirus disease 2019; HU - Hounsfield units.

