

Abstract
In chronic obesity, hepatocytes become insulin resistant and exert important effects on systemic metabolism. Here we show that in early onset obesity (4wks HFD), hepatocytes secrete exosomes which enhance insulin sensitivity both in vitro and in vivo. These beneficial effects were due to exosomal miRNA miR-3075 which is enriched in these hepatocyte exosomes. FA2H is a direct target of miR-3075 and siRNA depletion of FA2H in adipocytes, myocytes, and primary hepatocytes leads to increased insulin sensitivity. In chronic obesity (16–18wks HFD), hepatocyte exosomes promote a state of insulin resistance. These chronic obese hepatocyte exosomes do not directly cause impaired insulin signaling in vitro but do promote proinflammatory activation of macrophages. Taken together, these studies show that in early onset obesity, hepatocytes produce exosomes which express high levels of the insulin sensitizing miR-3075. In chronic obesity, this compensatory effect is lost and hepatocyte-derived exosomes from chronic obese mice promote insulin resistance.
Obesity-induced insulin resistance is a key feature of the prediabetic state, and when subsequent β-cell dysfunction emerges, the 2 metabolic defects combine, leading to the appearance of frank Type 2 Diabetes (T2DM)1–4. While a number of antidiabetic therapeutics are available, many patients are still unable to attain adequate glucose control. Therefore, there is a large unmet medical need for new therapeutics to treat this disorder, particularly with respect to insulin sensitization
EVs are heterogeneous membranous nanoparticles released from most cell types consisting of smaller particles termed exosomes, larger microvesicles and even larger apoptotic bodies5–7. Exosomes and their molecular cargos play critical roles in intercellular and interorgan crosstalk5–7. In a sense, the systemic inter-organ crosstalk attributed to secreted exosomes resembles an endocrine-like system. Emerging evidence has revealed that exosome-mediated intercellular communication exerts major effects on insulin resistance and glucose intolerance in the obese setting8–14. These effects have largely been attributed to the microRNAs (miRNAs) carried within exosomes6,12,13,15. miRNAs negatively regulate gene expression by binding to the 3’ untranslated region (3’ UTR) of mRNA targets, leading to translational arrest or degradation16–18. Exosomal miRNAs have been implicated in obesity-induced insulin resistance and glucose intolerance in both animals and humans6. As one example, our previous studies have demonstrated that adipose tissue macrophages (ATMs) secrete miRNA containing exosomes which can enter the circulation to be taken up by distal insulin target cells, such as liver, muscle, and adipocytes12. ATM exosomes derived from obese mice directly cause insulin resistance in vitro, and when given to lean mice, they produce a state of insulin resistance and glucose intolerance. In contrast, ATM exosomes derived from lean mice lead to improved insulin sensitivity both in vitro and in vivo. Indeed, we have recently demonstrated that miR-690 is abundantly expressed in M2 macrophage-derived exosomes and can directly cause enhanced insulin sensitivity in vitro in cells and reverses insulin resistance/glucose intolerance when given to obese mice in vivo13.
The liver plays an essential role in the metabolism of glucose and lipids and must quickly adapt to differing conditions of nutrient availability by regulating the fluxes of carbohydrates and lipids19,20. While some studies have reported that hepatocyte-derived extracellular vesicles (EVs) can act as paracrine molecules leading to activation of hepatic stellate cells21–25, little is known about the systemic effects of hepatocyte exosomal miRNAs on the metabolic dysfunction in obesity.
Here we find that hepatocytes secrete distinct exosomal miRNAs in early onset vs. chronic established obesity that modulate peripheral insulin sensitivity and glucose tolerance. Hepatocyte-derived exosomes collected from 4 week HFD mice (early stage obesity) can directly enhance both in vitro and in vivo insulin sensitivity. miR-3075 is highly induced in these early onset 4wk HFD hepatocyte-derived exosomes and directly causes these beneficial metabolic effects. Based on exosomal miRNA sequencing and a bioinformatics approach, we identified FA2H mRNA as a target of miR-3075. Indeed, FA2H expression is suppressed after treatment with 4wk HFD hepatocyte exosomes or with a miR-3075 mimetic. In contrast to the findings with early stage 4wk HFD hepatocyte exosomes, chronic established obesity in 16wks HFD mice leads to the secretion of hepatocyte exosomes which no longer express high levels of miR-3075. Indeed, these 16wk HFD hepatocyte exosomes indirectly exaggerate insulin resistance by stimulating proinflammatory macrophage responses in adipose tissue. Thus, in early stage obesity hepatocytes secrete exosomes which appear to be a compensatory response mitigating the full development of insulin resistance, whereas, in the chronic obese state, hepatocyte-derived exosomes promote insulin resistance.
Results
Effects of hepatocyte exosomes in early stage obesity.
EVs play a critical role in transporting extracellular miRNAs between different cell types. In these studies we have used a previously published isolation method which yields a highly enriched and well characterized population of exosomes from cell culture media and, therefore, the term exosomes is used throughout this paper12,13. To assess the effect of high fat diet (HFD) induced-obesity on this process, hepatocyte-derived exosomes were collected from chow-fed lean animals, 4 week (4wk) HFD mice with early stage obesity, or from chronically obese 16 week HFD WT mice. Exosome-associated characteristics, such as protein markers and particle size, were similar across these preparations. We observed that hepatocytes from both 4 and 16wk HFD fed mice, secreted more exosomes than lean hepatocytes (Extended Data Fig. 1a and 1b). More importantly, as seen in Fig. 1a, miRNA sequencing showed that the expression patterns differ in early onset obesity (4wk HFD) compared to chronic, established obesity (16wk HFD) or chow-fed lean mice.
Fig. 1. Hepatocyte-derived exosomes from early stage obese mice enhance insulin sensitivity.
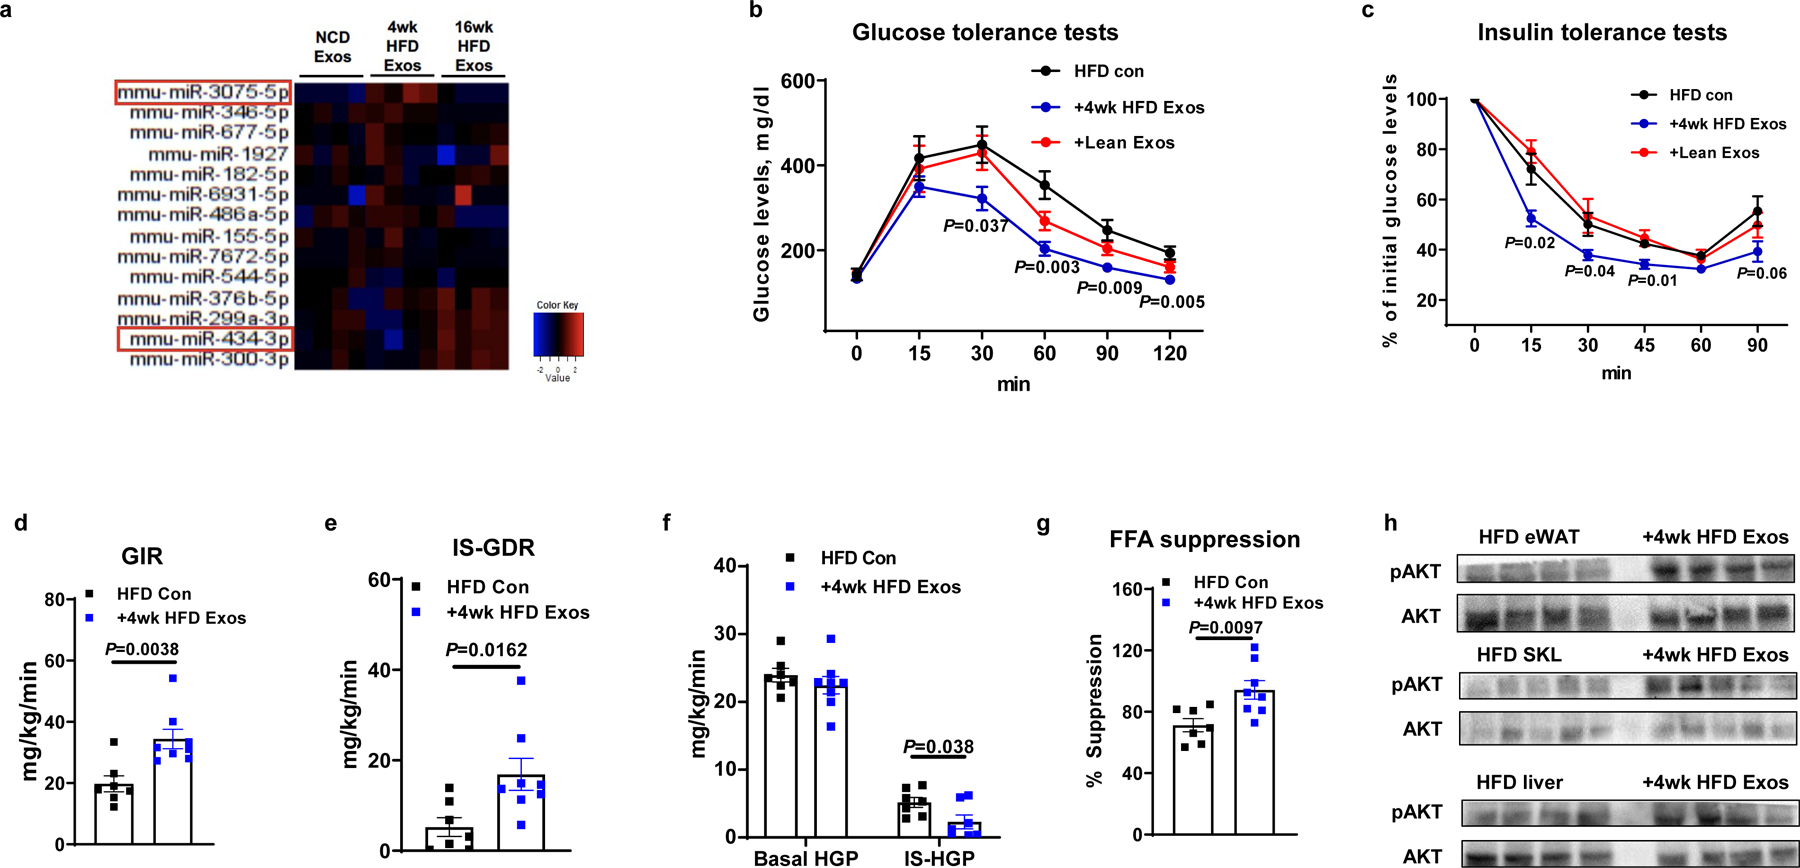
a, Differential expression of miRNAs within lean, 4wk HFD, and 16wk HFD hepatocyte-derived exosomes (Exos). b and c, Glucose and insulin tolerance tests in 18 week HFD/obese recipient mice after 6 wks treatment with 4wk HFD hepatocyte Exos, lean hepatocyte Exos, or empty liposomes (HFD Con). d-g, Glucose infusion rate (GIR), insulin-stimulated glucose disposal rate (IS-GDR), hepatic glucose production (HGP), and the percentage suppression of free fatty-acid levels (FFA suppression) during hyperinsulinemic-euglycemic clamp studies from control and 4wk HFD Exos treated mice. The control HFD mice were treated with empty liposomes. h, Insulin-stimulated AKT phosphorylation in liver, skeletal muscle (SKL), and epididymal fat of 18wk HFD/obese mice treated with 4wk HFD Exos. Data in Fig. 1b–1g were combined from two independent experiments. Experiments for Fig. 1h were repeated at least twice with similar results. Data are presented as mean ± SEM. n=4 (a), n=5–10 (b and c), n=7 (d-g) per group. Two-sided Student’s t-test.
The 4wk HFD hepatocyte exosomes were labeled with red fluorescent PKH26 dye and injected into 12wk HFD/obese mice. We found that hepatocyte exosomes can be transferred and taken up by insulin target tissues, as evidenced by the appearance of red fluorescence in the liver, adipose tissue, and skeletal muscle of the 12wk HFD/obese recipient mice (Extended Data Fig. 1c). No red fluorescence was detected in these tissues after injection of exosomes not labeled with PKH26 dye. We next tested the metabolic effects of 4wk HFD hepatocyte hepatocyte exosomes. 4wk HFD hepatocyte exosomes were intravenously injected into 12wk HFD/obese WT mice (5 × 10⁹ exosomes/mouse, twice per week for 6 weeks). Additional groups of 12wk HFD/obese mice were treated with either empty liposomes or hepatocyte exosomes derived from chow-fed lean mice. While all recipient groups displayed comparable body weights after exosomes treatment (Extended Data Fig. 1e), administration of 4wk HFD hepatocyte exosomes led to improved glucose tolerance (Fig. 1b) and insulin sensitivity (Fig. 1c) compared to treatment with either empty liposomes (HFD control) or lean hepatocyte exosomes (Fig. 1b and 1c). These results also show that treatment with empty liposomes has no metabolic effects (Extended Data Fig. 1d). The beneficial metabolic effects of 4wk HFD hepatocyte exosome treatment on in vivo insulin sensitivity was further assessed by performing hyperinsulinemic, euglycemic clamp studies. After treatment with 4wk HFD hepatocyte exosomes, the recipient 16wk HFD/obese mice exhibited higher glucose infusion rates, enhanced insulin-stimulated glucose disposal rate, and a greater degree of insulin-mediated suppression of hepatic glucose production and circulating free fatty acid levels (Fig. 1d–1g). This shows the effect of 4wk HFD hepatocyte exosomes to cause systemic insulin sensitivity in all major insulin target tissues. Consistent with this, the levels of insulin-stimulated AKT phosphorylation in skeletal muscle, liver, and adipose tissue were enhanced in the HFD/obese recipient mice treated with the 4wk HFD hepatocyte exosomes (Fig. 1h). Interestingly, 4wk HFD Exo treatment had minimal effects on adipose tissue inflammation, as exemplified by similar levels of M1 and M2-like ATMs. In addition, adipose tissue proinflammatory cytokine expression in the chronically obese recipient HFD mice treated with 4wk HFD hepatocyte exosomes was the same compared to empty liposome-treated controls (Extended Data Fig. 1f and 1g).
We also assessed the direct effects of 4wk HFD hepatocyte exosomes on in vitro insulin signaling in adipocytes, myocytes, and hepatocytes. Consistent with the improvement induced by 4wk HFD hepatocyte exosomes on in vivo insulin sensitivity, 3T3-L1 adipocytes and L6 myocytes exhibited increased insulin-stimulated glucose uptake after treatment with the 4wk HFD hepatocyte exosomes (1 × 10⁸ exosomes per 0.5 × 10⁶ cells; Extended Data Fig. 1h and 1i). In addition, treatment of primary hepatocytes from 12wk HFD/obese mice with hepatocyte exosomes from 4wk HFD mice led to enhanced insulin-mediated suppression of glucagon-stimulated glucose production, compared to the insulin-resistant obese hepatocytes treated with empty liposomes (Extended Data Fig. 1j). As shown in Extended Data Fig. 1k, 4wk HFD hepatocyte exosome treatment also led to increased levels of insulin-stimulated AKT phosphorylation in these three insulin target cell types. Taken together, these results indicate that 4wk HFD hepatocyte exosomes directly mitigate obesity-associated insulin resistance.
Inhibition of hepatocyte exosome secretion and miRNA loading.
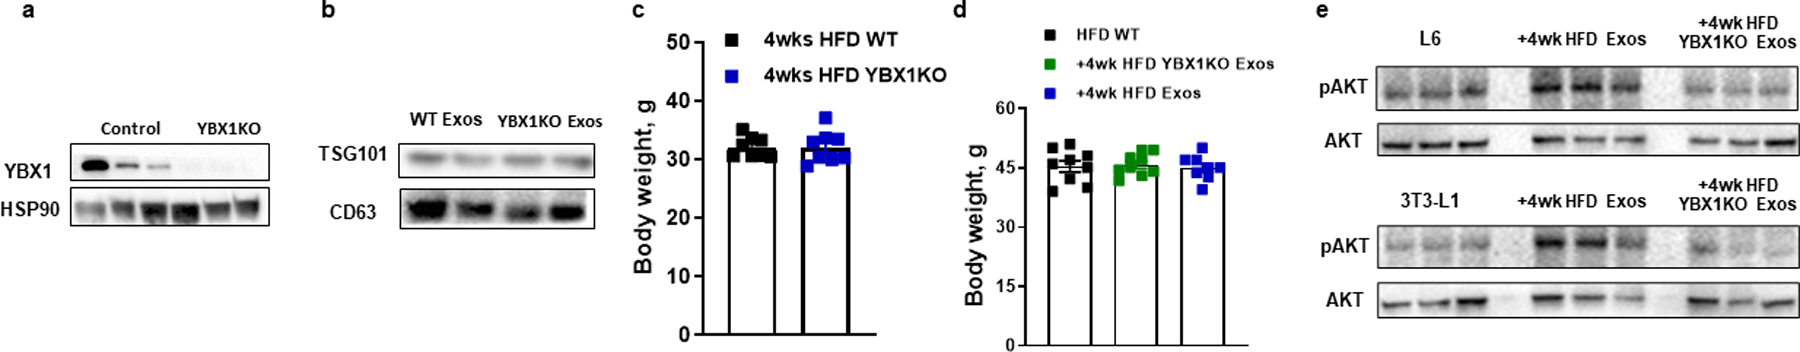
To deplete exosomal miRNAs, we generated hepatocyte-specific Y-box-binding protein 1 (YBX1) KO mice. YBX1 is a necessary component of the machinery that loads miRNAs into exosomes26,27. To knockout YBX1 in hepatocytes, hepatocyte-specific Cas9 transgenic mice were treated with a lentivirus (1 × 10⁸ particles/mouse) carrying a YBX1 guide RNA (gRNA-YBX1) designed to delete the translational start site (Extended Data Fig. 2a)28–30. Deletion of YBX1 did not affect hepatocyte exosome production or the expression of exosome associated protein markers (Fig. 2a and Extended Data Fig. 2b) but led to a marked decrease in the miRNA content within the hepatocyte exosomes, as shown by the > 95% reduction in miR-122 (a highly expressed miRNA in hepatocytes) abundance (Fig. 2b). As seen in Fig. 2c, 2d, and Extended Data Fig. 2c, hepatocyte YBX1 deletion exacerbated glucose and insulin tolerance in 4wk HFD KO mice with no change in body weight. This indicates that endogenous hepatocyte miRNAs loaded into exosomes function to mitigate impaired glucose and insulin tolerance in 4wk HFD mice. In addition, YBX1KO mediated miRNA depletion abolished the beneficial effects of 4wk HFD hepatocyte exosomes on glucose tolerance and in vivo insulin sensitivity and did not affect body weight (Fig. 2e, 2f, and Extended Data Fig. 2d). This is shown by similar glucose and insulin tolerance tests between 18wks HFD WT recipient mice treated either with 4wk HFD YBX1KO hepatocyte exosomes or empty liposomes compared to the improvement seen in 4wk HFD Exos treated obese mice (Fig. 2e and 2f). 4wk HFD YBX1KO hepatocyte exosome treatment also had no significant effects on glucose uptake or insulin-stimulated AKT phosphorylation in 3T3-L1 adipocytes or L6 myocytes (Fig. 2g and 2h and Extended Data Fig. 2e).
Fig. 2. miRNAs are the key cargo causing the hepatocyte Exos effects.
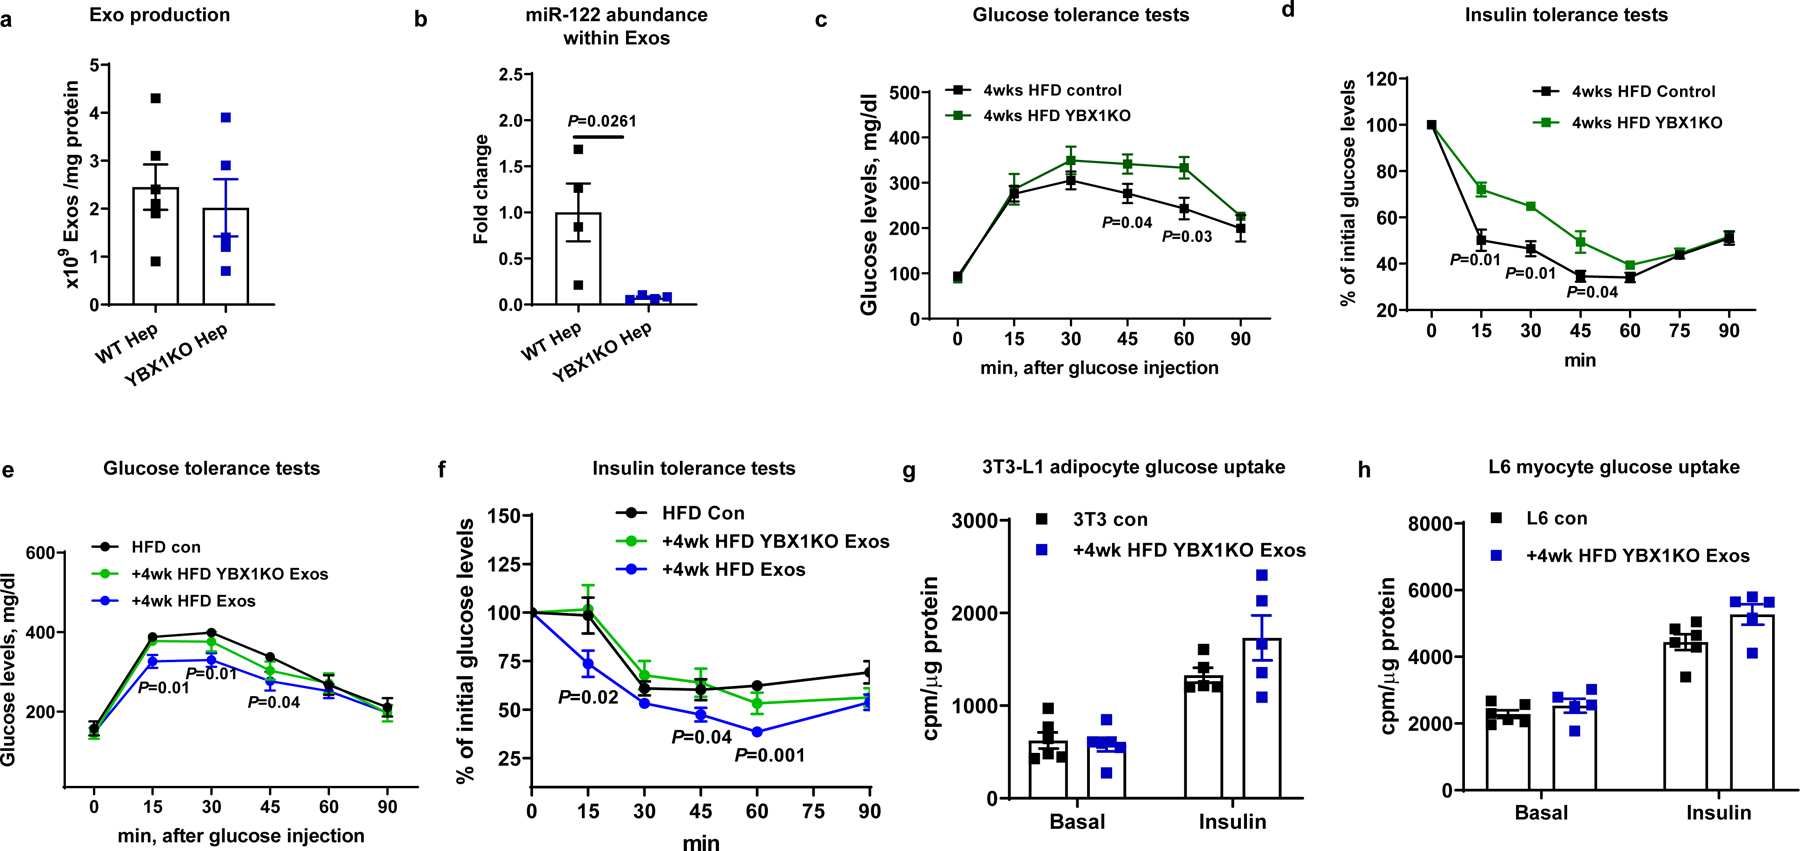
a, Effect of YBX1KO on hepatocyte Exo production. b, miR-122 abundance within Exos derived from hepatocytes with and without YBX1KO. c and d, Effect of hepatocyte-specific YBX1KO on glucose tolerance and insulin sensitivity after 4wks HFD feeding. e and f, Glucose and insulin tolerance tests in 18wk HFD/obese mice treated with either 4wk HFD Exos or 4wk HFD YBX1KO Exos. The control HFD mice were treated with empty liposomes. g and h, Effect of 4wk HFD YBX1KO Exos on glucose uptake in 3T3-L1 adipocytes and L6 myocytes. The control cells were treated with empty liposomes. All experiments were repeated at least twice with similar results. Data are presented as mean ± SEM. n=5 (a), n=4 (b), n=8 (c-f), n=5–6 (g and h) per group. Two-sided Student’s t-test.
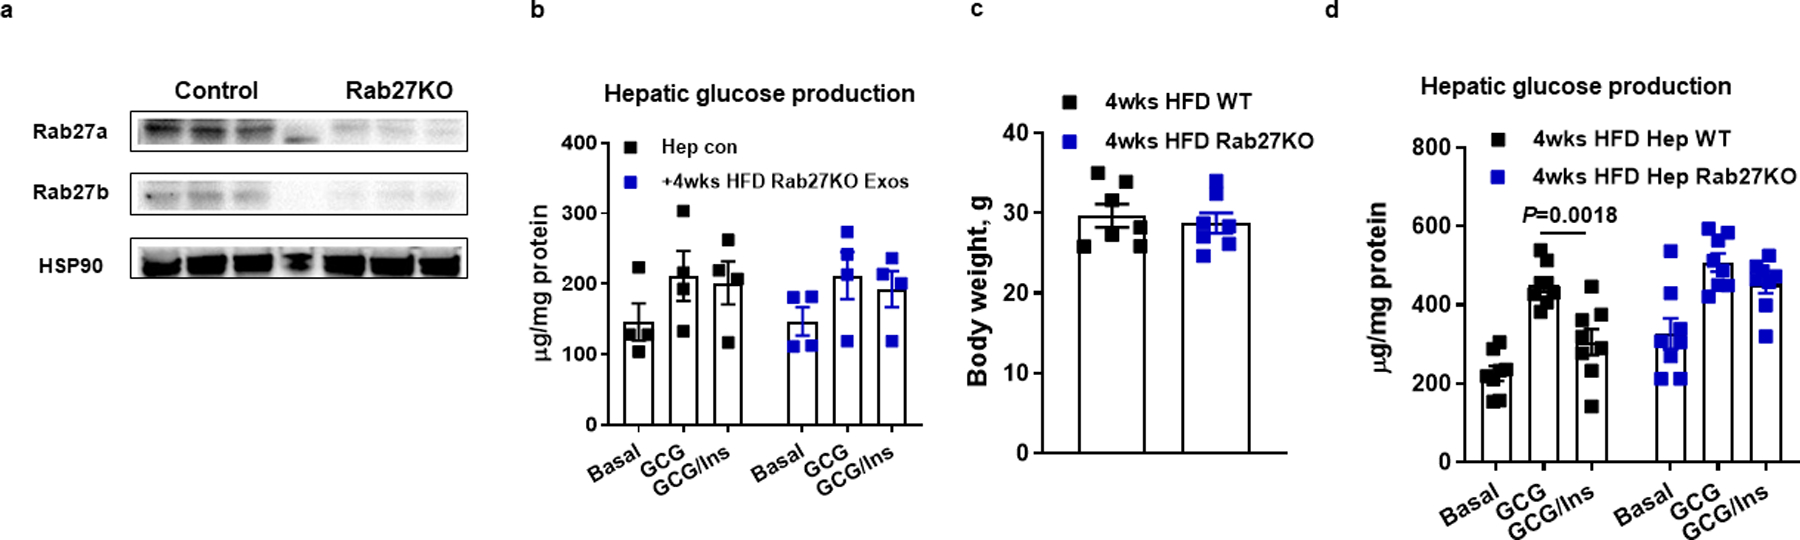
Previous studies have demonstrated that Rab27, a small GTPase, is critical for the secretion of small vesicles such as exosomes31–33. To evaluate the importance of Rab27 on the release of exosomes and extracellular miRNAs from hepatocytes, we generated a hepatocyte-specific Rab27 knockout (Rab27KO) mouse model. This was done by intravenous injection of a lentivirus harboring the guide RNAs for start site deletion of both Rab27a and Rab27b (gRNA-Rab27a and gRNA-Rab27b, respectively) into hepatocyte-specific Cas9 transgenic mice (Extended Data Fig. 3a). Control Cas9 transgenic mice were injected with lentivirus carrying control vectors without gRNA. Nanoparticle analysis confirmed a significant reduction in hepatocyte exosome secretion after Rab27 depletion (Fig. 3a). More importantly, deletion of Rab27 in hepatocytes significantly reduced the miRNA content of the remaining EVs, as evidenced by an ~ 90% lower level of miR-122 per 1×10⁹ EVs (Fig. 3b). Most likely, this is because many of the remaining “exosomes” are other forms of EVs which do not carry significant levels of miRNAs. We found that EVs derived from 4wk HFD Rab27KO hepatocytes did not affect in vitro hepatic glucose production (Extended Data Fig. 3b), in contrast to treatment with 4wk HFD hepatocyte exosomes from WT mice. Hepatocyte Rab27 depletion resulted in glucose intolerance and insulin resistance, compared to the WT control mice with no change in body weight (Fig. 3c and 3d and Extended Data Fig. 3c). We also observed lower insulin-stimulated AKT phosphorylation in liver, skeletal muscle, and adipose tissue from hepatocyte-specific Rab27KO mice compared to WT control mice (Fig. 3e). In addition, hepatocytes isolated from 4wk HFD hepatocyte-specific Rab27KO mice displayed impaired insulin suppression of glucagon-induced glucose output, whereas, 4wk HFD WT hepatocytes showed normal insulin sensitivity (Extended Data Fig. 3d). These data indicate that endogenous miRNAs within 4wk HFD hepatocytes provide signals needed to mitigate cellular insulin resistance. Overall, the results suggest the concept that expression of insulin sensitizing miRNAs in 4wk HFD hepatocyte exosomes may be a compensatory response in an attempt to mitigate HFD/obesity-induced insulin resistance.
Fig. 3. Effects of hepatocyte-specific Rab27KO on Exos secretion and miRNA content.
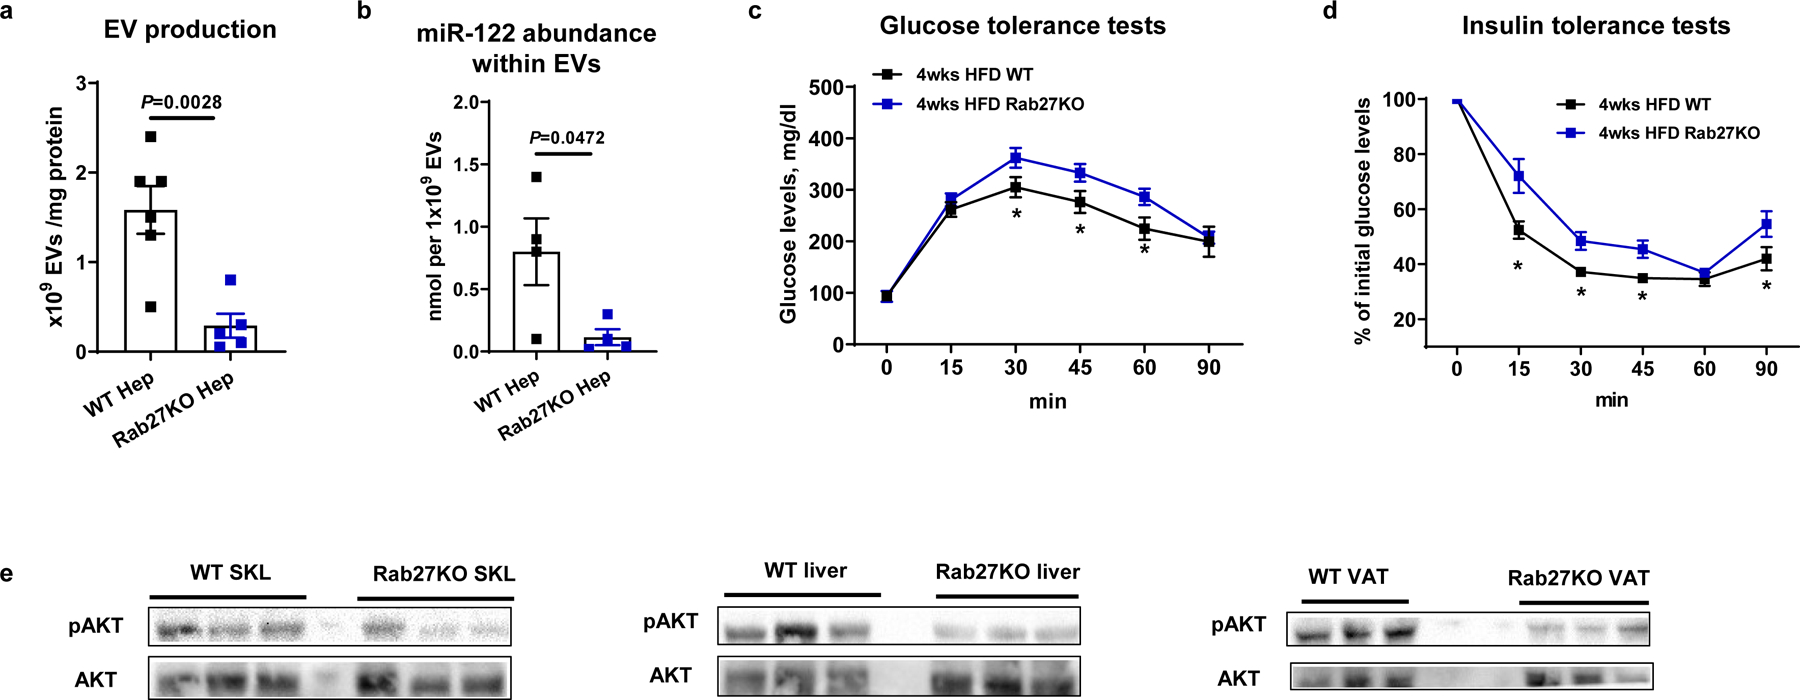
a, Effect of Rab27KO on hepatic Exos production. Equal amount of media were used for analysis. b, miR-122 abundance within Exos derived from hepatocytes after knockout of Rab27. c and d, Glucose and insulin tolerance tests in hepatocyte-specific Rab27KO mice after 4wks HFD feeding. e, Insulin-stimulated phosphorylation of AKT in skeletal muscle (SKL), liver, and visceral adipose tissue (VAT) from 4wk HFD WT and hepatocyte Rab27KO mice. All experiments were repeated at least twice with similar results. Data are presented as mean ± SEM. n=5 (a), n=4 (b), n=8 (c and d) per group. Two-sided Student’s t-test.
Exosomal miR-3075 produces insulin sensitivity.
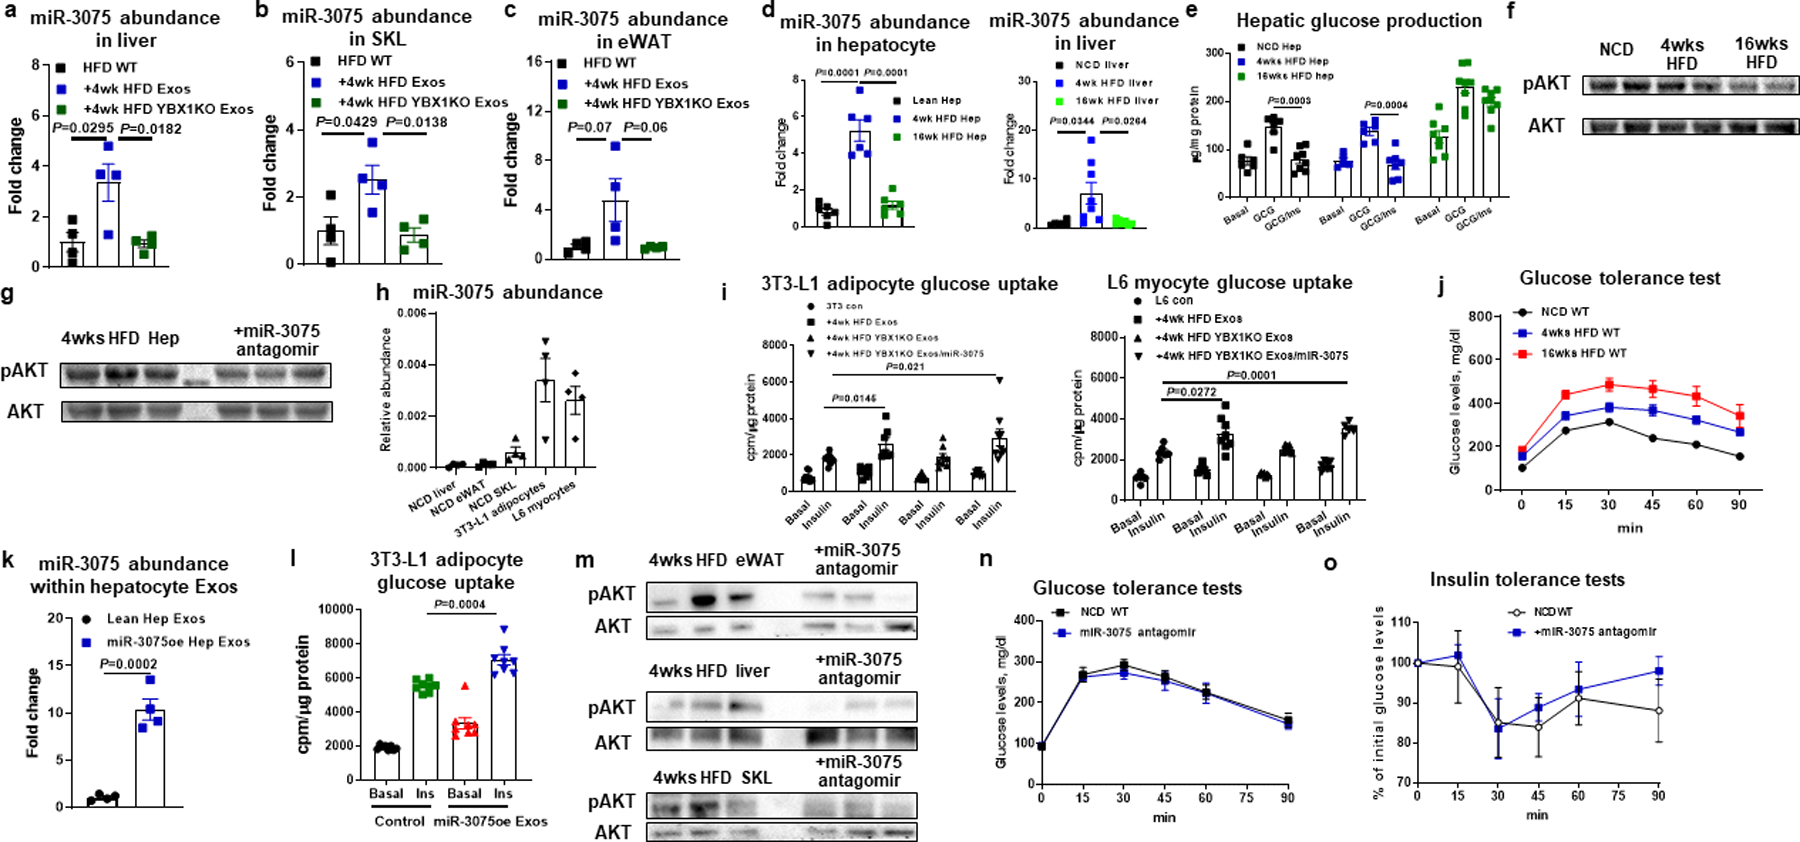
Our miRNA sequencing analysis revealed that 4 wk HFD feeding induced a set of miRNAs uniquely enriched in hepatocyte exosomes (Fig. 1a). This increased expression was greatest and most consistent for miR-3075. In addition, we validated that miR-3075 was highly enriched in key metabolic tissues after treatment with 4wk HFD hepatocyte exosomes, demonstrating transfer and uptake from these exosomes to adipose tissue, skeletal muscle, and liver (Extended Data Fig. 4a–4c). In contrast, treatment with 4wk HFD YBX1KO hepatocyte exosomes did not affect miR-3075 abundance in obese recipient mice (Extended Data Fig. 4a–4c). Interestingly, at 4wks of HFD, primary hepatocytes maintain a comparable level of insulin sensitivity as primary hepatocytes from chow-fed lean mice (Extended Data Fig. 4e and 4f), demonstrating that they do not exhibit cell-autonomous insulin resistance. These cells express high levels of endogenous miR-3075 (Extended Data Fig. 4d) which led us to hypothesize that miR-3075 plays a role in attenuating full insulin resistance in early onset obesity. To assess this, we utilized a miR-3075 mimetic packaged into artificial liposomes and found that treatment of insulin-resistant primary hepatocytes obtained from 12wks HFD/obese mice restored normal insulin sensitivity (Fig. 4a and 4d). In addition, treatment of 3T3-L1 adipocytes and L6 myocytes with the miR-3075 mimic-containing liposomes led to enhanced adipocyte and myocyte insulin-stimulated glucose uptake (Fig. 4b and 4c), as well as greater levels of insulin-stimulated phosphorylated AKT (Fig. 4d). Furthermore, co-treatment with a miR-3075 antagomir plus the miR-3075 mimic blocked this improvement in insulin-stimulated glucose uptake in 3T3-L1 adipocytes and L6 cells (Fig. 4e and 4f). Importantly, the miR-3075 antagomir alone led to impaired insulin signaling in these 3 cell types (Fig. 4e–4g and Extended Data Fig. 4g), showing that the relatively high endogenous levels of miR-3075 participate in maintaining a high state of insulin signaling in these normal cells (Extended Data Fig. 4h). We also found that combination treatment with the miR-3075 mimic plus 4wk HFD YBX1KO hepatocyte exosomes led to increased cellular insulin responses, whereas, addition of only 4wk HFD YBX1KO hepatocyte exosomes had no effect (Extended Data Fig. 4i). Consistent with this overall concept, chronically obese 16wk HFD mice displayed markedly impaired glucose tolerance compared to lean mice, while glucose tolerance in 4wk HFD mice is intermediate (Extended Data Fig. 4j). We also transfected hepatocytes from lean mice with the miR-3075 mimic (Extended Data Fig. 4k). As expected, treatment with these miR-3075 enriched lean hepatocyte exosomes led to increased insulin-stimulated glucose uptake in 3T3-L1 adipocytes (Extended Data Fig. 4l).
Fig. 4. miR-3075 is an insulin sensitizer within 4wk HFD Exos.
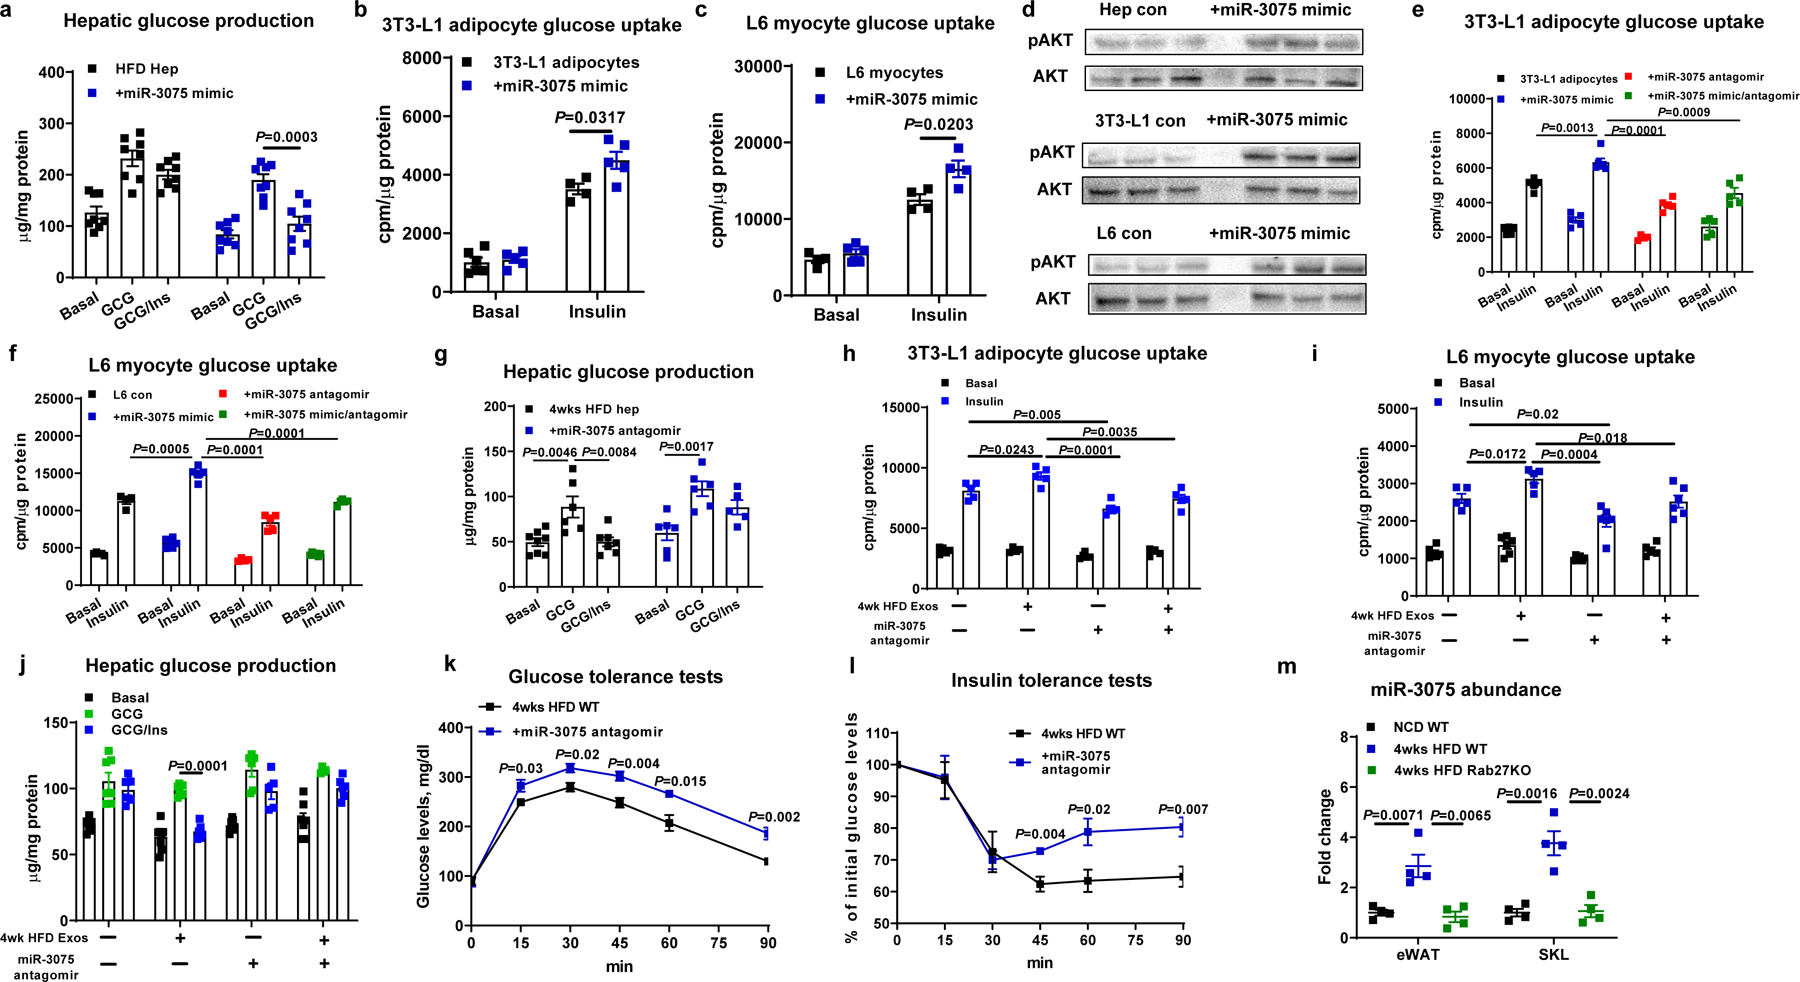
a-c, Effect of miR-3075 mimic transfection on glucose uptake in 3T3-L1 adipocytes and L6 myocytes, and hepatic glucose output in primary hepatocytes. d, Insulin-stimulated phosphorylated AKT levels in recipient cells after 24 hours transfection with the miR-3075 mimic. Glucose uptake in 3T3-L1 adipocytes (e) and L6 myocytes (f) after treatment with the miR-3075 mimic and/or miR-3075 antagomir. g, Effect of miR-3075 antagomir treatment on glucose production from hepatocytes isolated from 4wk HFD WT mice. Effects of the miR-3075 antagomir on 4wk HFD Exos-induced 3T3-L1 adipocyte glucose uptake (h), L6 myocyte glucose uptake (i), and obese primary hepatocyte glucose production (j). Control cells were treated with a scrambled miRNA mimic or an inactive C. elegans miR-67 antagomir. Effects of the miR-3075 antagomir on glucose tolerance (k) and insulin sensitivity (l) in 4wk HFD-fed WT mice. Control mice were treated with the C. elegans miR-67 antagomir. m, qPCR analysis of miR-3075 levels in eWAT and SKL of lean WT, 4 wk HFD WT, or hepatocyte-specific Rab27KO mice. All experiments were repeated at least twice with similar results. Data are presented as mean ± SEM. n=8 (a), n=4–6 (b and c, h and i), n=5–6 (e and f, k and l), n=6 (g-j), n=4 (m) per group. Two-sided Student’s t-test.
To further evaluate the importance of miR-3075 in the effects of 4wk HFD hepatocyte exosomes, obese hepatocytes and 3T3-L1 adipocytes were treated with a combination of 4wk HFD Exos and the miR-3075 antagomir. As shown in Fig. 4h–4j, 4wk HFD hepatocyte exosomes treatment enhanced cellular insulin action, whereas, the miR-3075 antagomir blocked the effects of 4wk HFD hepatocyte exosomes. We also assessed miR-3075 antagomir effects in vivo in early stage obesity. Thus, WT mice were intravenously injected with liposomes encapsulating the miR-3075 antagomir (2x per week, 10 nmole/mouse; starting at 1 week of HFD). Control mice were treated with liposomes containing C. elegans miR-67 antagomir which has no activity in mammalian species and serves as a negative control. After 4 weeks, miR-3075 antagomir treatment led to impaired glucose tolerance and insulin resistance compared to control mice treated with the C. elegans miR-67 antagomir liposomes (Fig. 4k and 4l and Extended Data Fig. 4m). Lean WT mice who have normal glucose tolerance displayed no changes in metabolic responses in response to miR-3075 antagomir treatment (Extended Data Fig. 4n and 4o). Indeed, we found that miR-3075 was expressed at low levels in the key metabolic tissues of lean mice (Extended Data Fig. 4h), consistent with the absence of antagomir effects. Together, these results show that miR-3075 is the main contributor to the insulin-sensitizing effects of 4wk HFD hepatocyte exosomes.
Since miR-3075 levels are quite low in tissues from chow-fed or chronically obese mice, our concept is that the adipose tissue and skeletal muscle levels of miR-3075 at 4wk HFD are not endogenously produced but are derived from the circulating 4wk HFD hepatocyte exosomes. To validate this concept, we found that miR-3075 abundance is elevated in eWAT and skeletal muscle in 4 wk HFD mice, compared to the results in lean chow-fed mice or chronically obese mice (Fig. 4m). In contrast, there were very low levels of miR-3075 in adipose tissue or skeletal muscle in 4 wk HFD hepatocyte-specific RabKO mice (Fig. 4m). This supports the concept that hepatocytes are the source of miR-3075 in adipose tissue and skeletal muscle at 4 wk HFD.
Fatty acid 2-hydroxylase is a miR-3075 target gene.
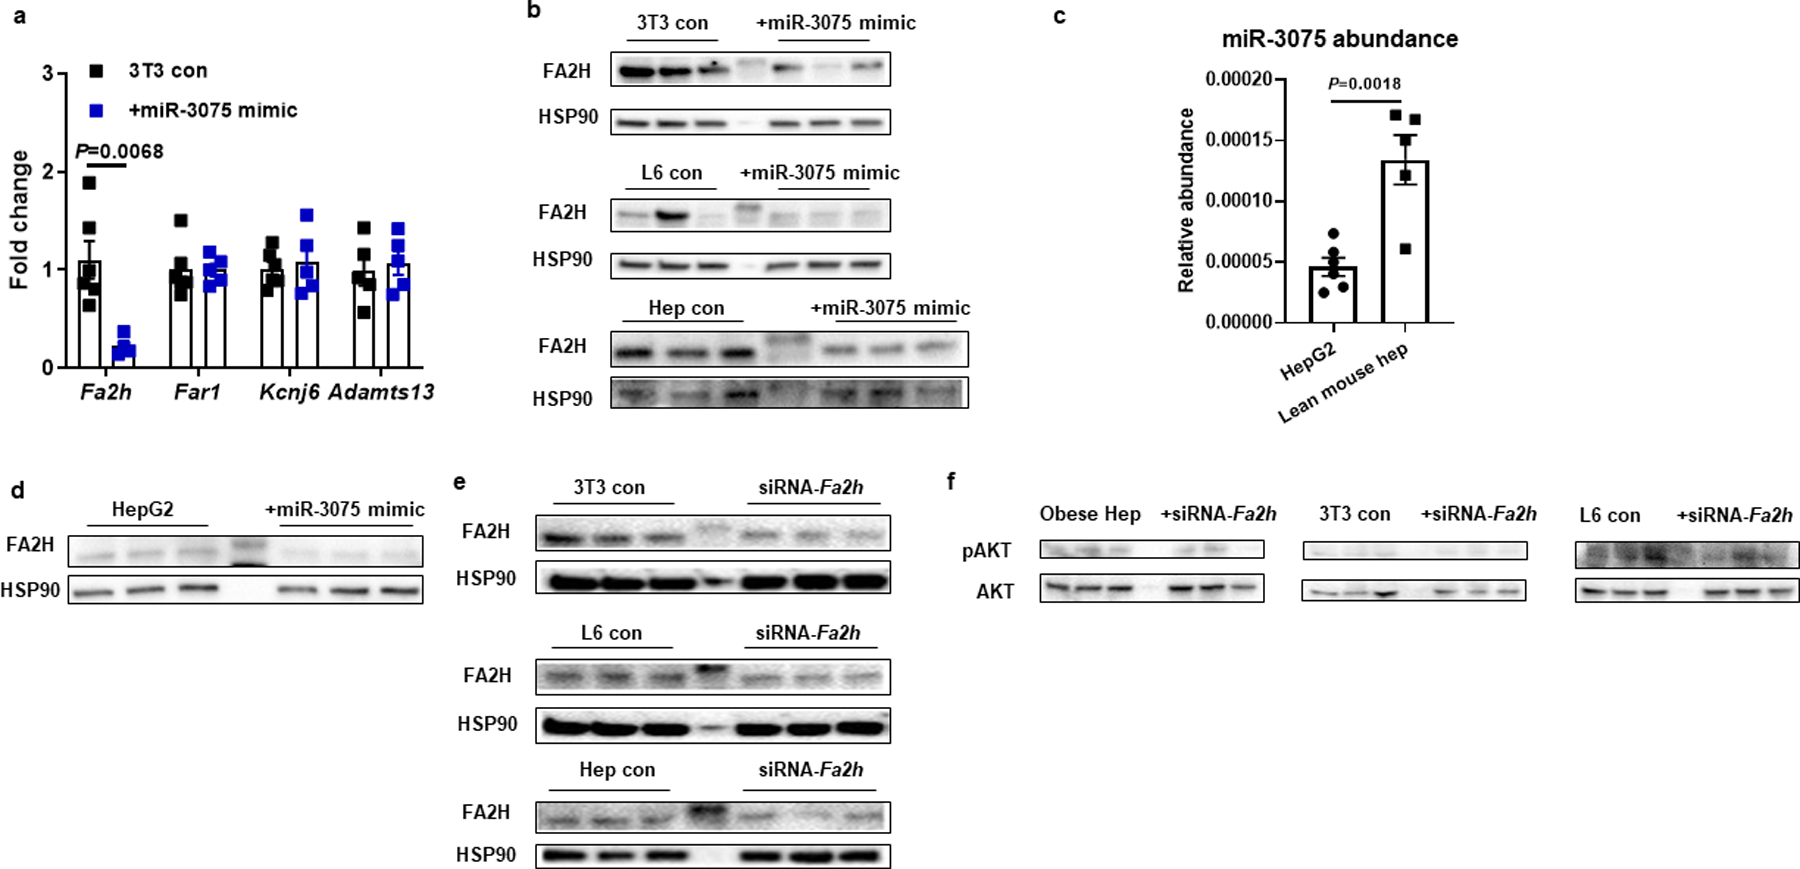
miRNAs exert their biological effects by causing translational arrest and/or inducing degradation of their target miRNAs through base pairing between the miRNA seed sequence and the target mRNA recognition site. We used the target gene prediction algorithm Target Scan Mouse 7.2 to identify theoretical target genes of miR-307534. After validating a group of mRNAs that harbor this target site sequence in their 3’ untranslated region (UTR; Extended Data Fig. 5a), we found that only the abundance of the gene encoding fatty acid 2-Hydroxylase (FA2H) was markedly downregulated after treatment of adipocytes, hepatocytes and L6 myocytes with the miR-3075 mimic-containing liposomes (Extended Data Fig. 5b). We next examined FA2H expression in eWAT, skeletal muscle, and liver in 16wks HFD/obese mice after treatment with 4wk HFD hepatocyte exosomes. As seen in Fig. 5a, FA2H protein abundance was markedly reduced in these metabolic tissues following the treatment period. Consistent with this, 4wk HFD hepatocyte exosome treatment in vitro reduced FA2H levels in 3T3-L1 cells, L6 myocytes, and obese mouse hepatocytes (Fig. 5b). Treatment with 4wk HFD YBX1KO hepatocyte exosomes did not affect FA2H abundance, whereas, combination treatment with 4wk HFD YBX1KO hepatocyte exosomes plus the miR-3075 mimic led to a reduction in FA2H expression (Fig. 5b). We performed luciferase reporter assays with a vector carrying the Fa2h 3’ UTR. After 24 hours co-transfection with this reporter construct along with the miR-3075 mimic in HEK293 cells, we found that luciferase activity was decreased by ~ 90% compared to control cells transfected with only the Fa2h 3’ UTR vector (Fig. 5c). We observed that miR-3075 was expressed in human HepG2 cells (Extended Data Fig. 5c) and that treatment with the miR-3075 mimic also led to less FA2H abundance in human HepG2 cells (Extended Data Fig. 5d).
Fig. 5. Fa2h is a miR-3075 target gene that regulates cellular insulin responses.
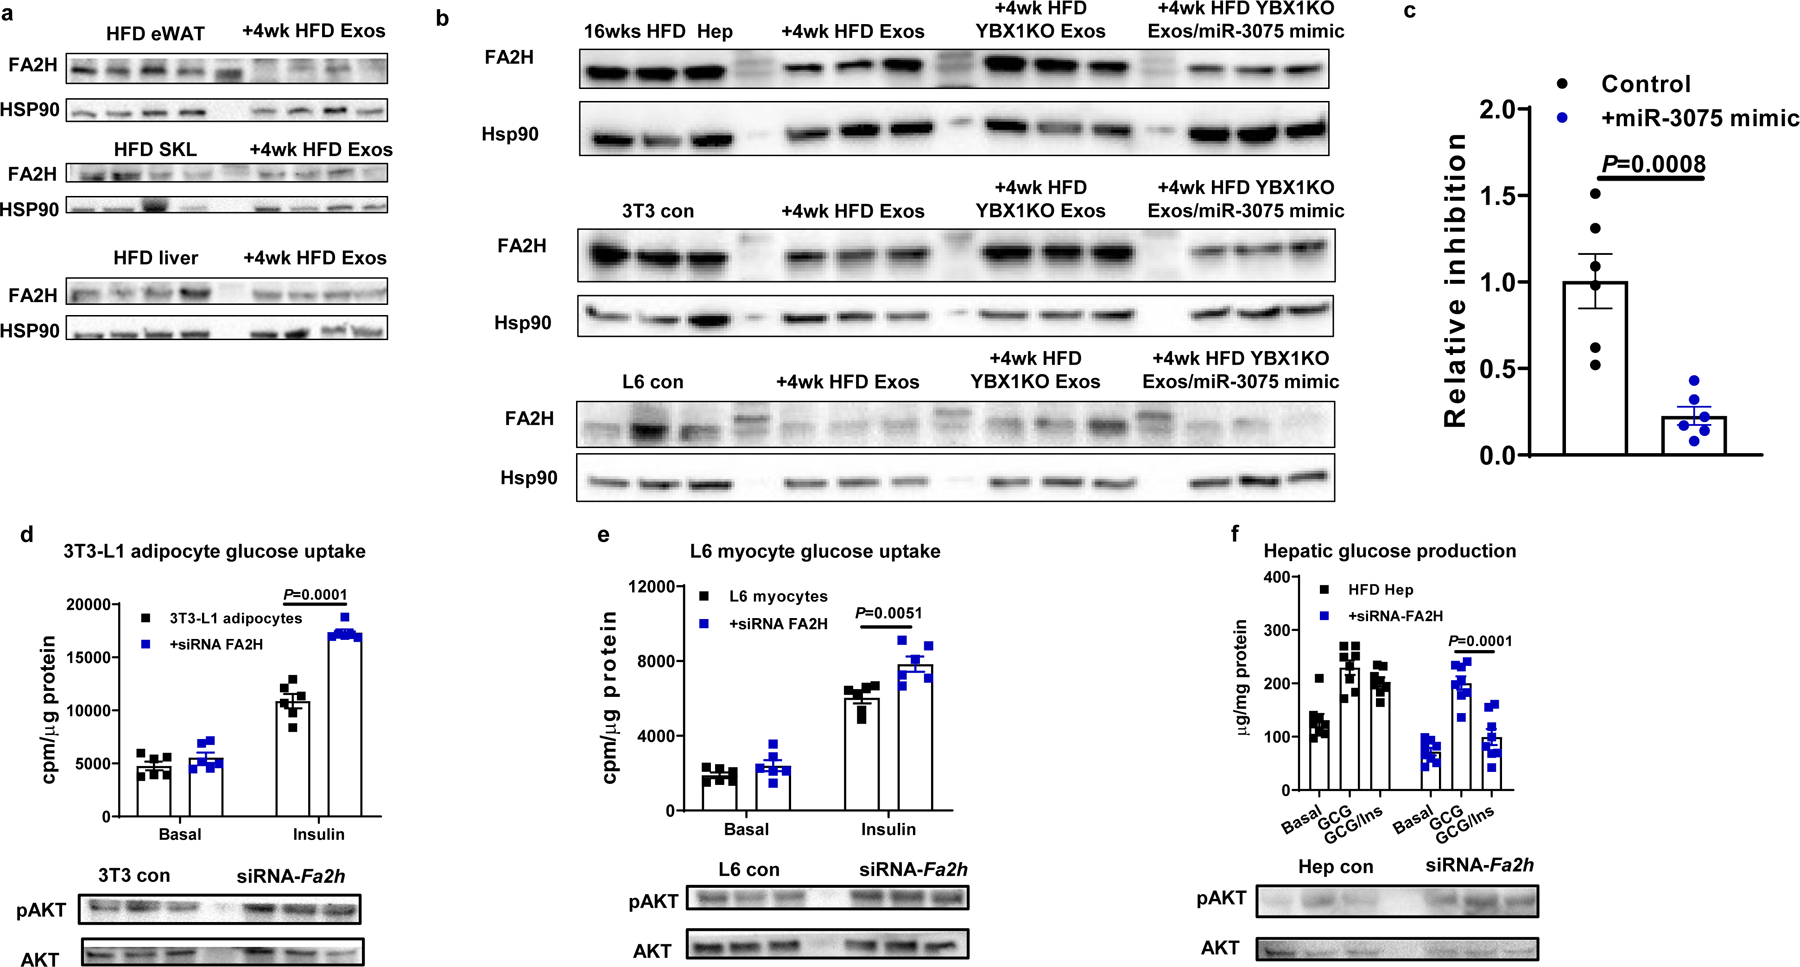
a, FA2H abundance in metabolic tissues of 18wk HFD/obese recipient mice treated with 4wk HFD Exos. b, Effect of 4wk HFD Hep Exos and the miR-3075 mimic on FA2H abundance. c, Luciferase activity in HEK293 cells transfected with an Fa2h 3’UTR reporter vector with or without miR-3075 mimic treatment. Effect of Fa2h knockdown on glucose uptake in 3T3-L1 adipocytes (d) and L6 myocytes (e), hepatocyte glucose output (f), and AKT phosphorylation. All experiments were repeated at least twice with similar results. Data are presented as mean ± SEM. n= 6 (c-e) and n=8 (f) per group. Two-sided Student’s t-test.
To assess the importance of miR-3075-mediated Fa2h suppression on insulin signaling, we utilized a siRNA directed against Fa2h. As demonstrated in Fig. 5d, 5e, and Extended Data Fig. 5e, knockdown (KD) of Fa2h led to increased insulin-stimulated glucose uptake in 3T3-L1 adipocytes and L6 myocytes, and this was accompanied by increased insulin-stimulated AKT phosphorylation, with no effect on basal phosphorylated AKT levels (Extended Data Fig. 5f). Furthermore, KD of Fa2h in insulin-resistant primary hepatocytes obtained from 12wk HFD/obese mice led to normalization of insulin sensitivity compared to control cells transfected with a scrambled siRNA (Fig. 5f and Extended Data Fig. 5e). Overall, these results further suggest that the miR-3075-Fa2h axis contributes to mediation of insulin sensitivity.
Effects of hepatocyte exosomes from chronic HFD mice.
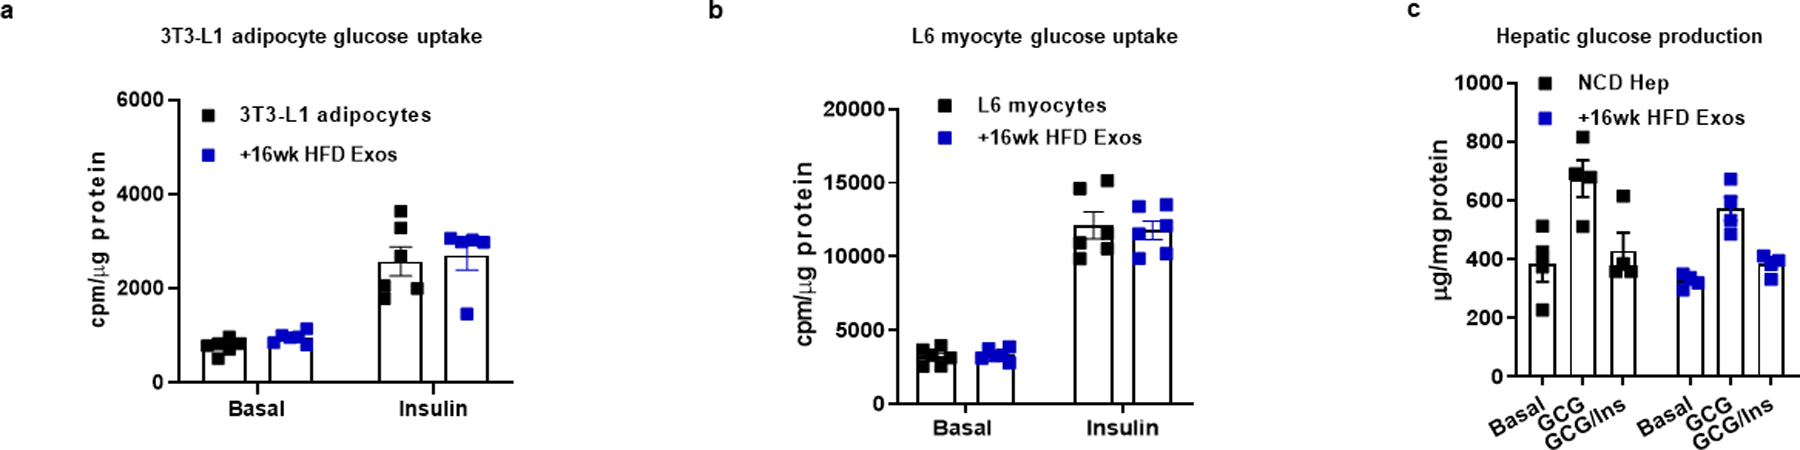
Our miRNA sequencing analysis showed that 16wk HFD feeding induced miRNAs enriched in hepatocyte exosomes, compared to either NCD or 4wk HFD feeding (Fig. 1a). We assessed the effect of these 16wk HFD hepatocyte-derived exosomal miRNAs by studies of hepatocyte-specific knockout of Rab27 or YBX1 mice. Depletion of hepatocyte Rab27 or YBX1 led to markedly improved glucose and insulin tolerance compared to 16wk HFD WT mice injected with a lentiviral control vector (Fig. 6a and 6b). Indeed, this beneficial effect was quite profound, since glucose and insulin tolerance in these hepatocyte exosomal miRNA depleted mice were now intermediate between chow-fed and 4wk HFD mice. In addition, to test the effect of exosomes derived from these mouse models on insulin sensitivity, lean WT mice were intravenously injected with exosomes derived from either 16wk HFD WT or 16wk HFD YBX1KO hepatocytes (1×10⁹ exosomes/mouse). After 5 weeks treatment with 16wk HFD WT hepatocyte exosomes, lean recipient mice displayed decreased glucose tolerance and insulin sensitivity, whereas, miRNA-free 16wk HFD YBX1KO hepatocyte exosomes had negligible effects (Fig. 6c and 6d). In addition, 16wk HFD hepatocyte hepatocyte exosome treatment caused decreased levels of insulin-stimulated AKT phosphorylation in the key metabolic tissues of lean recipient mice, compared to controls (Fig. 6e). Interestingly, we found that 16wk HFD hepatocyte exosomes did not directly affect cellular insulin sensitivity, as evidenced by the lack of an in vitro effect of these exosomes on cellular insulin responses in 3T3-L1 adipocytes, L6 myocytes, and lean primary hepatocytes (Extended Data Fig. 6a–6c).
Fig. 6. Chronic obesity induces hepatocytes to secrete pathogenic exosomal miRNAs that cause tissue inflammation and insulin resistance.
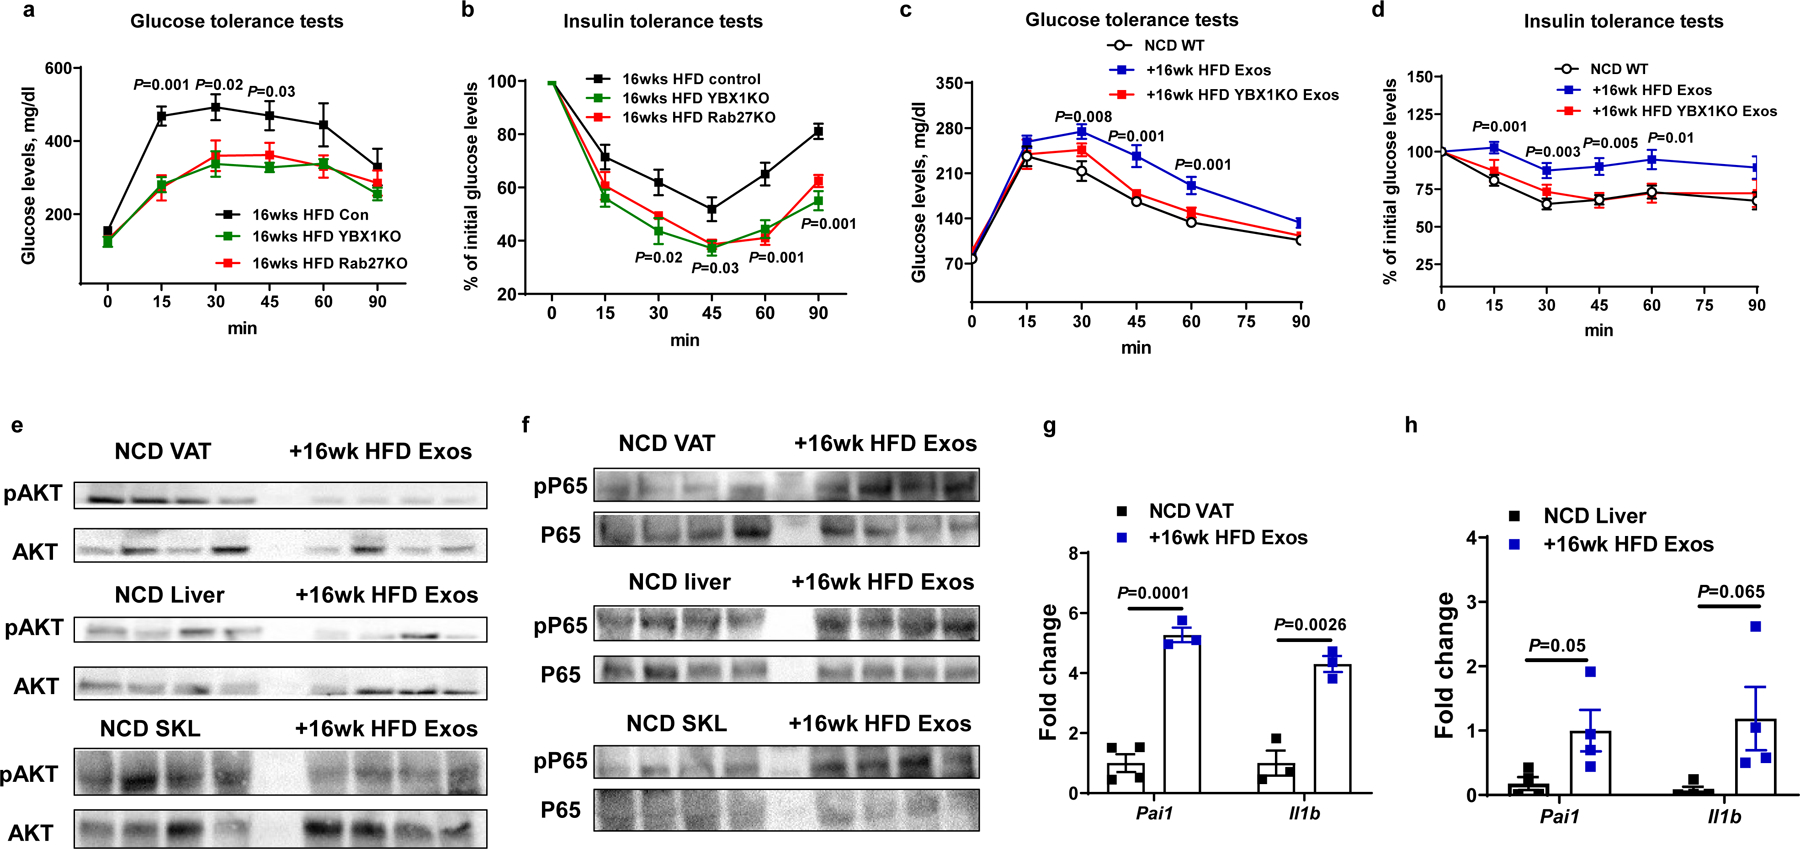
a and b, Glucose tolerance and insulin sensitivity in Rab27 or YBX1 hepatocyte-specific knockout mice after 16wks HFD feeding. Control mice were treated with lentivirus carrying empty vectors. c and d, Glucose tolerance and insulin sensitivity of NCD WT mice after 5 weeks treatment with either 16wk HFD Exos or 16wk HFD YBX1KO Exos. The NCD control mice were treated with empty liposomes. e and f, Effect of 16wk HFD Exos on insulin-stimulated phosphorylation of AKT and activation of the NFκB pathway in NCD recipient mice. g and h, Abundance of proinflammatory genes in eWAT and liver of NCD recipient mice after 5wks treatment with 16wk HFD Exos. All experiments were repeated at least twice with similar results. Data are presented as mean ± SEM. n=6 (a-d) and n=3–4 (g and h) per group. Two-sided Student’s t-test.
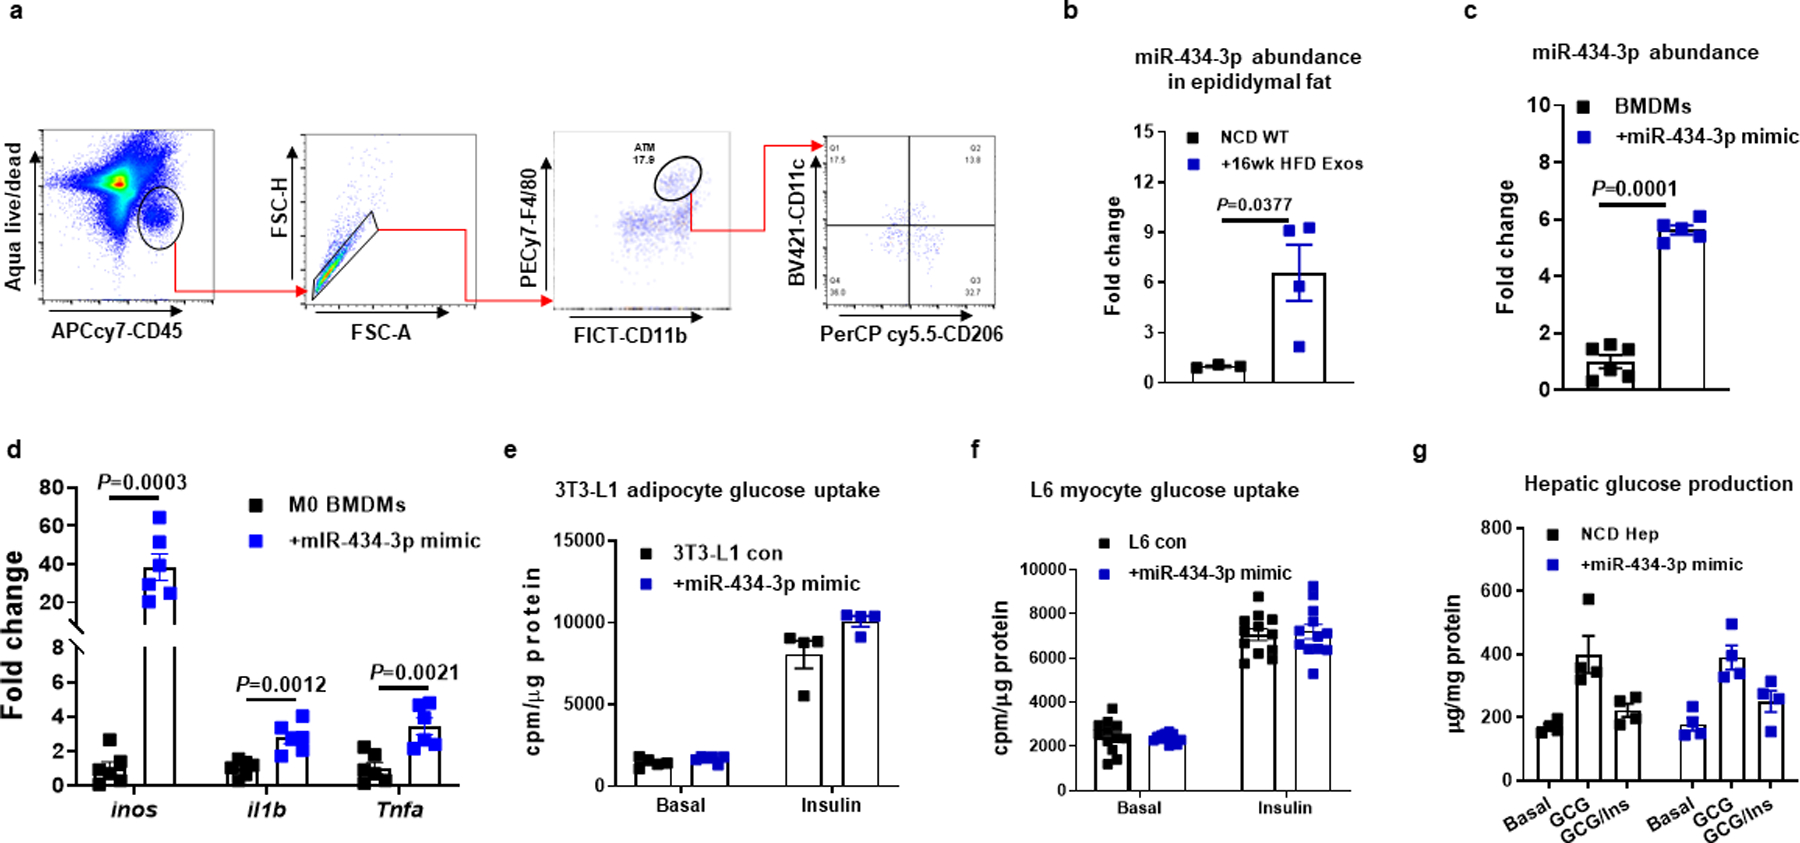
Tissue inflammation is a hallmark of obesity and exacerbates insulin resistance. We observed that 16wk HFD hepatocyte exosome treatment of lean mice led to tissue inflammation, as shown by increased activation of the NFκB pathway and proinflammatory cytokine expression in adipose tissue, liver, and skeletal muscle (Fig. 6f–6h). Flow cytometric analysis showed that 16wk HFD hepatocyte exosome treatment led to greater proinflammatory (CD11c+CD206-F4/80+CD11b+) ATMs accumulation in eWAT, compared to control lean mice treated with empty liposomes (Fig. 7a and Extended Data Fig. 7a). In contrast, in vivo treatment with miRNA-free 16wk HFD YBX1KO hepatocyte exosome treatment did not affect the ATM population or activation state (Fig. 7a). Thus, these results indicate that 16wk HFD exosomal miRNAs can indirectly contribute to insulin resistance by promoting obesity-associated tissue inflammation.
Fig. 7. Hepatocyte-derived Exos from chronic obese mice stimulate the pro-inflammatory M1-like state in macrophages.
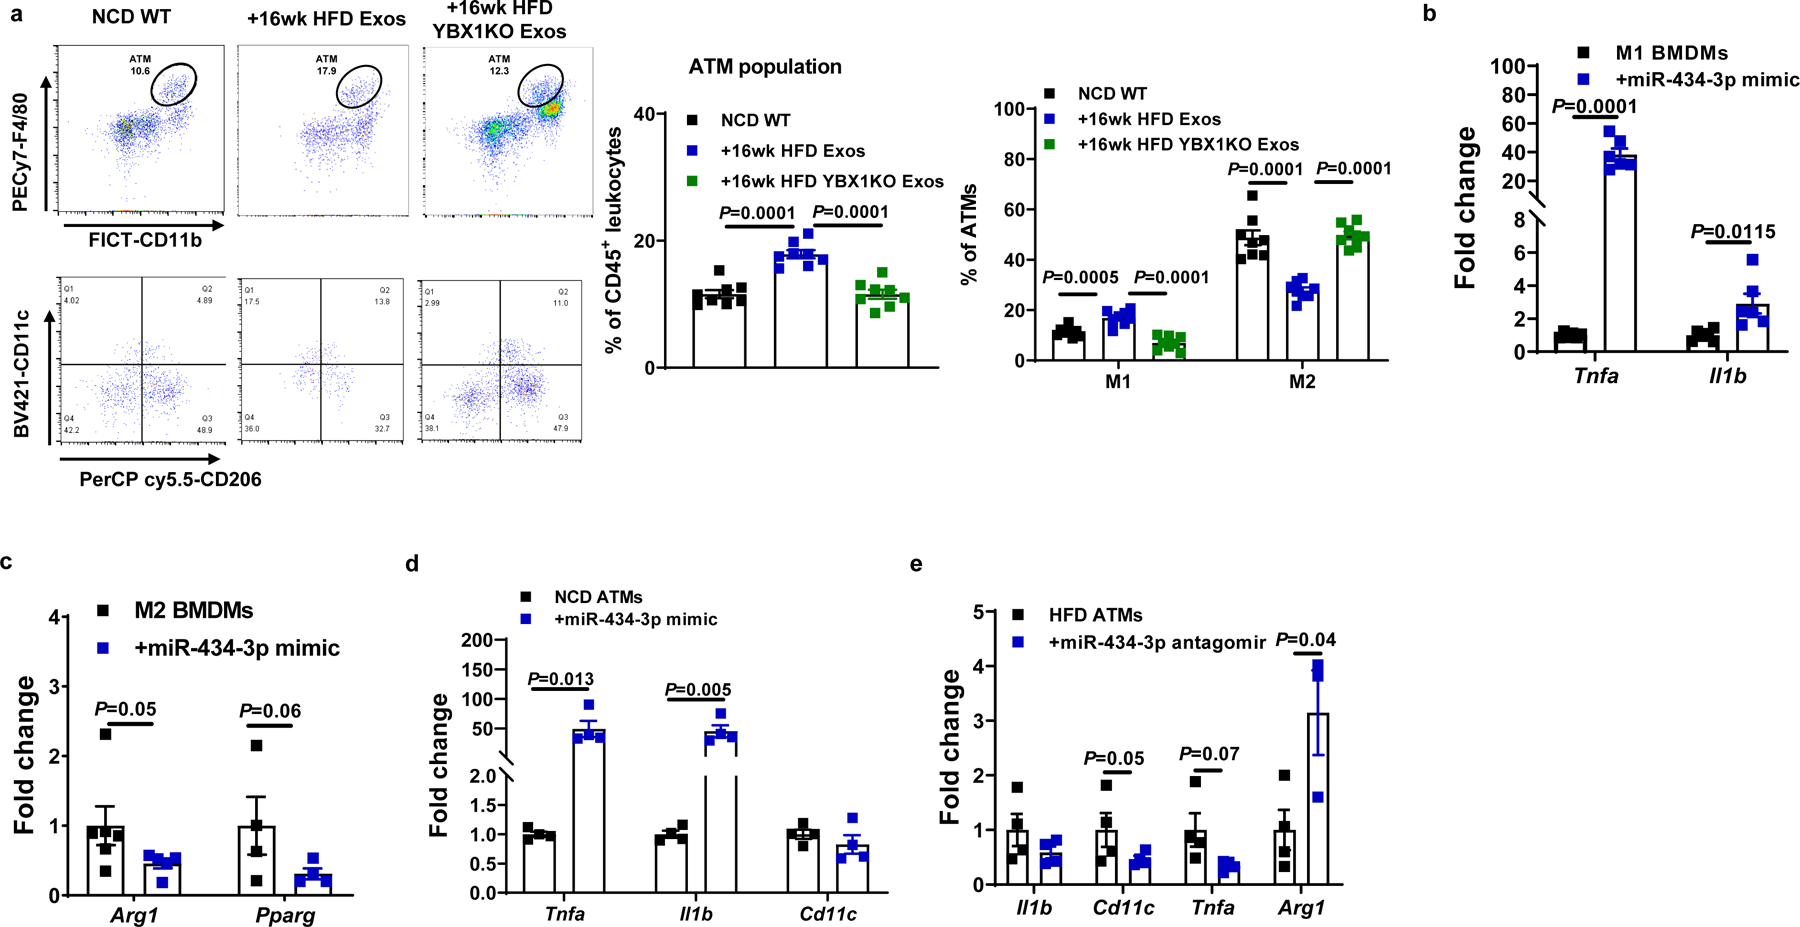
a, Effect of 16wk HFD Exos or 16wk HFD YBX1KO Exos on the population and activation state of adipose tissue macrophages (ATMs) in NCD WT mice. The control mice were treated with empty liposomes. b and c, Activation of BMDMs in response to LPS (M1) or IL4/IL13 (M2) stimulation after transfection with the miR-434-3p mimic. d, Effect of the miR-434-3p mimic on proinflammatory activation of ATMs from lean mice. e, Abundance of key genes associated with activation of HFD/obese ATMs after treatment with the miR-434-3p antagomir. c-d, Control cells were treated with a scramble miRNA mimic; e, A C. elegans miR-67 antagomir was used in the control group. All experiments were repeated at least twice with similar results. Data are presented as mean ± SEM. n=8 (a), n=6 (b and c), n=4 (d and e) per group. Two-sided Student’s t-test.
miR-434-3p promotes macrophage proinflammatory activation.
The exosome miRNA sequencing results (Fig. 1a) showed that miR-434-3p was one of the highly expressed miRNAs in 16wk HFD hepatocyte exosomes. We found that miR-434-3p abundance was increased in the eWAT of NCD mice after 5 weeks treatment with 16wk HFD hepatocyte exosomes (Extended Data Fig. 7b). More importantly, treatment with liposomes containing a miR-434-3p mimic enhanced the proinflammatory phenotype of LPS-stimulated M1 bone marrow-derived macrophages (BMDMs) and repressed the anti-inflammatory activation of IL4/IL13-induced M2 BMDMs (Fig. 7b and 7c, Extended Data Fig. 7c). Treatment of naïve M0 BMDMs with the miR-434-3p mimic also triggered proinflammatory activation (Extended Data Fig. 7d). In addition, transfection of NCD ATMs with the miR-434-3p mimic led to increased expression of proinflammatory cytokines (Fig. 7d). Treatment with a miR-434-3p antagomir attenuated the proinflammatory activation of ATMs isolated from obese mice (Fig. 7e). Consistent with the lack of direct effects of 16wk HFD hepatocyte exosomes on cellular insulin signaling, treatment with liposome containing the miR-434-3p mimic did not affect in vitro cellular insulin responses (Extended Data Fig. 7e–7g).
Discussion
In this study, we have evaluated the effect of hepatocytes on systemic insulin sensitivity during the early development of obesity and after full establishment of the obese condition in HFD-fed mice. In specific, we find that exosomes derived from hepatocytes during the early and late stages of obesity provide divergent signals which regulate the state of systemic insulin sensitivity. Exosomes secreted from hepatocytes during the early stage of obesity (4 wk HFD) directly mediate enhanced insulin sensitivity in adipocytes, skeletal muscle cells (L6 myocytes), and primary hepatocytes. These 4wk HFD hepatocyte exosomes also cause improved glucose tolerance and systemic insulin sensitivity when administered to insulin-resistant 16 wk HFD/obese WT mice. The miRNA cargo of these exosomes is responsible for these effects, and we have identified miR-3075 as a specific insulin-sensitizing miRNA which is highly expressed in 4wk HFD hepatocytes and their secreted exosomes. This could represent a compensatory response to the early stages of caloric excess to protect from the insulin resistance caused by chronic obesity. As a compensatory response, this would imply regulation of exosome secretion and miRNA expression, drawing a further parallel to classical endocrine signaling. After the development of established chronic HFD-induced obesity, hepatocyte exosomes no longer contain high levels of miR-3075 and do not mediate increased insulin sensitivity. In contrast, hepatocyte-derived exosomes from chronically obese mice promote insulin resistance by activating proinflammatory responses in macrophages. Thus, early in the course of obesity, hepatocytes produce insulin-sensitizing exosomes, but when obesity is fully established, this compensatory effect is lost, and hepatocyte exosomes from chronic HFD mice promote insulin resistance.
HFD leads to the gradual development of obesity in mice which typically plateaus at 12–16wk HFD feeding. We have used 4wk HFD fed mice as a model for early onset obesity and 16wk HFD mice as an example of chronic, established obesity. Glucose tolerance and insulin sensitivity are severely compromised in chronically obese mice compared to lean controls, while glucose tolerance and insulin sensitivity at 4wks HFD are intermediate. We hypothesized that there might be some compensatory response in early onset obesity mitigating the full development of insulin resistance and hyperglycemia. Indeed, we found that primary hepatocytes isolated from 4wk HFD mice show normal insulin sensitivity compared to hepatocytes from lean mice, whereas, hepatocytes from 16wk HFD mice are highly insulin resistant. This indicates that in early onset obesity, hepatocytes do not manifest cell-autonomous insulin resistance. We postulated that hepatocyte-derived exosomes could cause biological effects contributing to these metabolic phenotypes. In early onset obesity, the 4wk HFD hepatocyte exosomes have a beneficial effect on insulin sensitivity. This was demonstrated by treating insulin target cells in vitro with these exosome preparations and showing direct effects to enhanced insulin signaling. Furthermore, treatment of chronically obese 16wk HFD animals with hepatocyte exosomes derived from 4wk HFD mice led to improved glucose tolerance with less insulin resistance. These findings suggest that in early onset obesity, hepatocytes secrete exosomes which act to partially maintain insulin sensitivity, consistent with a compensatory response to prevent the severe metabolic dysregulation which eventually appears in the chronically obese mice. It will be of interest to further study the mechanisms responsible for these changes in hepatocyte exosomal miRNA content. A report by Zhao et al. has shown that hepatocyte-derived EVs can modulate adipogenesis in response to lipid overload35. However, in our studies there were no significant effects of hepatocyte exosomes on body weight or fat mass.
Exosomes contain proteins, lipids, miRNAs, as well as other RNA species, but a number of studies have generally shown that the miRNA cargo is necessary for most of the biologic metabolic effects of exosomes5,6. In the current studies, this was shown by generating 2 hepatocyte-specific KO models, each designed to eliminate or greatly reduce loading of endogenous miRNAs into secreted exosomes. We find that hepatocyte-specific KO of Rab27 leads to decreased hepatocyte exosome secretion with a larger decrease in miRNA content. Notably, the Rab27KO led to a 80–90% decrease in hepatocyte EV production and in the remaining 10–20% of these nanoparticles, miRNA content was reduced by ~90%. It is likely that the remaining 10–20% of the “exosomes” are actually other types of small EVs (sEVs), most probably microvesicles, which inevitably contaminate even highly enriched exosome preparations. Notably, the miRNA content of these contaminating sEVs was quite low. The YBX1 KO model showed almost complete depletion of exosomal miRNAs. In both cases, depletion of hepatocyte exosomal miRNAs led to exaggerated glucose intolerance and reduced insulin sensitivity in the KO mice, consistent with the view that hepatocyte exosomal miRNAs in early onset obesity function to partially counteract the adverse metabolic effects of HFD and obesity. Consistent with this, in vitro studies in primary hepatocytes show that insulin sensitivity is normal at 4 weeks HFD, whereas, the hepatocytes become markedly insulin resistant at 16 weeks HFD. Interestingly, while hepatocyte insulin sensitivity remains normal in the 4wk WT HFD mice, the cells become insulin resistant when prepared from 4wk HFD Rab27KO or YBX1KOs. We also show that exosomes prepared from HFD YBX1KO mice have no effect on insulin sensitivity either in vivo or in vitro.
To further explore these miRNA-induced phenotypes, we performed miRNA sequencing on primary hepatocyte-derived exosomes from the different WT mouse cohorts. We find that miR-3075 is highly expressed in 4wk HFD hepatocyte exosomes compared to lean hepatocytes, and that expression of this miRNA returns to normal levels in the 16wk HFD hepatocyte exosomes. When we measured miR-3075 levels in adipose tissue and skeletal muscle in 4 wk HFD hepatocyte-specific Rab27 KO mice, we found that the levels of miR-3075 were not elevated and were comparable to values observed in chow-fed lean mice or chronic HFD obese mice. This indicates that miR-3075 delivered by hepatocyte exosomes to these tissues leads to systemic insulin sensitization. This idea was well supported by in vitro and in vivo studies showing that a miR-3075 mimic is sufficient to enhance insulin sensitivity and glucose tolerance.
To further fortify these concepts, we used an approach to specifically inhibit miR-3075. Thus, miRNA specific antagomirs can be directed against any miRNA and interfere with the ability of the miRNA to bind to its mRNA targets. We used a miR-3075 antagomir and showed that cotreatment of insulin target cells with the antagomir plus the miR-3075 mimic completely blocked the effects of the mimic to enhance insulin sensitivity. Importantly, the antagomir either completely or almost completely blocked the effects of 4wk HFD hepatocyte exosomes to improve insulin signaling, indicating that miR-3075 is the major miRNA within the hepatocyte exosomes causing the increase in insulin sensitivity. Importantly, when we treated 4wk HFD mice in vivo with the antagomir, glucose tolerance deteriorated and insulin sensitivity decreased. This indicates that in the early onset obese situation, endogenous miR-3075 is attenuating insulin resistance by contributing to improved insulin action. In vivo treatment of chow-fed mice with the antagomir was without effect. Most likely, this latter finding is because endogenous levels of miR-3075 are very low in the chow-fed condition and only rise in the early onset obese model and decline back down to low levels in chronic obesity. These results suggest that miR-3075 is either the unique or dominant miRNA within 4wk HFD hepatocyte exosomes causing the beneficial phenotypic effects. Taken together, these studies show that miR-3075 is an insulin-sensitizing miRNA contained in hepatocyte exosomes from 4wks HFD mice.
miRNAs exert their biologic effects by binding through their seed sequence to complementary nucleotides in the 3’ region of target mRNAs leading to translational arrest or degradation17. Using a bioinformatics approach, we identified several theoretical target mRNAs and demonstrated that one of these, FA2H, was highly repressed in adipose tissue, muscle, and liver by in vivo treatment with either the 4wk HFD hepatocyte exosomes or the miR-3075 mimic. This indicates that the mRNA for FA2H is a target for miR-3075, and this was directly demonstrated by showing suppression of a luciferase reporter construct containing the FA2H 3’ UTR. Using a complementary approach to support this conclusion, we depleted FA2H in the 3 main insulin target cell types by treatment with a siRNA directed against FA2H. Suppression of FA2H led to enhanced in vitro insulin signaling, comparable to the effects induced by treatment with 4wk HFD hepatocyte exosomes or the miR-3075 mimic. In terms of mechanisms for the insulin sensitivity produced by FA2H depletion, previous studies have shown that FA2H is an important hydroxylase for ceramide synthesis36,37, and the role of certain ceramide species causing insulin resistance is well known. Furthermore, FA2H is necessary for full de novo lipogenesis, which might be related to decreased hepatocyte insulin sensitivity. However, the exact role of FA2H in obesity-induced insulin resistance, adipogenesis, and hepatic lipogenesis remains to be fully defined. Thus, an important future question will be to understand the mechanisms whereby FA2H downregulation enhances insulin signaling. In aggregate, these results suggest the possibility that use of miR-3075 mimics could have therapeutic value in insulin-resistant states.
In the chronic obese condition, hepatocytes no longer secrete insulin-sensitizing exosomes. Indeed, they now secrete exosomes which promote insulin resistance and glucose intolerance by augmenting the ATM proinflammatory state. Since these 16wk HFD hepatocyte exosomes do not directly impair insulin signaling in vitro, it seems reasonable to conclude that these exosomes promote insulin resistance by directly stimulating the macrophage proinflammatory state. The insulin-sensitizing miR-3075, which is highly expressed in 4wk HFD hepatocyte exosomes, shows a low expression level in 16wk HFD hepatocyte exosomes. In addition, exosomes obtained from chronic obese mice express high levels of miR-434-3p, and our studies show that this miRNA can directly promote macrophage polarization towards the M1-like state both in vitro and in vivo. Deletion of hepatocyte miRNAs in the chronic obese state led to markedly improved glucose tolerance and insulin sensitivity, consistent with the conclusion that these hepatocytes secrete exosomes which promote insulin resistance.
In summary, early in the onset of obesity, hepatocytes secrete exosomes which promote an insulin-sensitive state, presumably as a compensatory response to the caloric excess. These beneficial properties of 4wk HFD hepatocyte exosomes are mediated through increased expression of miR-3075 As obesity progresses to the chronic state, these insulin-sensitizing exosomes are no longer produced and hepatocytes now make exosomes containing miRNAs (e.g., miR-434-3p) which directly promote insulin resistance and glucose intolerance by stimulating proinflammatory polarization of ATMs. Our data raise the possibility that hepatocyte miR-3075 could have substantial insulin sensitizing effects in man, but this remains to be assessed. In addition, it is possible that an antagomir directed against miR-434-3p might also have beneficial effects.
Methods
Mice.
C57BL/6 (B6) mice were fed a high-fat diet (60% fat calories, 20% protein calories, and 20% carbohydrate calories; Research Diets) or a normal chow diet ad libitum. In most assays, the mice were fed with HFD for 12–16 weeks. B6 WT, Albumin-Cre and Rosa26-floxed STOP-Cas9 knockin mice were purchased from the Jackson Laboratory (Supplementary table 1). To generate hepatocyte-specific Cas9 transgenic mice, Rosa26-floxed STOP-Cas9 knockin mice were bred with Albumin-Cre mice. All mice were maintained on a 12/12-hour light-dark cycle. To generate hepatocyte-specific knockout of YBX1 or Rab27, hepatocyte-specific Cas9 transgenic mice were intravenously injected with lentivirus carrying gRNA-YBX1 or Rab27 (1×10⁸ particles/mouse)38–40. Hepatocyte-specific Cas9 transgenic mice treated with lentivirus carrying empty vectors were used as controls. All mice used in this study were male and maintained on at 22°C in a 12/12-hour light-dark cycle in a specific pathogen-free facility and given free access to food and water. All animal procedures were done in accordance with University of California, San Diego Research Guidelines for the Care and Use of Laboratory Animals and all animals were randomly assigned to cohorts when used.
Differentiation of adipocytes41.
3T3-L1 cells were differentiated in DMEM/F12 medium containing 4.5 g/L glucose, 10% FBS, penicillin-streptomycin, and glutamine and a differentiation cocktail consisting of 1 μM dexamethasone, 0.2 mM indomethacin, 0.5 mM 3-isobutyl-1-methylxanthine, 10 μg/mL insulin, and 1 μM rosiglitazone for 7 days.
Isolation of primary hepatocytes.
The method for isolation of primary hepatocytes is described previously12,42. Mice were infused via the vena cava with a calcium-free HEPES-phosphate buffer A (Calcium and magnesium-free PBS containing 10 mM HEPES, 1 mM glucose, 0.2 μM EGTA, and 0.2% BSA, pH 7.4) for 3–5 min. After the liver color became beige or light brown, the perfusion media was changed to collagenase-containing buffer B (PBS with 1 mM magnesium and 1 mM calcium, 0.2% BSA, and 30 mM HEPES, 0.5mg/ml collagenase D) (Supplementary table 1). After the liver surface showed signs of cracking, perfusion was stopped and the liver was excised into ice-cold buffer A. Cells from the digested livers were then suspended in Buffer A, filtered through 100 μm cell strainer, and centrifuged at 60 × g for 6 min at 4°C. The pellet was twice washed with Buffer B (no collagenase) and then combined with Percoll to a final concentration of 36% and centrifuged at 100 × g for 10 min, 4°C. The supernatant was then removed and the hepatocyte pellet was washed once with Buffer B and cultured in Williams Medium E containing 10% FBS on collagen-coated plates and antibiotics. The culture medium was refreshed after overnight incubation.
Glucose tolerance and insulin tolerance tests.
Glucose tolerance tests were performed by injecting mice i.p. with dextrose (1 g/kg body weight) after 16 hr of fasting. After fasting mice for 6 hr, insulin tolerance tests were performed by i.p. injection with insulin (0.35 or 0.175 units/kg body weight for HFD or NCD mice, respectively).
Hyperinsulinemic-euglycemic clamp studies42.
Hyperinsulinemic-euglycemic clamp studies were conducted after surgically implanting jugular vein cannula. Three to five days later, 6-hour fasted mice were infused for 90 min with D-[3–3H] glucose (Perkin Elmer). Blood sampling was performed after tracer equilibration and then glucose (50% dextrose) and tracer (5 μCi/h) plus insulin (8 mU/kg/min) were infused. Blood samples were collected at 10 min intervals. Steady-state conditions (120 mg/dl ± 10 mg/dl) were determined at the end of the clamp procedure with maintenance of the glucose infusion and plasma glucose concentration for a minimum of 20 min. At time point = −10, 0 (basal), 110, and 120 (end of experiment) min blood samples were collected to measure glucose-specific activity, as well as free fatty acid and insulin concentrations. Tracer-determined rates were quantified by using the Steele equation for steady-state conditions. The rate of glucose disappearance (GDR) is equal to the sum of the rate of endogenous glucose productions (HGP) plus the exogenous GIR. IS-GDR is equal to the total GDR minus the basal glucose turnover rate.
In vivo insulin-stimulated AKT phosphorylation.
Measurement of tissue insulin action was conducted by measuring insulin-stimulated AKT phosphorylation in liver, skeletal muscle, and epididymal white adipose (eWAT). Following 16 hours fasting, mice were anesthetized and parts of these tissues were collected for measurement of basal AKT phosphorylation. After insulin injection (0.35 or 0.175 U/kg body weight for HFD or NCD mice, respectively), liver, skeletal muscle, and eWAT were collected at 3 min, 7 min, and 10 min, respectively. Phosphorylation (Ser473) of AKT and Pan-AKT abundance were measured using Western Blots analysis.
Exosome purification and characterization.
Primary hepatocyte culture medium was used to prepare exosomes as previously described12. After 24 hours culture, debris and dead cells were removed by centrifugation at 1,000 × g for 10 min followed by filtration through a 0.2 μm filter. The resulting medium was subjected to ultracentrifugation at 100,000 × g for 4 hours at 4°C. After washing with PBS (100,000 × g for 20 min), the pellet containing the exosomes were resuspended in 1 ml PBS and passed through a 0.2 μm filter to remove large particles. Vesicle particle size and concentration were assessed using NanoSight analysis (Malvern Instruments). To monitor trafficking, exosomes were labeled with PKH26 fluorescent dye using the PKH26 fluorescent cell linker kit (Sigma-Aldrich). Following PKH26 labeling, the exosomes were washed with PBS and collected by ultracentrifugation (100,000 × g for 2 hours) at 4°C. The final PKH26 labeled exosomes were resuspended in PBS.
In vivo exosome trafficking assays.
PKH26-labeled hepatocyte exosomes (1×10⁹ exosomes per mouse) were injected to into the tail vein of HFD recipient mice. 16 hours later, pieces of liver, skeletal muscle, and eWAT were collected to detect the appearance of PKH26 red fluorescence.
In vivo and in vitro exosome treatment.
For in vitro assays, 1×10⁸ exosomes as determined by NanoSight analysis were added to 0.5×10⁶ cells for 36 hours. For in vivo treatment, 5×10⁹ exosomes were injected intravenously into recipient mice twice per week. Empty liposomes (Cat. No. F70101-NH, FormuMax) were used in the control groups for in vitro and in vivo experiments.
Differentiation of bone marrow-derived macrophages.
Bone marrow-derived macrophages (BMDMs) were prepared by the method previously described43. BMDMs were induced with IL4 (20 ng/mL) and IL13 (10 ng/mL) or lipopolysaccharide (LPS, 100 ng/mL) for 24 hours to induce M2 or M1 polarization, respectively.
miRNA mimic or antagomir transfection and in vivo treatment.
The miRNA mimic or antagomir was transfected into recipient cells with lipofectamine RNAiMAX (Supplementary table 1). The same amount of the miRNA mimic negative control (Cat. No. 4464058, ThermoFisher Scientific) or the miRNA antagomir negative control (Cat. No. IN-002005-01-05, Horizon) was transfected into control cells. For the antagomir control, a C. elegans miR-67 antagomir which has no effects in mammalian species was used. 24 hours after transfection, efficiency was validated by qPCR analysis. For the in vivo treatment, the miR-3075 antagomir was incorporated with Invivofectamine and then given via tail vein injection to either HFD-fed (starting at 1 week HFD feeding) or NCD recipient WT mice (10 nmol mimic per mouse, twice per week). Control mice were injected with the miRNA antagomir negative control/Invivofectamine.
siRNA transfection.
Recipient cells were treated with siRNA-Fa2h (Cat. No. J-057497-09-0005, Horizon; 20 pmol siRNA/0.1 × 106 cells) using the lipofectamine RNAiMAX reagent. Control cells were treated with a non-targeting control siRNA (Cat. No. D-001810-01-05, Horizon). The siRNAs were mixed with RNAiMAX reagent and then incubated 15 mins at room temperature. This mixture was then added to the cell media. Knockdown efficiency of the Fa2h siRNA was assessed by Western blot analysis.
Immunofluorescence staining.
Liver, skeletal muscle and eWAT from HFD mice were snap frozen in Optimum Cutting Temperature (O.C.T., Fisher Healthcare) with dry ice. Six μm cryo-sections of the tissues were cut and fixed with pre-cooled acetone for 20 min. Immunostaining was performed as previously described13. Slides were blocked with 5% normal donkey serum for 60 min at room temperature. After washing, nuclei were stained for 10 mins with DAPI (4’,6-Diamidino-2-28 phenylindole dihydrochloride) at room temperature. Mounting media and cover slips were then added to the slides for imaging. Images were acquired on a Keyence Fluorescent Microscope and were analyzed with ImageJ (NIH, Bethesda, MD).
Gene expression analysis.
Total RNA was extracted from tissues using an RNA extraction protocol according to the manufacturer’s instructions (Zymo Research). cDNA was synthesized using SuperScript III and random hexamers. qPCR was carried out using 10 μl reaction using iTaq SYBR Green supermix on a StepOnePlus Real-Time PCR Systems (ThermoFisher Scientific). cDNA was synthesized for miRNA quantitative reverse transcriptase-polymerase chain reaction (RT-PCR) using a TaqMan™ microRNA reverse transcription kit and miRNA primers (5x) (Supplementary table 1). qPCR was performed using TaqMan™ universal master mix II and miRNA primers (20x) in 10 μl reactions using a StepOnePlus Real-Time PCR System (ThermoFisher Scientific). The data are presented as the mean of 2−ΔΔCt from at least three independent experiments and normalized to β-actin or U6.
Glucose uptake assay44.
12 hr after serum starvation, cells were treated with 100 nM insulin for 30 min in KRH buffer (137 nM NaCl, 4.8 mM KCl, 1.2 mM KH2PO4, 1.2 mM MgSO4, 2.5 mM CaCl2, 0.2% BSA, 16 mM HEPES) at 37°C. 3H-2-deoxy-D-glucose (3H-2-DOG, 0.1 mM, 0.4 μCi/ml) was then added to cells. After 10 min incubation, cells were washed twice with ice-cold PBS. NaOH (1 N) was then added for 20 min to efficiently dissolve cells. An aliquot was used for measurement of protein concentration. After neutralizing NaOH by addition of HCl (1 N), the extracts were placed in scintillation vials, scintillation fluid was added and the radioactivity was counted. Results were normalized to protein concentration of the cell lysates.
Glucose output assay44.
12 hr after serum starvation, primary hepatocytes were washed two times and then exposed to glucose-free buffer (4 mM KCl, 125 mM NaCl, 0.85 mM KH2PO4, 10 mM HEPES, 1.25 mM Na2HPO4, and 15 mM NaHCO3, 1 mM CaCl2) containing glucagon (200 ng/ml), insulin (10 nM), or a combination of glucagon and insulin at 37°C for 4 hours. Glucose production was determined by measuring glucose in the media. Primary hepatocytes attached to the culture plate were dissolved by adding NaOH (1 N) and protein content was determined. Glucose concentration results were normalized to the cell lysate protein.
Western blot analysis.
Tissues or cells were homogenized in RIPA buffer that was supplemented with protease and phosphatase inhibitors. Equal amounts of cell lysate protein (30 μg protein per lane for pAKT detection) from each biological replicate were analyzed by western blotting. Using a ChemiDoc XRS imaging system (BioRad), protein bands on the blots were detected with the SuperSignal West Pico Chemiluminescent Substrate. Protein bands were analyzed using Image Lab software (BioRad). The Western blot data shown in the figures are all representative of more than three independent experiments. All antibody information is presented in Supplementary table 1. Uncropped western blot scans labeled with molecular weight markers were presented in the Source Data files.
Small RNA deep sequencing.
Total RNA was isolated from lean (n=4), 4wks HFD (n=4), or 16wks HFD (n=4) hepatocyte-derived Exos using the Zymo Quick-RNA MiniPrep kit. RNA purity was assessed with an Agilent 2100 Bioanalyzer. Sequencing libraries were prepared using the Illumina TruSeq Small RNA protocol with minor modifications following the manufacturer’s instructions, including 12 cycles of PCR amplification after ligation of the 3′ and 5′ adapters. Samples were then ligated to unique adaptors and subjected to PCR amplification. Libraries were validated using an Agilent 2100 Bioanalyzer, normalized, and pooled for sequencing. RNA-seq libraries prepared using four biological replicates for each group were sequenced on an Illumina HiSeq 2500 using barcoded multiplexing. The miRNA-seq data have been deposited in the NCBI Gene Expression Omnibus under accession number GSE164310.
miR-3075 target gene prediction and validation.
miR-3075 target gene prediction was conducted with TargetScan Mouse 7.2 (www.targetscan.org)34,45. To validate that Fa2h is a genuine target gene of miR-3075, a luciferase reporter assay was carried out with the 3’ UTR of Fa2h containing potential miR-3075 binding sites inserted upstream from the Renilla luciferase gene. The reporter constructs were co-transfected with the miR-3075 mimic or negative mimic control into HEK293 cells. After 24 hours co-transfection, the activity of Renilla luciferase was measured with the Dual-Glo luciferase reporter system.
Quantification and statistical analysis.
Samples were blinded whenever deemed appropriate and applicable. Sample description and identification was not available to the core lab personnel during data plotting and analyses. No samples or data were excluded from the study for statistical purposes. Each in vitro experiment was independently performed in duplicate or triplicate to ensure reproducibility. Group sizes of 5 mice or greater were sufficient to reach statistical power of at least 80%. Animals were assigned at random to treatment groups for all studies. The tests used for statistical analyses are described in the figure legends. All sample numbers are given in the figure legends. To determine whether the means of two groups are statistically different from each other, unpaired two-tailed Student’s t-tests were used for statistical analyses. All data passed the normality test using Prism8 software (GraphPad software v8.0; Prism, La Jolla, CA). P values of 0.05 or less were considered statistically significant, and exact P values are provided in the figures. For the glucose and insulin tolerance tests, statistical comparisons between every two groups at each time point were performed with the unpaired two-tailed Student’s t-test.
Extended Data
Extended Data Fig. 1. Hepatocyte exosomes from early stage obese mice improve cellular insulin sensitivity.
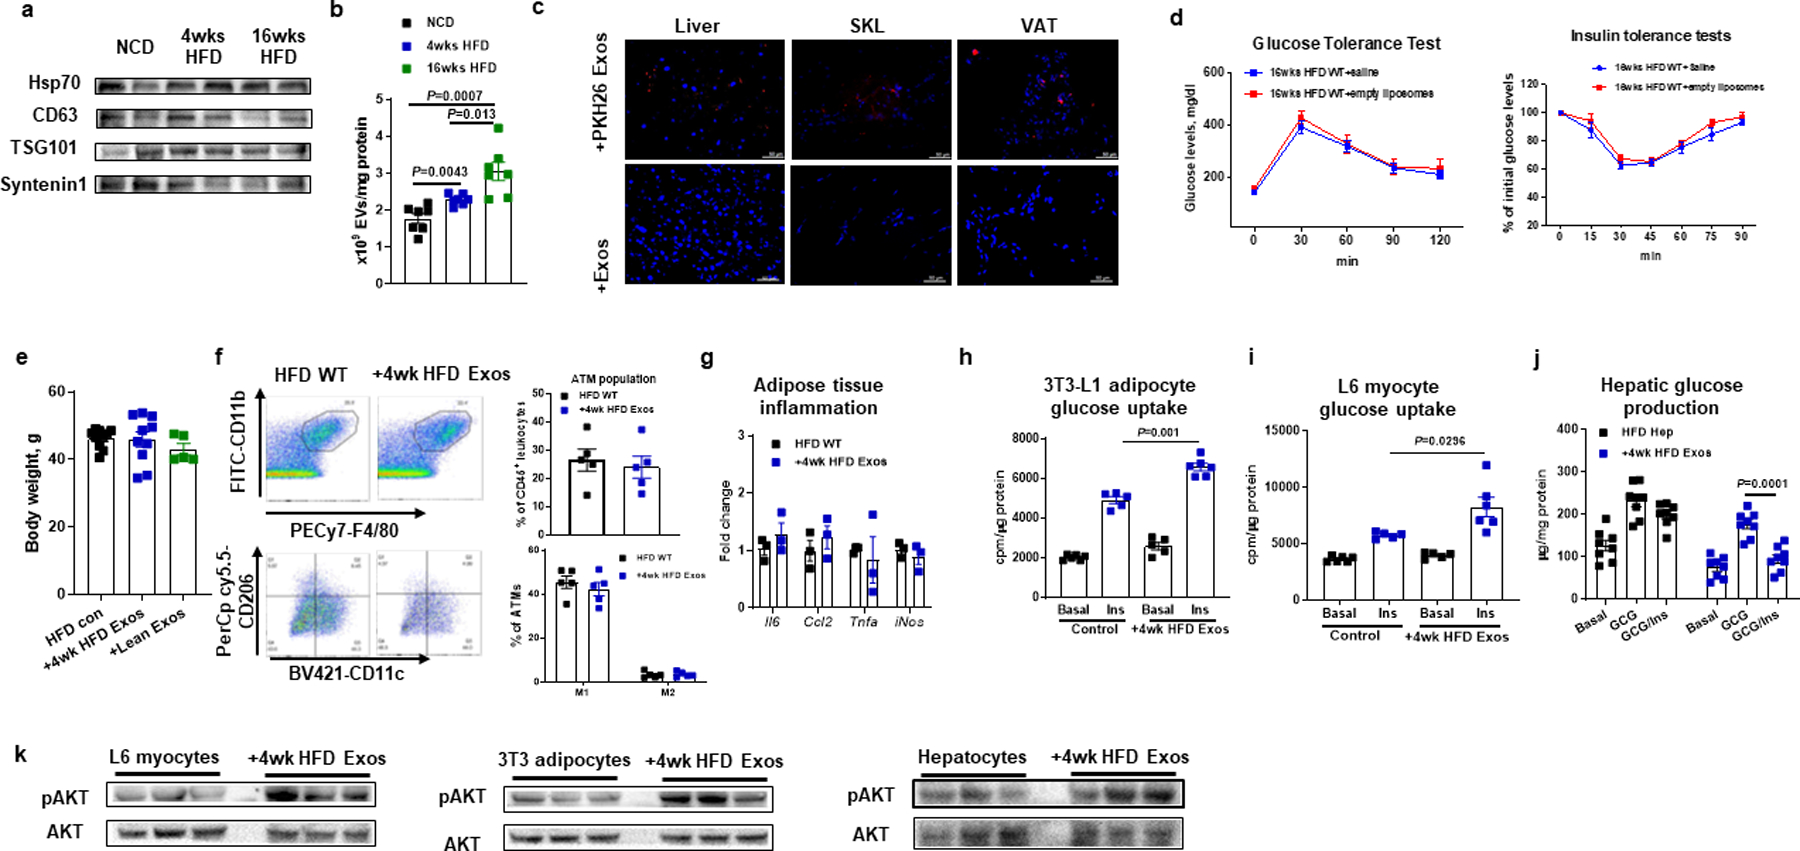
The marker characteristics (a) and production (b) of exosomes (Exos) derived from lean, 4wk or 16wk HFD WT hepatocytes. c, The appearance of red fluorescence in key metabolic tissues of 12wk HFD WT mice after tail vein injection with PKH26-labeled 4wk HFD hepatocyte Exos. 4wk HFD hepatocyte Exos without PKH26 labeling were injected to evaluate the level of autofluorescence. d, Effect of empty liposome treatment on metabolic phenotypes of 16wks HFD/obese WT mice. e, Effect of hepatocyte Exos treatment on body weight. f, the population and activation status of adipose tissue macrophages by flow cytometry analysis. Adipose tissue macrophages (ATM)=CD11b+F4/80+, M1 ATM=CD11c+CD206−, and M2 ATM=CD11c−CD206+. g, Effect of 4wk HFD Exos on proinflammatory cytokine abundance in epididymal fat of 18wk HFD mice by qPCR analysis. Effects of 4wk HFD Exos on glucose uptake of 3T3-L1 adipocytes (h), L6 myocytes (i), and glucose production of 12wk HFD/obese hepatocytes (j). k, The levels of insulin-stimulated AKT phosphorylation in 3T3-L1 adipocytes, L6 myocytes, and obese hepatocytes. e-k, empty liposomes were used in the control groups. All experiments were repeated at least twice with similar results. Data are presented as mean ± SEM. n=7 (b), n=6 (d), n=5–10 (e), n=5 (f, h), n=3 (g), n=6 (i), n=8 (j) per group. Two-sided Student’s t-test.
Extended Data Fig. 2. Effect of hepatocyte-specific YBX1 knockout on the ability of hepatocyte Exos to regulate metabolic responses.
a, Hepatocyte YBX1 levels in the hepatocyte-specific Cas9 transgenic mice after 4 weeks of injection of lentivirus harboring gRNA-YBX1 vectors. Control mice were treated with a lentiviral empty vector. b, Expression of TSG101 and CD63 in Exos derived from both 4wk HFD WT and YBX1KO hepatocytes. c, Body weight of both WT and YBX1KO mice after 4 weeks HFD feeding. d, Effect of hepatocyte Exos on body weight of 18wks HFD/obese recipient mice. Empty liposomes were used in the control HFD WT mice. e, Effect of 4wk HFD WT Exos or YBX1KO Exos on cellular phosphorylated AKT levels. Control cells were treated with empty liposomes. All experiments were repeated at least twice with similar results. Data are presented as mean ± SEM. n=8 (c and d) per group.
Extended Data Fig. 3. Effect of hepatocyte-specific Rab27 knockout on metabolic phenotypes.
a, Hepatocyte Rab27 levels in the hepatocyte-specific Cas9 transgenic mice after 4 weeks of injection of lentivirus harboring gRNA Rab27 vectors. Control mice were treated with a lentiviral empty vector. b, Effect of 4wk HFD Rab27KO hepatocyte Exos on glucose production in 16wk HFD/obese primary hepatocytes. Empty liposomes were used in the control cells. c, Body weight of both WT and hepatocyte-specific Rab27KO mice after 4 weeks HFD feeding. d, Hepatic glucose production after Rab27 knockout. All experiments were repeated at least twice with similar results. Data are presented as mean ± SEM. n=4 (b), n=6 (c), n=8 (d) per group. Two-sided Student’s t-test.
Extended Data Fig. 4. Effect of miR-3075 on insulin sensitivity.
miR-3075 abundance in liver (a), skeletal muscle (SKL, b), and eWAT (c) of 18wk HFD WT recipient mice after treatment with 4wk HFD Exos. qPCR analysis of miR-3075 abundance (d), hepatic glucose production (e), and insulin-stimulated AKT phosphorylation (f) in lean, 4wk or 16wk HFD WT hepatocytes. g, Effect of the miR-3075 antagomir on AKT phosphorylation level in 4wk HFD hepatocytes. h, miR-3075 abundance in key metabolic tissues of lean WT mice, 3T3-L1 adipocytes, and L6 myocytes. i, Effect of 4wk HFD Exos, 4wk HFD YBX1KO Exos, or combination treatment with 4wk HFD YBX1KO plus miR-3075 mimic on cellular insulin responses. j, Glucose tolerance of NCD, 4wk HFD, and 16wk HFD WT mice. k, qPCR analysis of miR-3075 abundance within Exos derived from lean hepatocytes transfected with the miR-3075 mimic. l, Effect of miR-3075-enriched hepatocyte (miR-3075oe) Exos on 3T3-L1 adipocyte glucose uptake. m, The levels of phosphorylated AKT in metabolic tissues of 4wks HFD WT mice after treatment with the miR-3075 antagomir. Effects of miR-3075 antagomir on glucose tolerance (n) and insulin sensitivity (o) of lean WT mice. n=4 (a-c, h, k), n=6–8 (d), n=8 (e), n=6 (i), n=8 (j, l), n=5–6 (n and o) per group. All experiments were repeated at least twice with similar results. Data are presented as mean ± SEM. Two-sided Student’s t-test.
Extended Data Fig. 5. miR-3075 represses FA2H expression.
a, qPCR analysis of possible target genes of miR-3075. b, FA2H abundance after transfection with the miR-3075 mimic. c, The expression of miR-3075 in human HepG2 cells. d, Effect of miR-3075 overexpression on FA2H abundance in human HepG2 cells. e, Validation of FA2H knockdown in 3T3-L1 adipocytes, L6 myocytes, and obese hepatocytes. f, Effect of Fa2h knockdown on AKT phosphorylation in the cells without insulin stimulation. b and c, The control cells were transfected with a scramble miRNA mimic. e and f, non-targeting control siRNA was used in the control cells. All experiments were repeated at least twice with similar results. Data are presented as mean ± SEM. n=5–6 (a, c) per group. Two-sided Student’s t-test.
Extended Data Fig. 6. 16wk HFD Exos treatment did not affect cellular insulin sensitivity.
a-c, Effect of 16wk HFD Exos on cellular insulin responses. Empty liposomes were used in the control groups. All experiments were repeated at least twice with similar results. Data are presented as mean ± SEM. n=5–6 (a), n=6 (b), n=4 (c) per group.
Extended Data Fig. 7. Effect of miR-434-3p on macrophage activation.
a, Gating strategy of flow cytometry analysis of adipose tissue macrophages. F4/80+CD11b+ ATMs were gated from viable CD45+ cells, and M1 (CD11c+CD206−) and M2 (CD11c−CD206+) cells were then gated from F4/80+CD11b+ ATMs. b, miR-434-3p abundance in epididymal fat of NCD recipient mice after treatment of 16wk HFD Exos for 5 weeks. c, qPCR analysis of miR-434-3p abundance in BMDMs after transfection with the miR-434-3p mimic. d, Effect of miR-434-3p overexpression on proinflammatory activation in naïve M0 BMDMs. e-g, Effect of miR-434-3p on glucose uptake in 3T3-L1 adipocytes and L6 myocytes and primary hepatocyte glucose production. c-g, A scramble miRNA mimic was used in control cells. All experiments were repeated at least twice with similar results. Data are presented as mean ± SEM. n=4 (a, e, g), n=5–6 (c), n=6–7 (d), n=12 (f) per group. Two-sided Student’s t-test.
Supplementary Material
Acknowledgements
We thank the UCSD IGM Genomics Center for RNA sequencing, the UCSD electron microscopy core for electron microscopic analysis, and the Vector Development Core Laboratory for lentivirus preparation. This study was funded by the U.S. National Institute of Diabetes and Digestive and Kidney Diseases (P30 DK063491, R00DK115998, and R01DK125560 to W.Y.) and the U.S. National Institute of Diabetes and Digestive and Kidney Diseases (P30 DK063491 and DK101395 to J.M.O.).
Footnotes
Competing interests statement
W.Y. and J.M.O. are co-inventors on a provisional patent covering the use of miR-3075 as an insulin sensitizer. Outside of this, there are no competing interests for any of the authors.
Data Availability
The datasets generated in current study are available from the corresponding authors upon reasonable request. There are no restrictions on data availability. All mouse lines in this study are available from the Jackson Laboratory. The miRNA-seq data have been deposited in the NCBI Gene Expression Omnibus under accession number GSE164310. Source data are provided with this paper.
References
- 1.Kahn SE, Hull RL & Utzschneider KM Mechanisms linking obesity to insulin resistance and type 2 diabetes. Nature 444, 840–846, doi: 10.1038/nature05482 (2006). [DOI] [PubMed] [Google Scholar]
- 2.Lee YS, Wollam J & Olefsky JM An Integrated View of Immunometabolism. Cell 172, 22–40, doi: 10.1016/j.cell.2017.12.025 (2018). [DOI] [PMC free article] [PubMed] [Google Scholar]
- 3.Roden M & Shulman GI The integrative biology of type 2 diabetes. Nature 576, 51–60, doi: 10.1038/s41586-019-1797-8 (2019). [DOI] [PubMed] [Google Scholar]
- 4.Romeo GR, Lee J & Shoelson SE Metabolic syndrome, insulin resistance, and roles of inflammation--mechanisms and therapeutic targets. Arteriosclerosis, thrombosis, and vascular biology 32, 1771–1776, doi: 10.1161/ATVBAHA.111.241869 (2012). [DOI] [PMC free article] [PubMed] [Google Scholar]
- 5.Mathieu M, Martin-Jaular L, Lavieu G & Thery C Specificities of secretion and uptake of exosomes and other extracellular vesicles for cell-to-cell communication. Nat Cell Biol 21, 9–17, doi: 10.1038/s41556-018-0250-9 (2019). [DOI] [PubMed] [Google Scholar]
- 6.Mori MA, Ludwig RG, Garcia-Martin R, Brandao BB & Kahn CR Extracellular miRNAs: From Biomarkers to Mediators of Physiology and Disease. Cell Metab, doi: 10.1016/j.cmet.2019.07.011 (2019). [DOI] [PMC free article] [PubMed] [Google Scholar]
- 7.Kalluri R & LeBleu VS The biology, function, and biomedical applications of exosomes. Science 367, doi: 10.1126/science.aau6977 (2020). [DOI] [PMC free article] [PubMed] [Google Scholar]
- 8.Castano C, Kalko S, Novials A & Parrizas M Obesity-associated exosomal miRNAs modulate glucose and lipid metabolism in mice. Proc Natl Acad Sci U S A 115, 12158–12163, doi: 10.1073/pnas.1808855115 (2018). [DOI] [PMC free article] [PubMed] [Google Scholar]
- 9.Deng ZB et al. Adipose tissue exosome-like vesicles mediate activation of macrophage-induced insulin resistance. Diabetes 58, 2498–2505, doi: 10.2337/db09-0216 (2009). [DOI] [PMC free article] [PubMed] [Google Scholar]
- 10.Ferrante SC et al. Adipocyte-derived exosomal miRNAs: a novel mechanism for obesity-related disease. Pediatr Res 77, 447–454, doi: 10.1038/pr.2014.202 (2015). [DOI] [PMC free article] [PubMed] [Google Scholar]
- 11.Flaherty SE 3rd et al. A lipase-independent pathway of lipid release and immune modulation by adipocytes. Science 363, 989–993, doi: 10.1126/science.aaw2586 (2019). [DOI] [PMC free article] [PubMed] [Google Scholar]
- 12.Ying W et al. Adipose Tissue Macrophage-Derived Exosomal miRNAs Can Modulate In Vivo and In Vitro Insulin Sensitivity. Cell 171, 372–384 e312, doi: 10.1016/j.cell.2017.08.035 (2017). [DOI] [PubMed] [Google Scholar]
- 13.Ying W et al. MiR-690, an exosomal-derived miRNA from M2-polarized macrophages, improves insulin sensitivity in obese mice. Cell Metab, doi: 10.1016/j.cmet.2020.12.019 (2021). [DOI] [PMC free article] [PubMed] [Google Scholar]
- 14.Crewe C et al. An Endothelial-to-Adipocyte Extracellular Vesicle Axis Governed by Metabolic State. Cell 175, 695–708 e613, doi: 10.1016/j.cell.2018.09.005 (2018). [DOI] [PMC free article] [PubMed] [Google Scholar]
- 15.Thomou T et al. Adipose-derived circulating miRNAs regulate gene expression in other tissues. Nature 542, 450–455, doi: 10.1038/nature21365 (2017). [DOI] [PMC free article] [PubMed] [Google Scholar]
- 16.Baek D et al. The impact of microRNAs on protein output. Nature 455, 64–71, doi: 10.1038/nature07242 (2008). [DOI] [PMC free article] [PubMed] [Google Scholar]
- 17.Bartel DP MicroRNAs: target recognition and regulatory functions. Cell 136, 215–233, doi: 10.1016/j.cell.2009.01.002 (2009). [DOI] [PMC free article] [PubMed] [Google Scholar]
- 18.Selbach M et al. Widespread changes in protein synthesis induced by microRNAs. Nature 455, 58–63, doi: 10.1038/nature07228 (2008). [DOI] [PubMed] [Google Scholar]
- 19.Scheja L & Heeren J Metabolic interplay between white, beige, brown adipocytes and the liver. J Hepatol 64, 1176–1186, doi: 10.1016/j.jhep.2016.01.025 (2016). [DOI] [PubMed] [Google Scholar]
- 20.Turner N et al. Distinct patterns of tissue-specific lipid accumulation during the induction of insulin resistance in mice by high-fat feeding. Diabetologia 56, 1638–1648, doi: 10.1007/s00125-013-2913-1 (2013). [DOI] [PubMed] [Google Scholar]
- 21.Povero D et al. Lipid-induced hepatocyte-derived extracellular vesicles regulate hepatic stellate cell via microRNAs targeting PPAR-gamma. Cell Mol Gastroenterol Hepatol 1, 646–663 e644, doi: 10.1016/j.jcmgh.2015.07.007 (2015). [DOI] [PMC free article] [PubMed] [Google Scholar]
- 22.Lee YS et al. Exosomes derived from palmitic acid-treated hepatocytes induce fibrotic activation of hepatic stellate cells. Sci Rep-Uk 7, doi:ARTN 3710 10.1038/s41598-017-03389-2 (2017). [DOI] [PMC free article] [PubMed] [Google Scholar]
- 23.Chen L, Chen R, Kemper S, Charrier A & Brigstock DR Suppression of fibrogenic signaling in hepatic stellate cells by Twist1-dependent microRNA-214 expression: Role of exosomes in horizontal transfer of Twist1. Am J Physiol Gastrointest Liver Physiol 309, G491–499, doi: 10.1152/ajpgi.00140.2015 (2015). [DOI] [PMC free article] [PubMed] [Google Scholar]
- 24.Pescador N et al. Serum circulating microRNA profiling for identification of potential type 2 diabetes and obesity biomarkers. PloS one 8, e77251, doi: 10.1371/journal.pone.0077251 (2013). [DOI] [PMC free article] [PubMed] [Google Scholar]
- 25.Chen L, Brenner DA & Kisseleva T Combatting Fibrosis: Exosome-Based Therapies in the Regression of Liver Fibrosis. Hepatol Commun 3, 180–192, doi: 10.1002/hep4.1290 (2019). [DOI] [PMC free article] [PubMed] [Google Scholar]
- 26.Shurtleff MJ, Temoche-Diaz MM, Karfilis KV, Ri S & Schekman R Y-box protein 1 is required to sort microRNAs into exosomes in cells and in a cell-free reaction. Elife 5, doi: 10.7554/eLife.19276 (2016). [DOI] [PMC free article] [PubMed] [Google Scholar]
- 27.Shurtleff MJ et al. Broad role for YBX1 in defining the small noncoding RNA composition of exosomes. Proc Natl Acad Sci U S A 114, E8987–E8995, doi: 10.1073/pnas.1712108114 (2017). [DOI] [PMC free article] [PubMed] [Google Scholar]
- 28.Ran FA et al. In vivo genome editing using Staphylococcus aureus Cas9. Nature 520, 186–U198, doi: 10.1038/nature14299 (2015). [DOI] [PMC free article] [PubMed] [Google Scholar]
- 29.Platt RJ et al. CRISPR-Cas9 knockin mice for genome editing and cancer modeling. Cell 159, 440–455, doi: 10.1016/j.cell.2014.09.014 (2014). [DOI] [PMC free article] [PubMed] [Google Scholar]
- 30.Liu PS et al. alpha-ketoglutarate orchestrates macrophage activation through metabolic and epigenetic reprogramming. Nat Immunol 18, 985–994, doi: 10.1038/ni.3796 (2017). [DOI] [PubMed] [Google Scholar]
- 31.Ostrowski M et al. Rab27a and Rab27b control different steps of the exosome secretion pathway. Nat Cell Biol 12, 19–30; sup pp11–13, doi: 10.1038/ncb2000 (2010). [DOI] [PubMed] [Google Scholar]
- 32.Song L et al. KIBRA controls exosome secretion via inhibiting the proteasomal degradation of Rab27a. Nat Commun 10, 1639, doi: 10.1038/s41467-019-09720-x (2019). [DOI] [PMC free article] [PubMed] [Google Scholar]
- 33.Bobrie A et al. Rab27a Supports Exosome-Dependent and -Independent Mechanisms That Modify the Tumor Microenvironment and Can Promote Tumor Progression. Cancer Res 72, 4920–4930, doi: 10.1158/0008-5472.Can-12-0925 (2012). [DOI] [PubMed] [Google Scholar]
- 34.Agarwal V, Bell GW, Nam JW & Bartel DP Predicting effective microRNA target sites in mammalian mRNAs. Elife 4, doi: 10.7554/eLife.05005 (2015). [DOI] [PMC free article] [PubMed] [Google Scholar]
- 35.Zhao Y et al. Liver governs adipose remodelling via extracellular vesicles in response to lipid overload. Nat Commun 11, 719, doi: 10.1038/s41467-020-14450-6 (2020). [DOI] [PMC free article] [PubMed] [Google Scholar]
- 36.Alderson NL et al. The human FA2H gene encodes a fatty acid 2-hydroxylase. J Biol Chem 279, 48562–48568, doi: 10.1074/jbc.M406649200 (2004). [DOI] [PubMed] [Google Scholar]
- 37.Eckhardt M, Yaghootfam A, Fewou SN, Zoller I & Gieselmann V A mammalian fatty acid hydroxylase responsible for the formation of alpha-hydroxylated galactosylceramide in myelin. Biochem J 388, 245–254, doi: 10.1042/BJ20041451 (2005). [DOI] [PMC free article] [PubMed] [Google Scholar]
- 38.Shang M et al. Macrophage-derived glutamine boosts satellite cells and muscle regeneration. Nature 587, 626–631, doi: 10.1038/s41586-020-2857-9 (2020). [DOI] [PMC free article] [PubMed] [Google Scholar]
- 39.Lignitto L et al. Nrf2 Activation Promotes Lung Cancer Metastasis by Inhibiting the Degradation of Bach1. Cell 178, 316–329 e318, doi: 10.1016/j.cell.2019.06.003 (2019). [DOI] [PMC free article] [PubMed] [Google Scholar]
- 40.Yan S et al. IRF3 reduces adipose thermogenesis via ISG15-mediated reprogramming of glycolysis. J Clin Invest 131, doi: 10.1172/JCI144888 (2021). [DOI] [PMC free article] [PubMed] [Google Scholar]
- 41.Seo JB et al. Knockdown of Ant2 Reduces Adipocyte Hypoxia And Improves Insulin Resistance in Obesity. Nat Metab 1, 86–97, doi: 10.1038/s42255-018-0003-x (2019). [DOI] [PMC free article] [PubMed] [Google Scholar]
- 42.Li P et al. Hematopoietic-Derived Galectin-3 Causes Cellular and Systemic Insulin Resistance. Cell 167, 973–984 e912, doi: 10.1016/j.cell.2016.10.025 (2016). [DOI] [PMC free article] [PubMed] [Google Scholar]
- 43.Ying W, Cheruku PS, Bazer FW, Safe SH & Zhou B Investigation of macrophage polarization using bone marrow derived macrophages. J Vis Exp, doi: 10.3791/50323 (2013). [DOI] [PMC free article] [PubMed] [Google Scholar]
- 44.Li P et al. LTB4 promotes insulin resistance in obese mice by acting on macrophages, hepatocytes and myocytes. Nat Med 21, 239–247, doi: 10.1038/nm.3800 (2015). [DOI] [PMC free article] [PubMed] [Google Scholar]
- 45.Garcia DM et al. Weak seed-pairing stability and high target-site abundance decrease the proficiency of lsy-6 and other microRNAs. Nat Struct Mol Biol 18, 1139–1146, doi: 10.1038/nsmb.2115 (2011). [DOI] [PMC free article] [PubMed] [Google Scholar]
Associated Data
This section collects any data citations, data availability statements, or supplementary materials included in this article.
Supplementary Materials
Data Availability Statement
The datasets generated in current study are available from the corresponding authors upon reasonable request. There are no restrictions on data availability. All mouse lines in this study are available from the Jackson Laboratory. The miRNA-seq data have been deposited in the NCBI Gene Expression Omnibus under accession number GSE164310. Source data are provided with this paper.