Abstract
White fat stores excess energy, whereas brown and beige fat are thermogenic and dissipate energy as heat. Thermogenic adipose tissues markedly improve glucose and lipid homeostasis in mouse models, although the extent to which brown adipose tissue (BAT) influences metabolic and cardiovascular disease in humans is unclear1,2. Here we retrospectively categorized 134,529 18F-fluorodeoxyglucose positron emission tomography-computed tomography scans from 52,487 patients, by presence or absence of BAT, and used propensity score matching to assemble a study cohort. Scans in the study population were initially conducted for indications related to cancer diagnosis, treatment or surveillance, without previous stimulation. We report that individuals with BAT had lower prevalences of cardiometabolic diseases, and the presence of BAT was independently correlated with lower odds of type 2 diabetes, dyslipidemia, coronary artery disease, cerebrovascular disease, congestive heart failure and hypertension. These findings were supported by improved blood glucose, triglyceride and high-density lipoprotein values. The beneficial effects of BAT were more pronounced in individuals with overweight or obesity, indicating that BAT might play a role in mitigating the deleterious effects of obesity. Taken together, our findings highlight a potential role for BAT in promoting cardiometabolic health.
As early as 2003, reports3 described increased uptake of the glucose analog 18F-fluorodeoxyglucose (18F-FDG) on positron emission tomography (PET) scans in areas corresponding to supraclavicular fat on computed tomography (CT) images, suggesting the presence of metabolically active BAT in adult humans. In 2009, a series of papers confirmed the presence of active BAT in adults, which correlated with lower body mass index (BMI), decreased age, colder outdoor temperature, female sex and decreased glucose levels4–6. Since then, small prospective studies in healthy humans have demonstrated that cold-activated BAT is associated with increased energy expenditure and enhanced disposal of glucose and free fatty acids7,8. Although these effects have generated enthusiasm for BAT as a therapeutic target for obesity and associated diseases, these studies have been too small to definitively address whether BAT is a clinically meaningful modulator of metabolic and cardiovascular disease in humans.
To address the relationship of BAT with metabolic and cardiovascular diseases, we reviewed 134,529 18F-FDG positron emission tomography-computed tomography (PET/CT) reports from 52,487 patients generated between 1 June 2009 and 31 March 2018 at Memorial Sloan Kettering Cancer Center (MSKCC) (Fig. 1a). 18F-FDG PET/CT was conducted for cancer diagnosis, staging, monitoring of treatment response and surveillance, and it is MSKCC protocol to record BAT status in each scan. BAT was reported in 7,923 (5.9%) 18F-FDG PET/CT scans (Fig. 1b, Supplementary Table 1) in 5,070 (9.7%) patients (Fig. 1c, Supplementary Table 2), with reporting consistent from 2009–2018 (Extended Data Fig. 1). BAT was more prevalent among women (13.8 vs. 4.9%, P<0.0001), decreased with age (r=−0.9850, P<0.0001) and was inversely correlated with ambient temperature (r=−0.6993, P<0.0001) and BMI (r=−0.9032, P<0.0001), in accord with earlier, smaller retrospective studies (Fig. 1c–f and Extended Data Fig. 2a,b)9,10.
Fig. 1: Study design, association of brown fat with patient demographics and characterization of brown fat activity across adipose depots.
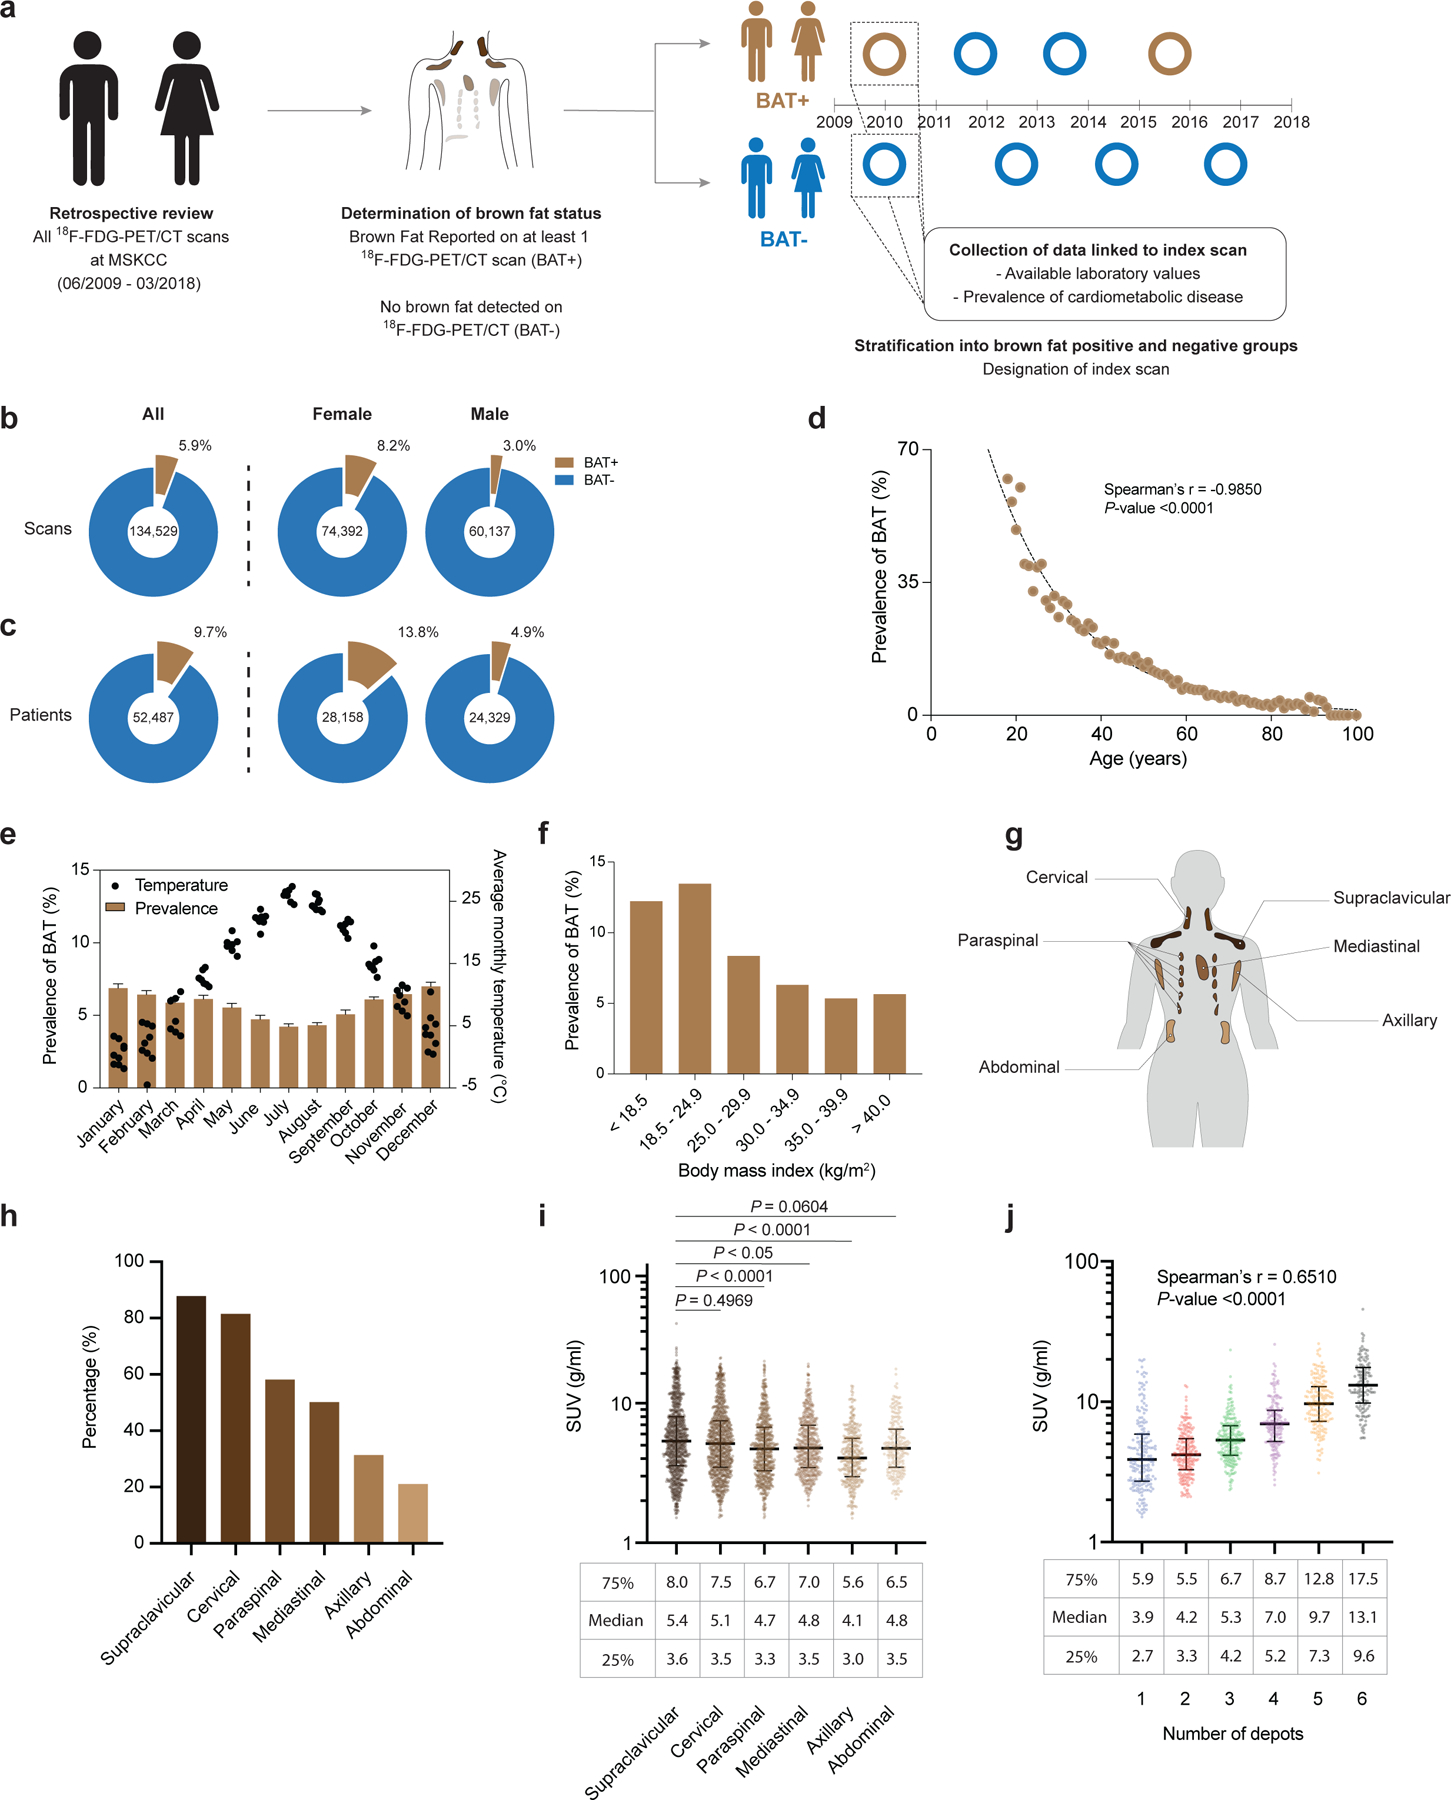
a,18F-FDG PET/CT reports were stratified by presence or absence of brown fat. b, Prevalence of brown fat per 18F-FDG PET/CT scan (n=134,529), further stratified according to 18F-FDG PET/CT scans in female (n=74,392) and male (n=60,137) individuals. c, Prevalence of brown fat in all patients (n=52,487), stratified by female (n=28,158) and male (n=24,329) sex. d, Correlation between brown fat prevalence and age. e, Brown fat prevalence, based on 18F-FDG PET/CT scans, and correlation with outdoor temperature in the month of the scan between 1 June 2009 and 31 March 2018. Bars depict means; error bars are standard deviations. f, Brown fat prevalence and BMI. g, Schematic of brown fat depot location in humans. h, Prevalence of brown fat in defined anatomic locations, derived from all 18F-FDG PET/CT scans with brown fat in 2016 (n=1,091 scans). i, Comparison of BAT activity measured in SUV across the different depots (n=1,091). Compared with supraclavicular depots, BAT activity was significantly lower in paraspinal (P<0.0001), mediastinal (P=0.0185) and axillary (P<0.0001) depots. Activities were compared by Kruskal-Wallis test with Dunn’s post hoc test; all tests were two-sided. Line depicts median; error bars are 25th and 75th percentile. j, Correlation between highest measured brown fat activity per patient and cumulative number of adipose depots with detectable brown fat activity (n=1,091 scans). Line depicts median; error bars are 25th and 75th percentile.
To assess accuracy of reporting, all scans conducted in 2016 with reported BAT were manually reviewed (Methods), and BAT activity was measured in six depots (cervical, supraclavicular, axillary, mediastinal, paraspinal and abdominal) (Fig. 1g). Of the 1,139 scans with brown fat identified in 2016, 1,136 (99.7%) showed increased 18F-FDG uptake in regions identified as fat on CT, while 3 (0.3%) were false-positive and reported resolution of previously detected BAT. In total, 1,091 (95.8%) scans met Brown Adipose Reporting Criteria in Imaging Studies (BARCIST 1.0) criteria in terms of 18F-FDG uptake above the recommended threshold of standardized uptake value (SUV) normalized to body mass, ≥1.5 g ml−1 (ref. 11). As previously reported12, detected BAT activity was more prevalent in the cervical (81.5%) and supraclavicular depots (87.9%) compared with paraspinal (58.2%), mediastinal (50.1%), axillary (31.4%) and abdominal depots (21.1%) (Fig. 1h). Maximum BAT activity was higher in the supraclavicular depot (5.4 g ml−1, interquartile range (IQR) 3.6–8.0) compared with paraspinal (4.7 g ml−1, IQR 3.3–6.7, P <0.0001), mediastinal (4.8 g ml−1, IQR 3.5–7.0, P =0.0185) and axillary depots (4.1 g ml−1, IQR 3.0–5.6, P <0.0001) (Fig. 1i). Lastly, maximum measured BAT activity positively correlated with the number of depots with BAT activity (r=0.6510, P <0.0001), indicating an association between abundance and activity (Fig. 1j). Patients were then categorized by presence or absence of BAT (BAT+ and BAT−, respectively) based on 18F-FDG uptake on PET/CT, and an index scan was assigned as a reference point for data collection (Fig. 1a and described in the Methods). In patients without a BAT signature on any scan, the first 18F-FDG PET/CT scan served as the index scan. In patients with BAT reported on at least one 18F-FDG PET/CT scan, the first scan reporting BAT was assigned as the index scan. In patients with BAT, 62.8% had BAT detected on their first scan and 80.7% within their first two 18F-FDG PET/CT scans (Supplementary Table 3 and Extended Data Fig. 3a).
Propensity score matching (PSM) allows pairing of individuals with and without BAT, while accounting for covariates that predict the likelihood of having BAT. We used PSM to generate a study cohort without BAT (N = 9,853), matching the individuals with BAT based on sex, age, BMI and outdoor temperature at the time of the index scan (Fig. 2a). This resulting study cohort was balanced across the aforementioned variables (Table 1 and Extended Data Fig. 4).
Fig. 2: Propensity score matching and association of brown fat with medication, cancer site and cancer treatment.
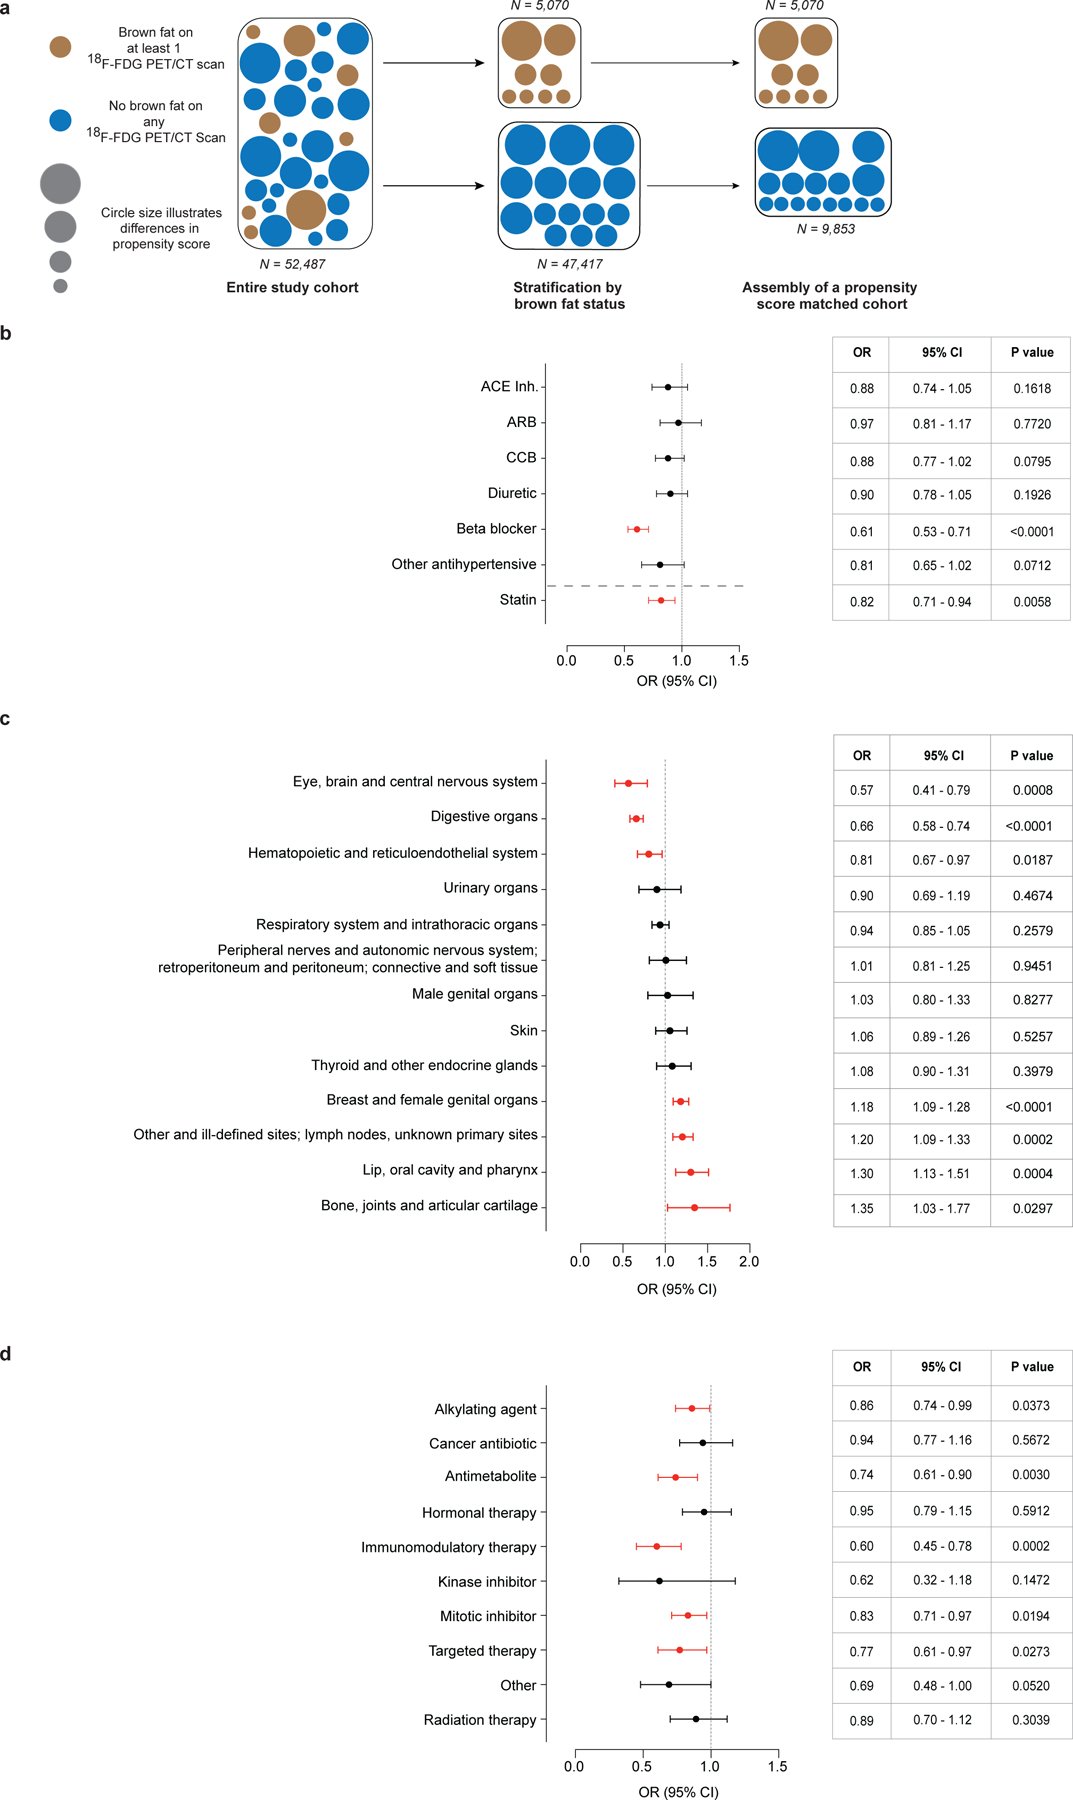
a, PSM was used to identify a matched cohort based on age, sex, BMI and outdoor temperature in the month of the index scan. b, Forest plots illustrate the association between brown fat status and use of antihypertensive drugs and statins in the propensity score-matched cohort. Circles and bars represent ORs and 95% CIs, respectively. c, Forest plots illustrate the association between brown fat status and site of neoplasm (based on ICD-O codes) in the propensity score-matched cohort. Circles and bars represent ORs and 95% CIs, respectively. d, Forest plots illustrate the association between brown fat status and cancer treatment in the propensity score-matched cohort. Circles and bars represent ORs and 95% CIs, respectively. ACE, angiotensin-converting enzyme; ARB, angiotensin II receptor blocker; CCB, calcium channel blocker.
Table 1.
Characteristics of patients with and without brown fat before and after PSM
|
Baseline variable |
Before PSM | After PSM |
P valuea |
||
|---|---|---|---|---|---|
| Brown adipose present (BAT+) (N=5,070) | Brown adipose absent (BAT−) (N=47,417) | Brown adipose present (BAT+) after matching (N=5,070) | Brown adipose absent (BAT−) after matching (N=9,853) | ||
| Age, mean (s.d) | 49.0 (16.3) | 61.9 (14.0) | 49.0 (16.3) | 50.2 (14.9) | <0.0001 |
| Sex, n (%) | 0.4989 | ||||
| Women | 3,879 (76.5) | 24,279 (51.2) | 3,879 (76.5) | 7,587 (77.0) | |
| Men | 1,191 (23.5) | 23,138 (48.8) | 1,191 (23.5) | 2,266 (23.0) | |
| BMI, mean (s.d.) | 25.8 (5.3) | 27.8 (5.9) | 25.8 (5.3) | 25.8 (5.5) | 0.5372 |
| BMI category, n (%) | 0.0991 | ||||
| < 25.0 | 2,564 (50.6) | 16,196 (34.2) | 2,564 (50.6) | 4,912 (49.9) | |
| 25.0 – 29.9 | 1,589 (31.3) | 17,076 (36.0) | 1,589 (31.3) | 3,016 (30.6) | |
| > 30.0 | 917 (18.1) | 14,145 (29.8) | 917 (18.1) | 1,925 (19.5) | |
| Race, n (%) | <0.0001 | ||||
| Asian | 402 (7.9) | 2,786 (5.9) | 402 (7.9) | 836 (8.5) | |
| African-American | 561 (11.1) | 3,344 (7.1) | 561 (11.1) | 833 (8.5) | |
| Caucasian | 3,694 (72.9) | 38,419 (81.0) | 3,694 (72.9) | 7,478 (75.9) | |
| Other or unknown | 413 (8.1) | 2,868 (6.0) | 413 (8.1) | 706 (7.2) | |
| Ethnicity, n (%) | 0.0283 | ||||
| Hispanic | 398 (7.9) | 2,756 (5.8) | 398 (7.9) | 657 (6.7) | |
| Non-Hispanic | 4,458 (87.9) | 42,168 (88.9) | 4,458 (87.9) | 8,778 (89.1) | |
| Unknown | 214 (4.2) | 2,493 (5.3) | 214 (4.2) | 418 (4.2) | |
| Cardiovascular risk factors, n (%) | |||||
| Family history of cardiovascular disease | 1,029 (20.3) | 11,473 (24.2) | 1,029 (20.3) | 2,091 (21.2) | 0.1876 |
| Smoking status | <0.0001 | ||||
| Current smoker | 513 (10.1) | 5,292 (11.2) | 513 (10.1) | 1,128 (11.4) | |
| Previous smoker | 1,169 (23.1) | 17,481 (36.9) | 1,169 (23.1) | 2,614 (26.5) | |
| Never smoker | 2,999 (59.2) | 19,444 (41.0) | 2,999 (59.2) | 5,034 (51.1) | |
| Unknown | 389 (7.7) | 5,200 (11.0) | 389 (7.7) | 1,077 (10.9) | |
| 18 F-FDG PET/CT characteristics | |||||
| Total Number of scans per patient, n (%) | 4.1 (4.0) | 2.4 (2.6) | 4.1 (4.0) | 2.4 (2.7) | <0.0001 |
| Temperature (°C month of reference scan), mean (s.d.) | 11.9 (8.6) | 13.6 (8.8) | 11.9 (8.6) | 12.1 (8.9) | 0.4066 |
| Beta blocker, n (%) | 249 (4.9) | 6,120 (12.9) | 249 (4.9) | 775 (7.9) | <0.0001 |
P value for the comparison of BAT+ and BAT− individuals in the propensity score-matched group. Continuous variables were compared by Student’s t-test; categorical variables were compared by chi-squared test. All statistical tests are two-sided, and no adjustments for multiple comparisons were performed.
Cancer-associated characteristics such as cachexia, cancer type (for example, lymphoma and breast cancer) and stage have previously been associated with differences in BAT prevalence, as has the use of beta blockers and statins9,10,13,14. We assessed associations between anti-hypertensive drugs and statins and BAT prevalence using a multivariable logistic regression model adjusted for age, sex, BMI, outdoor temperature, race and ethnicity. Our results confirm a significant negative correlation between beta blocker (odds ratio (OR) 0.61; 95% confidence interval (95% CI), 0.53–0.71; P<0.0001) and statin usage (OR 0.82; 95% CI, 0.71–0.94; P=0.0058) and BAT prevalence (Fig. 2b). We identified positive associations between BAT prevalence and cancer site (based on ICD-O (International Classification of Diseases for Oncology, 3rd edn) site codes) for lip, oral cavity and pharynx; breast and female genital organ; lymphoma, secondary and ill-defined; and bone, joint and articular cartilage neoplasms; these findings confirmed previous reports of higher prevalence of BAT detection in patients with breast cancer10,13. We also identified negative associations between BAT prevalence and digestive organ; eye, brain and central nervous system; and hematopoietic and reticuloendothelial organ neoplasms (Fig. 2c and Supplementary Table 4). Furthermore, certain histology types (for example, Hodgkin lymphoma) showed positive interactions with BAT prevalence, while individuals with indolent non-Hodgkin lymphoma or acute/chronic myeloid leukemia had lower odds for BAT detection (Supplementary Table 4).
The assignment of an index scan in individuals with multiple scans resulted in differences in cancer treatment rate before the index scan depending on its position. Specifically, in individuals without BAT, 25.9% of patients received cancer-specific treatment (either chemotherapy or radiation therapy) before the index scan. In patients with BAT, treatment rate was dependent on the position of the index scan and ranged from 21.9% (first scan is index scan) to more than 55.0% of patients (all later scans designated as index scan) receiving treatment within 90 days before the index scan (Supplementary Table 3 and Extended Data Fig. 3b). Current data concerning the association between cancer therapy and BAT are controversial, as some studies indicate that chemotherapy is associated with lower BAT prevalence or activity, while another study reported that the antimetabolite cytarabine may actually have an activating effect10,15–17. To assess potential effects of treatment, cancer therapies were grouped into ten categories (Supplementary Table 5); only patients who had their first scan designated as the index scan were compared. Using multivariable logistic regression analysis, we found that alkylating agents, antimetabolites, immunomodulatory therapy, mitotic inhibitors and targeted therapy given within 90 days of the index scan were independently associated with lower odds for detecting BAT (Fig. 2d and Supplementary Table 4). These data indicate that drugs, cancer characteristics and cancer treatment are associated with differences in BAT detection on 18F-FDG PET/CT and thus were adjusted for in subsequent analyses.
Individuals with BAT showed significantly lower prevalence of type 2 diabetes (T2DM) (4.6% versus 9.5%, P<0.0001) and dyslipidemia (18.9% versus 22.2%, P<0.0001). This effect was also seen for cardiovascular disease, including atrial fibrillation/flutter (2.8% versus 3.6%, P=0.0050), coronary artery disease (CAD) (3.1% versus 4.9%, P<0.0001), cerebrovascular disease (CVD) (2.1% versus 2.8%, P=0.0088), congestive heart failure (CHF) (1.0% versus 2.0%, P<0.0001) and hypertension (26.7% versus 30.7%, P<0.0001) (Fig. 3a).
Fig. 3: Association of brown fat with cardiometabolic disease and laboratory values.
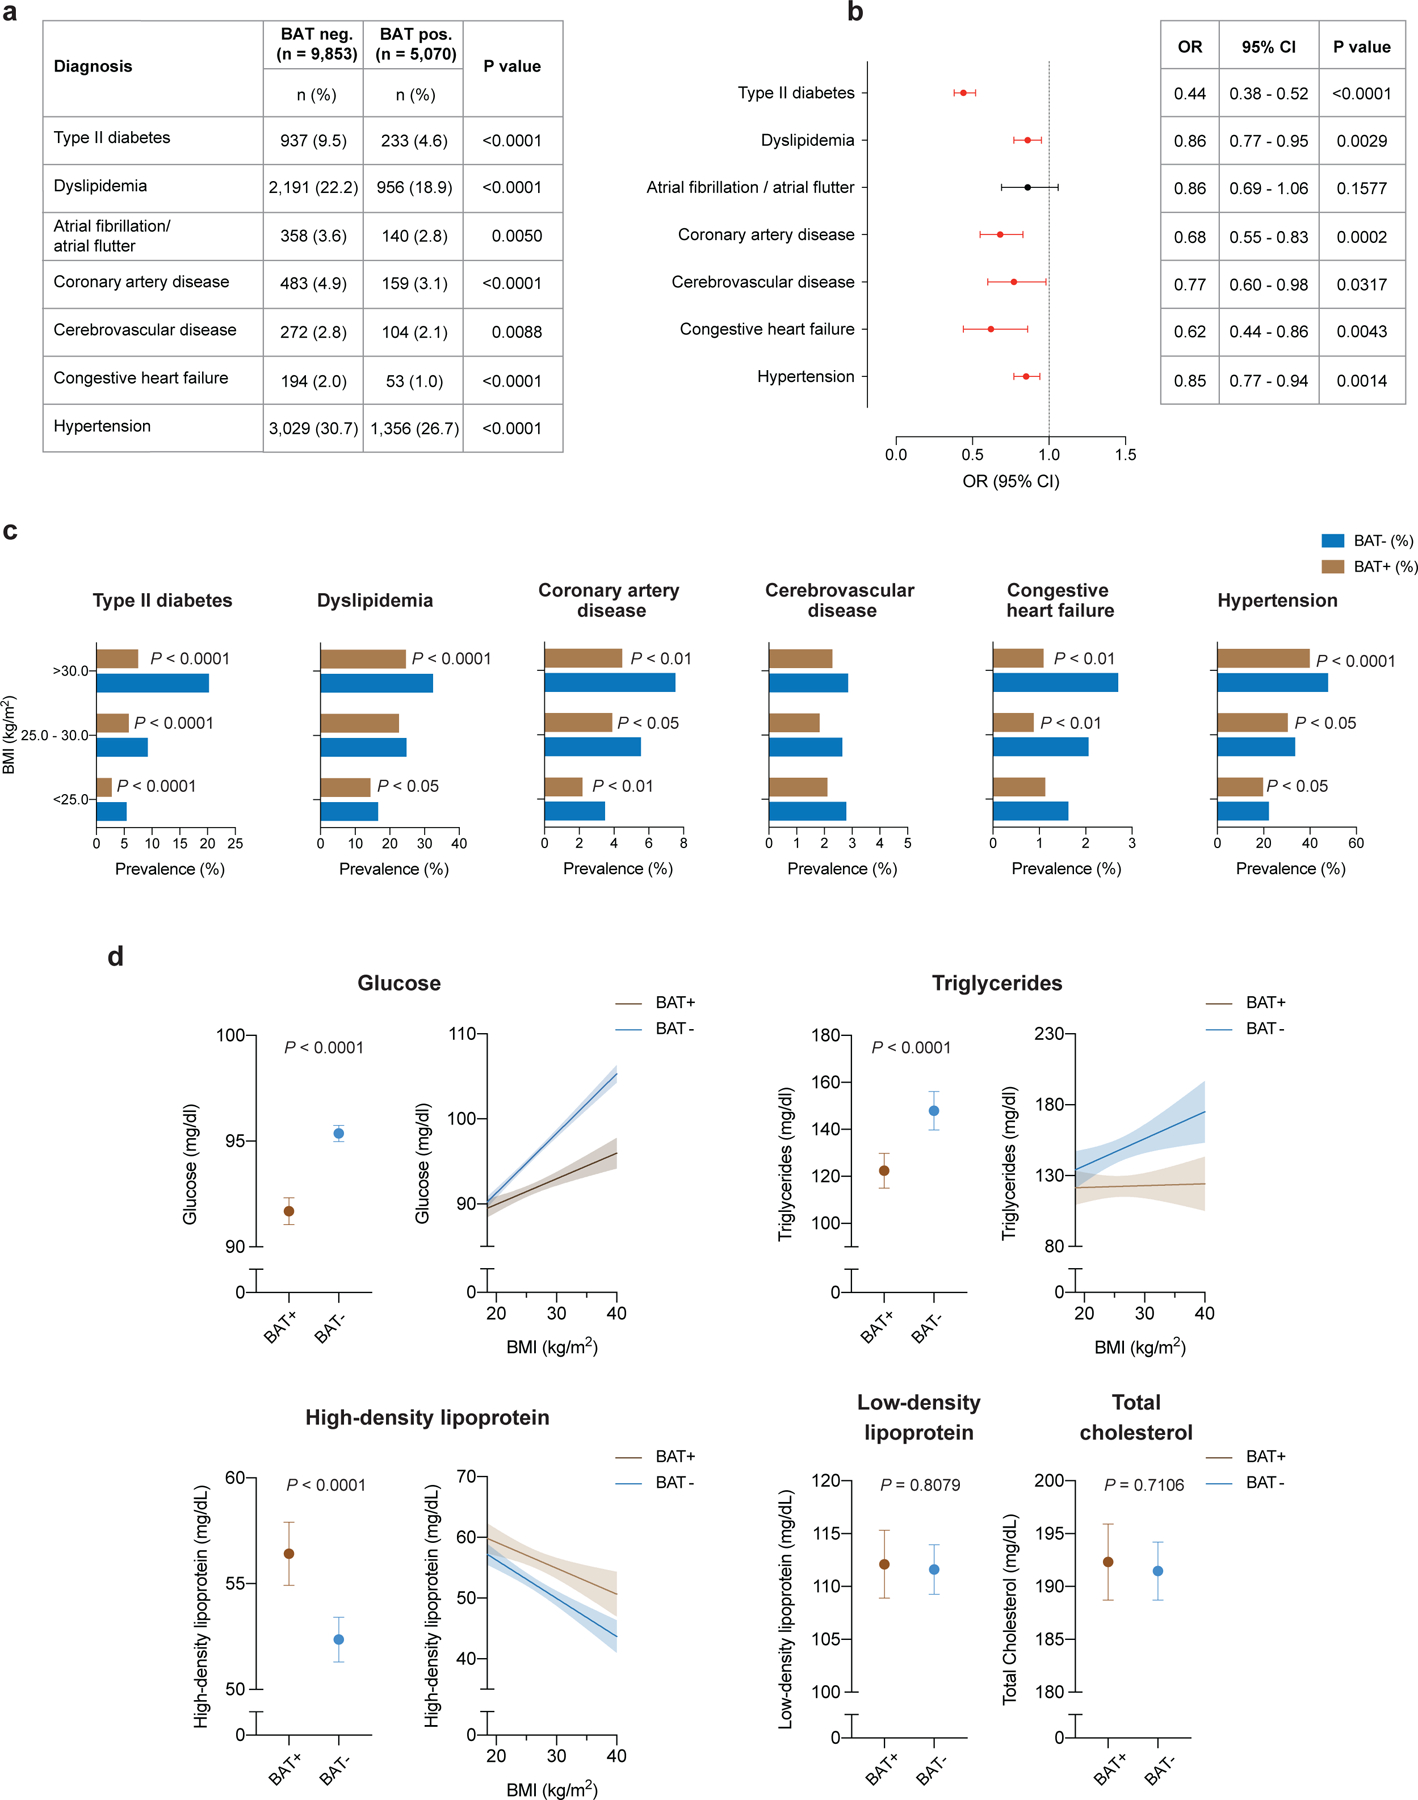
a, Comparison of cardiometabolic disease prevalence between individuals with and without BAT. b, Forest plots illustrate the association between brown fat status and cardiometabolic disease in the propensity score-matched cohort. Circles and bars represent ORs and 95% CIs, respectively. c, Prevalence of cardiometabolic disease stratified by brown status and BMI using the World Health Organization categories for normal and underweight (BMI < 25.0 kg m−2), overweight (BMI between 25.0 and 30.0 kg m−2) and obesity (BMI > 30.0 kg m−2). Patients per category: BMI < 25.0 kg m−2, with brown fat n = 2,564, without brown fat n = 4,912; BMI between 25.0 and 30.0 kg m−2, with brown fat n = 1,589, without brown fat n = 3,016; BMI > 30.0 kg m−2, with brown fat n = 917, without brown fat n = 1,925. d, Comparison of available laboratory values between matched individuals with and brown fat (glucose; with brown fat n = 5,033 (99.3%), without brown fat n = 9,707 (98.5%); triglycerides, with brown fat n = 732 (14.4%), without brown fat n = 1,444 (14.7%); HDL, with brown fat n = 596 (11.8%), without brown fat n = 1,185 (12.0%); LDL, with brown fat n = 543 (10.7%), without brown fat n = 1,070 (10.9%); total cholesterol, with brown fat n = 637 (12.6%), without brown fat n = 1,267 (12.9%). Dots are means; error bars depict 95% CIs. Shaded bands indicate 95% CIs fitted by linear regression.
We adjusted the following logistic regression analysis for cancer site, cancer stage, cancer treatment within 90 days of index scan, use of antihypertensive medication and statins, and demographic variables (including race, ethnicity, smoking status) to determine whether BAT independently correlated with cardiometabolic disease. Multivariable logistic regression analysis identified BAT as an independent negative predictor of T2DM (OR 0.44; 95% CI, 0.38–0.52; P<0.0001), dyslipidemia (OR 0.86; 95% CI, 0.77–0.95; P=0.0029), CAD (OR 0.68; 95% CI, 0.55–0.83; P=0.0002), CVD (OR 0.77; 95% CI, 0.60–0.98; P=0.0317), CHF (OR 0.62; 95% CI, 0.44–0.86; P=0.0043) and hypertension (OR 0.85; 95% CI, 0.77–0.94; P=0.0014) (Fig. 3b and Supplementary Table 6).
We conducted a number of further analyses using additional adjustments and variations of the study cohort to support our results. 18F-FDG is taken up by BAT through GLUT receptors in both insulin-independent (GLUT1) and insulin-dependent (GLUT4) mechanisms18. Systemic insulin sensitivity and its impairment could therefore affect the sensitivity of BAT detection by 18F-FDG PET/CT, underestimate its prevalence in individuals with T2DM and hence confound our findings19. Adjustment of the previously applied logistic regression model by T2DM status resulted in comparable results regarding BAT as a predictor for CAD (OR 0.74: 95% CI, 0.60–0.91; P=0.0039), CVD (OR 0.78; 95% CI, 0.61–0.99; P=0.0430), CHF (OR 0.65; 95% CI, 0.46–0.90; P=0.0106) and hypertension (OR 0.91; 95% CI, 0.82–1.00; P=0.0493) (Supplementary Table 7 and Extended Data Fig. 5a). Because designation of the index scan was associated with differences in rate of cancer therapy within 90 days of the index scan and cancer treatment itself may impair metabolic parameters20, we also adjusted for index scan position (Supplementary Table 8 and Extended Data Fig. 5b). These results also support our findings in that BAT is negatively associated with T2DM (OR 0.34; 95% CI, 0.28–0.43; P<0.0001), dyslipidemia (OR 0.88; 95% CI, 0.78–0.99; P=0.0382), CAD (OR 0.55; 95% CI, 0.42–0.72; P<0.0001), CVD (OR 0.64; 95% CI, 0.46–0.88; P=0.0057), CHF (OR 0.53; 95% CI, 0.34–0.81; P=0.0037) and hypertension (OR 0.83; 95% CI, 0.74–0.93; P=0.0018). Lastly, comparable results were obtained when repeating the multivariable logistic regression analysis across the entire dataset (Extended Data Fig. 6 and Supplementary Table 9). In conclusion, while these additional analyses showed minor differences depending on the additional variables adjusted for, they collectively provide an abundance of data in support of our finding that BAT is independently associated with lower odds of cardiometabolic disease.
We then stratified these data by BMI to determine whether the association between BAT and improved cardiometabolic health was retained in overweight and obese individuals. As the prevalence of metabolic and cardiovascular disease increased with higher BMI, this effect was mitigated in individuals with BAT (Fig. 3c). The benefit associated with BAT was most apparent for T2DM, CAD and CHF. For example, the prevalence of T2DM in individuals with BMI > 30 kg m-2 and BAT was less than half the prevalence in obese individuals without BAT (7.5% versus 20.3%, P<0.0001). Significantly lower prevalences of dyslipidemia (24.6% versus 32.5%, P<0.0001), hypertension (39.9% versus 47.8%, P<0.0001), CAD (4.5% versus 7.5%, P=0.0020) and CHF (1.1% versus 2.7%, P=0.0060) were also observed in individuals with obesity and BAT compared with individuals with obesity without BAT.
We analyzed available laboratory values in temporal vicinity to the index scan to further characterize the metabolic profile of the cohort. We noted distinct improvements in glucose (91.7 versus 95.4 mg dl−1, P<0.0001), triglycerides (122.4 versus 148.0 mg dl−1, P<0.0001), and high-density lipoprotein (HDL) levels (56.4 versus 52.4 mg dl−1, P<0.0001) in individuals with BAT, while there were no differences for low-density lipoproteins (LDLs) (112.1 vs. 111.6 mg dl−1, P=0.8079) and total cholesterol (192.3 versus 191.5 mg/dl, P=0.7106) (Fig. 3d and Supplementary Table 10). By stratifying laboratory values by BMI, we found that changes in blood glucose and triglycerides associated with elevated BMI were offset in individuals with BAT, and HDL levels were higher across all BMI categories in individuals with BAT (Fig. 3d). There were no apparent differences in laboratory values measuring renal function (creatinine 0.83 versus 0.84 mg dl−1, P=0.0580; and blood urea nitrogen 14.6 versus 14.7 mg dl−1, P=0.2960) and thyroid function (thyroid-stimulating hormone 2.95 versus 2.70 mIU l−1, P=0.4158) (Supplementary Table 10). However, both leukocyte (6.2 X 10⁹ versus 6.8 X 10⁹ cells per liter, P<0.0001) and platelet counts (250 X 109 vs. 261 X 109 cells per liter, P<0.0001) were significantly decreased in individuals with BAT, suggesting potential roles for brown adipose beyond regulation of lipid and glucose metabolism (Supplementary Table 10).
Obesity is a major contributor to metabolic and cardiovascular disease, and 48.9% of American adults are predicted to be obese by 2030 (ref. 21). Thermogenic fat has been implicated as a potential target for obesity and metabolic disease. It contributes to nonshivering thermogenesis, a mechanism that generates heat during cold exposure. The activation of nonshivering thermogenesis increases energy expenditure through futile cycling and concomitantly increases systemic glucose and lipid utilization22–24. To what extent BAT, as opposed to tissues such as skeletal muscle, contributes to overall energy expenditure, and thus its therapeutic potential, is still controversial25,26. Studies in humans have demonstrated improved parameters of glucose and lipid metabolism associated with BAT based on 18F-FDG PET/CT at ambient temperature and after cold exposure6,22–24,27. This observation is consistent with animal models where transplantation of thermogenic adipose tissue improved glucose and triglyceride metabolism, while genetic ablation of thermogenic fat had the opposite effect28,29.
By contrast, other studies26,30 have indicated that the therapeutic potential of BAT may be limited. Although BAT is known to contribute to uptake of circulating glucose, nonesterified fatty acids and dietary fatty acids in humans, its relative contribution to systemic turnover has been described as low25,27,31. In addition, the quantity of BAT determined by 18F-FDG PET/CT after cold stimulation varies widely and may further limit its clinical utility in individuals with low abundance such as older and obese individuals. Besides directly modulating glucose and lipid metabolism, studies have implicated beneficial effects of BAT activation on obesity-associated diseases, suggesting that the role of BAT in human metabolism extends beyond energy expenditure, and may be mediated by endocrine effects 32.
Previous studies in mice have indicated that BAT activation, either through cold exposure or pharmacologically, results in rapid uptake of fatty acids from triglyceride-rich lipoproteins in the plasma and thus lowers triglyceride levels1, lowers cholesterol levels33, and increases HDL levels1, collectively improving dyslipidemia and reducing atherosclerosis progression1,33. Additionally, the activation of thermogenic fat in humans increased HDL concentration34,35, related to increased cholesterol efflux capacity of HDL34. These data, in combination with improvement in glucose metabolism, indicate that BAT could be an important modulator of cardiovascular risk in humans, a hypothesis that is supported by a prospective study that reported a correlation between high BAT activity and improved markers of subclinical atherosclerosis after a follow-up of 5 yr (ref. 36). However, the effects of thermogenic adipose tissue on overall cardiometabolic health and obesity-associated diseases in humans have been largely unexplored.
Our study illustrates that individuals with BAT on 18F-FDG PET/CT have significantly improved metabolic profiles. This effect is not limited to diabetes only, but extends to dyslipidemia, CAD, CVD, CHF and hypertension. Furthermore, the associations of BAT with metabolic and cardiovascular disease are most pronounced in individuals with elevated BMI. While obesity is generally associated with decreased BAT function5, obese individuals who retain BAT activity appear to be protected against conditions linked to excess adiposity. Our data are consistent with a study by Finlin et al. showing that mirabegron, a beta-3 adrenergic agonist, resulted in improved oral glucose tolerance and insulin sensitivity in obese individuals37. These data further support the potential of BAT as a means to mitigate the harmful effects of obesity.
Our study raises a number of questions regarding BAT development and function in humans. First, it remains unclear how BAT can mechanistically contribute to improved cardiometabolic health. We postulated that the modulation of cardiovascular risk factors in combination with a potential endocrine and paracrine crosstalk with other organ systems could be of importance. Supporting this hypothesis, here, we demonstrated an association of BAT with improved health across several organ systems. For example, individuals without BAT exhibited higher leukocyte counts, and elevated white blood cell counts are an established risk factor for CAD38. Decreased leukocyte counts in individuals with BAT could, in part, explain the lower prevalence of CAD among these individuals. Our work highlights the need to determine the extent of the effects of BAT on other organs and their roles in systemic metabolism.
Second, variability in BAT prevalence and activity suggests a possible genetic determinant of its biology. Consistent with this, our understanding of genetics as a contributor to T2DM development has evolved substantially39. It is possible then that genetic factors contributing to BAT development and activity may affect the pathogenesis of T2DM and metabolic syndrome.
The major strength of our study is the size of the dataset (the largest that we are aware of) and the linkage to electronic health records (EHRs). This allowed us to comprehensively examine associations between BAT and a wide variety of data. There are, however, a number of limitations that need to be acknowledged, mainly pertaining to the retrospective design and analysis of data from a cancer population. First, identification of BAT relies on 18F-FDG PET/CT and consistent reporting. Our manual review of BAT reporting over an entire year as well as the consistent BAT prevalence over the study period support the reliability of reporting in this study. Furthermore, 18F-FDG PET/CT without previous cold stimulation tends to underestimate BAT prevalence, which might have affected our classification. Given that BAT might not be detectable on the first but on subsequent 18F-FDG PET/CT scans, it is possible that some patients may have been falsely classified as BAT−. In the absence of broadly applicable screening methods or biomarkers for BAT, the use of 18F-FDG PET/CT to screen for BAT is still considered the gold standard. Although a number of studies have indicated associations between cancer characteristics and BAT prevalence as measured by 18F-FDG PET/CT, the effects of cancer on this tissue remains poorly understood. We thus adjusted our analysis to accommodate the potential influence of cancer and treatment characteristics. Lastly, impaired systemic insulin sensitivity might affect 18F-FDG uptake in BAT and thus underestimate BAT prevalence in individuals with diabetes19. However, adjusting for T2DM still identified the same significant associations.
Our study indicates an important contribution of BAT to cardiometabolic health and suggests that BAT has therapeutic potential in humans. As the global obesity crisis worsens despite considerable efforts to improve prevention and treatments, the emergence of BAT as a potential therapeutic target is appealing. Future research should aim to improve our understanding of BAT regulation in humans and to develop mechanisms to safely modulate BAT activity.
Methods
Study design and participants.
This retrospective case-control study followed institutional guidelines and was approved by the Institutional Review Boards of The Rockefeller University and MSKCC. Due to the retrospective nature of this study, the requirement for informed consent was waived. Results from this study are reported in accordance with the Strengthening the Reporting of Observational Studies in Epidemiology guidelines for case-control studies40.
We included all patients aged 18 and above who underwent one or more 18F-FDG PET/CT scans at MSKCC from June 2009 through March 2018. This resulted in 134,529 18F-FDG PET/CT scans conducted in 52,487 patients. Brown adipose is identified by increased 18F-FDG uptake on PET, measured in regions corresponding to adipose tissue on CT. It is standard practice at MSKCC to document these signatures in all reports (examples are shown in Extended Data Figure 7). We searched all 18F-FDG PET/CT reports for the terms “brown fat” or “brown adipose”. Patients were then categorized by the presence or absence of BAT reporting. For each individual in both groups, an index scan was designated as follows: in patients with BAT reported on at least one 18F-FDG PET/CT scan, the first scan that reported BAT was defined as the index scan. In patients without BAT on any scan, the first 18F-FDG PET/CT scan served as the index scan (Fig. 1a).
Data collection.
We obtained average outdoor temperatures in New York City, measured in Central Park, for the months of scans from the US National Weather Service. All patient data including demographics and self-reported race and ethnicity were collected from institutional EHRs. Diagnoses listed up to 1 yr after the time (month and year) of the index scan were identified using diagnostic codes from the International Classification of Diseases, 9th and 10th Revisions (ICD-9 and ICD-10) (Supplementary Table 11). Medication data were obtained from EHRs if these values were available within 1 yr of the index scan date. All data referring to cancer treatment (both radiation therapy and antineoplastic drugs) were collected if administered within 90 d before the index scan. Laboratory values were recorded from the EHR if these values were first measured within 3 months (complete blood counts) or 1 yr (lipid levels) of the index scan date. In cases with multiple data points available, the one closest to the index scan was used for analysis. Blood glucose was routinely measured on the day of scanning. Complete blood counts from patients with hematological malignancies were excluded from analysis. With the exception of blood glucose, which was drawn after a minimum of 4–6 h of fasting, measurement of blood values was not coupled to 18F-FDG PET/CT scans. Data completeness was assessed for all blood values, and available data was analyzed using complete case analysis (Supplementary Table 10). Data completeness ranged from 11.7% (LDLs) to 98.4% (glucose).
Identification of brown fat and measurement of activity on 18F-FDG PET/CT.
Standardized uptake value (SUV) was calculated as the ratio of a voxel’s radioactivity concentration [kBq ml−1] and the decay-corrected and body-weight-adjusted injected radiotracer dose [kBq g−1] and reported as g ml−1. All scans conducted in 2016 with reported BAT were manually reviewed by T.B. Six regions of interest were defined41: cervical, supraclavicular, axillary, mediastinal, paraspinal and abdominal. Regions of interest were identified as previously described based on anatomical landmarks and Hounsfield units between −190 and −10 (refs. 11,41). Depots were considered BAT−positive if 18F-FDG uptake was above a threshold of SUV ≥ 1.5 g ml−1 normalized to body mass. BAT activity was reported as maximum SUV value, measured in the voxel with the highest 18F-FDG uptake in each of the six adipose depots. Comparison between brown fat activity in the supraclavicular and other depots was performed using Kruskal-Wallis test, and correction for multiple comparisons was done by Dunn’s multiple comparison test. The correlation between highest measured brown fat activity per patient and cumulative number of adipose depots with detectable brown fat activity was assessed by calculating Spearman’s rank correlation coefficient.
Propensity score matching and identification of study cohort.
To identify the study cohort, patients with reported BAT were matched to patients without reported BAT using PSM. Propensity scores were estimated using a nonparsimonious multivariable logistic regression model with BAT status (presence or absence) as the dependent variable and age, sex, BMI, and temperature at time of scan as covariates. Matching was performed using a greedy nearest neighbor matching algorithm without replacement, with a caliper width set to 0.2 and a matching ratio of 1:2. This protocol matched every patient with reported BAT to at least one control without reported BAT, and 4,783 individuals were additionally matched to a second control. In total, 287 individuals with BAT were matched to a control that fell outside of the predefined caliper width, and the control was thus not included in the PSM cohort. This resulted in a final study cohort of 14,923 individuals (5,070 with reported BAT and 9,853 without reported BAT). We then used standardized difference means to assess balance before and after matching (Extended Data Fig. 4a). Matching was conducted in SAS version 9.4 (SAS Institute, Cary, NC) using the PSMATCH procedure.
Outcomes.
ICD-9/10 diagnoses extracted from EHRs were used to examine associations between BAT and cardiometabolic health, defined as the prevalence of T2DM, dyslipidemia, hypertension, CAD, CHF and CVD. All ICD-9/10 codes used to assign disease categories are listed in Supplementary Table 11.
Data analysis.
We first assessed the correlation between BAT and age, outdoor temperature in the month of the 18F-FDG PET/CT index scan and BMI. For age and BMI, a one-phase exponential decay curve was modeled, and the correlation was assessed by calculating Spearman’s rank correlation coefficient. For temperature, a linear regression line was calculated, and the correlation was assessed by calculating Spearman’s rank correlation coefficient. Prevalence of BAT in men and women was compared using chi-squared test. Brown adipose status (either present or absent) and prevalence of cardiometabolic diseases were compared using chi-squared tests.
Next, we assessed if usage of antihypertensive drugs or statins or cancer characteristics (cancer site and cancer-specific treatment) were associated with BAT detection on 18F-FDG PET/CT by performing multivariable logistic regression analysis. For antihypertensive drugs, BAT status (present or no 18F-FDG uptake on PET corresponding to adipose tissue on CT) was the dependent variable with antihypertensive drugs as the independent variable, additionally adjusted for age, sex, BMI, outdoor temperature in Central Park in the month of the index scan, race and ethnicity. A similar analysis was conducted for cancer site, with additional adjustment for beta blockers and statins. Lastly, the same analysis that was conducted for cancer site was conducted for cancer treatment, with additional adjustment for cancer site and cancer stage. Next, we assessed whether BAT status was an independent predictor of cardiovascular disease by using multivariable logistic regression analysis. The dependent variable in this analysis was the respective cardiometabolic disease, and BAT status (presence or absence) was the independent variable. To adjust for potential confounders that were selected based on previous publications and our analysis above, we controlled for the following variables: age, sex, BMI, outdoor temperature in Central Park in the month of the index scan, smoking status, race, ethnicity, family history of cardiovascular disease, use of antihypertensives, statin use, cancer site, cancer treatment and cancer stage.
Smoking was coded as a categorical variable with four levels (current smoker, previous smoker, never smoker, unknown smoking status). Race was a categorical variable with four levels: Caucasian, African-American, Asian and other (for example, Pacific-Islanders, unknown). Ethnicity was a categorical variable with three levels: Hispanic, Non-Hispanic and unknown. Antihypertensive drugs were categorized into six different categories: angiotensin-converting enzyme inhibitors, angiotensin receptor blockers, beta blockers, calcium channel blockers, diuretics, and other antihypertensives. Cancer stage was a six-level categorical variable consisting of Stages I-IV, not applicable (for example, hematologic malignancies, benign tumors), and unknown cancer stage. Cancer site was recorded according to ICD-O site codes and included 14 categories: C00-C14, C15-C26, C30-C39, C40-C41, C42, C44, C47-C49, C50-C58, C60-C63, C64-C68, C69-C72, C73-C75, C76-C77/C80 and unknown. Cancer treatments were classified in ten groups: alkylating agents, cancer antibiotics, antimetabolites, hormonal therapy, immunomodulatory therapy, kinase inhibitors, mitotic inhibitors, targeted therapy, radiation therapy and others. Results were reported as ORs and 95% CIs. Cardiometabolic diseases that were independently associated with BAT status were further stratified by BMI categories (normal weight, defined as BMI <25kg m−2; overweight, defined as BMI 25.0 – 30.0 kg m−2; obese, defined as BMI >30.0 kg m−2). Comparison between individuals with and without BAT in the respective category were performed using a chi-squared test. For the comparison of laboratory values, a Student’s t-test was performed. To compare associations between BAT status, BMI and available laboratoru values, a least squares linear regression line was constructed, stratified by BAT status. All P values are two-tailed, and values less than 0.05 were considered statistically significant. As this was an exploratory study, no adjustments for multiple comparisons were performed.
Reporting Summary.
Further information on research design is available in the Nature Research Reporting Summary linked to this article.
Extended Data
Extended Data Fig. 1: Number of 18F-FDG PET/CT scans and brown fat prevalence between 06/2009 – 03/2018.
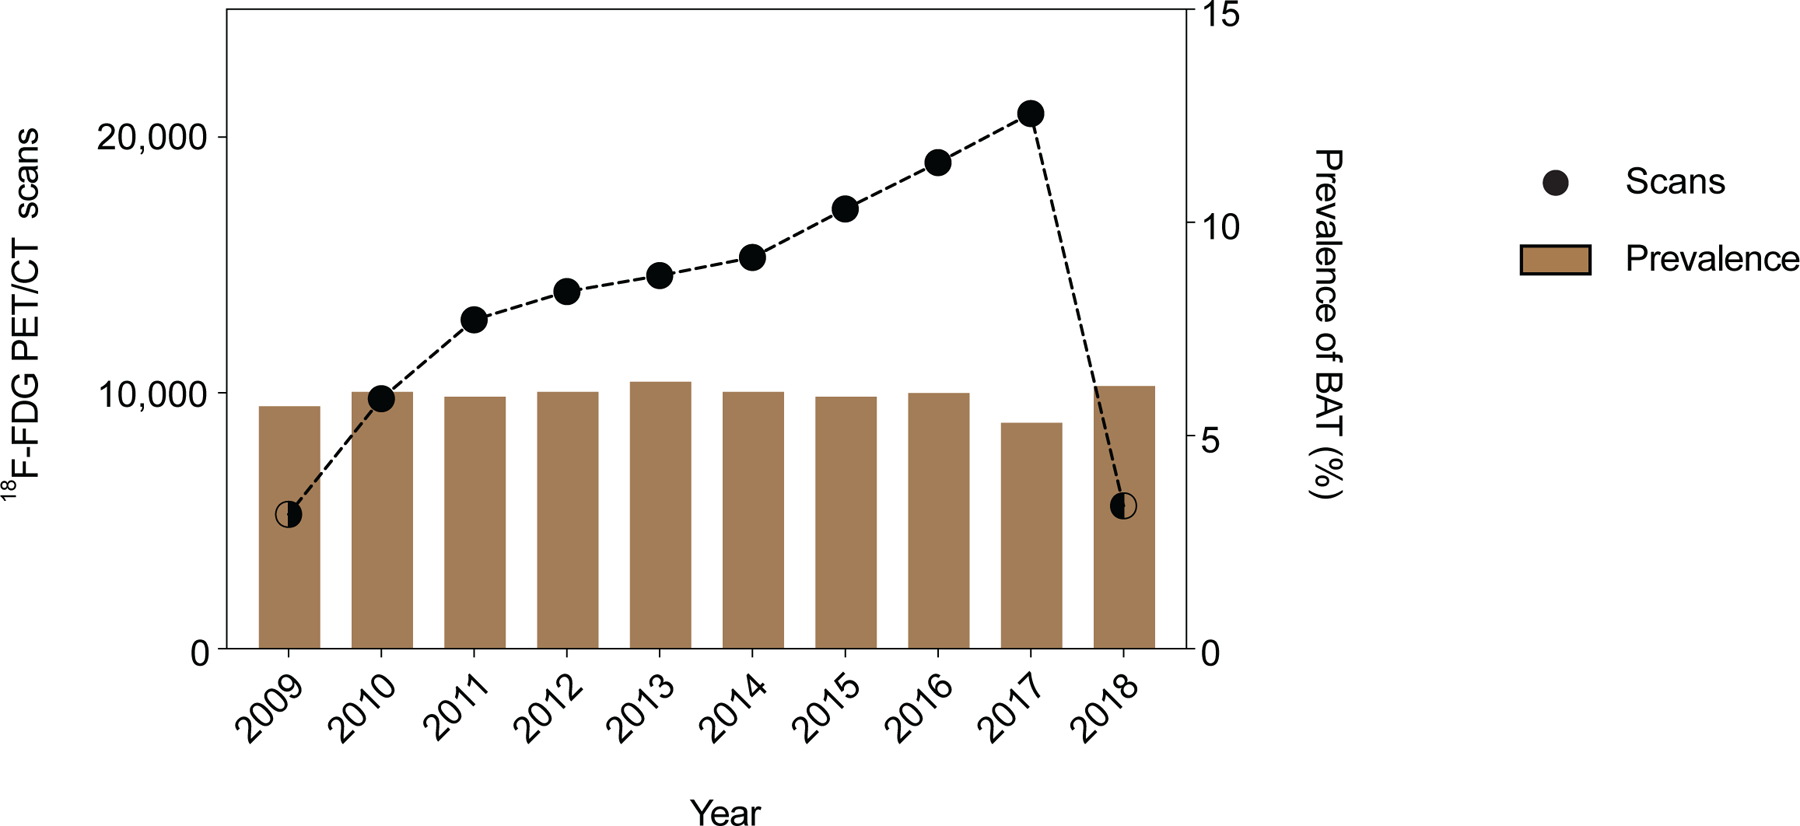
a, The total number of 18F-FDG PET/CT scans performed at MSKCC between 2009 and 2018 and prevalence of reported brown fat. Dots depict total number of 18F-FDG PET/CT scan in each year, half filled dots illustrate years in which only part of the year was analyzed. Bars represent prevalence of 18F-FDG PET/CT scans with reported brown fat.
Extended Data Fig. 2: Correlation between brown fat prevalence and body mass index and outside temperature.
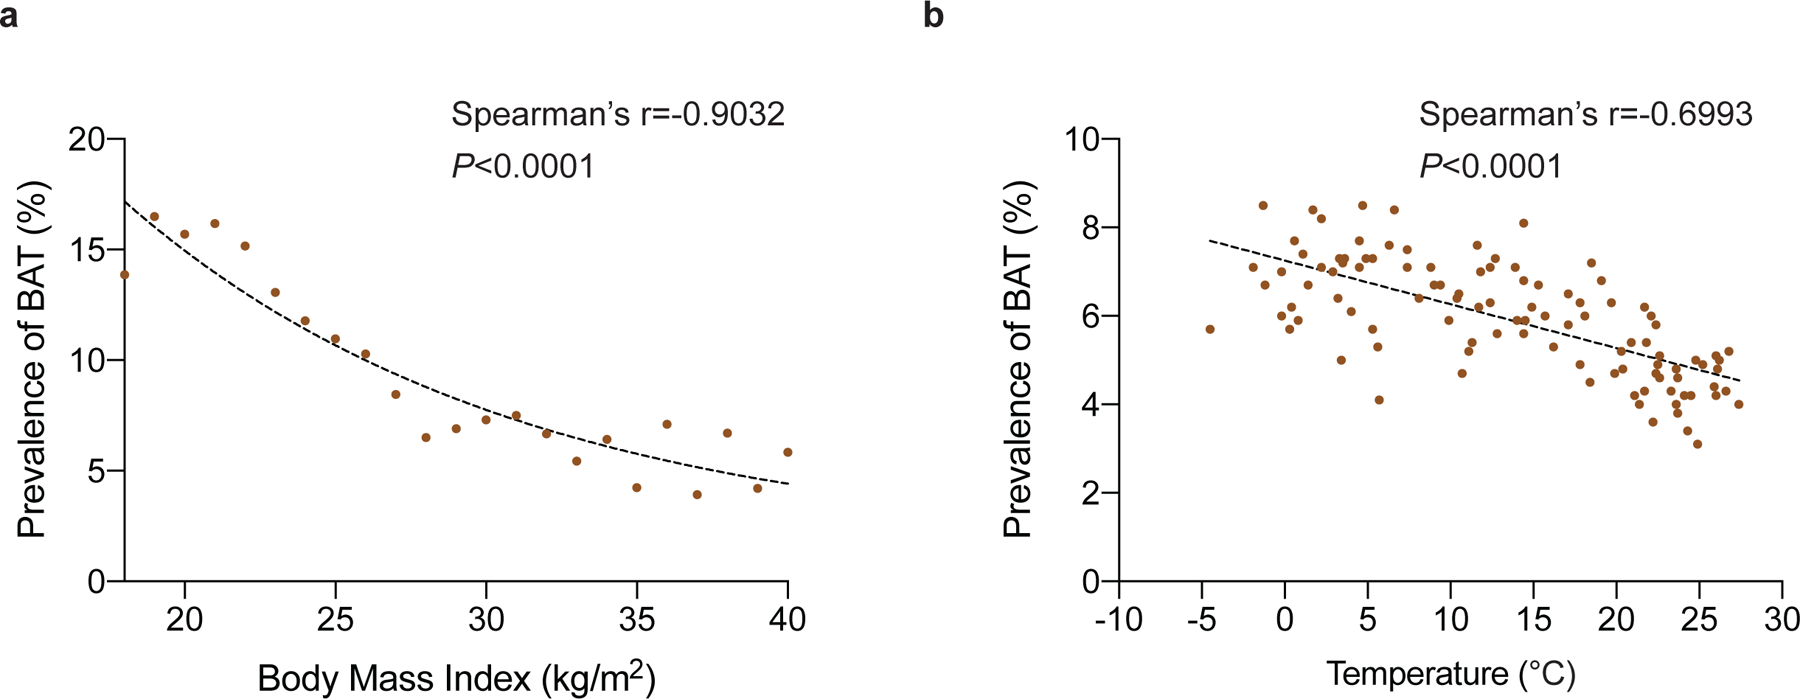
a, Correlation between body mass index and prevalence of brown fat reported on 18F-FDG PET/CT. b, Correlation between outside temperature in the month of the scan and prevalence of brown fat reported on 18F-FDG PET/CT.
Extended Data Fig. 3: Index scan position and cancer treatment.
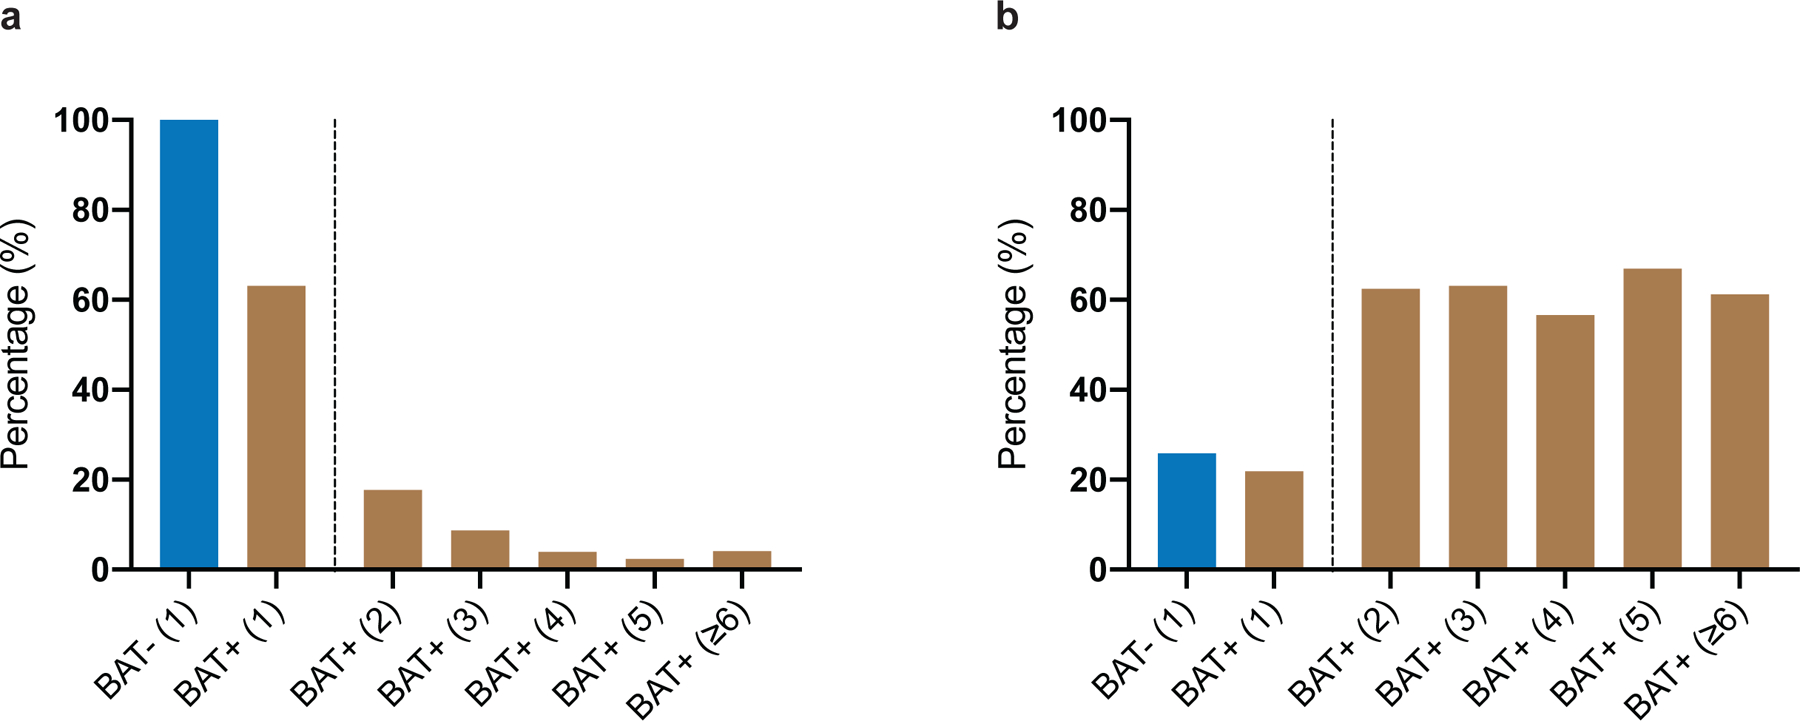
a, Percentage of patients with BAT (BAT+) and without BAT (BAT−) receiving cancer therapy within 90 days of the index scan. Number in parenthesis indicates position of index scan. b, Percentage of patients with BAT (BAT+) and without 18F-FDG uptake on PET in regions corresponding to fat on CT (BAT−) and the position of the index scan depicted in parenthesis.
Extended Data Fig. 4. Standardized mean differences before and after propensity score matching.
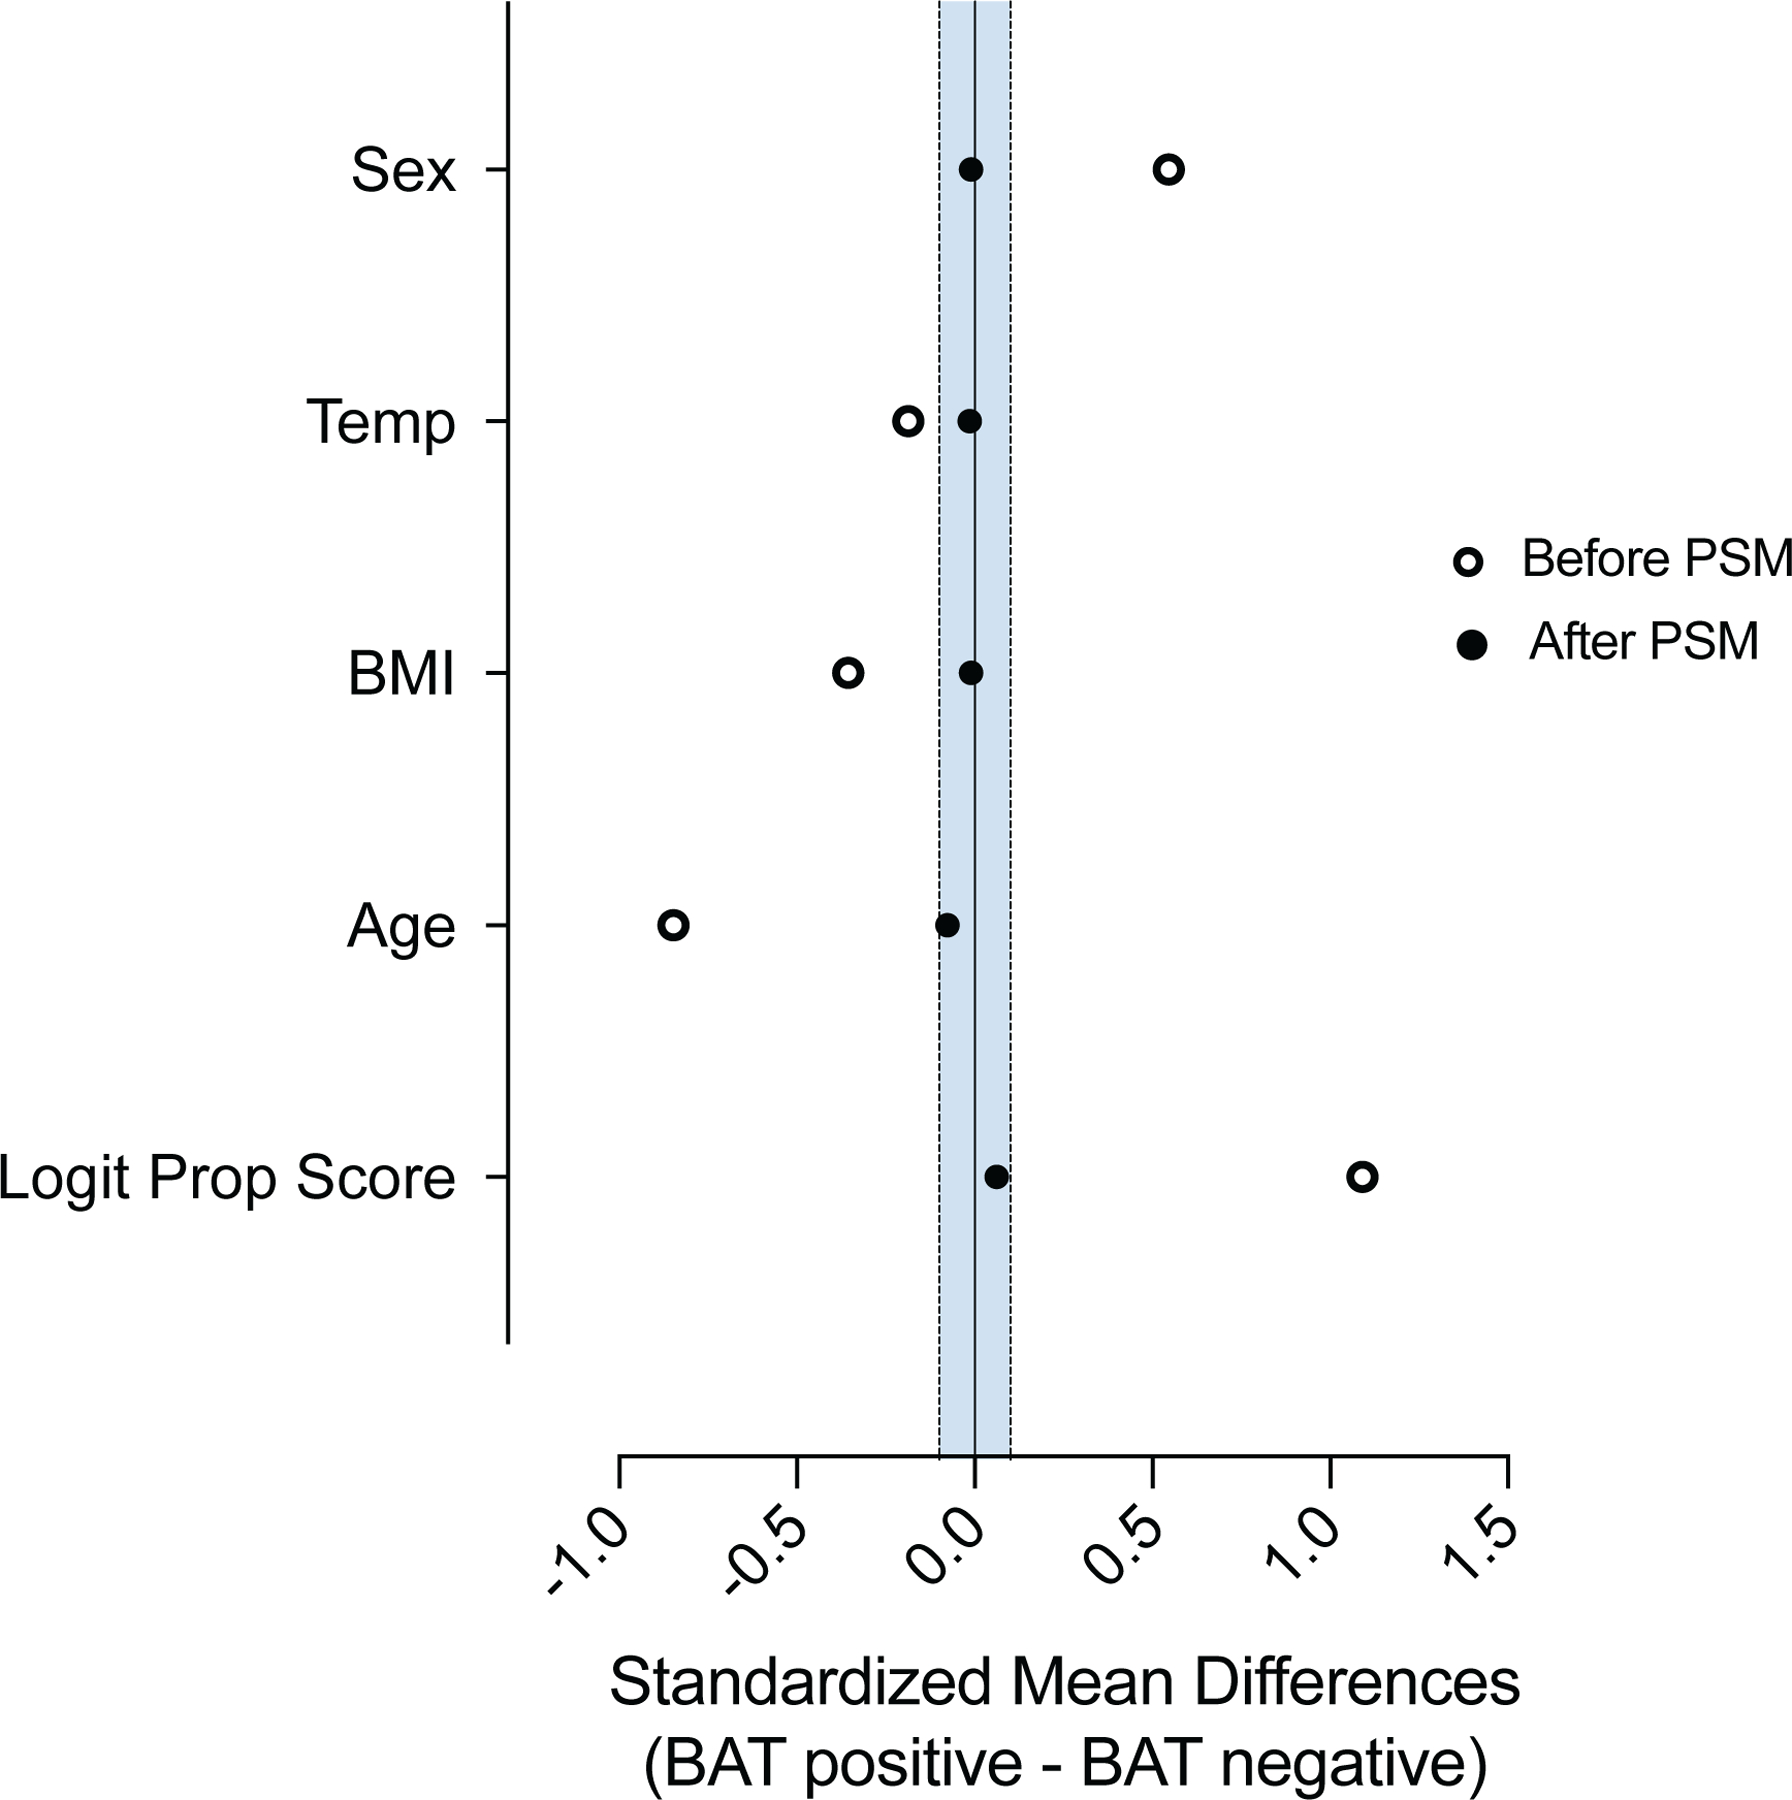
Propensity score matching was assessed by comparing standardized mean differences before and after the matching process. The blue shaded area indicates standardized mean differences between 0.1 and −0.1.
Extended Data Fig. 5: Assocation of brown fat and cardiometabolic disease and additional adjustment for type II diabetes or index scan position.
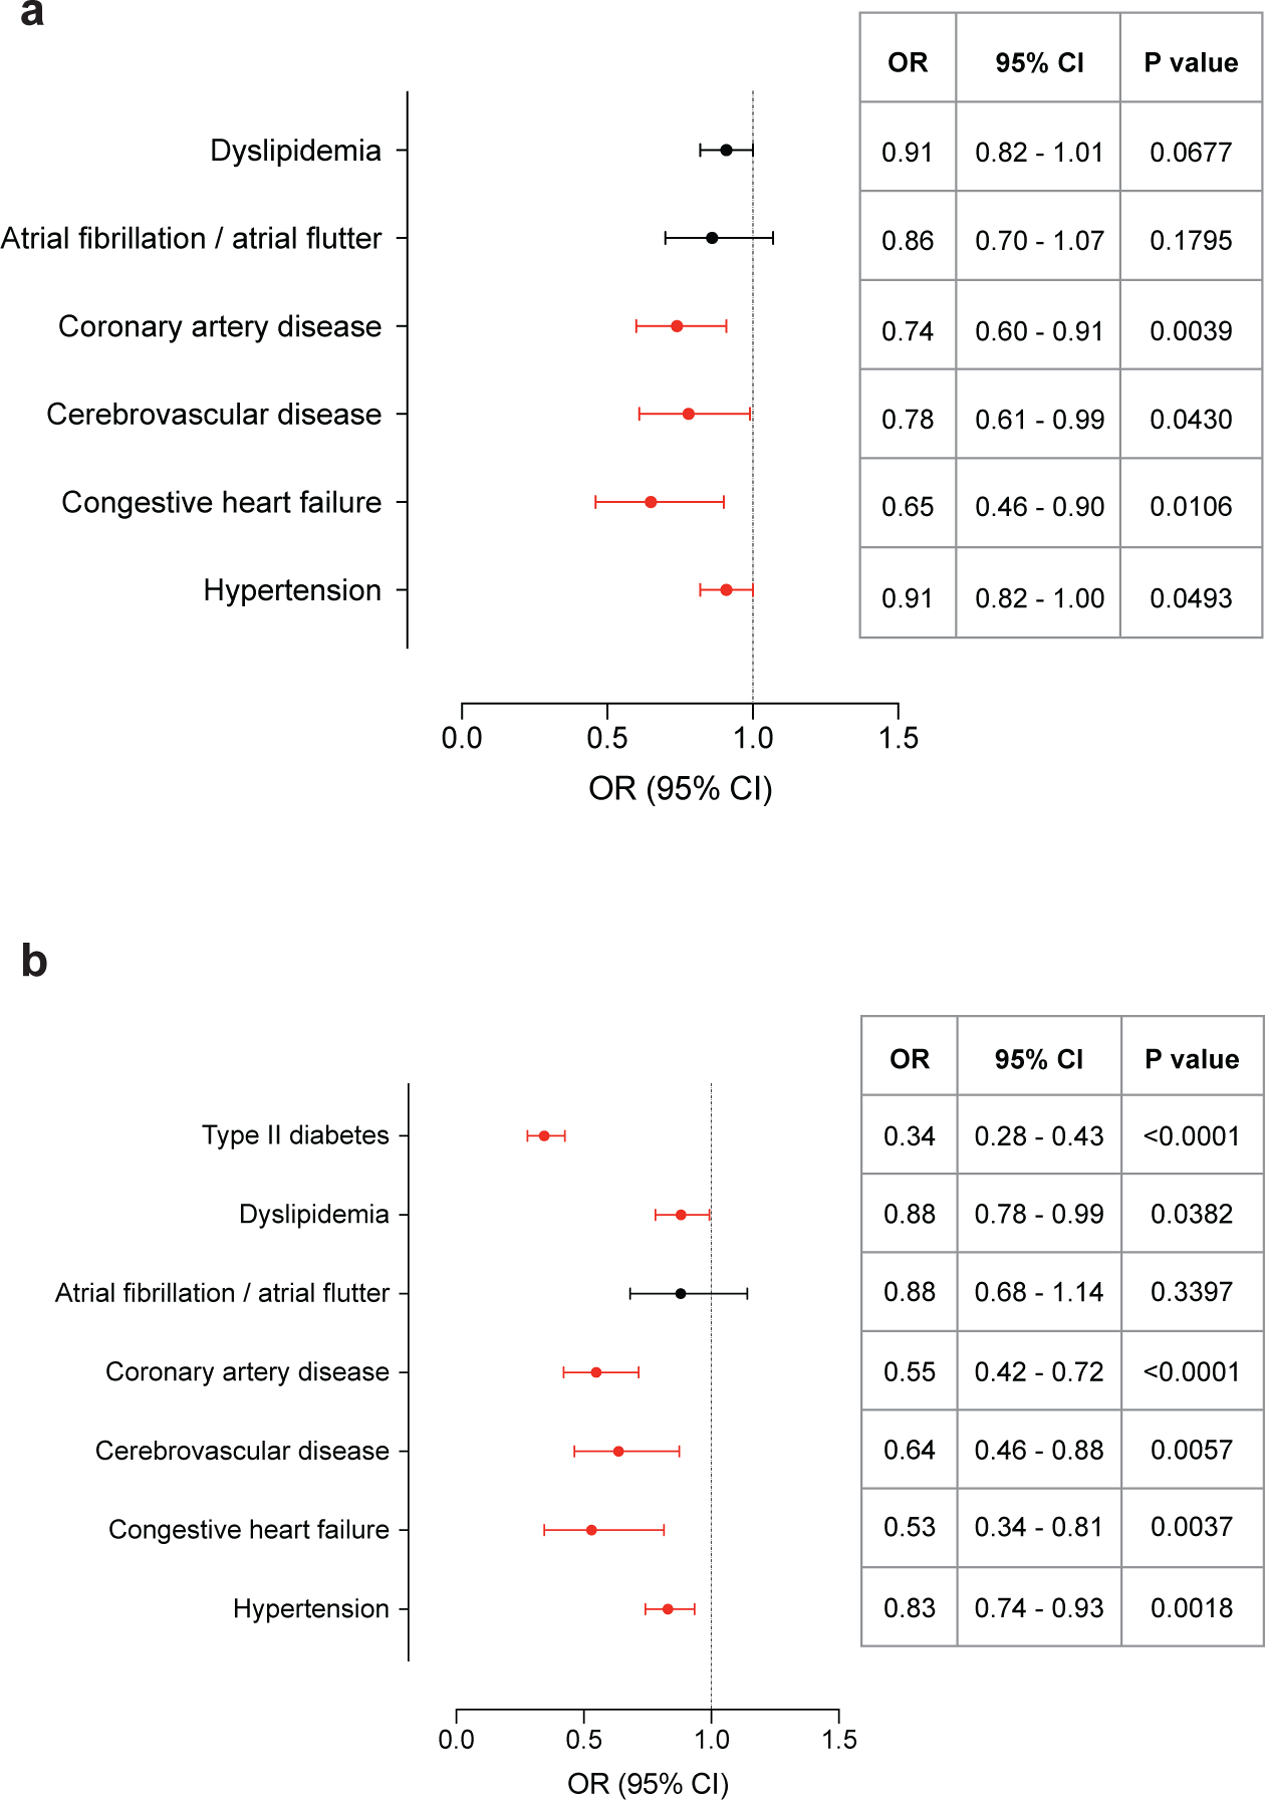
a, Forest plots illustrate the association between brown fat status and cardiometabolic disease in the propensity score matched cohort, with additional adjustment for T2DM. Circles and bars represent odds ratios (ORs) and 95% confidence intervals (CIs) respectively. b, Forest plots illustrate the association between brown fat status and cardiometabolic disease in the propensity score matched cohort, with additional adjustment for index scan position. Circles and bars represent odds ratios (ORs) and 95% confidence intervals (CIs), respectively.
Extended Data Fig. 6: Association of brown fat and cardiometabolic disease in the entire cohort.
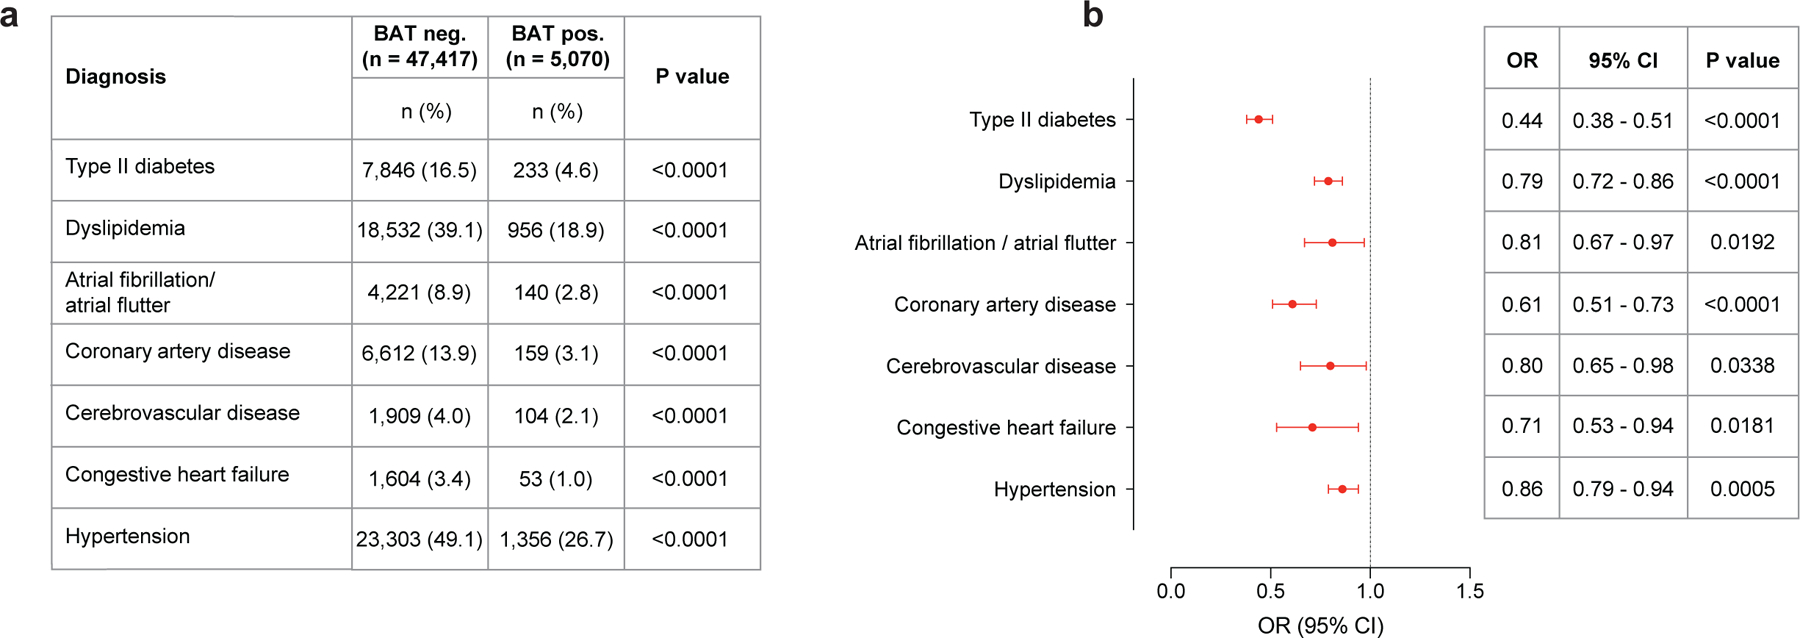
a, Association between brown fat and cardiometabolic disease in the entire study cohort. b, Forest plots illustrate the association between brown fat status and cardiometabolic disease in the entire study cohort. Circles and bars represent odds ratios (ORs) and 95% confidence intervals (CIs), respectively.
Extended Data Fig. 7: Examples of 18F-FDG uptake on PET in regions corresponding to adipose tissue on CT in patients with cancers of the head and neck.
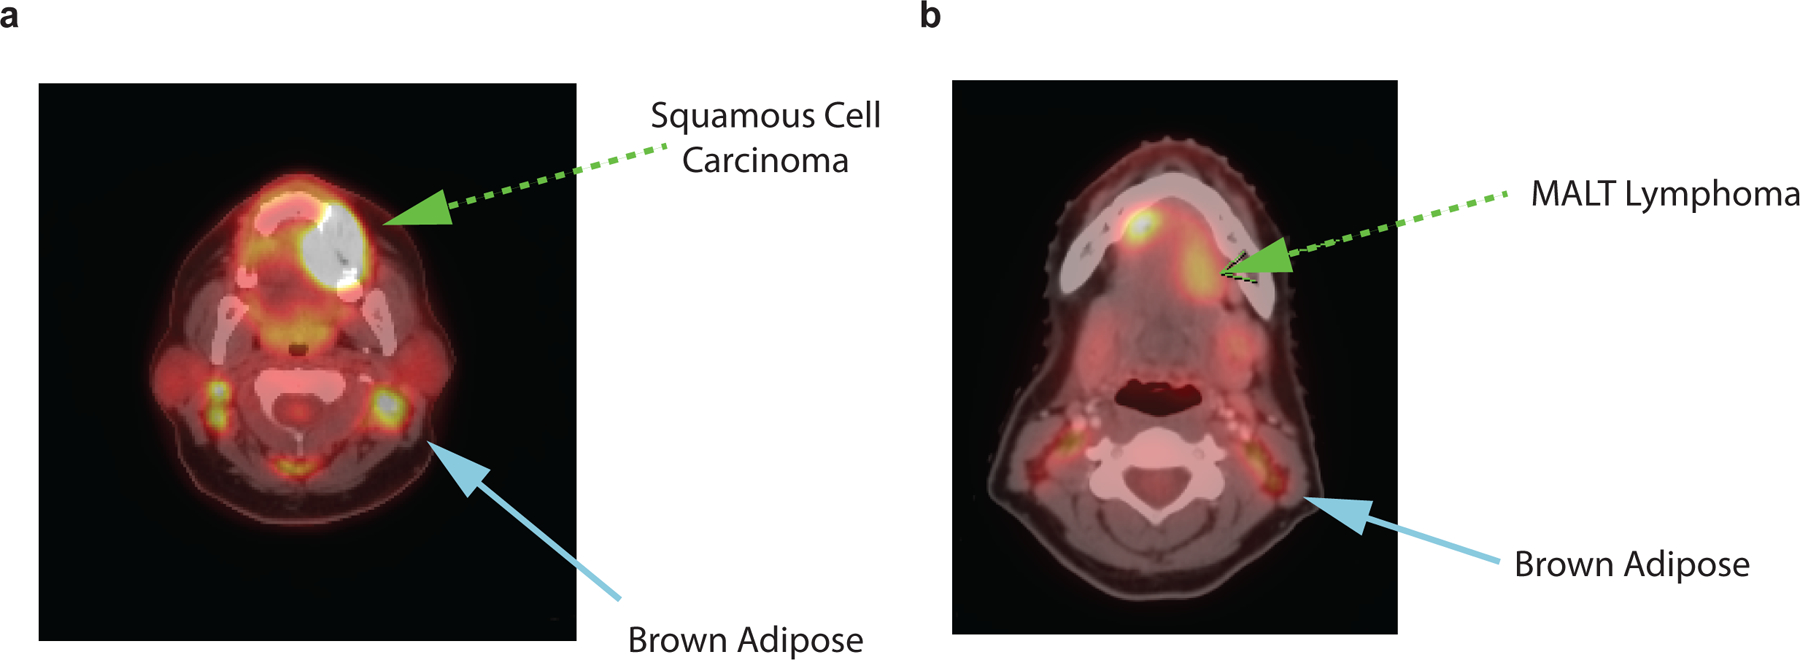
a, 52-year old, female patient with keratinizing squamous cell carcinoma of the gums (green arrow). 18F-FDG PET/CT indicated for cancer staging. Symmetrical, bilateral 18F-FDG uptake on PET in cervical regions corresponding to adipose tissue on CT (blue arrow). b, 34-year old, female patient with marginal zone B-cell lymphoma of the mouth floor, initial staging scan (green arrow). 18F-FDG PET/CT indicated for cancer staging. Symmetrical, bilateral 18F-FDG uptake on PET in cervical regions corresponding to adipose tissue on CT (blue arrow).
Supplementary Material
Acknowledgements
We thank M. N. Singer and C. Poon for expert IT support and data extraction; R. Teng for assistance in accessing data, and B.S. Coller, A.J. Dannenberg, J.J. Moslehi and M.D. Curtis for valuable discussions during the preparation of this manuscript. T.B. was supported in part by the National Center for Advancing Translational Sciences, NIH, through The Rockefeller University (Grant UL1TR001866). P.C. was supported by the Sinsheimer Foundation and by the American Diabetes Association Pathway Program Accelerator Award (grant 1-17-ACE-17).
Footnotes
Competing Interest Statement
The authors declare no competing interests.
Data Availability
Average monthly temperatures in Central Park were obtained from the National Weather Service at https://www.weather.gov/media/okx/Climate/CentralPark/monthlyannualtemp.pdf.
Anonymized clinical data are available upon request, subject to an internal review by T.B., P.C., A.G.W. and H.S. to ensure that the participants’ anonymity and confidentiality are protected and completion of a data sharing agreement, and in accordance with the Rockefeller University and Memorial Sloan Kettering Cancer Center Institutional Review Board and Institutional Guidelines. Source data are provided with this paper.
References
- 1.Bartelt A, et al. Brown adipose tissue activity controls triglyceride clearance. Nat. Med 17, 200–205 (2011). [DOI] [PubMed] [Google Scholar]
- 2.Seale P, et al. Prdm16 determines the thermogenic program of subcutaneous white adipose tissue in mice. J. Clin. Investig 121, 96–105 (2011). [DOI] [PMC free article] [PubMed] [Google Scholar]
- 3.Cohade C, Osman M, Pannu HK & Wahl RL Uptake in supraclavicular area fat (“USA-Fat”): Description on 18F-FDG PET/CT. J. Nucl. Med 44, 170–176 (2003). [PubMed] [Google Scholar]
- 4.van Marken Lichtenbelt WD, et al. Cold-activated brown adipose tissue in healthy men. N. Engl. J. Med 360, 1500–1508 (2009). [DOI] [PubMed] [Google Scholar]
- 5.Virtanen KA, et al. Functional brown adipose tissue in healthy adults. N. Engl. J. Med 360, 1518–1525 (2009). [DOI] [PubMed] [Google Scholar]
- 6.Cypess AM, et al. Identification and importance of brown adipose tissue in adult humans. N. Engl. J. Med 360, 1509–1517 (2009). [DOI] [PMC free article] [PubMed] [Google Scholar]
- 7.Yoneshiro T, et al. Brown adipose tissue, whole-body energy expenditure, and thermogenesis in healthy adult men. Obesity (Silver Spring) 19, 13–16 (2011). [DOI] [PubMed] [Google Scholar]
- 8.Orava J, et al. Different metabolic responses of human brown adipose tissue to activation by cold and insulin. Cell Metab 14, 272–279 (2011). [DOI] [PubMed] [Google Scholar]
- 9.Cronin CG, et al. Brown fat at PET/CT: Correlation with patient characteristics. Radiology 263, 836–842 (2012). [DOI] [PubMed] [Google Scholar]
- 10.Steinberg JD, Vogel W & Vegt E Factors influencing brown fat activation in FDG PET/CT: A retrospective analysis of 15,000+ cases. Br. J. Radiol 90, 20170093 (2017). [DOI] [PMC free article] [PubMed] [Google Scholar]
- 11.Chen KY, et al. Brown Adipose Reporting Criteria in Imaging STudies (BARCIST 1.0): Recommendations for standardized FDG-PET/CT experiments in humans. Cell Metab 24, 210–222 (2016). [DOI] [PMC free article] [PubMed] [Google Scholar]
- 12.Becker AS, Nagel HW, Wolfrum C & Burger IA Anatomical grading for metabolic activity of brown adipose tissue. PLoS ONE 11, e0149458 (2016). [DOI] [PMC free article] [PubMed] [Google Scholar]
- 13.Cao Q, et al. A pilot study of FDG PET/CT detects a link between brown adipose tissue and breast cancer. BMC Cancer 14, 126 (2014). [DOI] [PMC free article] [PubMed] [Google Scholar]
- 14.Balaz M, et al. Inhibition of mevalonate pathway prevents adipocyte browning in mice and men by affecting protein prenylation. Cell Metab 29, 901–916 e908 (2019). [DOI] [PubMed] [Google Scholar]
- 15.Gadea E, et al. Brown adipose tissue activity in relation to weight gain during chemotherapy in breast cancer patients: A pilot study. Nutr. Cancer 66, 1092–1096 (2014). [DOI] [PubMed] [Google Scholar]
- 16.Ginzac A, et al. A decrease in brown adipose tissue activity is associated with weight gain during chemotherapy in early breast cancer patients. BMC Cancer 20, 96 (2020). [DOI] [PMC free article] [PubMed] [Google Scholar]
- 17.Brendle C, et al. Impact of diverse chemotherapeutic agents and external factors on activation of brown adipose tissue in a large patient collective. Scientific reports 9, 1901 (2019). [DOI] [PMC free article] [PubMed] [Google Scholar]
- 18.Hoeke G, et al. Role of brown fat in lipoprotein metabolism and atherosclerosis. Circ. Res 118, 173–182 (2016). [DOI] [PubMed] [Google Scholar]
- 19.Blondin DP, et al. Selective impairment of glucose but not fatty acid or oxidative metabolism in brown adipose tissue of subjects with type 2 diabetes. Diabetes 64, 2388–2397 (2015). [DOI] [PubMed] [Google Scholar]
- 20.Dieli-Conwright CM, et al. An observational study to examine changes in metabolic syndrome components in patients with breast cancer receiving neoadjuvant or adjuvant chemotherapy. Cancer 122, 2646–2653 (2016). [DOI] [PMC free article] [PubMed] [Google Scholar]
- 21.Ward ZJ, et al. Projected U.S. State-level prevalence of adult obesity and severe obesity. N. Engl. J. Med 381, 2440–2450 (2019). [DOI] [PubMed] [Google Scholar]
- 22.Hanssen MJ, et al. Short-term cold acclimation improves insulin sensitivity in patients with type 2 diabetes mellitus. Nat. Med 21, 863–865 (2015). [DOI] [PubMed] [Google Scholar]
- 23.Chondronikola M, et al. Brown adipose tissue activation is linked to distinct systemic effects on lipid metabolism in humans. Cell Metab 23, 1200–1206 (2016). [DOI] [PMC free article] [PubMed] [Google Scholar]
- 24.Yoneshiro T, et al. Recruited brown adipose tissue as an antiobesity agent in humans. J. Clin. Invest 123, 3404–3408 (2013). [DOI] [PMC free article] [PubMed] [Google Scholar]
- 25.Blondin DP, et al. Contributions of white and brown adipose tissues and skeletal muscles to acute cold-induced metabolic responses in healthy men. The Journal of physiology 593, 701–714 (2015). [DOI] [PMC free article] [PubMed] [Google Scholar]
- 26.M, U.D., et al. Human brown adipose tissue [(15)O]O2 pet imaging in the presence and absence of cold stimulus. Eur. J. Nucl. Med. Mol. Imaging 43, 1878–1886 (2016). [DOI] [PMC free article] [PubMed] [Google Scholar]
- 27.Blondin DP, et al. Dietary fatty acid metabolism of brown adipose tissue in cold-acclimated men. Nature communications 8, 14146 (2017). [DOI] [PMC free article] [PubMed] [Google Scholar]
- 28.Liu X, et al. Brown adipose tissue transplantation improves whole-body energy metabolism. Cell Res 23, 851–854 (2013). [DOI] [PMC free article] [PubMed] [Google Scholar]
- 29.Feldmann HM, Golozoubova V, Cannon B & Nedergaard J UCP1 ablation induces obesity and abolishes diet-induced thermogenesis in mice exempt from thermal stress by living at thermoneutrality. Cell Metab 9, 203–209 (2009). [DOI] [PubMed] [Google Scholar]
- 30.Muzik O, Mangner TJ & Granneman JG Assessment of oxidative metabolism in brown fat using PET imaging. Frontiers in endocrinology 3, 15 (2012). [DOI] [PMC free article] [PubMed] [Google Scholar]
- 31.Blondin DP, et al. Inhibition of intracellular triglyceride lipolysis suppresses cold-induced brown adipose tissue metabolism and increases shivering in humans. Cell Metab 25, 438–447 (2017). [DOI] [PubMed] [Google Scholar]
- 32.Villarroya F, Cereijo R, Villarroya J & Giralt M Brown adipose tissue as a secretory organ. Nat Rev Endocrinol 13, 26–35 (2017). [DOI] [PubMed] [Google Scholar]
- 33.Berbee JF, et al. Brown fat activation reduces hypercholesterolaemia and protects from atherosclerosis development. Nature communications 6, 6356 (2015). [DOI] [PMC free article] [PubMed] [Google Scholar]
- 34.Hoeke G, et al. Short-term cooling increases serum triglycerides and small high-density lipoprotein levels in humans. Journal of clinical lipidology 11, 920–928 e922 (2017). [DOI] [PubMed] [Google Scholar]
- 35.O’Mara AE, et al. Chronic mirabegron treatment increases human brown fat, HDL cholesterol, and insulin sensitivity. J. Clin. Invest (2020). [DOI] [PMC free article] [PubMed] [Google Scholar]
- 36.Raiko J, Orava J, Savisto N & Virtanen KA High brown fat activity correlates with cardiovascular risk factor levels cross-sectionally and subclinical atherosclerosis at 5-year follow-up. Arterioscler. Thromb. Vasc. Biol 40, 1289–1295 (2020). [DOI] [PubMed] [Google Scholar]
- 37.Finlin BS, et al. The beta3-adrenergic receptor agonist mirabegron improves glucose homeostasis in obese humans. J. Clin. Invest (2020). [DOI] [PMC free article] [PubMed] [Google Scholar]
- 38.Yarnell JW, et al. Fibrinogen, viscosity, and white blood cell count are major risk factors for ischemic heart disease. The Caerphilly and Speedwell collaborative heart disease studies. Circulation 83, 836–844 (1991). [DOI] [PubMed] [Google Scholar]
- 39.Langenberg C & Lotta LA Genomic insights into the causes of type 2 diabetes. Lancet 391, 2463–2474 (2018). [DOI] [PubMed] [Google Scholar]
References (method section)
- 40.von Elm E, et al. The Strengthening the Reporting of Observational Studies in Epidemiology (STROBE) Statement: Guidelines for reporting observational studies. Lancet 370, 1453–1457 (2007). [DOI] [PubMed] [Google Scholar]
- 41.Leitner BP, et al. Mapping of human brown adipose tissue in lean and obese young men. Proc. Natl. Acad. Sci. U. S. A 114, 8649–8654 (2017). [DOI] [PMC free article] [PubMed] [Google Scholar]
Associated Data
This section collects any data citations, data availability statements, or supplementary materials included in this article.
Supplementary Materials
Data Availability Statement
Average monthly temperatures in Central Park were obtained from the National Weather Service at https://www.weather.gov/media/okx/Climate/CentralPark/monthlyannualtemp.pdf.
Anonymized clinical data are available upon request, subject to an internal review by T.B., P.C., A.G.W. and H.S. to ensure that the participants’ anonymity and confidentiality are protected and completion of a data sharing agreement, and in accordance with the Rockefeller University and Memorial Sloan Kettering Cancer Center Institutional Review Board and Institutional Guidelines. Source data are provided with this paper.


