

Keywords: adipose tissue, insulin resistance, iron handling, macrophages, obesity
Abstract
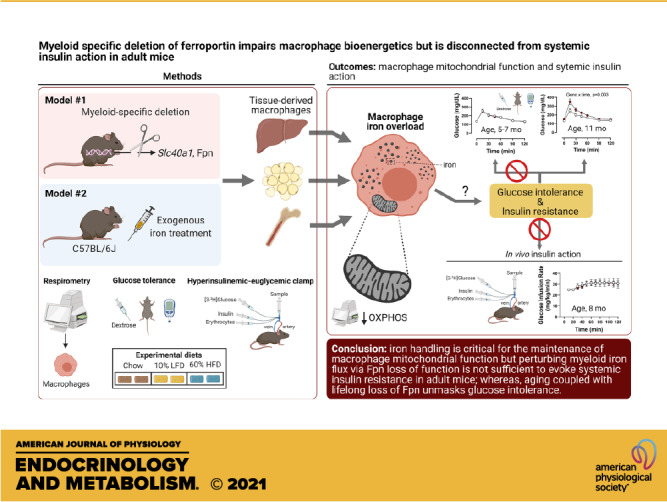
Tissue iron overload is associated with insulin resistance and mitochondrial dysfunction in rodents and humans; however, the mechanisms or cell types that mediate this phenotype are not completely understood. Macrophages (Mɸs) are known to contribute to iron handling; thus, we hypothesized that perturbed iron handling by Mɸs impairs mitochondrial energetics and evokes systemic insulin resistance in mice. Male and female mice with myeloid-targeted (LysMCre) deletion of the canonical iron exporter, ferroportin (Fpn, encoded by Slc40a1), floxed littermates, and C57BL/6J wild-type mice were used to test our hypotheses. Myeloid-targeted deletion of Fpn evoked multitissue iron accumulation and reduced mitochondrial respiration in bone marrow-derived Mɸs, liver leukocytes, and Mɸ-enriched populations from adipose tissue (AT). In addition, a single bolus of exogenous iron administered to C57BL/6J mice phenocopied the loss of Fpn, resulting in a reduction in maximal and mitochondrial reserve capacity in Mɸ-enriched cellular fractions from liver and AT. In vivo exogenous iron chelation restored mitochondrial reserve capacity in liver leukocytes from Fpn LysMCre mice, but had no effect in AT myeloid populations. However, despite the impairments in mitochondrial respiration, neither loss of myeloid-specific Fpn nor exogenous iron overload perturbed glucose homeostasis or systemic insulin action in lean or obese mice, whereas aging coupled with lifelong loss of Fpn unmasked glucose intolerance. Together these data demonstrate that iron handling is critical for the maintenance of macrophage mitochondrial function, but perturbing myeloid iron flux via the loss of Fpn action is not sufficient to evoke systemic insulin resistance in young adult mice. These findings also suggest that if Mɸs are capable of storing iron properly, they have a pronounced ability to withstand iron excess without evoking overt collateral damage and associated insulin resistance that may be age dependent.
NEW & NOTEWORTHY We used myeloid-specific knockout of ferroportin to determine whether macrophage iron enrichment alters systemic metabolism. We found that macrophages in several tissues showed mitochondrial defects such as a reduction in mitochondrial reserve capacity. However, insulin action in the mice was preserved. These findings also suggest that Mɸs have a pronounced ability to withstand iron excess without evoking overt collateral damage and associated insulin resistance, which appears to be age dependent.
INTRODUCTION
Iron overload is detrimental to health, leading to adverse manifestations in multiple tissues including the heart, liver, adipose, brain, muscle, and pancreas, and it is implicated in the pathogenesis of several metabolic diseases (e.g., type 2 diabetes and nonalcoholic steatohepatitis) (1–4). Supporting a direct role of iron in metabolic risk, phlebotomy improves insulin sensitivity in patients with hereditary hemochromatosis (5, 6) and iron chelation improves insulin action in humans (4, 7) and mice (8) with established insulin resistance and type 2 diabetes. The maintenance of tissue and cellular iron levels that are sufficient to meet iron demand but that do not exceed the capacity for appropriate storage requires precise control of intracellular and extracellular iron fluxes. This is achieved by a network of proteins that regulate iron absorption, storage, recycling, and utilization at the systemic and cellular level. Macrophages (Mɸ)s play a fundamental role in regulating systemic iron flux and specific subsets, such as splenic red pulp Mɸs are critical for maintaining iron availability for erythropoiesis (9, 10).
Tissue Mɸs are highly plastic in response to changes to their local environment (11), requiring rapid polarization on a spectrum from M1-like proinflammatory to M2-like tissue repair phenotypes (12–15). In addition to polarization plasticity, it has been proposed that some tissue Mɸs function as “ferrostats,” sensing and responding to local tissue iron needs, in turn regulating the tissue microenvironment (10). Data suggest that iron-handling Mɸs prioritize iron uptake and release to inert storage (16, 17) and have high expression of iron importers and the canonical mammalian iron exporter, ferroportin (Fpn, encoded by Slc40a1) (9, 18–20). Fpn is critical in maintaining tissue iron needs via iron efflux and is thus necessary for local iron recycling (21, 22). For example, following tissue injury, local iron-handling Mɸs buffer parenchymal cells from the toxic effects of excess iron, while later supplying necessary iron upon the tissue’s reparative needs such as proliferation. Deletion of Fpn in myeloid cells disrupts wound healing and skin repair in mice by impairing iron flux through Mɸs (23). The relationship between Mɸ iron sequestration versus iron donation parallels M1 to M2 transition during the well-established tissue injury-to-repair paradigm (24).
Previous research suggests that both cellular iron deficiency and iron overload impair mitochondrial function in rat hepatocytes (25), indicating that tight control of cellular iron flux is necessary to preserve mitochondrial homeostasis. Mitochondrial iron depletion was shown to evoke a bioenergetic shift from aerobic mitochondrial oxidation to anaerobic glycolysis and increased lactate production in primary human cardiac myocytes (26) and in primary human macrophages (27). In addition, a mouse model of hereditary hemochromatosis manifests with glucose intolerance and decreased mitochondrial respiratory capacity (28, 29). These studies suggest an interaction between cellular iron handling, cellular metabolism, and glycemic control.
It is known that tissue Mɸs sequester iron in response to exogenous iron load, which appears to maintain tissue function (30). However, the tipping point whereby Mɸs can no longer maintain immune function in face of iron overload, resulting in collateral tissue dysfunction, is unclear. In this context, it is not known whether forced Mɸ iron overload in tissue macrophages precipitates insulin resistance and whether this is linked with mitochondrial dysfunction. Accordingly, in this study, we aimed to interrogate whether perturbed iron handling in Mɸ-enriched cells (e.g., myeloid lineage) impairs intrinsic mitochondrial function and consequently decreases whole body insulin sensitivity in mice. We hypothesized that loss of Mɸ iron handling increases inflammation and attenuates oxidative metabolism in Mɸs. Prior findings reveal that myeloid-specific deletion of ferritin heavy isoform and subsequent decrease in cellular iron attenuates Mɸ inflammation and obesity-associated glucose intolerance in mice (31). Thus, we further postulated that myeloid-targeted deletion of Fpn resulting in iron excess would cause insulin resistance, which would be exacerbated with high-fat diet (HFD) feeding in mice. We report that myeloid loss of Fpn impairs mitochondrial respiratory capacity in tissue Mɸs but does not evoke insulin resistance in lean or obese mice, whereas aging coupled with lifelong loss of Fpn unmasks glucose intolerance. This suggests that if Mɸs are capable of storing iron properly, they have a pronounced ability to largely withstand iron excess without evoking overt collateral damage and associated insulin resistance.
METHODS
Animals
Fpn flox/flox (Fpnfl/fl) mice were generously gifted by Dr. Donald A. McClain. This mouse line was originally generated by Dr. Nancy C. Andrews as previously detailed (22) and is currently available for purchase via Jackson Laboratory (Cat. No. 017790). Fpnfl/fl mice were backcrossed for more than 10 generations onto the C67BL/6J background in our laboratory. Fpnfl/fl mice contain LoxP sites flanking exon 6 and 7 of the ferroportin locus. Male and female Fpnfl/fl mice were bred to mice that express Cre recombinase under control of the Lyz2 promoter [LysMCre (Jackson Laboratory, Cat. No. 018956)] with resulting offspring having exons 6 and 7 of the Fpn locus deleted in Lyz2 (myeloid)-expressing cells (FpnLysMCre). Sex-matched littermates without Cre expression were used as controls. At 10 wk of age, mice were randomized to a 10% low-fat diet (LFD) or 60% high-fat diet (HFD) for a duration of 25 wk. Both diets were purchased from Research Diets (HFD: D12492, 5.21 kcal/g food; LFD: D12450B, 3.82 kcal/g food; New Brunswick, NJ). For some experiments, mice were kept on rodent chow (Laboratory Rodent Diet 5001*, Laboratory Diet), as indicated in figure legends. All mice were fed ad libitum, given free access to water, and housed 3–4 mice per cage at room temperature. All animal procedures were performed with approval from the Institutional Animal Care and Use Committee of Vanderbilt University.
In Vivo Iron Injections and Iron Chelation
For exogenous iron injection studies, male C57BL/6J mice were purchased from Jackson Laboratory (Bar Harbor, ME) at 11 wk of age and housed in the animal facility at Vanderbilt University for 1 wk to acclimate. At 12 wk of age, mice were injected intraperitoneally with iron dextran-100 (Durvet, 5 mg iron/kg body weight) and were euthanized 1 wk later. The control group was injected with an equivalent volume of saline. In another experiment, a group of Fpnfl/fl and FpnLysMcre mice received a single intraperitoneal iron injection as described above. At 10 wk of age, Fpnfl/fl and FpnLysMcre mice were placed on LFD or HFD for a total duration of 6 wk. At 15 wk of age, mice received either iron dextran injection or saline and were euthanized 1 wk thereafter. The iron chelator, deferoxamine (DFO), was used for in vivo chelation studies. Fpnfl/fl and FpnLysMcre mice received total three intraperitoneal DFO (100 mg/kg body wt) or saline injections over the course of three consecutive days (1 injection/day) and animals were euthanized on the fourth day.
Glucose Tolerance Testing
Mice were fasted for 6 h, and basal blood glucose levels were measured (−10 min) before intraperitoneal administration of 2.0 g dextrose/kg lean body mass. Blood glucose was sampled via tail cut at 15, 30, 45, 60, 90, and 120 min after injection using a handheld glucometer (Bayer Contour Next EZ meter). Plasma insulin was determined in a subset of animals at baseline (−10 min) and 5 min after dextrose injection (2.0 g dextrose/kg body mass) via radioimmunoassay (VUMC Hormone Assay and Analytical Services Core, Vanderbilt University, Nashville, TN). Glucose total area under curve was calculated using the trapezoidal rule.
Blood Biochemistry
Plasma nonesterified fatty acids (NEFA; Wako HR series NEFA-HR, FUJIFILM Wako Diagnostics U.S.A.), triglycerides (L-Type TG M; FUJIFILM Wako Diagnostics U.S.A.), and cholesterol (RAICHEM; Cat. No. R80015, CLINIQA) were determined using commercial reagents according to manufacturer’s instructions.
Body Composition
Mouse body fat and lean mass were measured by a nuclear magnetic resonance whole body composition analyzer (Bruker Minispec).
Cell Isolation and Flow Cytometry
After mice were euthanized, epididymal adipose tissue (AT), liver, spleen, and thymus were excised and minced into fine pieces in a 1% FBS 1× PBS solution. Minced tissues were digested with 2 mg/mL type II collagenase for 30 min at 37°C, followed by centrifugation at 200 rpm rotation (MaxQ4450, Thermo Fisher Scientific, Middletown, VA). PBS with 1% FBS solution was added to dilute the collagenase solution fourfold. The diluted collagenase solution was vortexed and passed through a 100-μm filter with a rubber plunger. After centrifugation, cell pellets were treated with ammonium-chloride-potassium (ACK) lysis buffer to lyse red blood cells. Reaction was neutralized in AT, spleen, and thymus by dilution with 1% FBS in PBS. Cells were centrifuged, and supernatant was decanted; cell pellet was resuspended and used for further analysis. After red blood cell lysis, liver pellets were resuspended in 30% Percoll containing phenol red. The 30% Percoll was layered on top of 70% Percoll and topped with HBSS. Samples were spun at 600 g for 15 min at 20°C without deceleration. After centrifugation, the interface layer containing leukocytes was carefully transferred to a 15-mL tube containing HBSS (20 mM HEPES), agitated, centrifuged, and decanted. The leukocyte cell pellet was reconstituted with prewarmed DMEM (10% FBS, 10 mM glucose, 2 mM glutamine) and transferred to Seahorse assay plates at 37°C.
Blood cell isolation.
Approximately 200 μL of retro-orbital blood was collected via capillary tubes and transferred to EDTA-coated tubes. Blood was diluted with 2-mL deionized water in a 15-mL conical tube and mixed by inverting for 15 s to lyse red blood cells. Reaction was neutralized by dilution with 10-mL 1% FBS in PBS, centrifuged, and decanted; cell pellet was resuspended and used for further analysis.
Flow cytometry.
Cell suspensions from spleen, thymus, and blood were treated with anti-CD16/32 blocking antibodies (FC block; BD Biosciences) for 10 min and then stained with fluorophore-conjugated antibodies (all anti-mouse antibodies were purchased via BioLegend, Inc. San Diego, CA) against cell-surface markers for 30 min at 4°C: CD4-AF700 (clone RM4-5), CD8a-FITC (clone 53-6.7), CD44-PE-Cy7 (clone IM7), CD45-BV510 (clone A20), CD62L-PE (MEL-14), CD69-PerCP-Cy5.5 (clone H1.2F3), and TCRβ-APC-Cy7 (clone H57-597). Cells were washed with 1% FBS in PBS.
Bone Marrow-Derived Macrophages
Tibia and femur bones were removed and cleaned of tissue. Ends of bones were cut and flushed with RPMI. Collected marrow was passed through a 22-gauge needle several times slowly to create a single cell suspension. After centrifugation and decantation, the cell pellet was treated with ACK lysis buffer to remove red blood cells. Reaction was neutralized by dilution with 1% FBS in PBS. Cells were centrifuged, and supernatant was decanted; cell pellet was resuspended in bone marrow-derived macrophages (BMDM) differentiation media [DMEM with 10% L929 conditioned media, 10% fetal bovine serum (FBS), 2 mM glutamine, 10 U/mL penicillin/streptomycin] and distributed into tissue culture plates for growth. Differentiation media was replaced every third day. Following seven days of differentiation, cells were washed twice with prewarmed 1× PBS and isolated for RNA extraction or replated into 96-well Seahorse assay plates for respirometry experiments. Lipopolysaccharide (LPS)-induced TNFα secretion was assessed in BMDMs generated from Fpnfl/fl and FpnLysMcre mice in the presence or absence of iron dextran. After 7 days of differentiation, BMDMs were washed twice with prewarmed PBS and fresh media was replaced with or without exogenous iron dextran (10 µg/mL) for 24 h. Cells were washed twice with prewarmed PBS and activated with LPS (100 ng/mL) for 24 h. Medium was collected and assessed for TNFα, IFNγ, IL1β, IL6, MCP1, MIP1a, RANTES, and M-CSF (Luminex Multiplex, MAGPIX Instrumentation, Luminex Corporation) via VUMC Hormone Assay and Analytical Services Core. Data are normalized to cellular protein and presented as pg/mg protein.
To mimic an obesogenic environment in vitro, a subset of differentiated BMDMs were supplemented with 22 mM glucose and 0.5 mM fatty acid mixture (0.4 mM palmitate and 0.1 mM oleate) in 3% fatty acid-free BSA or control medium (1 mM L-glutamine, 6 mM glucose, 3% fatty acid free BSA) for 48 h. Following incubation, cells were washed and cellular respiration was measured via Seahorse XFe96 Extracellular Flux Analyzer.
Respirometry Measurements
Cells were plated in a 96-well Seahorse assay plate at 50,000–75,000/well in Seahorse Assay Media and assessed on the Seahorse XFe96 Extracellular Flux Analyzer (Agilent Technologies, Santa Clara, CA). For the mitochondrial stress test, assay media was supplemented with 4 mM glucose, 2 mM L-glutamine, and 1 mM sodium pyruvate, and cells were sequentially treated with 10 mM glucose, 1 mM oligomycin, 1 mM FCCP, and 0.5 mM of antimycin A and rotenone. All drugs and reagents were purchased from Agilent Technologies, Santa Clara, CA. Oxygen consumption rates (OCRs) are normalized to cell number or cellular protein.
Tissue Iron and Lipid Peroxidation
Tissue iron concentrations were measured using a colorimetric Ferrozine assay at a wavelength corresponding to 562 nm, as detailed previously (32, 33). Iron concentrations are presented as mg/mg of protein. Lipid peroxidation [malondialdehyde (MDA)] was assessed using a commercial kit (Cat. No. K739-100, BioVision, Inc. Milpitas, CA). MDA data are presented as nM/g tissue.
Immunohistochemistry
Tissue iron distribution was visualized using the perfusion Perls Prussian blue staining method, as previously described with minor modifications (34). Cardiac perfusion with 1× PBS was performed followed by 15-mL perfusion with a Prussian blue staining solution containing 4% paraformaldehyde, 1% potassium ferrocyanide, and 1% HCl. After 1-h fixation, tissues were excised and incubated in Perls staining solution for 12 h at 4°C before being paraffin embedded. Tissue sections were then cleared, hydrated, and counterstained with nuclear fast red.
RNA Isolation, cDNA Synthesis, and Real-Time RT-PCR
Tissues or cells were homogenized and lysed in TRIzol (BD Biosciences). Chloroform (Sigma; Cat. No. C2432) was added to samples (1:5 chloroform:TRIzol) and mixed for phase separation. Equal parts isopropanol and RNA-containing sample were transferred to a clean 1.5-mL tube. Linear acrylamide (3 µL; Thermo Fisher; Cat. No. AM9520) was added to precipitate RNA and samples were placed in −80°C for 15 min. Samples were spun via centrifugation for 5 min at 21,000 g. The supernatant was discarded, and the pelleted sample was washed with 70% ethanol and respun (70% ethanol wash was repeated). After ethanol was discarded the pellet was reconstituted in 50 µL nuclease-free water. Purified RNA was reverse transcribed by iScript RT (Bio-Rad, Hercules, CA) into cDNA. Differences in relative gene expression were quantified using 6-carboxy-fluorescein (FAM)-conjugated TaqMan Gene Expression Assay (Life Technologies). PCR reactions were performed in duplicate under thermal conditions as follows: 95°C for 10 min, followed by 40 cycles of 95°C for 15 s and 60°C for 45 s. Data were normalized to either the housekeeping gene Actb or Gapdh, respectively. mRNA expression values were calculated by the −ΔΔ cT method.
Hyperinsulinemic-Euglycemic Clamps
Catheters were surgically placed in the carotid artery and jugular vein for sampling and infusions, respectively, 1 wk before clamps were performed. Mice were fasted for 5 h before clamps. Mice were neither restrained nor handled during clamp experiments (20). [3-3H]glucose was primed and continuously infused from t = −90 min to t = 0 min (0.04 µCi/min). The insulin clamp was initiated at t = 0 min with a continuous insulin infusion (4 mU/kg/min) and variable glucose infusion rate (GIR), both maintained until t = 155 min. The glucose infusate contained [3-3H]glucose (0.06 µCi/µL) to minimize changes in plasma [3-3H]glucose-specific activity. Arterial glucose was monitored every 10 min to provide feedback to adjust the GIR so as to maintain euglycemia. Erythrocytes were infused to compensate for blood withdrawal. [3-3H]glucose kinetics were determined at −15 min and −5 min for the basal period and every 10 min between 80 and 120 min for the clamp period to assess whole body glucose appearance (Ra), glucose disappearance (Rd), and endogenous glucose production (endoRa). A 13 µCi intravenous bolus of 2-[14C]-deoxyglucose ([14C]2DG) was administered at 120 min to determine the glucose metabolic index (Rg), an index of tissue-specific glucose uptake. Blood samples were collected at 122, 125, 130, 135, and 145 min to measure [14C]2DG disappearance from plasma. At 145 min, mice were anesthetized, euthanized, and tissues were immediately harvested and freeze-clamped. Full step-by-step descriptions of the surgery, isotope clamp method, and calculations are available from the Vanderbilt Mouse Metabolic Phenotyping Center (MMPC) website (www.vmmpc.org).
Statistical Analysis
Student’s t tests were run for between group comparisons. In experiments that contained more than two groups, one-way analysis of variance (ANOVA) or two-way ANOVA models were conducted with pairwise comparisons using Tukey’s correction. All data are presented as mean ± standard error (SE). A P value <0.05 was used to determine significance.
RESULTS
Myeloid-Targeted Loss of Fpn Results in Tissue Iron Overload
Cre-lox mediated excision of Slc40a1 resulted in 4.5-fold lower mRNA expression in BMDMs generated from FpnLysMCre versus Fpnfl/fl mice (Fig. 1, A and B). Genes encoding iron storage peptides were approximately fourfold higher in FpnLysMCre compared with Fpnfl/fl BMDMs indicating transcriptional responses to elevated intracellular iron concentrations, whereas prototypical inflammatory genes (Nos2, Il1b, and Tnfa) were not altered by Fpn deletion in BMDMs (Fig. 1B). BMDM-derived cytokine and chemokine secretion was measured in response to exogenous iron and LPS exposure (Fig. 1A). Iron exposure alone did not result in greater cytokine production than PBS control in either genotype; however, Fpnfl/fl BMDMs did produce greater M-CSF in response to exogenous iron (Fig. 1C). LPS enhanced production of TNFα, IL6, MIP1a, MCP1, and RANTES in both genotypes but the addition of iron and LPS did not augment cytokine secretion. Relative to Fpn intact BMDMs, deletion of myeloid Fpn resulted in greater MIP1a production in response to LPS (Fig. 1C). To confirm the loss of iron export (e.g., resulting in cellular iron excess) in FpnLysMCre mice in vivo, a subset of chow-fed animals was euthanized and tissues were excised for gross and histological determination of iron accumulation. Potassium ferrocyanide staining revealed increased iron content in multiple tissues from FpnLysMCre mice—the most pronounced of which were spleen, liver, and thymus (Fig. 1D and Supplemental Fig. S1; all Supplemental material is available at https://doi.org/10.6084/m9.figshare.14866380.v1). Excess tissue iron in FpnLysMCre versus Fpnfl/fl was demonstrated biochemically in the spleen and liver, which was accompanied by enhanced lipid peroxidation in whole liver lysates (Fig. 1E). Plasma NEFA and cholesterol were not different between genotypes, whereas plasma triglycerides were lower in FpnLysMCre mice (Fig. 1F).
Figure 1.

Myeloid-targeted loss of Fpn results in tissue iron overload. Littermate Fpnfl/fl and FpnLysMCre mice were generated for experiments. Bone marrow-derived Mɸs were generated (A) and gene expression for iron handling and inflammatory genes quantified (B). BMDMs were treated with or without iron dextran (10 µg/mL), then were stimulated with LPS (100 ng/mL), and cytokines/chemokines secreted into the media were quantified (C). D: mice were euthanized and tissues stained with potassium ferrocyanide (Perls Prussian blue). Spleen and liver were excised and iron content quantified via ferrozine assay and lipid peroxidation was quantified in spleen and liver lysates (E) and plasma NEFA, triglycerides, and cholesterol were determined (F). Student’s t test or one-way ANOVA was used to test statistical significance. n = 4–7/group. Data are means ± SE. *P < 0.05, **P < 0.01, ****P < 0.0001. Mɸs, macrophages; NEFA, nonesterified fatty acids. Panel A was created with BioRender.com.
We also tested whether myeloid loss of Fpn leads to compensatory changes to adaptive immune cells in blood, thymus, and spleen. No statistically significant differences between genotypes were detected for either total or subsets of CD4+ and CD8+ T cells (Supplemental Fig. S2). Given that adipose tissue (AT) inflammation is closely linked with metabolic health, we assessed whether markers of AT inflammation, including Mɸ infiltration, were increased with the loss of myeloid Fpn in lean and obese mice. Flow cytometric analysis revealed that the percentage of CD45+ AT Mɸs (F4/80+, CD11b+, CD64+) was higher in FpnLysMCre mice; however, there were no differences in Mɸs when normalized to tissue weight (Supplemental Fig. S3A). In addition, mean fluorescence intensity for M1 (CD38) and M2 (CD206) associated Mɸs was not different between genotypes (Supplemental Fig. S3B). High-fat diet-induced obesity did not cause greater expression of inflammatory transcripts in FpnLysMCre mice, though the chemokine Ccl2 (encodes MCP-1) was higher in mice devoid of myeloid Fpn (Supplemental Fig. S3C). Immunohistochemical analysis of visible crown-like structures following long-term HFD did not reveal differences between genotypes in either epididymal or subcutaneous fat pads (Supplemental Fig. S2, D and E). Collectively, these data establish that our model of myeloid-targeted deletion of Fpn perturbs iron handling resulting in excess cellular and tissue iron accumulation, which is largely independent on inflammatory status.
Myeloid-Targeted Loss of Fpn Impairs Mitochondrial Bioenergetics
To determine whether loss of Fpn-mediated iron export impacts cellular respiratory function, we generated primary BMDMs from Fpnfl/fl and FpnLysMCre animals and conducted extracellular flux analyses (Fig. 2A). Loss of Fpn decreased OCRs with ATP-linked and maximal respiration being most affected (Fig. 2B). Basal and glucose-stimulated extracellular acidification rate (ECAR)s were also lower (Fig. 2C). Next, we isolated Mɸ-rich cellular fractions from liver and epididymal AT in Fpnfl/fl and FpnLysMCre animals and performed extracellular flux analyses. Given that FpnLysMCre mice manifest with increased tissue iron (Fig. 1, D and E), we also determined whether exogenous iron chelation (DFO) would revert impairments in bioenergetics. Although DFO is an extracellular iron chelator, similar reductions in the intracellular labile iron concentrations have been documented using DFO versus a membrane permeable iron chelator such as deferiprone (35). Compared with saline injected controls, once-per-day injections of DFO for 3 days decreased hepatic iron staining in FpnLysMCre mice, whereas both saline and DFO treated control mice had minimal positive iron staining (Fig. 2, D and E). Relative to Fpnfl/fl controls, FpnLysMCre mice had decreased OCRs from liver leukocytes (Fig. 2, F–H) and epididymal AT (Fig. 1K). In both liver and AT, lower OCRs in FpnLysMCre mice was mainly attributable to decreased maximal respiration and lower reserve capacity (Fig. 2, G and J). In liver leukocytes, DFO treatment restored loss of Fpn-induced reduction in mitochondrial reserve capacity; however, DFO had no effect in isolated myeloid compartment from AT in either genotype (Fig. 2, G and J). Basal ECAR was not significantly different between groups in liver leukocytes, whereas AT ECAR was lower in FpnLysMCre versus Fpnfl/fl mice. Together, these findings suggest that loss of Fpn-mediated iron export in myeloid cells limits mitochondrial oxidative capacity, which is improved with iron chelation in liver but not AT.
Figure 2.

Myeloid-targeted loss of Fpn impairs mitochondrial bioenergetics. A: bone marrow isolation and macrophage differentiation were conducted from littermate Fpnfl/fl and FpnLysMCre mice. Mitochondrial stress test OCR curves and OCR deltas (B) and basal and glucose stimulated ECAR (C). D: in vivo deferoxamine (DFO) or saline was administered to littermate Fpnfl/fl and FpnLysMCre mice prior to euthanasia. Liver was excised and stained with potassium ferrocyanide (E) and liver leukocytes were isolated and extracellular flux analyses were conducted via Seahorse Analyzer (F). Mitochondrial stress test OCR curves and OCR deltas (G) and ECAR (H). I: extracellular flux analyses were measured in adherent immune fraction from epididymal AT. Mitochondrial stress test OCR curves and OCR deltas (J) and ECAR (K). For B, two-way ANOVA with drug (Oligo, FCCP, Rot/AA) and genotype as factors was conducted on OCR curves. The remaining data were analyzed via two-way ANOVA with genotype and treatment (DFO vs. saline) as factors to test for group differences. Pairwise comparisons were conducted using Tukey’s adjustment. n = 4–6/group. Data are means ± SE. *P < 0.05, #P = 0.1. AT, adipose tissue; OCR, oxygen consumption rate. Panels A, D, F, and I were created with BioRender.com.
Exogenous Iron Attenuates Mitochondrial Respiration
Since the aforementioned experiments were performed in genetically modified mice, we determined whether short-term exogenous iron loading (Fe-dextran, intraperitoneally) disrupts mitochondrial respiration in normal chow-fed C57BL/6Jmice (Fig. 3A). We previously found that a single injection of iron dextran increases tissue iron content (30); thus we hypothesized that this exogenous iron load would be sufficient to influence mitochondrial function. Indeed, extracellular flux analyses revealed that a single bolus of exogenous iron decreased OCRs in Mɸ-rich cells from liver of C57BL/6J mice, whereas there was no differences in ECAR (Fig. 2, B–D). The iron-induced reduction in OCRs manifested in maximal and reserve capacity (Fig. 3C), phenocopying the responses in FpnLysMcre mice (Fig. 2G). In AT adherent stromal vascular fraction (SVF) cells, excess iron content was confirmed in FpnLysMcre mice via potassium ferrocyanide staining and visualized via light microscopy (Fig. 3E). Similar to the liver leukocytes, exogenous iron decreased OCRs in AT with reductions observed in ATP-linked, maximal respiration, and reserve capacity (Fig. 3G). From these data, we conclude that short-term iron excess perturbs mitochondrial metabolism in tissue macrophages in lean mice.
Figure 3.

Exogenous iron attenuates mitochondrial respiration. Chow-fed C57BL/6J mice received an exogenous bolus of iron dextran (intraperitoneally, 5 mg/kg body wt) and were euthanized 1 wk later. Liver and AT leukocytes were isolated and extracellular flux analyses were conducted via Seahorse Analyzer (A). OCR curves (B), OCR deltas (C), and ECAR (D) in liver leukocytes. Potassium ferrocyanide “iron” staining in adherent Mɸ-enriched cells isolated from epididymal adipose tissue (eAT; E), OCR curves (F), OCR deltas (G), and ECAR (H) in Mɸ-enriched cells isolated from eAT. Two-way ANOVA with drug (Oligo, FCCP, Rot/AA) and treatment (iron vs. saline) as factors was conducted on OCR curves. Student’s t tests were used for other group comparisons. n = 4/group. Data are means ± SE. *P < 0.05. OCR, oxygen consumption rate. Panels A, B, and F were created with BioRender.com.
Myeloid-Targeted Deletion of Fpn Does Not Disrupt Glucose Homeostasis in Adult Male or Female Mice
Tissue iron overload and excess serum ferritin are positively associated with insulin resistance and type 2 diabetes (3). Since Mɸs are iron-handling cells, we postulated that deterioration in Mɸ iron handling—via conditional deletion of Fpn—would impair whole body metabolic function and that this would be exacerbated with diet-induced obesity. Male and female Fpnfl/fl and FpnLysMCre mice were fed LFD or HFD for 25 wk. High-fat diet feeding increased body weight and fat mass in both males and females with no differences between genotypes (Fig. 4, A, C, F, and H). Energy intake was not different between Fpnfl/fl and FpnLysMCre mice but as expected was greater in mice fed HFD. Lean mass was not differentially affected by genotype or by diet in either sex. HFD feeding caused glucose intolerance in both males and females but this was not worsened in FpnLysMCre mice after either 6 or 25 wk of HFD feeding (Fig. 4, D and J), respectively. In a subset of mice, plasma insulin was assessed before and after an intraperitoneal glucose bolus. Prior to glucose administration, insulin was higher in HFD-fed groups regardless of genotype, whereas 5 min following the glucose bolus, plasma insulin was greater in FpnLysMCre compared with floxed controls fed HFD (Fig. 4E). Body weight was positively associated with postprandial insulin; however, baseline body weight was not associated with the change in glucose-stimulated insulin levels (data not shown).
Figure 4.

Myeloid-targeted deletion of Fpn does not disrupt glucose homeostasis in male or female mice. Males: weekly body weight (A), energy intake (B), fat mass and lean mass (C), glucose tolerance (D), and acute glucose and insulin response to intraperitoneal glucose load (E). Females: weekly body weight (F), energy intake (G), fat mass and lean mass (H), glucose tolerance (I), and glucose area under the curve (AUC; J). Male and female Fpnfl/fl and FpnLysMCre mice were fed 10% low-fat diet (LFD) or 60% high-fat diet (HFD) for 25 wk. For glucose tolerance tests, 2 g/kg lean mass of 20% dextrose was administered intraperitoneally. Two-way ANOVA with diet and genotype as factors was conducted, with Tukey’s post hoc comparisons. n = 7–17/group. Data are mean ± SE. *P < 0.05, #P < 0.05 FpnLysMCre vs all groups. BW, body weight; eAT, epididymal adipose tissue; GTT, glucose tolerance test; OCR, oxygen consumption rate.
To determine whether loss of myeloid-specific iron handling regulates whole body insulin action, a group of female mice (Fpnfl/fl vs. FpnLysMcre vs. C57BL/6J) were fed HFD for 22 wk before hyperinsulinemic euglycemic clamps. Age- and diet-matched C5BL/6J mice were included as internal controls for comparison against genetically modified animals (e.g., floxed animals). Indwelling arterial and venous catheters were surgically implanted at week 21 and clamps were completed at week 22. Weekly body weight did not differ between groups (Fig. 5A). Arterial glucose was clamped at 120 mg/dL and was not different between groups (Fig. 5B), with a constant insulin infusion. Steady-state GIR, plasma insulin, glucose Ra, and glucose turnover were not different between groups (Fig. 5, C–F). Fasting and clamped NEFA, triglycerides, and cholesterol were not different between Fpnfl/fl and FpnLysMcre mice (Fig. 5, G–I). Similarly, the rate of tissue glucose uptake (14 C-deoxyglucose) was not different between groups (Fig. 5H).
Figure 5.

Hyperinsulinemic-euglycemic clamps. Weekly body weight curves (A), arterial glucose concentrations (B), glucose infusion rate (C), plasma insulin (D), glucose rate of appearance (E), total glucose flux (F), NEFA (G), triglycerides (H), and cholesterol (I), and tissue glucose uptake (J). Female Fpnfl/fl, FpnLysMCre, and C57BL/6J mice were fed 60% fat diet for 21 wk followed by hyperinsulinemic-euglycemic clamp procedure (www.vmmpc.org). One-way ANOVA was conducted for between-group differences. n = 4–6/group. Data are means ± SE. *P < 0.05, ****P < 0.0001. AT, adipose tissue; NEFA, nonesterified fatty acids; Ra, glucose appearance; Rd, glucose disappearance; Rg, glucose metabolic index.
Next, we determined whether short-term exogenous iron challenge unmasks glucose intolerance in mice that lack myeloid Fpn. Ten-week-old female mice were fed LFD or HFD for 6 wk before the iron challenge (Fig. 6A). Body weight gain was increased in HFD versus LFD animals, with no differences between genotypes (Fig. 6B). A baseline glucose tolerance test (GTT) was performed followed by intraperitoneal iron dextran injection 2 days after the GTT into Fpnfl/fl and FpnLysMCre. Mice fed HFD had increased postprandial glucose concentrations relative to LFD controls; however, iron treatment did not exacerbate glucose excursions in floxed controls or FpnLysMCre animals (Fig. 6, C and D). Similarly, we found that exogenous iron dextran injection did not alter body weight or impair glucose tolerance in C57BL/6J mice fed standard rodent chow (Fig. 6, E–G). Collectively, these data indicate that loss of myeloid specific Fpn does not impair systemic insulin action or glycemic control in adult male or female mice.
Figure 6.

Exogenous iron does not alter glucose tolerance in mice lacking myeloid Fpn. Ten-week-old littermate Fpnfl/fl and FpnLysMCre mice were fed 10% fat or 60% fat diet for 6 wk. A glucose tolerance test (GTT) was performed after 6 wk of diet feeding, after which mice received a single bolus of iron dextran (5 mg/kg body wt) or saline. A post-iron/saline treatment GTT was performed 1 wk after injections (A), weekly body weight (B), glucose tolerance pre- versus post-iron treatment (C), glucose area under the curve (D), daily body weight after a single iron bolus in C57BL/6Jmice (E), glucose tolerance 7 days post-iron injection (F), and glucose area under the curve (G). Two-way repeated-measures (pre- vs. post-iron exposure) ANOVA was conducted with diet and genotype as factors. Student’s t tests were used for other group comparisons. n = 3–10/group. Data are means ± SE. HFD, high-fat diet; LFD, low-fat diet. Panel A was created with BioRender.com.
Given that aging is generally associated with metabolic dysfunction (36) and iron disorders (37, 38), we determined whether loss of myeloid expressed Fpn exposes glucose intolerance in middle-aged male mice and whether this is related to cellular bioenergetics (Fig. 7A). Body weight, liver mass, and AT mass were not different between genotypes (Fig. 7B). Of note, FpnLysMCre mice displayed worse glucose tolerance compared with age-matched Fpnfl/fl littermates (Fig. 7C), with no differences in plasma insulin, triglycerides, or NEFA concentrations (Fig. 7D). In contrast to younger mice (Fig. 2), 52-wk-old FpnLysMCre animals did not manifest lower mitochondrial respiration in either liver leukocytes (Fig. 7, F and G) or epididymal AT myeloid fraction (Fig. 1J) compared with Fpnfl/fl controls, and no changes in basal or glucose stimulated ECAR were found between groups (Fig. 7, H and K). We reasoned that aging may have normalized differences in cellular respiration between genotypes. Thus, we performed a provocative experiment in which BMDMs were challenged with an obesogenic stimulus. Briefly, BMDMs differentiated from 52-wk-old FpnLysMCre and Fpnfl/fl were treated with vehicle (BSA) or an “obese” cocktail (22 mM glucose, 0.4 mM palmitate, and 0.1 mM oleate) for 48 h followed by respirometry analyses (Fig. 7K). Basal respiration was ∼60% and ∼40% lower in FpnLysMCre versus control BMDMs following BSA and obese treatments, respectively (Fig. 7L). Glucose- and FCCP-stimulated OCRs were lower in BMDMs that lacked Fpn (Fig. 7L), whereas ECAR was not different between genotypes (Fig. 7M). These data suggest that lack of myeloid Fpn, coupled with natural aging, evokes glucose intolerance, but whether myeloid mitochondrial metabolism is causative in age-associated glycemic control is unclear.
Figure 7.

Glucose intolerance is unmasked with age in mice lacking myeloid Fpn. At 42 wk of age, an intraperitoneal bolus of glucose (2 g dextrose/body mass) was administered to Fpnfl/fl and FpnLysMCre mice to determine glucose tolerance and respirometry analyses performed at 52 wk of age (A), body mass and tissue weights (B), glucose curves and glucose AUC (C), and plasma insulin, triglycerides, and NEFA concentrations (D). Liver leukocytes were isolated and extracellular flux analyses were conducted via Seahorse Analyzer (E). OCR curves and OCR deltas (F) and ECAR (G) in liver leukocytes. Adherent Mɸ-enriched cells were isolated from epididymal adipose tissue (eAT; H). OCR curves and OCR deltas (I) and ECAR (J) in Mɸ-enriched cells isolated from eAT. BMDMs differentiated from 52-wk-old FpnLysMCre and Fpnfl/fl were treated with vehicle (BSA) or an “obese” cocktail (22 mM glucose, 0.4 mM palmitate, and 0.1 mM oleate) for 48 h followed by respirometry analyses (K), basal, glucose, and FCCP-stimulated OCRs and deltas (L), and basal and glucose stimulated ECAR (M). Mice were given ad libitum access to rodent chow for the duration of their lifespan. Two-way ANOVA with drug (Oligo, FCCP, Rot/AA) and genotype as factors was conducted on OCR curves. Student’s t tests were used for other group comparisons. A–D: n = 6–8/group. E–M: n = 3–5/group. Data are means ± SE. **P < 0.01. AUC, area under the curve; OCR, oxygen consumption rate; NEFA, nonesterified fatty acids. Panels A, E, H, and K were created with BioRender.com.
DISCUSSION
In the present study, we investigated the role by which Fpn regulates Mɸ metabolism and systemic insulin resistance in mice. We found that myeloid-targeted deletion of Fpn causes Mɸ iron overload and impairs mitochondria respiration but does not disrupt systemic glucose homeostasis or insulin action in 5- to 8-mo-old lean or obese mice. These data suggest that if Mɸs can store iron properly they display a wide range of versatility and can maintain their immune status, even upon iron overload due to Fpn deficiency.
Iron is an essential element for numerous fundamental processes necessary for mammalian life (9, 39, 40). Cellular and tissue iron flux requires tight control to maintain iron balance and avoid iron overload or iron deficiency. This fine-tuning of iron handling is mediated by a number of highly regulated iron transporters and storage proteins (10). One consequence of the breakdown in cellular iron handling is mitochondrial dysfunction. Indeed, prior data from rat hepatocytes demonstrate a U-shaped curve with regards to cellular iron concentrations and mitochondrial respiratory function (25). Chronic iron deficiency results in decreased iron incorporation into heme-derived mitochondrial proteins and iron-sulfur clusters leading to swollen mitochondria with loss of cristae (41, 42). In contrast, mitochondrial dysfunction associated with excess intracellular free labile iron is thought to be linked with reactive oxygen species that are produced in aerobic conditions, leading to cell and tissue damage in a chemical process known as the Fenton reaction (43). Here we show that Mɸ iron excess caused by either exogenous iron overload or loss of Mɸ iron export (via Fpn deletion) dampens mitochondrial respiration in liver and AT leukocytes in adult mice. Of note, the loss of Fpn in young adult mice decreased mitochondrial respiration in myeloid cells from three independent tissues (bone, liver, and AT; Fig. 2), reinforcing the robustness and consistency of these findings. The decrease in oxidative metabolism was not compensated by an increase in glycolytic activity, as assessed via ECAR. A small but significant decrease in basal and glucose-stimulated ECAR was notable in BMDMs that lacked Fpn. This phenocopies the bioenergetics of aging macrophages/microglia, characterized by reductions in both glycolytic and oxidative metabolism (44), and thus it is tempting to speculate that loss of Fpn or iron overload may accelerate mitochondrial aging. Although we were unable to compare bioenergetics between young and older mice in a parallel experiment, we found that BMDMs generated from 1-yr-old FpnLysMCre mice manifested decreased basal and maximal respiration following obesogenic treatment in vitro. In contrast, we did not detect differences in oxidative metabolism in AT or liver leukocyte fractions between 1-yr-old Fpnfl/fl versus FpnLysMCre mice. We suspect an age-associated decrease in respiration may explain these divergent findings from younger animals. That is, lifelong absence of myeloid Fpn leads to tonic reduction in mitochondrial respiration creating a “basement” effect with little room to further decline with advancing age. Although animals with intact myeloid Fpn, who have normal cellular energetics in young age, have more room for an age-associated decline in respiratory function.
Bloodletting and iron chelation have proven efficacious in patients with hereditary disorders of iron overload such as hemochromatosis and thalassemia. Hence, we determined whether iron chelation would improve cellular respiration in mice with myeloid ablated Fpn, which manifest with excess cellular iron. Short-term iron chelation improved dynamic respiratory responses in liver leukocytes with no such effects in Mɸs enriched from SVF in AT. The improvement in respiration in the liver is likely attributable to the unloading effect that DFO exerts on labile iron concentrations. Since the iron-overloaded phenotype was smaller in magnitude in adipose-enriched Mɸs, chelation would presumably have a smaller effect. Interestingly, the AT impairment in mitochondrial respiration from Fpn knockout mice does not appear to be tightly linked with gross iron overload given that Fpn-deficient and Fpn-sufficient mice do not differ significantly in AT iron staining (Fig. 1). This raises the possibility that Fpn regulates oxidative metabolism via iron-independent mechanisms in AT, which requires additional investigation.
Tissue iron overload is inversely associated with insulin sensitivity in most (45–47) but not all studies (48). The tissues or cell types that mediate these effects are not entirely clear, but liver and AT have been implicated as contributors to iron-associated insulin resistance in preclinical investigations (45, 49, 50). For example, adipocyte-specific overexpression of mitochondrial ferritin causes a whole body metabolic crisis that is characterized by insulin resistance and increased oxidative stress (51). Our group previously uncovered a specialized population of AT Mϕs that have the intrinsic capacity to take up excess iron, protecting adipocytes from iron overload (30, 34). AT is not the only tissue that requires tight control of iron flux (10), and so in this study, we reasoned that forcing Mϕs to retain excess iron would provoke and/or exacerbate insulin resistance in lean and obese mice, respectively. This was further founded on prior findings that deletion of ferritin heavy isoform and consequent decreases in cellular iron storage attenuated inflammation and glucose intolerance in mice (31). We report that deletion of myeloid-specific Fpn and consequent iron overload did not decrease insulin sensitivity or impair glucose homeostasis in lean or obese mice regardless of sex. Despite a reduction in cellular respiratory capacity and increased cellular iron, Mϕs devoid of Fpn did not manifest higher inflammatory gene expression than controls. We posit that the absence of excess Mϕ inflammation may be one explanation for the lack of differences in insulin resistance between genotypes. This aligns with prior data from our group demonstrating that diet-induced iron overload causes Mϕ iron accumulation but does not evoke inflammation or glucose intolerance (30). Similarly, herein, short-term iron overload in mice that lacked myeloid Fpn was insufficient to induce glucose intolerance (Fig. 6), suggesting that Mϕs are capable of sequestering relatively high amounts of iron without compromising glycemic control. These observations coupled with our previous findings suggest the possibility that eliminating an iron safety net intrinsic to some tissue Mϕs would expose parenchymal cells to iron concentrations that overwhelm their buffering capacity. This, in turn, may lead to tissue and whole body insulin resistance.
The mouse model of myeloid specific loss of Fpn has proven useful in the study of acute muscle injury (24), wound repair (23), and sepsis (21); however, to our knowledge this is the first study to exhaustively determine whether myeloid deficiency of Fpn alters macrophage bioenergetics and inflammation or regulates in vivo insulin action and glucose homeostasis in lean and obese mice. Fpn action was necessary to maintain Mϕ mitochondrial function and control cellular iron, but the perturbations to Mϕ metabolism caused by the loss of Fpn did not adversely influence insulin action in 6- to 8-mo-old mice. This reinforces the plasticity of Mϕs and their ability to withstand iron excess and impairments to mitochondrial metabolism without generating overt collateral damage such as glycemic dysregulation. Interestingly, in middle-aged (∼1 yr old) mice, loss of Fpn unmasked glucose intolerance compared with aged-matched Fpnfl/fl littermates. We posit that gradual metabolic dysfunction associated with natural aging (36) coupled with low-grade oxidative stress induced by Fpn deletion is sufficient to evoke mild glucose intolerance. Yet, it is unclear why diet-induced obesity—which is generally associated with increased oxidative stress in metabolically active tissues—did not exacerbate glucose intolerance and insulin resistance in younger mice devoid of myeloid Fpn, and why aging specifically uncovered glycemic dysregulation in FpnLysMCre animals. Consistent with the absence of insulin resistance in younger animals, we did not detect differences in markers of AT inflammation between Fpnfl/fl and FpnLysMCre mice in either lean or obese conditions, despite perturbations to myeloid oxidative metabolism. Thus, we observe an uncoupling between myeloid mitochondrial dysfunction and insulin sensitivity/inflammation, at least in this model of perturbed iron handling. The dichotomy between cellular energetics, age, and glucose homeostasis is not clear. Consequently, additional studies are needed to establish the mechanistic links between aging, Mɸ iron handling, and insulin resistance.
In aggregate, we report that iron handling is critical for the maintenance of macrophage mitochondrial function but perturbing myeloid iron flux via Fpn loss of function is not sufficient to evoke systemic insulin resistance in adult mice, whereas aging coupled with lifelong loss of Fpn unmasks glucose intolerance. Additional studies targeting both arms of iron handling (import and export) and aging would shed light into the regulatory role of Mɸ iron handling and insulin action.
SUPPLEMENTAL DATA
Supplemental Figs. S1–S3: https://doi.org/10.6084/m9.figshare.14866380.v1.
GRANTS
This work was supported by the National Institute of Diabetes and Digestive and Kidney Diseases [(NIDDK) R01DK121520 to A.H.H.] and The Obesity Society (Early Career Research Grant to N.C.W.). N.C.W. was supported by the American Physiological Society Postdoctoral Fellowship and Molecular Endocrinology Training Program [METP, (T32 DK007563-31)] during data curation and analysis and is currently supported by an American Heart Association (AHA) postdoctoral fellowship (21POST834990). E.M.W. is supported by Immunological Mechanisms of Disease Training Program (T32AI138932). M.A.C. is supported by NIDDK (1F31DK123881) and was supported by METP (T32 DK007563-31) during data curation. M.B. is supported by the Gastroenterology Training Grant (DK007673) and the AHA Strategically Focused Research Network award (17SFRN33520017). A.H.H. is also supported by a Merit Award from the Veterans Affairs (5I01BX002195) and an Innovative Project Award from the AHA (19IPLO134760376).
DISCLOSURES
No conflicts of interest, financial or otherwise, are declared by the authors.
AUTHOR CONTRIBUTIONS
N.C.W. and A.H.H. conceived and designed research; N.C.W., E.M.W., M.A.C., and M.B. performed experiments; N.C.W., E.M.W., M.A.C., M.B., and A.H.H. analyzed data; N.C.W., E.M.W., M.A.C., M.B., and A.H.H. interpreted results of experiments; N.C.W. prepared figures; N.C.W. drafted manuscript; N.C.W., M.A.C., and A.H.H. edited and revised manuscript; N.C.W., E.M.W., M.A.C., M.B., and A.H.H. approved final version of manuscript.
ACKNOWLEDGMENTS
We acknowledge the assistance of Alec Rodriguez, Marnie Gruen, and Caroline Hegemann for their efforts with animal husbandry. We acknowledge the following Vanderbilt University (VU) and Vanderbilt University Medical Center (VUMC) core facilities: VU High-Throughput-Screening Core (NIH 1S10OD018015), VUMC Hormone Assay & Analytical Services Core (NIH DK059637 and DK020593), VU Metabolic Mouse Phenotyping Center (NIDDK DK059637; www.vmmpc.org), Translational Pathology Shared Resource (NCI/NIH Cancer Center Support Grant 5P30 CA68485-19), and the VUMC Digital Histology Shared Resource (https://www.vumc.org/dhsr/). The guarantor for this work is Dr. Alyssa Hasty.
REFERENCES
- 1.Fernandez-Real JM, Manco M. Effects of iron overload on chronic metabolic diseases. Lancet Diabetes Endocrinol 2: 513–526, 2014. doi: 10.1016/S2213-8587(13)70174-8. [DOI] [PubMed] [Google Scholar]
- 2.Ward RJ, Zucca FA, Duyn JH, Crichton RR, Zecca L. The role of iron in brain ageing and neurodegenerative disorders. Lancet Neurol 13: 1045–1060, 2014. doi: 10.1016/S1474-4422(14)70117-6. [DOI] [PMC free article] [PubMed] [Google Scholar]
- 3.Simcox JA, McClain DA. Iron and diabetes risk. Cell Metab 17: 329–341, 2013. doi: 10.1016/j.cmet.2013.02.007. [DOI] [PMC free article] [PubMed] [Google Scholar]
- 4.McClain DA, Abraham D, Rogers J, Brady R, Gault P, Ajioka R, Kushner JP. High prevalence of abnormal glucose homeostasis secondary to decreased insulin secretion in individuals with hereditary haemochromatosis. Diabetologia 49: 1661–1669, 2006. doi: 10.1007/s00125-006-0200-0. [DOI] [PubMed] [Google Scholar]
- 5.Facchini FS. Effect of phlebotomy on plasma glucose and insulin concentrations. Diabetes Care 21: 2190, 1998. doi: 10.2337/diacare.21.12.2190a. [DOI] [PubMed] [Google Scholar]
- 6.Fernández-Real JM, López-Bermejo A, Ricart W. Iron stores, blood donation, and insulin sensitivity and secretion. Clin Chem 51: 1201–1205, 2005. doi: 10.1373/clinchem.2004.046847. [DOI] [PubMed] [Google Scholar]
- 7.Fernandez-Real JM, Penarroja G, Castro A, Garcia-Bragado F, Hernandez-Aguado I, Ricart W. Blood letting in high-ferritin type 2 diabetes: effects on insulin sensitivity and beta-cell function. Diabetes 51: 1000–1004, 2002. doi: 10.2337/diabetes.51.4.1000. [DOI] [PubMed] [Google Scholar]
- 8.Yan HF, Liu ZY, Guan ZA, Guo C. Deferoxamine ameliorates adipocyte dysfunction by modulating iron metabolism in ob/ob mice. Endocr Connect 7: 604–616, 2018. doi: 10.1530/EC-18-0054. [DOI] [PMC free article] [PubMed] [Google Scholar]
- 9.Muckenthaler MU, Rivella S, Hentze MW, Galy B. A red carpet for iron metabolism. Cell 168: 344–361, 2017. doi: 10.1016/j.cell.2016.12.034. [DOI] [PMC free article] [PubMed] [Google Scholar]
- 10.Winn NC, Volk KM, Hasty AH. Regulation of tissue iron homeostasis: the macrophage ferrostat. JCI Insight 5: e132964, 2020. doi: 10.1172/jci.insight.132964. [DOI] [PMC free article] [PubMed] [Google Scholar]
- 11.Lavin Y, Winter D, Blecher-Gonen R, David E, Keren-Shaul H, Merad M, Jung S, Amit I. Tissue-resident macrophage enhancer landscapes are shaped by the local microenvironment. Cell 159: 1312–1326, 2014. doi: 10.1016/j.cell.2014.11.018. [DOI] [PMC free article] [PubMed] [Google Scholar]
- 12.Shapouri-Moghaddam A, Mohammadian S, Vazini H, Taghadosi M, Esmaeili S-A, Mardani F, Seifi B, Mohammadi A, Afshari JT, Sahebkar A. Macrophage plasticity, polarization, and function in health and disease. J Cell Physiol 233: 6425–6440, 2018. doi: 10.1002/jcp.26429. [DOI] [PubMed] [Google Scholar]
- 13.Van den Bossche J, O'Neill LA, Menon DM. Macrophage immunometabolism: where are we (going)? Trends Immunol 38: 395–406, 2017. doi: 10.1016/j.it.2017.03.001. [DOI] [PubMed] [Google Scholar]
- 14.Russo L, Lumeng CN. Properties and functions of adipose tissue macrophages in obesity. Immunology 155: 407–417, 2018. doi: 10.1111/imm.13002. [DOI] [PMC free article] [PubMed] [Google Scholar]
- 15.Caslin HL, Hasty AH. Extrinsic and intrinsic immunometabolism converge: perspectives on future research and therapeutic development for obesity. Curr Obes Rep 8: 210–219, 2019. doi: 10.1007/s13679-019-00344-2. [DOI] [PMC free article] [PubMed] [Google Scholar]
- 16.Corna G, Campana L, Pignatti E, Castiglioni A, Tagliafico E, Bosurgi L, Campanella A, Brunelli S, Manfredi AA, Apostoli P, Silvestri L, Camaschella C, Rovere-Querini P. Polarization dictates iron handling by inflammatory and alternatively activated macrophages. Haematologica 95: 1814–1822, 2010. doi: 10.3324/haematol.2010.023879. [DOI] [PMC free article] [PubMed] [Google Scholar]
- 17.Recalcati S, Locati M, Marini A, Santambrogio P, Zaninotto F, De Pizzol M, Zammataro L, Girelli D, Cairo G. Differential regulation of iron homeostasis during human macrophage polarized activation. Eur J Immunol 40: 824–835, 2010. doi: 10.1002/eji.200939889. [DOI] [PubMed] [Google Scholar]
- 18.Wang CY, Babitt JL. Liver iron sensing and body iron homeostasis. Blood 133: 18–29, 2019. doi: 10.1182/blood-2018-06-815894. [DOI] [PMC free article] [PubMed] [Google Scholar]
- 19.Knutson MD. Iron transport proteins: gateways of cellular and systemic iron homeostasis. J Biol Chem 292: 12735–12743, 2017. doi: 10.1074/jbc.R117.786632. [DOI] [PMC free article] [PubMed] [Google Scholar]
- 20.Drakesmith H, Nemeth E, Ganz T. Ironing out ferroportin. Cell Metab 22: 777–787, 2015. doi: 10.1016/j.cmet.2015.09.006. [DOI] [PMC free article] [PubMed] [Google Scholar]
- 21.Zhang Z, Zhang F, An P, Guo X, Shen Y, Tao Y, Wu Q, Zhang Y, Yu Y, Ning B, Nie G, Knutson MD, Anderson GJ, Wang F. Ferroportin1 deficiency in mouse macrophages impairs iron homeostasis and inflammatory responses. Blood 118: 1912–1922, 2011. doi: 10.1182/blood-2011-01-330324. [DOI] [PubMed] [Google Scholar]
- 22.Donovan A, Lima CA, Pinkus JL, Pinkus GS, Zon LI, Robine S, Andrews NC. The iron exporter ferroportin/Slc40a1 is essential for iron homeostasis. Cell Metab 1: 191–200, 2005. doi: 10.1016/j.cmet.2005.01.003. [DOI] [PubMed] [Google Scholar]
- 23.Recalcati S, Gammella E, Buratti P, Doni A, Anselmo A, Locati M, Cairo G. Macrophage ferroportin is essential for stromal cell proliferation in wound healing. Haematologica 104: 47–58, 2019. doi: 10.3324/haematol.2018.197517. [DOI] [PMC free article] [PubMed] [Google Scholar]
- 24.Corna G, Caserta I, Monno A, Apostoli P, Manfredi AA, Camaschella C, Rovere-Querini P. The repair of skeletal muscle requires iron recycling through macrophage ferroportin. J Immunol 197: 1914–1925, 2016. doi: 10.4049/jimmunol.1501417. [DOI] [PubMed] [Google Scholar]
- 25.Walter PB, Knutson MD, Paler-Martinez A, Lee S, Xu Y, Viteri FE, Ames BN. Iron deficiency and iron excess damage mitochondria and mitochondrial DNA in rats. Proc Natl Acad Sci USA 99: 2264–2269, 2002. doi: 10.1073/pnas.261708798. [DOI] [PMC free article] [PubMed] [Google Scholar]
- 26.Dziegala M, Kobak K, Kasztura M, Bania J, Josiak K, Banasiak W, Ponikowski P, Jankowska E. Iron depletion affects genes encoding mitochondrial electron transport chain and genes of non-oxidative metabolism, pyruvate kinase and lactate dehydrogenase, in primary human cardiac myocytes cultured upon mechanical stretch. Cells 7: 175, 2018. doi: 10.3390/cells7100175. [DOI] [PMC free article] [PubMed] [Google Scholar]
- 27.Pereira M, Chen T-D, Buang N, Olona A, Ko J-H, Prendecki M, Costa ASH, Nikitopoulou E, Tronci L, Pusey CD, Cook HT, McAdoo SP, Frezza C, Behmoaras J. Acute iron deprivation reprograms human macrophage metabolism and reduces inflammation in vivo. Cell Rep 28: 498–511.e5, 2019. doi: 10.1016/j.celrep.2019.06.039. [DOI] [PMC free article] [PubMed] [Google Scholar]
- 28.Jouihan HA, Cobine PA, Cooksey RC, Hoagland EA, Boudina S, Abel ED, Winge DR, McClain DA. Iron-mediated inhibition of mitochondrial manganese uptake mediates mitochondrial dysfunction in a mouse model of hemochromatosis. Mol Med 14: 98–108, 2008. doi: 10.2119/2007-00114.Jouihan. [DOI] [PMC free article] [PubMed] [Google Scholar]
- 29.Cooksey RC, Jouihan HA, Ajioka RS, Hazel MW, Jones DL, Kushner JP, McClain DA. Oxidative stress, beta-cell apoptosis, and decreased insulin secretory capacity in mouse models of hemochromatosis. Endocrinology 145: 5305–5312, 2004. doi: 10.1210/en.2004-0392. [DOI] [PubMed] [Google Scholar]
- 30.Hubler MJ, Erikson KM, Kennedy AJ, Hasty AH. MFe(hi) adipose tissue macrophages compensate for tissue iron perturbations in mice. Am J Physiol Cell Physiol 315: C319–C329, 2018. doi: 10.1152/ajpcell.00103.2018. [DOI] [PMC free article] [PubMed] [Google Scholar]
- 31.Ikeda Y, Watanabe H, Shiuchi T, Hamano H, Horinouchi Y, Imanishi M, Goda M, Zamami Y, Takechi K, Izawa-Ishizawa Y, Miyamoto L, Ishizawa K, Aihara K-I, Tsuchiya K, Tamaki T. Deletion of H-ferritin in macrophages alleviates obesity and diabetes induced by high-fat diet in mice. Diabetologia 63: 1588–1602, 2020. doi: 10.1007/s00125-020-05153-0. [DOI] [PubMed] [Google Scholar]
- 32.Jeitner TM. Optimized ferrozine-based assay for dissolved iron. Anal Biochem 454: 36–37, 2014. doi: 10.1016/j.ab.2014.02.026. [DOI] [PubMed] [Google Scholar]
- 33.Riemer J, Hoepken HH, Czerwinska H, Robinson SR, Dringen R. Colorimetric ferrozine-based assay for the quantitation of iron in cultured cells. Anal Biochem 331: 370–375, 2004. doi: 10.1016/j.ab.2004.03.049. [DOI] [PubMed] [Google Scholar]
- 34.Orr JS, Kennedy A, Anderson-Baucum EK, Webb CD, Fordahl SC, Erikson KM, Zhang Y, Etzerodt A, Moestrup SK, Hasty AH. Obesity alters adipose tissue macrophage iron content and tissue iron distribution. Diabetes 63: 421–432, 2014. doi: 10.2337/db13-0213. [DOI] [PMC free article] [PubMed] [Google Scholar]
- 35.Vlachodimitropoulou Koumoutsea E, Garbowski M, Porter J. Synergistic intracellular iron chelation combinations: mechanisms and conditions for optimizing iron mobilization. Br J Haematol 170: 874–883, 2015[Erratum inBr J Haematol190: 629, 2020]. doi: 10.1111/bjh.13512. [DOI] [PubMed] [Google Scholar]
- 36.Houtkooper RH, Argmann C, Houten SM, Cantó C, Jeninga EH, Andreux PA, Thomas C, Doenlen R, Schoonjans K, Auwerx J. The metabolic footprint of aging in mice. Sci Rep 1: 134, 2011. doi: 10.1038/srep00134. [DOI] [PMC free article] [PubMed] [Google Scholar]
- 37.Ashraf A, Clark M, So P-W. The aging of iron man. Front Aging Neurosci 10: 65, 2018. doi: 10.3389/fnagi.2018.00065. [DOI] [PMC free article] [PubMed] [Google Scholar]
- 38.Xu J, Jia Z, Knutson MD, Leeuwenburgh C. Impaired iron status in aging research. Int J Mol Sci 13: 2368–2386, 2012. doi: 10.3390/ijms13022368. [DOI] [PMC free article] [PubMed] [Google Scholar]
- 39.Dev S, Babitt JL. Overview of iron metabolism in health and disease. Hemodial Int 21Suppl 1: S6–S20, 2017. doi: 10.1111/hdi.12542. [DOI] [PMC free article] [PubMed] [Google Scholar]
- 40.Nairz M, Theurl I, Swirski FK, Weiss G. Pumping iron—how macrophages handle iron at the systemic, microenvironmental, and cellular levels. Pflugers Arch 469: 397–418, 2017. doi: 10.1007/s00424-017-1944-8. [DOI] [PMC free article] [PubMed] [Google Scholar]
- 41.Jarvis JH, Jacobs A. Morphological abnormalities in lymphocyte mitochondria associated with iron-deficiency anaemia. J Clin Pathol 27: 973–979, 1974. doi: 10.1136/jcp.27.12.973. [DOI] [PMC free article] [PubMed] [Google Scholar]
- 42.Dallman PR, Goodman JR. The effects of iron deficiency on the hepatocyte: a biochemical and ultrastructural study. J Cell Biol 48: 79–90, 1971. doi: 10.1083/jcb.48.1.79. [DOI] [PMC free article] [PubMed] [Google Scholar]
- 43.Pantopoulos K, Porwal SK, Tartakoff A, Devireddy L. Mechanisms of mammalian iron homeostasis. Biochemistry 51: 5705–5724, 2012. doi: 10.1021/bi300752r. [DOI] [PMC free article] [PubMed] [Google Scholar]
- 44.Minhas PS, Latif-Hernandez A, McReynolds MR, Durairaj AS, Wang Q, Rubin A, Joshi AU, He JQ, Gauba E, Liu L, Wang C, Linde M, Sugiura Y, Moon PK, Majeti R, Suematsu M, Mochly-Rosen D, Weissman IL, Longo FM, Rabinowitz JD, Andreasson KI. Restoring metabolism of myeloid cells reverses cognitive decline in ageing. Nature 590: 122–128, 2021. doi: 10.1038/s41586-020-03160-0. [DOI] [PMC free article] [PubMed] [Google Scholar]
- 45.Gabrielsen JS, Gao Y, Simcox JA, Huang J, Thorup D, Jones D, Cooksey RC, Gabrielsen D, Adams TD, Hunt SC, Hopkins PN, Cefalu WT, McClain DA. Adipocyte iron regulates adiponectin and insulin sensitivity. J Clin Invest 122: 3529–3540, 2012. doi: 10.1172/JCI44421. [DOI] [PMC free article] [PubMed] [Google Scholar]
- 46.Zheng J, Chen M, Liu G, Xu E, Chen H. Ablation of hephaestin and ceruloplasmin results in iron accumulation in adipocytes and type 2 diabetes. FEBS Lett 592: 394–401, 2018. doi: 10.1002/1873-3468.12978. [DOI] [PubMed] [Google Scholar]
- 47.Wlazlo N, van Greevenbroek MMJ, Ferreira I, Jansen EHJM, Feskens EJM, van der Kallen CJH, Schalkwijk CG, Bravenboer B, Stehouwer CDA. Iron metabolism is associated with adipocyte insulin resistance and plasma adiponectin: the Cohort on Diabetes and Atherosclerosis Maastricht (CODAM) study. Diabetes Care 36: 309–315, 2013. doi: 10.2337/dc12-0505. [DOI] [PMC free article] [PubMed] [Google Scholar]
- 48.Britton L, Bridle K, Reiling J, Santrampurwala N, Wockner L, Ching H, Stuart K, Subramaniam VN, Jeffrey G, St Pierre T, House M, Gummer J, Trengove R, Olynyk J, Crawford D, Adams L. Hepatic iron concentration correlates with insulin sensitivity in nonalcoholic fatty liver disease. Hepatol Commun 2: 644–653, 2018. doi: 10.1002/hep4.1190. [DOI] [PMC free article] [PubMed] [Google Scholar]
- 49.Varghese J, James J, Vaulont S, McKie A, Jacob M. Increased intracellular iron in mouse primary hepatocytes in vitro causes activation of the Akt pathway but decreases its response to insulin. Biochim Biophys Acta Gen Subj 1862: 1870–1882, 2018. doi: 10.1016/j.bbagen.2018.05.022. [DOI] [PMC free article] [PubMed] [Google Scholar]
- 50.Ma X, Pham VT, Mori H, MacDougald OA, Shah YM, Bodary PF. Iron elevation and adipose tissue remodeling in the epididymal depot of a mouse model of polygenic obesity. PLoS One 12: e0179889, 2017. doi: 10.1371/journal.pone.0179889. [DOI] [PMC free article] [PubMed] [Google Scholar]
- 51.Kusminski CM, Ghaben AL, Morley TS, Samms RJ, Adams AC, An Y, Johnson JA, Joffin N, Onodera T, Crewe C, Holland WL, Gordillo R, Scherer PE. A novel model of diabetic complications: adipocyte mitochondrial dysfunction triggers massive beta-cell hyperplasia. Diabetes 69: 313–330, 2020. doi: 10.2337/db19-0327. [DOI] [PMC free article] [PubMed] [Google Scholar]