

Abstract
Macrophages are critical regulators of pulmonary fibrosis. Their plasticity, proximity, and ability to cross talk with structural cells of the lung make them a key cell type of interest in the regulation of lung fibrosis. Macrophages can express a variety of phenotypes, which have been historically represented through an “M1-like” to “M2-like” delineation. In this classification, M1-like macrophages are proinflammatory and have increased phagocytic capacity compared with alternatively activated M2-like macrophages that are profibrotic and are associated with wound healing. Extensive evidence in the field in both patients and animal models aligns pulmonary fibrosis with M2 macrophages. In this study, we performed RNA sequencing (RNAseq) to fully characterize M1- vs. M2-skewed bone marrow-derived macrophages (BMDMs) and investigated the profibrotic abilities of M2 BMDM conditioned media (CM) to promote fibroblast migration and proliferation, alveolar epithelial cell (AEC) apoptosis, and mRNA expression of key fibrotic genes in both fibroblasts and AECs. Although M2 CM-treated fibroblasts had increased migration and M2 CM-treated fibroblasts and AECs had increased expression of profibrotic proteins over M1 CM-treated cells, all differences can be attributed to M2 polarization reagents IL-4 and IL-13 also present in the CM. Collectively, these data suggest that the profibrotic effects associated with M2 macrophage CM in vitro are attributable to effects of polarization cytokines rather than additional factors secreted in response to those polarizing cytokines.
Keywords: alveolar epithelial cell, fibroblast, fibrosis, M1/M2 macrophage, RNAseq
INTRODUCTION
Idiopathic pulmonary fibrosis (IPF) is a chronic fibrosing interstitial lung disease of unknown etiology (1–3).The most lethal of the interstitial lung diseases, IPF causes mortality in >50% of patients within 3 yr of diagnosis (4–6). Experts consider IPF to be a form of aberrant wound healing in which repeated microinjuries to the epithelium disrupt the epithelial barrier, promote fibroblast activation and lead to excessive deposition of extracellular matrix (ECM) proteins, and culminate in scar formation and eventual death. Historically, IPF was thought to be an exclusively fibroblast-epithelial disease, but work in the last two decades points to innate immune cells having a critical role in the development and progression of fibrosis (2, 6–10).
Monocytes and macrophages have received particular attention for their role in IPF because of their plasticity, proximity to the epithelium, and abilities to cross talk with structural cells of interest (5, 6, 8, 11, 12). Studies have shown that alveolar epithelial cells (AECs) secrete cytokines that attract inflammatory cells to areas of injury and that these cytokines promote migration, proliferation, and activation of fibroblasts (12). Macrophages are also able to communicate with fibroblasts through juxtacrine and paracrine signaling (13).
Bone marrow-derived macrophages (BMDMs) are often used as a cell source to study cellular cross talk systems in vitro. To mirror the range of macrophage phenotypes in a simplified version, researchers often use the M1/M2 dichotomy. In this model, lipopolysaccharide (LPS) and interferon (IFN)-γ are added to BMDM media to create proinflammatory M1 macrophages, characterized by increased phagocytic capacity and increased iNOS and TNFα expression (14–17), and IL-4 and IL-13 are added to BMDM media to create “alternatively activated” M2 macrophages, associated with fibrosis and characterized by high expression of Arginase1 (Arg1), Fizz1/RELMα, and CD206 (4, 14, 15, 18, 19). Despite frequent use, many studies fail to consider the implications of treatment conditions needed to differentiate or maintain macrophages in the M1/M2 phenotype in vitro. In this study, we used the classically described model of M1/M2 polarization to systematically determine whether fibroblast or AEC responses were attributable to unique factors in M1/M2 macrophage conditioned media (CM) that were distinct from the factors used for polarization in the growth media. In particular, we sought to determine whether strongly M2-polarized BMDM CM promote fibroblast migration, proliferation, AEC apoptosis, and mRNA expression of key fibrotic genes in both fibroblasts and AECs. Surprisingly, all differences can be attributed to the presence of IL-4 and IL-13 as the polarizing reagents, but no additional effects from the M2-skewed BMDM CM are present.
MATERIALS AND METHODS
Animals and Housing
Six- to eight-week-old male and female C57BL/6 mice were purchased from The Jackson Laboratory (Bar Harbor, ME) and housed in specific pathogen-free conditions within the University of Michigan Animal Care Facility (Ann Arbor, MI). Six- to eight-week-old house-bred male and female Lyz2Cre+ mice (C57BL/6 background, parent pair purchased from The Jackson Laboratory), considered a functional wild type, were housed similarly to purchased C57BL/6 mice and were used synonymously as wild type alongside C57BL/6 mice. All animal experiments were approved by the Institutional Animal Committee on Use and Care (IACUC) at the University of Michigan and were performed in accordance with National Institutes of Health policies on the humane care and use of laboratory animals.
RT-qPCR
RNA for RT-qPCR experiments was obtained from isolated cells via TRIzol (Thermo Fisher, Waltham, MA) extraction according to the manufacturer’s protocol. Equivalent RNA was subjected to RT-qPCR performed on an ABI StepOnePlus real-time thermocycler (Thermo Fisher) with a TaqMan RNA-to-Ct 1-Step Kit (Thermo Fisher) according to the manufacturer’s protocol. The gene of interest was normalized between samples to GAPDH expression using delta CT values. All primers and probes used in this study are listed in Table 1.
Table 1.
Primer-probe list
| Gene | Direction | Sequence |
|---|---|---|
| Fizz1 | Forward | 5′-TCCAGCTAACTATCCCTCCACTGT-3′ |
| Reverse | 5′-AGCCACAAGCACACCCAGTAG-3′ | |
| Probe | 5′-ATGAACAGATGGGCCTCCTGCCCT-3′ | |
| Arg1 | Forward | 5′-ACCACAGTCTGGCAGTTGGAA-3′ |
| Reverse | 5′-GCATCCACCCAAATGACACA-3′ | |
| Probe | 5′-CTGGCCACGCCAGGGTCCAC-3′ | |
| IL10 | Forward | 5′-GGGTTGCCAAGCCTTATCG-3′ |
| Reverse | 5′-CACCCAGGGAATTCAAATGC-3′ | |
| Probe | 5′-CAGGCAGAGAAGCATGGCCCAGAA-3′ | |
| Hbegf | Forward | 5′-CGGTGATGCTGAAGCTCTTT-3′ |
| Reverse | 5′-GCTGGTTTGTGGATCCAGTG-3′ | |
| Probe | 5′-ACGCGGACAACACTGCGGCC-3′ | |
| Tnfα | Forward | 5′-CCAGACCCTCACACTCAGATCA-3′ |
| Reverse | 5′-CCTCCACTTGGTGGTTTGCT-3′ | |
| Probe | 5′-TCGAGTGACAAGCCTGTAGCCCACG-3′ | |
| iNOS | Forward | 5′-ACATCAGGTCGGCCATCACT-3′ |
| Reverse | 5′-CGTACCGGATGAGCTGTGAAT-3′ | |
| Probe | 5′-CCCCAGCGGAGTGACGGCA-3′ | |
| Col1 | Forward | 5′-TGACTGGAAGAGCGGAGAGTACT-3′ |
| Reverse | 5′-GGTCTGACCTGTCTCCATGTTG-3′ | |
| Probe | 5′-CTGCAACCTGGACGCCATCAAGG-3′ | |
| Col3 | Forward | 5′-GGATCTGTCCTTTGCGATGAC-3′ |
| Reverse | 5′-GCTGTGGGCATATTGCACAA-3′ | |
| Probe | 5′-TGCCCCAACCCAGAGATCCCATTT-3′ | |
| Fibronectin | Forward | 5′-TCGAGCCCTGAGGATGGA-3′ |
| Reverse | 5′-GTGCAAGGCAACCACACTGA-3′ | |
| Probe | 5′-CTGCAGGGCCTCAGGCCGG-3′ | |
| Periostin | Forward | 5′-GGGGTTGTCACTGTGAACTG-3′ |
| Reverse | 5′-CGGCTGCTCTAAATGATGAA-3′ | |
| Probe | 5′-CGTGTCCTGACACAAATTGG-3′ | |
| Cox2 | Forward | 5′-TGACCCCAAGGCTCAAAT-3′ |
| Reverse | 5′-GAACCCAGGTCCTCGCTTATG-3′ | |
| Probe | 5′-TTTGCCCAGCACTTCACCCATCAG-3′ | |
| EP2 | Forward | 5′-CAGTCCTCTGTTGTCGGACT-3′ |
| Reverse | 5′-CATGAAGCGCATCCTCACAA-3′ | |
| Probe | 5′-CCTGTTCTACCCAGTCCAGTGCCA-3′ | |
| EP4 | Forward | 5′-TCTCTGGTGGTGCTCATCTG-3′ |
| Reverse | 5′-GTCTTTCACCACGTTTGGCT-3′ | |
| Probe | 5′-ACACTCGCACCACGAGCGGA-3′ | |
| PGE synthase | Forward | 5′-AACCTGGGCGAGTGGATCT-3′ |
| Reverse | 5′-CTGTAAGTGGCTCCAAATGGG-3′ | |
| Probe | 5′-ACATGTGTGTTTCTTAGCCTTTTG-3′ | |
| survivin | Forward | 5′-GATCTGGCAGCTGTACCTCA-3′ |
| Reverse | 5′-ATCAGGCTCGTTCTCGGTAG-3′ | |
| Probe | 5′-CTGGAGGACTGCGCCTGCAC-3′ | |
| XIAP | Forward | 5′-ACCCTGCCATGTGTAGTGAA-3′ |
| Reverse | 5′-TCTCTGGGGGTTAAATGAGC-3′ | |
| Probe | 5′-TGAAGTCATTTCAGAACTGGCCGG-3′ | |
| BCL2 | Forward | 5′-GGAGTGTGAGGACCCAATCT-3′ |
| Reverse | 5′-CAACCACACCATCGATCTTC-3′ | |
| Probe | 5′-AGCCCCAGACCCCAACTCC-3′ | |
| VEGF | Forward | 5′-CTTGCAGATGTGACAAGCCA-3′ |
| Reverse | 5′-GAGAGGTCTGGTTCCCGAAA-3′ | |
| Probe | 5′-TGCAGCCTGGCTCACCGCCT-3′ | |
| CTGF | Forward | 5′-GAGTGTGCACTGCCAAAGAT-3′ |
| Reverse | 5′-GGCAAGTGCATTGGTATTTG-3′ | |
| Probe | 5′-CGCAGCGGTGAGTCCTTCCA-3′ | |
| PDGFα | Forward | 5′-CGAAGTCAGATCCACAGCAT-3′ |
| Reverse | 5′-GGGCTCTCAGACTTGTCTCC-3′ | |
| Probe | 5′-CCGGGACCTCCAGCGACTCT-3′ | |
| GAPDH | Forward | 5′-GGGCCACGCTAATCTCATTT-3′ |
| Reverse | 5′-ATACGGCCAAATCCGTTCAC-3′ | |
| Probe | 5′-CTCCTCGAGCCTCGTCCCGT-3′ |
Cell Isolation
To isolate fibroblasts, mice were euthanized under CO2 and their lungs perfused with sterile PBS via the right ventricle. Lungs were excised under aseptic conditions and minced with scissors. The lung mince was then placed in a T175 tissue culture-treated plastic flask with ∼30 mL of Dulbecco’s modified Eagle’s medium (DMEM) + 10% fetal bovine serum (FBS). Fibroblasts were allowed to grow for 14 days, with media changes every 3–4 days before use.
BMDMs were isolated as described previously (20, 21). Briefly, bone marrow cells were collected from mice after CO2 euthanasia by flushing their femurs and tibias with 10% DMEM. These cells were cultured in bone marrow medium (30% L cell supernatant, 70% DMEM + 10% FBS media) for 6 days, with fresh media added every 2 days. On day 6, cells were counted and replated at 1 million cells/well in a 12-well plate overnight in complete DMEM. On day 7, BMDMs were treated with recombinant murine (rm)IFN-γ (50 ng/mL, R&D Systems, Minneapolis, MN) and Escherichia coli-derived lipopolysaccharide (LPS, 100 ng/mL; Sigma-Aldrich, St. Louis, MO) in serum-free medium (SFM) for “M1-like” polarization or were treated with rmIL-4 (10 ng/mL, R&D Systems) and rmIL-13 (10 ng/mL, R&D Systems) in SFM for “M2-like” polarization. M1 or M2 polarization reagents placed in SFM were considered “polarizing growth media” and placed on BMDMs for 24 h to polarize BMDMs to an M1 or M2 phenotype. BMDMs were considered fully polarized at the conclusion of 24 h. Cells and/or supernatant from M1 or M2 BMDMs were collected at the end of this 24-h polarization period. As M1 or M2 BMDMs are presumed to secrete additional factors into the media during this polarization period, the supernatant removed from M1/M2 BMDMs is considered to be different from the polarizing growth media and is referred to as “conditioned media” (CM). In experiments using heated BMDM CM, CM was thawed from frozen, put in 1-mL aliquots, and heated at 100°C on a heat block for 10 min.
Alveolar epithelial cells (AECs) were isolated with a whole lung dispase digestion after casting airways in low-melt agarose as previously described (22). After isolation, AECs were plated overnight at 500,000 cells/well on 24-well plates coated in undiluted Matrigel (BD Biosciences, San Jose, CA) for RNA extraction or at 50,000 cells/well on opaque 96-well plates for apoptosis assays. AECs were treated for a total of 24 h after initial overnight plating. As AECs were used within 48 h of isolation, these AECs were considered undifferentiated type 2-like cells.
RNAseq Analysis
RNA sequencing (RNAseq) analysis was performed on BMDMs isolated and polarized to either an M1-like or an M2-like phenotype, as described above. Polarized BMDMs were isolated and RNA was extracted with a RNeasy column kit (Qiagen, Germantown, MD) per the manufacturer’s directions. RNA integrity was assessed on an Agilent Bioanalyzer (Agilent, Santa Clara, CA). Only samples with an RNA integrity value of at least 8 were used in RNA sequence analysis. RNA sequencing was performed by GENEWIZ (South Plainfield, NJ) with their standard RNA sequencing pipeline. In short, sequence reads (30–50 million read depth) were trimmed to remove likely adapter sequences and nucleotides with poor quality with Trimmomatic v.0.36. Reads were mapped to the ENSEMBL mouse reference genome with STAR aligner v.2.5.2b. Unique gene hit counts were calculated by using feature counts from the Subread package v.1.5.2. Only unique reads that fell within exon regions were counted. Transcript counts were normalized, and differential expression statistics were calculated with DESeq2 (Supplemental Table S1; all Supplemental Tables are available at https://doi.org/10.6084/m9.figshare.14818545). RNAseq data were visualized with Python 3.7 and a combination of Matplotlib, scikit-learn, and seaborn packages. Both raw and processed RNAseq data are available in total through the Gene Expression Omnibus (GEO, accession number GSE167982). For further analysis, all candidate genes identified during Python visualization were run through the ClueGO plug-in (version 2.5.7) for Cytoscape (version 3.8.0) to group data by molecular function (see Figs. 7 and 8) or by biological process (see Figs. 1 and 8) into biological nodes determined by ClueGO. The specific P values used to place these genes into thematic groups and subthematic nodes based on component similarity ranged between P < 0.05 and P < 0.0001. For analysis in Fig. 1, A and B (Supplemental Table S2), Fig. 7B (Supplemental Table S3), Fig. 7C (Supplemental Table S4), Fig. 8A (Supplemental Table S5), and Fig. 8B (Supplemental Table S6), all subtheme nodes were combined under their thematic group name and all gene duplicates were removed. The overall percentage prevalence of each group as labeled in pie charts in Fig. 7, B and C, and Fig. 8, A and B, was determined by dividing the number of unique genes present in one group by the total number of genes summed across all groups. Overall enrichment score was calculated by taking the negative log of the each term’s P value and then averaging all enrichment scores within a functional group [i.e., log(averaged P value) × −1].
Figure 7.

M1 and M2 bone marrow-derived macrophages (BMDMs) have different transcriptome profiles for secreted proteins based on RNA sequencing (RNAseq) analysis. A: RNAseq data show an increased number of genes for secreted proteases in M2 BMDMs (negative log2 values) compared with M1 BMDMs (positive log2 values). B and C: BMDMs polarized to an M1-like (B) or M2-like (C) phenotype show differences in molecular function categories as calculated by the ClueGO plug-in of Cytoscape. In B and C, ClueGO analysis organized upregulated genes into groups by molecular function as described in materials and methods. Percentages were calculated by dividing the number of genes present in each molecular function group by the total number of all genes. n.s., Not statistically different.
Figure 8.

M2 transcriptome data highlight proteases that may be responsible for cleavage of Caspase-Glo 3/7 substrate in the alveolar epithelial cell (AEC) apoptosis assay. A and B: peptidases defined in the M2 transcriptome for secreted proteins (Fig. 7) were further characterized by molecular function (A) and biological process (B) and reanalyzed with ClueGO as described in materials and methods. C and D: pretreatment of M1 conditioned media (CM) (C) or M2 CM (D) with protease inhibitors Pierce pan-cocktail (PC; 5× and 0.5× standard concentration), aprotinin (0.75 μM), E-64 (1 μM), or 4-(2-aminoethyl)benzenesulfonyl fluoride (AEBSF; 1 μM) was done to quantify depletion of luminescence. ns, Not statistically different. ***P < 0.001, ****P < 0.0001. Experiments repeated twice, n = 3–4.
Figure 1.

M1 and M2 bone marrow-derived macrophages (BMDMs) have different gene expression profiles based on RNA sequencing (RNAseq) analysis. RNAseq analysis of the top 5% of genes (270 genes) using the ClueGO plug-in of Cytoscape shows drastically different prominent biological themes in M1 (A) and M2 (B) BMDMs as analyzed by biological process. Additionally, M1 and M2 BMDMs exhibit different transcriptome profiles (C), and M2 BMDMs have an increased number of differentially expressed genes for secreted proteins compared with M1 BMDMs (D). In C and D, negative log2 expression values correlate to genes enhanced in M2 BMDMs and positive log2 expression values correlate to genes enhanced in M1 BMDMs. GO, Gene Ontology. n.s., Not statistically different.
Fibroblast Proliferation and Migration
Fibroblasts were plated at 10,000 cells/well in a 96-well plate in complete DMEM for 4 h, followed by overnight treatment in SFM. 90 μL of macrophage CM or polarizing growth media without cells were added to their respective wells for 48 h before 10 µL of 3-(4,5-dimethylthiazol-2-yl)-3,5-diphenyltetrazolium bromide (MTT) solution was added to each well and allowed to incorporate for another 24 h. After mixing in MTT stop solution with a multichannel pipette, the plate was read according to manufacturer’s instructions (Sigma-Aldrich).
To investigate fibroblast migration with a scratch wound assay, fibroblasts were plated at 20,000 cells/well in clear-bottomed 96-well plates (Essen BioScience #4378, Ann Arbor, MI) overnight in DMEM + 10% FBS. After fibroblast adherence, complete medium was washed away and replaced with SFM overnight (200-µL volume). The next day, the Wound Maker was used to create a uniform scratch in each well. Cells were rinsed two times in SFM and replaced with corresponding CM/polarizing growth media (50–100 µL), and the plate was placed at 37°C. Pictures were taken with Incucyte software every 4 h for up to 5 days. In all figures, M1 or M2 is used to denote M1 or M2 CM, respectively, and LPS + IFN-γ or IL-4 + IL-13 is used to denote the respective M1 or M2 polarization growth medium.
AEC Apoptosis
Isolated AECs were plated overnight at 50,000 cells/well in a white-bottomed 96-well plate (Corning) in complete small airway growth medium (SAGM; Lonza, Morristown, NJ) plus human keratinocyte growth factor (KGF; PeproTech Inc., Cranbury, NJ). The 96-well plate had previously been coated with undiluted Matrigel to retain a type 2 AEC phenotype of cultured cells. After initial cell sit-down, medium was aspirated, and cells were rinsed in SFM before addition of BMDM CM or polarizing growth medium for 24 h. Upon completion of the assay, Caspase-Glo 3/7 (Roche, Indianapolis, IN) was added in a 1:1 dilution and activation of caspase-3/7 was measured according to the manufacturer’s guidelines. Samples were analyzed with an M3 Microplate Luminometer, and the value was expressed in relative luminescence units compared with control AECs maintained in SFM alone. In some experiments recombinant cathepsin-D (R&D Systems) was tested for ability to cleave the caspase-3 substrate, but results were negative (data not shown).
Protease Inhibitor Studies
M1 or M2 BMDM CM was thawed from frozen and used in protease inhibitor studies (see Fig. 8). BMDM CM was treated with serine protease inhibitor 4-(2-aminoethyl)benzenesulfonyl fluoride (AEBSF) (1 µM; Sigma-Aldrich #SBR00015), serine protease inhibitor aprotinin (0.75 µM; Sigma-Aldrich #A1153), cysteine inhibitor E-64 (1 µM; Sigma-Aldrich #E3132), or pan-protease inhibitor Pierce Protease Inhibitor (5× and 0.5× standard concentration; Mini Tablets, Thermo Fisher #A32955). CM + inhibitors were allowed to incubate together for 1 h before being plated on a white-bottomed 96-well plate. Caspase-Glo 3/7 was added in a 1:1 dilution, and samples were measured and analyzed as described above.
Flow Cytometry
AECs were isolated and plated at 2 million cells/well in a six-well plate on fibronectin-coated plates overnight. Fibronectin-coated plates were used to increase technical feasibility for the assay, as dissociating AECs from Matrigel resulted in very low cell yields. The next day, cells were rinsed and medium was replaced with BMDM CM for 24 h. For flow analysis, nonspecific Fc binding was blocked with a CD16/32 antibody. Subsequently, primary antibodies were added to cell samples and incubated for 30 min in the dark at 4°C. Primary antibodies used were anti-CD45 and anti-Epcam/CD326 (BD Biosciences) to identify AECs and Zombie Violet and Apotracker (BioLegend, San Diego, CA) for apoptosis. Total cell number was compared between samples by one-way ANOVA analysis with GraphPad Prism.
Statistics
Statistical analyses were performed with the GraphPad Prism software package (GraphPad Software, La Jolla, CA). After a normality test, differences between experimental groups were determined by one-way ANOVA with a Tukey posttest (for comparing 3 or more groups) if normally distributed. Nonnormally distributed data were analyzed by Kruskal–Wallis test and Dunn’s multiple comparison posttest. Differences were considered statistically significant when P < 0.05. All data are represented as means ± SE. All experiments were repeated at least in duplicate, with similar results. Pertinent statistical information, i.e., n values, experiment number, and P values, is given in individual figure legends.
RESULTS
RNAseq Shows Unique Differences between M1 and M2 BMDMs
To determine whether M2 secreted factors were responsible for profibrotic effects of macrophages in the lung, we first wanted to understand the M1 vs. M2 transcriptome in an unbiased fashion. To do this, we performed RNAseq on BMDMs polarized to an M1 or M2 phenotype. As an initial overview analysis, we inputted the top 5% (top 270 genes) of the most highly upregulated or downregulated genes from the RNAseq analysis into the ClueGO plug-in of Cytoscape (Supplemental Table S1). We chose to use this plug-in to organize all inputted genes into family gene group clusters based on biological process. ClueGO analysis demonstrated that gene group clusters with the highest enrichment values in M1 BMDMs were related to inflammation, particularly the cell response to cytokine, to virus, to protozoan, and to interferon-β (Fig. 1A). In contrast, clusters with the highest enrichment values in M2 BMDMs were related to cell processing, including categories of chondrocyte differentiation, connective tissue development, and positive regulation of myelination (Fig. 1B). To visualize these differences in genes pertaining to molecular function between M1 and M2 BMDMs, we employed the Matplotlib, scikit-learn, and seaborn packages from Python. Visualization in Python confirmed a large number of genes whose expression differs significantly between M1 and M2 BMDMs (Fig. 1C). The RNAseq data also indicate that M2 BMDMs have a higher number of genes encoding for secreted proteins than M1 BMDMs (Fig. 1D), providing additional rationale to further probe how M1/M2 secreted proteins initiate a profibrotic response in lung structural cells.
BMDM Polarization in Vitro Shows Accurate M1 and M2 Phenotypes
As our RNAseq data yielded notable differences in gene expression between M1 and M2 BMDMs, we next wondered how differences in expressed genes can alter macrophage function and phenotype in pulmonary fibrosis. As data from the literature assert that profibrotic macrophages are M2-like, we chose to use BMDMs and polarize them in vitro to an M1 or M2 phenotype for further study. BMDMs are an ideal cell candidate as 1) they are an accessible macrophage population that can be isolated in abundance (23–25) and 2) recent work has shown that monocyte-derived alveolar macrophages (moAMs), derived from bone marrow precursors (26), are pathogenic and that their recruitment to the lung along with Ly6Cihi monocytes is highly responsible for fibrosis development and progression (9).
BMDMs polarized to M1 (100 ng/mL LPS + 50 ng/mL IFN-γ) or M2 (10 ng/mL IL-4 + 10 ng/mL IL-13) showed a highly consistent and differential phenotype (Fig. 2). M1 BMDMs exhibited high iNOS and TNFα expression (Fig. 2, A and B) compared with M2 BMDMs, which more highly expressed Fizz1 (Fig. 2C), Arg1 (Fig. 2D), and IL-10 (Fig. 2E) as well as CD163 (Fig. 2F) and CD206 (Fig. 2G). The relative expression of these key markers in the M1 and M2 BMDMs matches those of other published work in the field (4, 14, 15, 27). M2 BMDMs also showed increased expression of heparin binding epidermal growth factor-like growth factor (HB-EGF) (Fig. 2H). Although a lesser-known marker in the lung field, HB-EGF is used widely as an M2 marker in the pancreas literature (28). In addition to clear fold change differences at the transcript levels, these M1-M2 phenotypes also hold at the protein level (Supplemental Fig. S1; all Supplemental Figures are available at https://doi.org/10.6084/m9.figshare.14818566), as M2 BMDMs exhibit increased Arg1+ protein expression and M1 BMDMs exhibit increased iNOS+ protein expression via flow cytometry.
Figure 2.
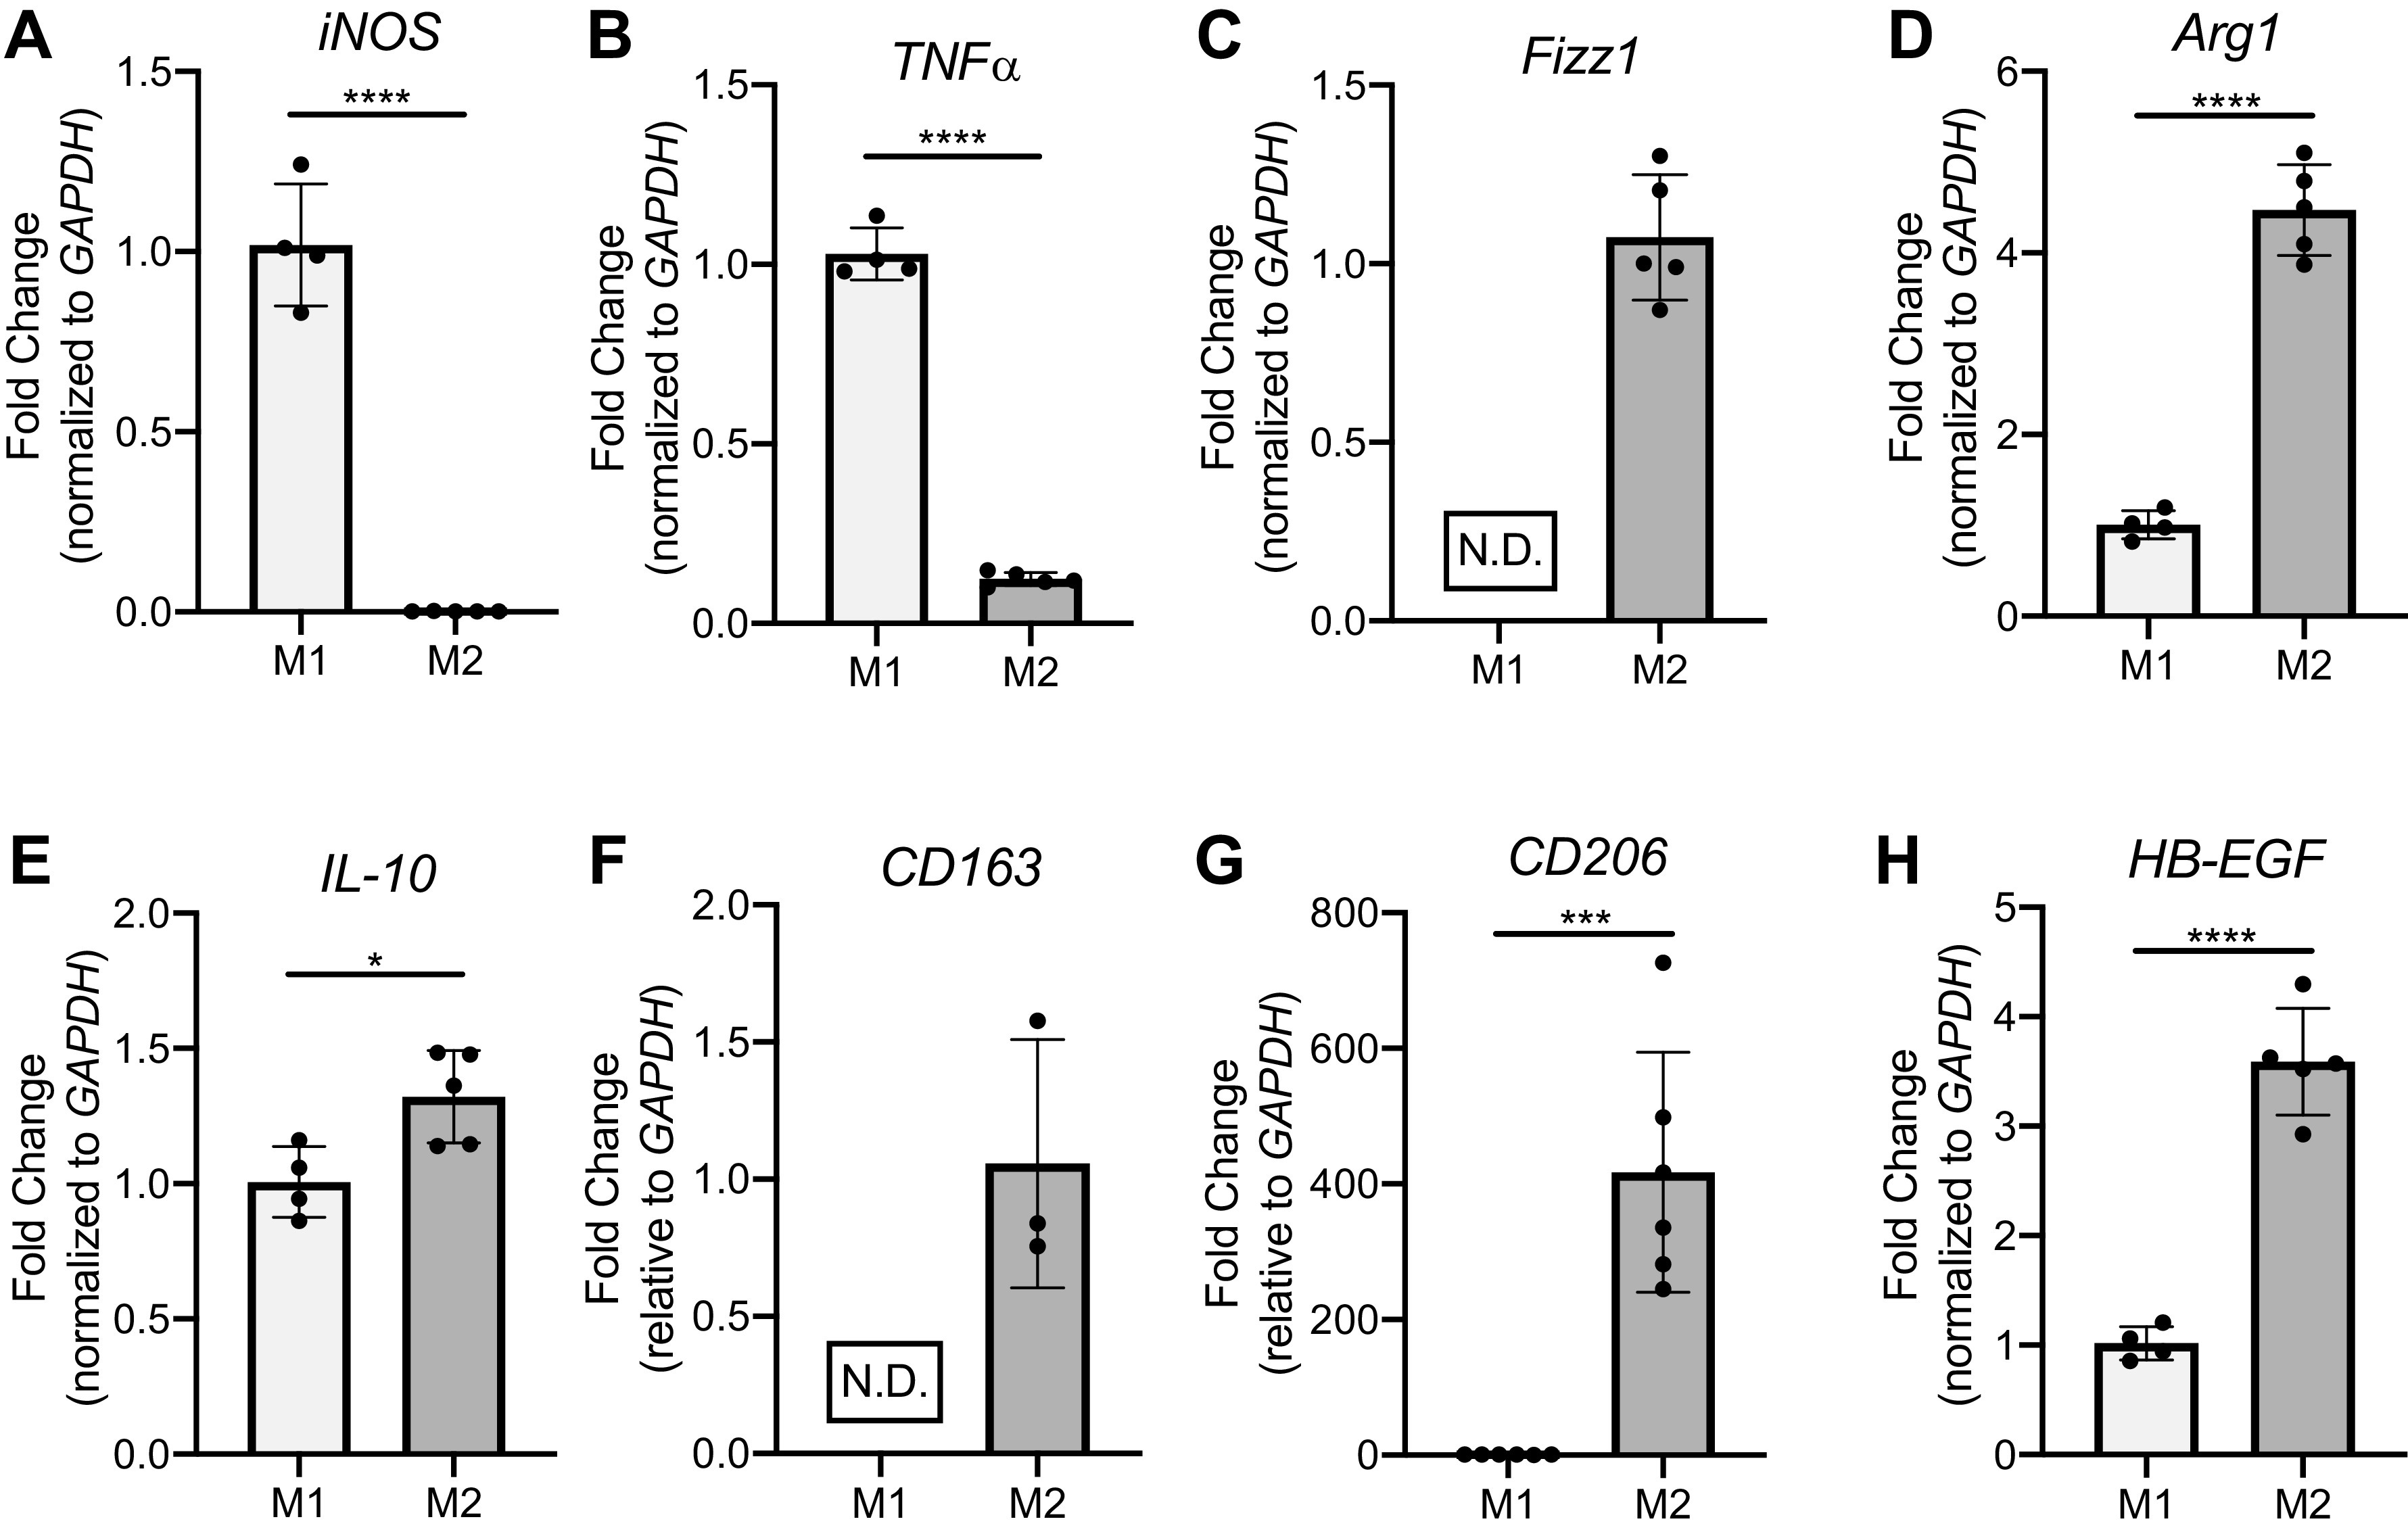
Bone marrow-derived macrophages (BMDMs) achieve a reliable M1 or M2 polarization when given standard combinations of polarizing reagents lipopolysaccharide (LPS) + interferon (IFN)-γ (M1) or IL-4 + IL-13 (M2). BMDMs were polarized to an M1-like (100 ng/mL LPS + 50 ng/mL IFN-γ) or M2-like (10 ng/mL IL-13 + 10 ng/mL IL-4) phenotype for 24 h before being isolated for RNA extraction. Representative RT-qPCR data of M1 genes iNOS (A) and TNFα (B) and M2 genes Fizz1 (C), Arg1 (D), IL-10 (E), CD163 (F), CD206 (G), and HB-EGF (H) are shown. N.D., not detected. *P < 0.05, ***P < 0.001, ****P < 0.0001. All data representative of 3–7 experiments; n = 4, 5.
The Increased M2 CM Effect on Fibroblast Migration Is Explained by M2-Polarizing Reagents IL-4 and IL-13
Fibroblasts are located adjacent to alveolar epithelial cells (AECs) along the basement membrane in the healthy lung, where they serve as key structural cells by maintaining normal tissue architecture through the deposition and maintenance of extracellular matrix (ECM) proteins (12). Microinjuries to the epithelium can lead to AEC apoptosis, causing gaps in the epithelial lining that can be closed by activated fibroblasts proliferating and migrating to the wound site (12). We investigated the effects of M1 and M2 CM on the ability of primary lung fibroblasts to proliferate and migrate. MTT assays showed that fibroblasts treated with either M1 or M2 CM had increased proliferation over the serum-free medium control (Fig. 3, A and B). However, this level of increased proliferation with macrophage CM was not different compared with the respective polarization growth media controls; fibroblasts given M1 CM showed the same amount of proliferation as those given LPS + IFN-γ polarization growth media, and treatment with M2 CM or IL-4 + IL-13 polarization growth media yielded the same amount of proliferation (Fig. 3, A and B).
Figure 3.

Effects of macrophage conditioned media (CM) on fibroblast proliferation and migration are recapitulated by polarization cytokines. M1 and M2 CM or their respective polarization growth media (LPS+IFN-γ or IL-4+IL-13) were put on untreated primary lung fibroblasts for proliferation and scratch wound assays. Fibroblasts treated with M1 (A) or M2 (B) CM show increased proliferation over serum-free medium (SFM) via 3-(4,5-dimethylthiazol-2-yl)-3,5-diphenyltetrazolium bromide (MTT) assay after 48 h, although no difference was noted between CM and respective polarization media controls. Representative sample (2 experiments, n = 6). C: representative scratch wound assay showing that M2 CM and IL-4+IL-13 polarization media cause the fastest wound closure (migration) but that there is no difference between the 2 treatments. ns, Not statistically different. *P < 0.05, **P < 0.01. Data in C are representative of at least 3 experiments, n = 5 per group.
To determine fibroblast migration capabilities, we seeded fibroblasts at a set density and performed a scratch wound assay, using Incucyte image software to quantify the wound distance over time (Fig. 3C). Fibroblasts given M2 CM closed the scratched area faster than either the control or fibroblasts given M1 CM. Interestingly, fibroblasts given M1 CM after scratch failed to close the wound. Similar to fibroblast proliferation, polarization growth media controls in the scratch wound assay show that differences in fibroblast migration are explained by their respective polarizing reagents present in the CM, as overall migration was not different between fibroblasts given M2 CM and IL-4 + IL-13 or between fibroblasts given M1 CM and LPS + IFN-γ.
The Increased M2 CM Effect on Fibroblast mRNA Transcript Expression of Key Profibrotic and Antiapoptotic Factors Is Explained by M2-Polarizing Reagents IL-4 and IL-13
In addition to increased accumulation and migration, lung fibroblasts also become highly activated during fibrosis (29). Their increased activation promotes production of ECM proteins, leading to scar formation that reduces overall lung elasticity (12). Additionally, primary lung fibroblasts from IPF patients have been shown to be resistant to apoptosis (12, 30, 31).
ECM components secreted by fibroblasts include collagens, glycoproteins, and proteoglycans (12). Fibroblasts given M2 CM had increased expression of collagen 1, collagen 3, fibronectin, and periostin (Fig. 4A) compared with cells given M1 CM, consistent with the rationale that M2 macrophages cause profibrotic effects in fibroblasts. When these fold changes induced by M1 and M2 CM were compared to their polarization growth media controls, however, no statistical difference was noted, implying that the increased M2 effect on fibroblast expression of these ECM genes is explained by polarizing reagents present in the CM.
Figure 4.
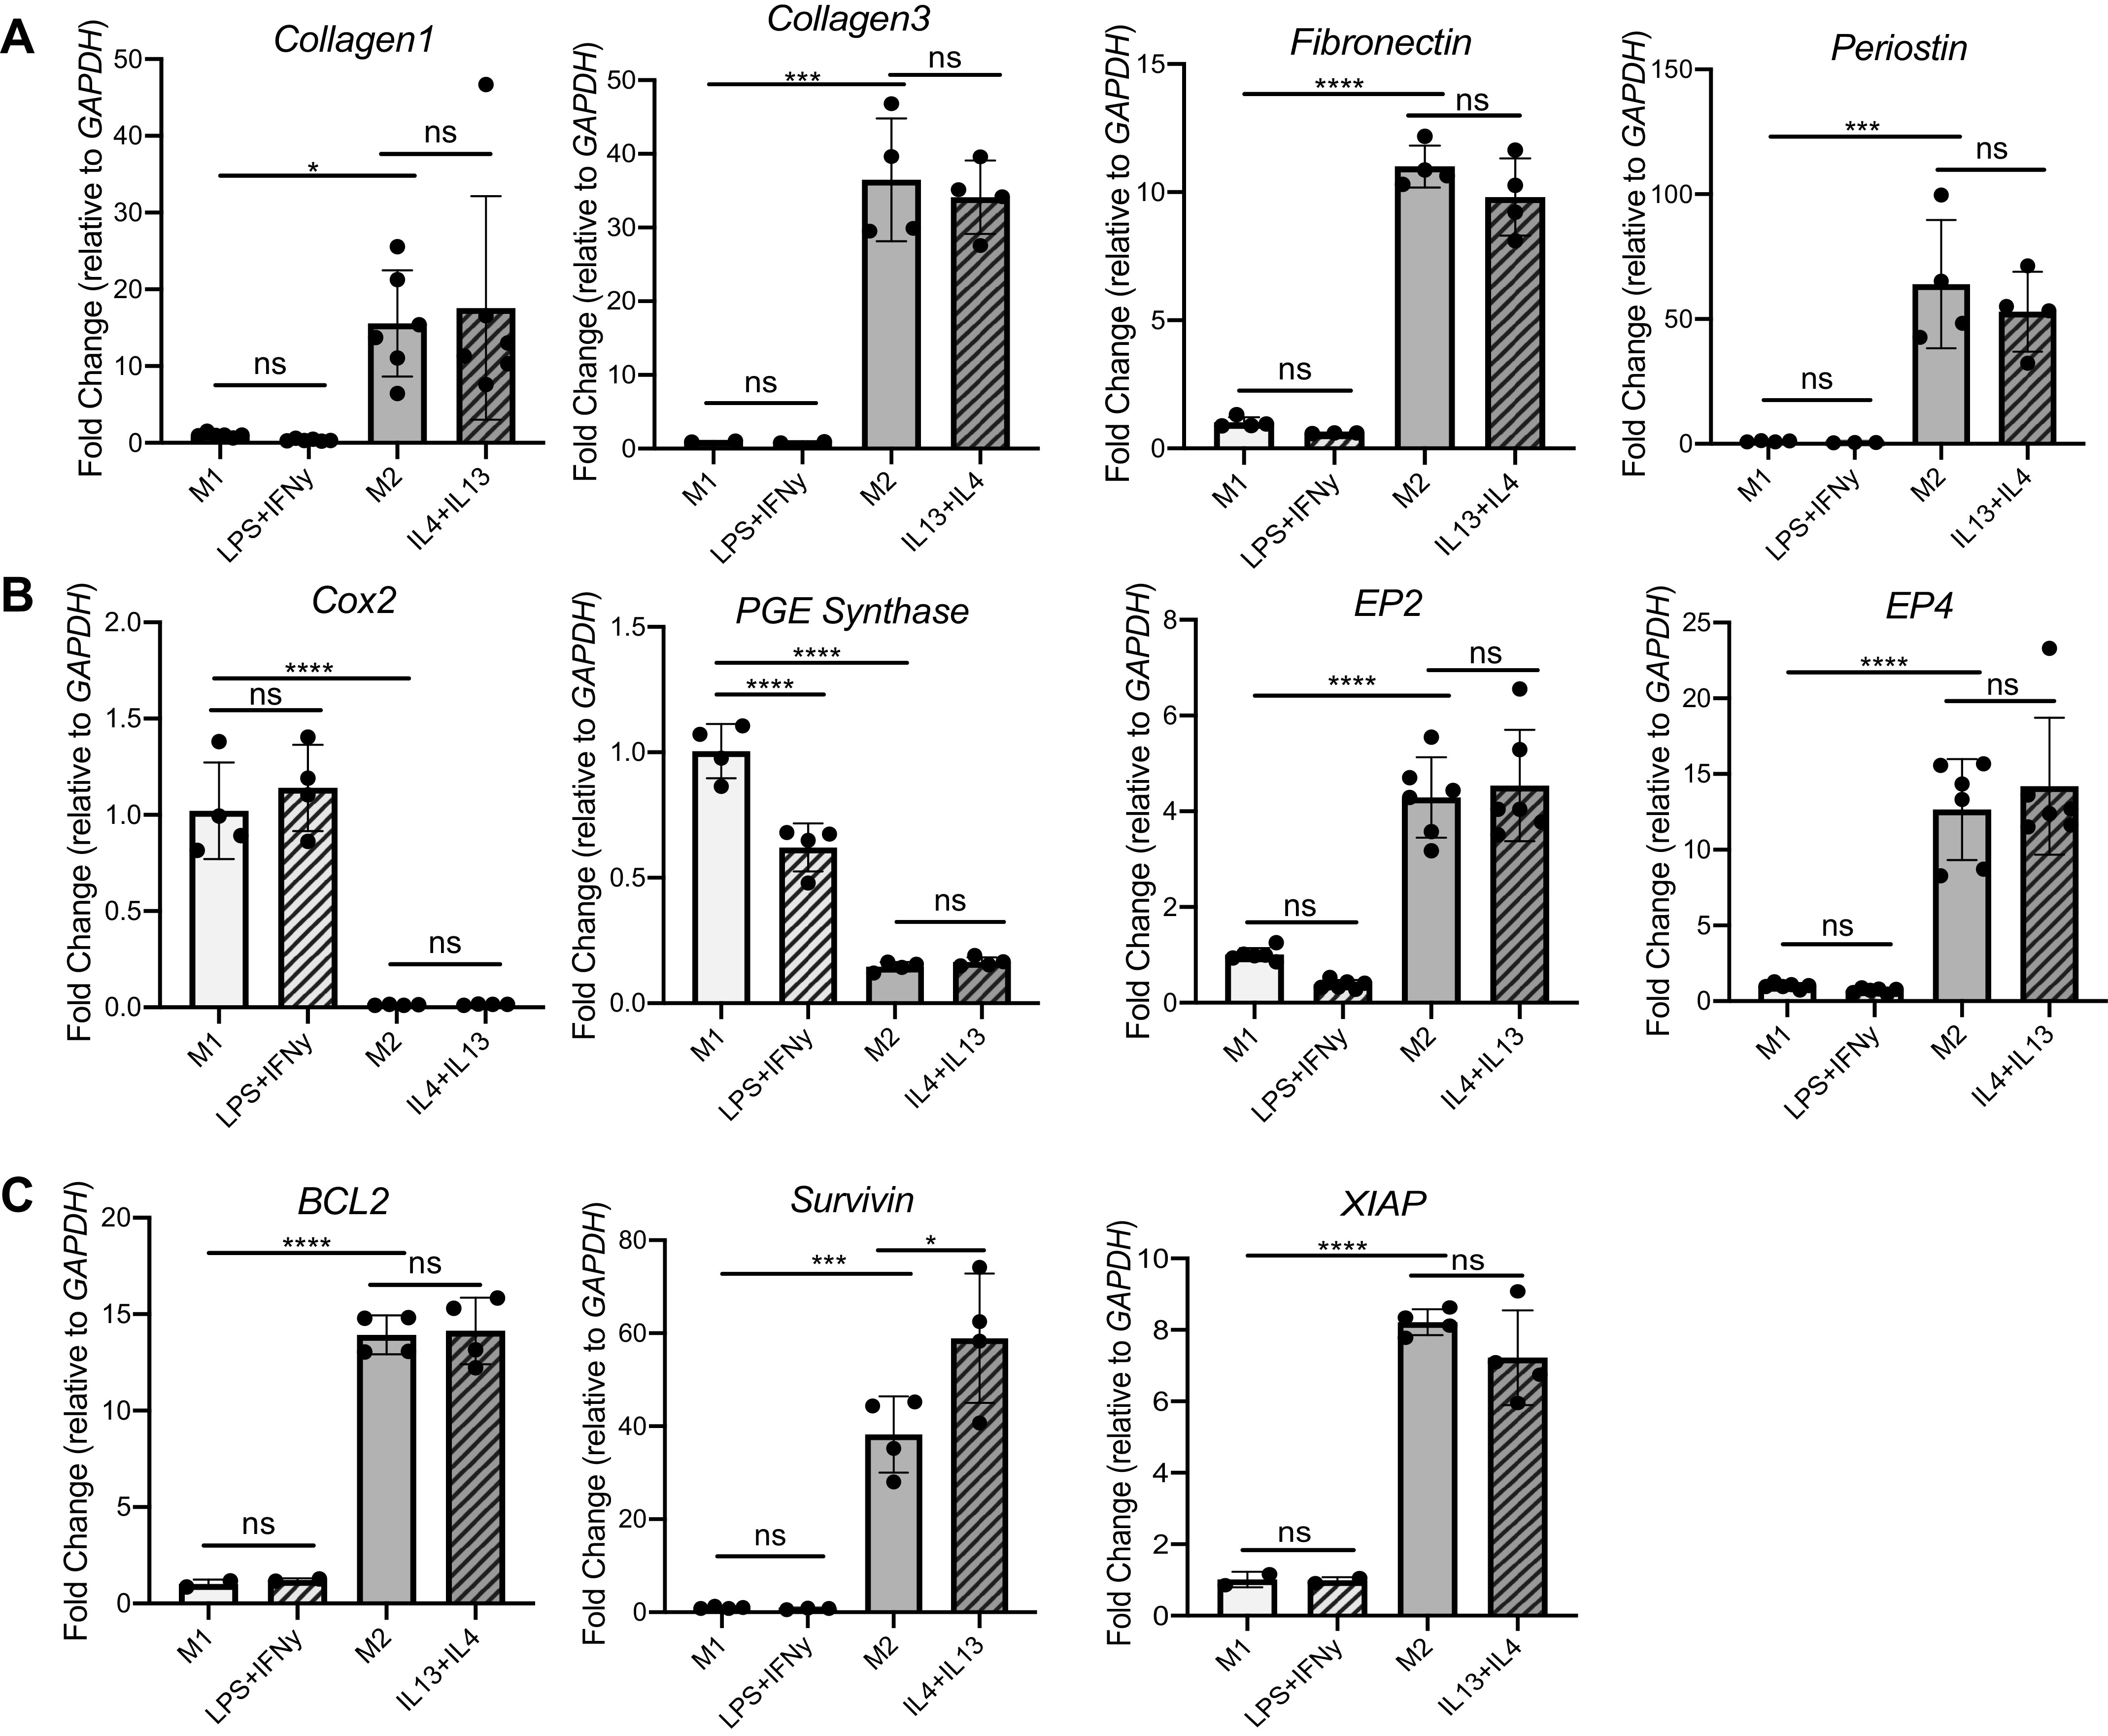
Although expression of profibrotic and antiapoptotic mRNA transcript in fibroblasts is enhanced with M2 conditioned media (CM) treatment, these effects are attributable to polarization reagents. qPCR fold change of key profibrotic genes (A) (collagen1, collagen3, fibronectin, periostin), apoptosis-related genes (B) (Cox2, PGE synthase, EP2, EP4), and antiapoptotic genes (C) (BCL2, survivin, XIAP) is shown. ns, Not statistically different. *P < 0.05, ***P < 0.001, ****P < 0.0001. All panels show representative data from at least 3 experiments, n = 3–4.
Previous work in our laboratory (32) suggests that prostaglandin (PG)E2 signaling is an important regulator of fibroblasts and fibrosis (33). All cells can produce arachidonic acid, which is metabolized to eicosanoids. Cyclooxygenase (COX)-2 is a rate-limiting enzyme to initiate prostaglandin synthesis (32). In the healthy lung, high levels of PGE2 limit fibroblast proliferation, migration, and collagen synthesis. However, the lungs of pulmonary fibrosis patients have decreased levels of PGE2. In Fig. 4B, fibroblasts given M2 CM have much lower levels of COX-2 and the enzyme responsible for PGE2 production, PGE synthase, compared with fibroblasts given M1 CM. Perhaps as a compensatory response to the lower production of PGE2, M2 CM-treated fibroblasts show increased expression of PGE receptors E prostanoid (EP)2 and EP4. However, expression of COX-2, PGE synthase, and EP2 and EP4 is not different between the macrophage CM and its associated polarization growth media control.
Data in the literature support the concept that profibrotic fibroblasts are often resistant to apoptosis (30, 31, 34). Thus, we next examined the expression of classic apoptosis markers BCL2, survivin, and XIAP. As expected, M2 CM on fibroblasts induced a multiple-fold increase in BCL2, survivin, and XIAP expression compared with M1 CM treatment (Fig. 4C). However, the increased M2 effect on fibroblast mRNA transcript expression of these antiapoptotic factors is explained by the M2-polarizing reagents IL-4 and IL-13, as these reagents induced a fold change either comparable to or not statistically different from fibroblasts receiving M2 CM alone.
M2 Polarization Reagents IL-4 + IL-13 Increase Profibrotic and Antiapoptotic Mediator Expression in AECs
As the first physical line of defense against inhaled insults, AECs communicate with fibroblasts and macrophages and are the primary cell type to experience perpetuated microinjuries during fibrosis (2, 6). As homeostasis within a healthy lung microenvironment is dependent on AEC-mesenchymal cell cross talk (32), we investigated whether AECs receiving M2 supernatant increased expression of fibrotic genes. Although there was no difference in the expression of vascular endothelial growth factor (VEGF), both connective tissue growth factor (CTGF) and platelet-derived growth factor alpha (PDGF-α) were increased in AECs given M2 CM compared with those receiving M1 CM (Fig. 5A). Increased levels of these genes were not different between AECs receiving M2 CM and those receiving M2-polarizing growth media controls, however.
Figure 5.
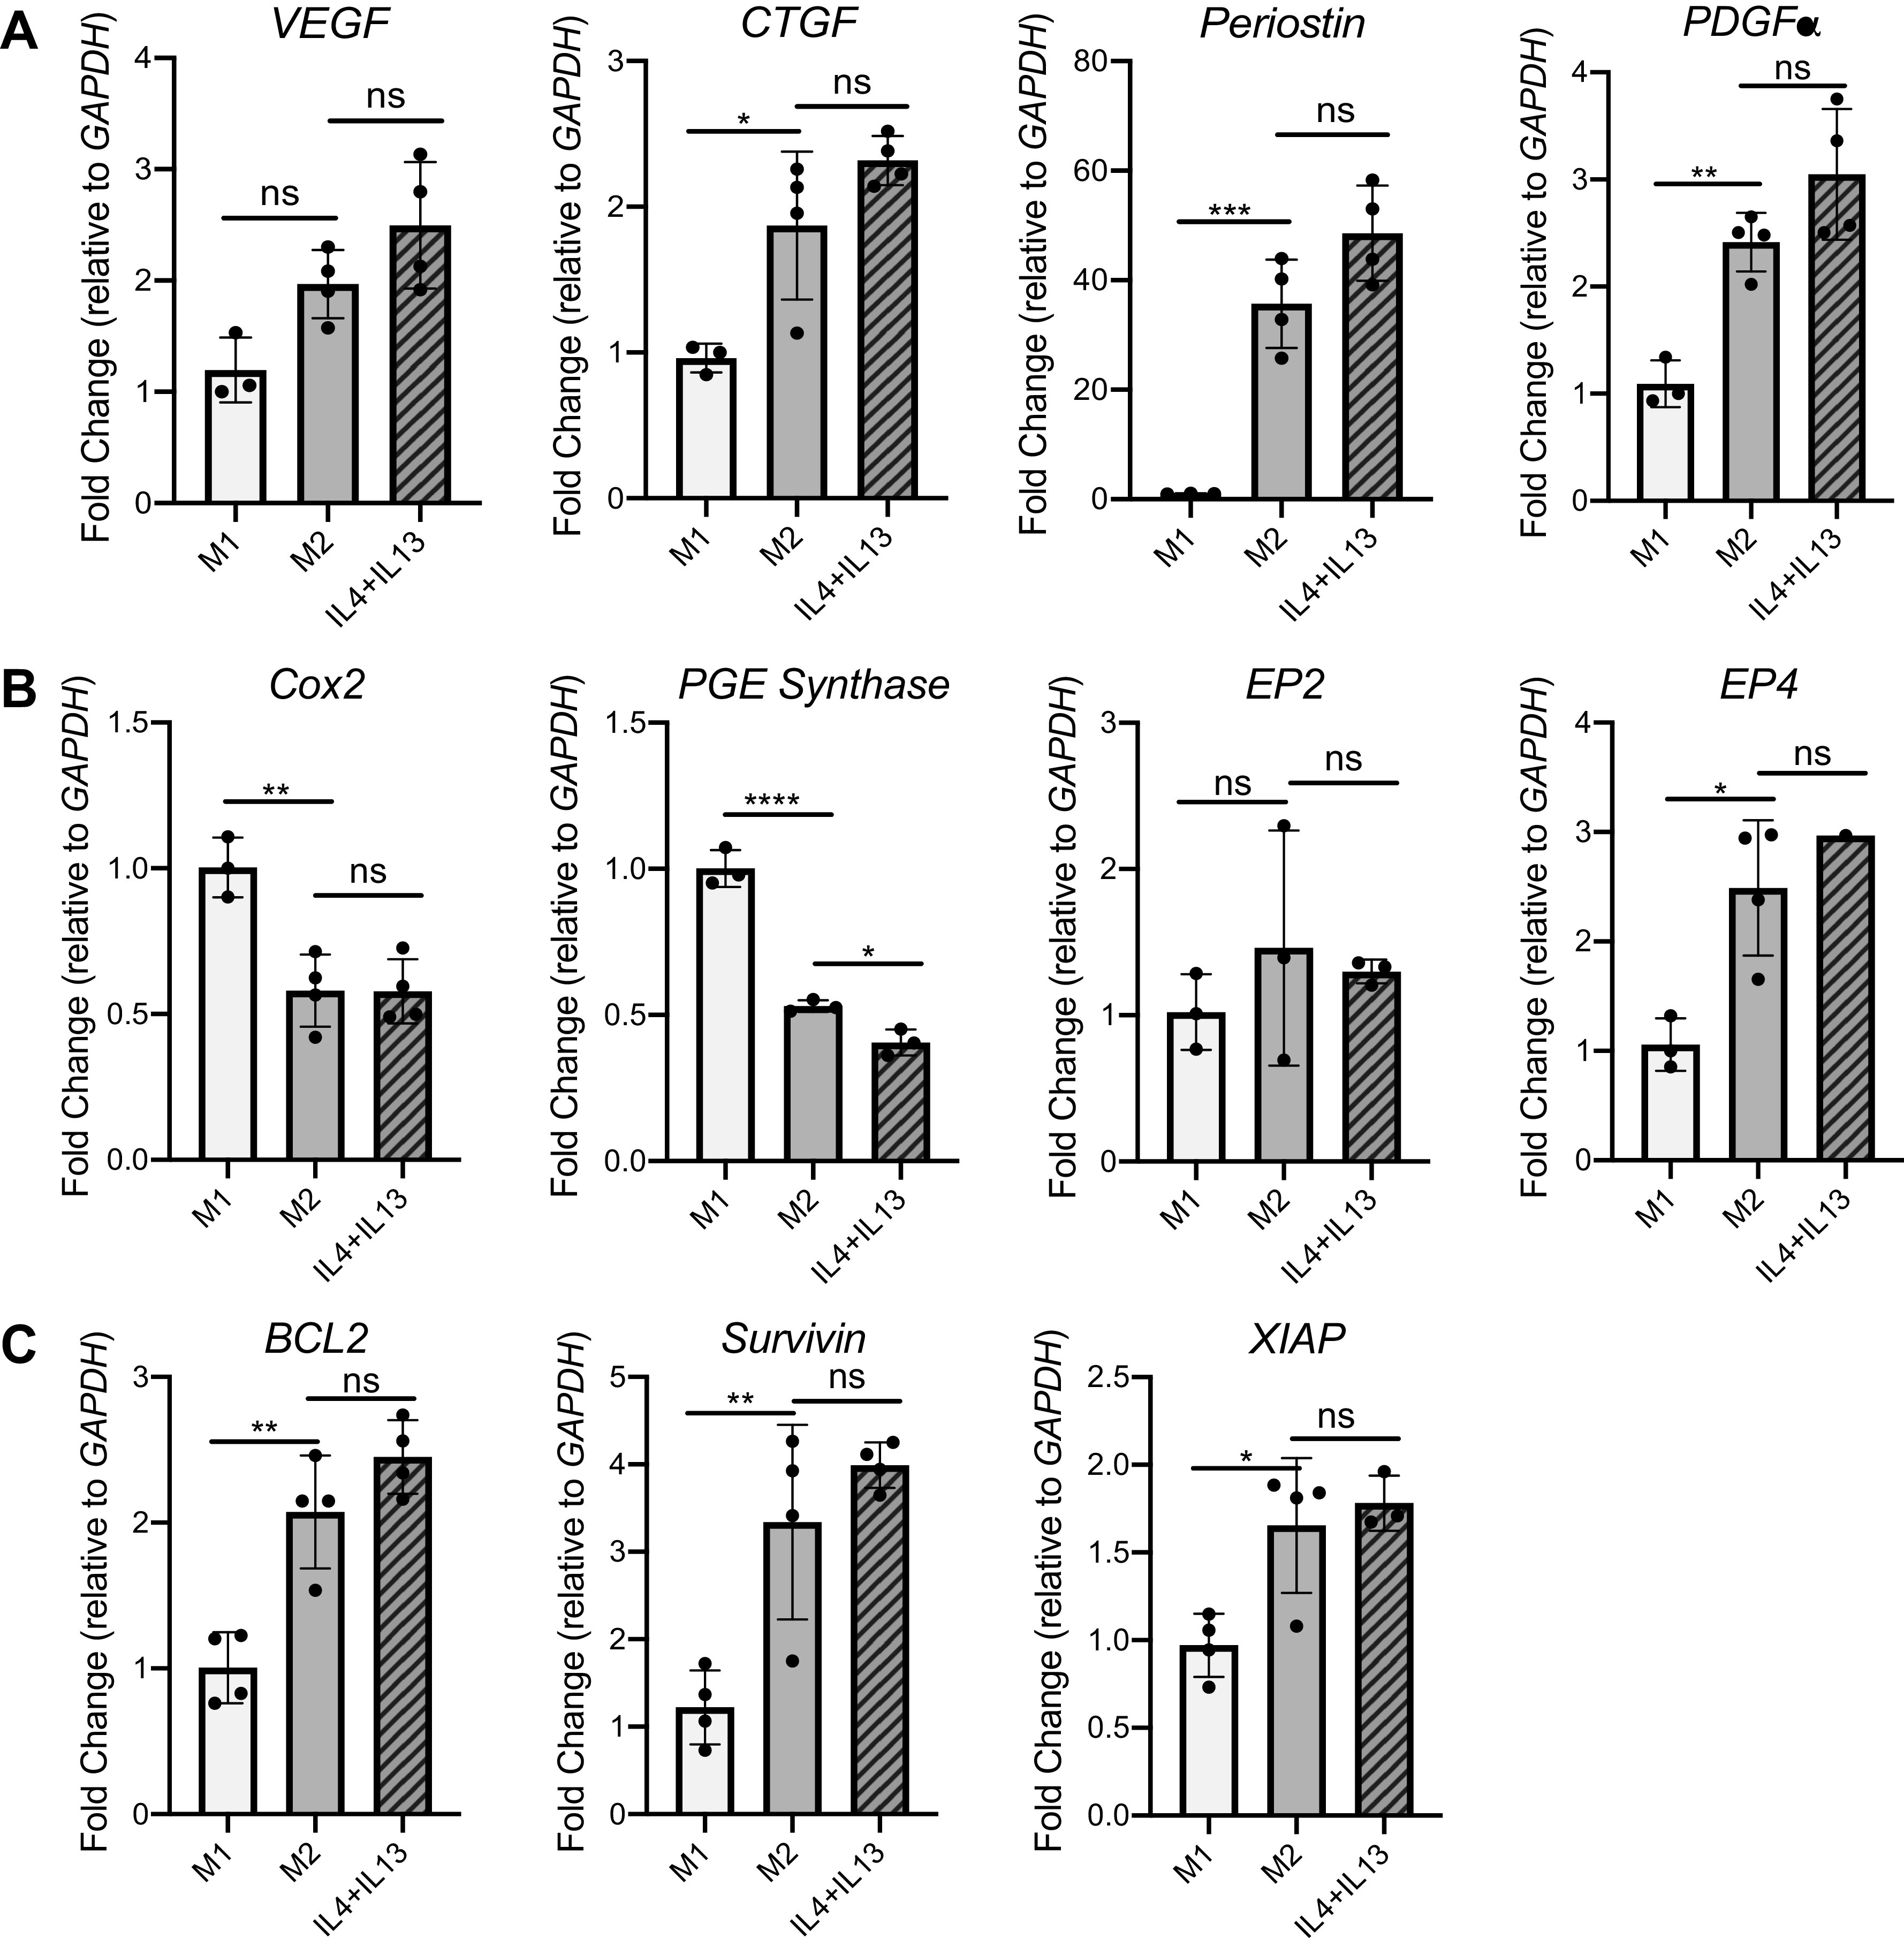
Although alveolar epithelial cells (AECs) treated with M2 conditioned media (CM) show increased expression of profibrotic and antiapoptotic genes, these differences are caused by IL-4 and IL-13 reagents in the CM. qPCR fold change of key profibrotic genes (A) (VEGF, CTGF, POSTN, PDGFα), apoptosis-related genes (B) (Cox2, PGE synthase, EP2, EP4), and antiapoptotic genes (C) (BCL2, survivin, XIAP) is shown. ns, Not statistically different. *P < 0.05, **P < 0.01, ***P < 0.001, ****P < 0.0001. All panels show representative data from at least 3 experiments, n = 3 or 4.
In AECs given M2 CM, expression of COX-2 and PGE synthase are decreased compared with cells treated with M1 CM (Fig. 5B), whereas expression of antiapoptotic markers BCL2, survivin, and XIAP are increased in AECs treated with M2 CM (Fig. 5C). Interestingly, EP2 expression is not different between M1 CM- and M2 CM-treated AECs, and EP4 expression is increased in M2 CM-treated compared with M1 CM-treated AECs (Fig. 5B). Across nearly all genes, expression differences between AECs given M2 CM and AECs given M2 polarizing growth media controls were not statistically different.
Although Increased AEC Apoptosis with M2 CM Is Not an Effect of Polarizing Reagents, the Phenomenon Is Likely Due to a Promiscuous Protease
Repeated microinjuries to the lining of the lung cause AECs to apoptose during fibrosis (6, 36–38). We used the Caspase-Glo 3/7 assay to quantify differences in AEC apoptosis after AEC treatment with M1 or M2 macrophage CM. In this assay, the kit provides a substrate that luminesces when it is cleaved by activated caspase-3/7. Although AEC treatment with M1 CM increased caspase-3/7 activation over the serum-free control, AECs given M2 CM exhibited a nearly fivefold increase in activation compared with the negative control (Fig. 6A), and this difference was not recapitulated by the polarization growth media (Supplemental Fig. S2).
Figure 6.

Although M2 conditioned media (CM) appear to induce greater alveolar epithelial cell (AEC) apoptosis than M1 CM as measured via Caspase-Glo luminescence assay, further verification supports no difference in AEC apoptosis treated with M1 or M2 CM. A: AECs topped with 50 μL of M2 CM have robustly increased caspase-3/7 activation over AECs given M1 CM by Caspase-Glo assay. B: AECs given M1 or M2 CM show no difference in viability as measured by 3-(4,5-dimethylthiazol-2-yl)-3,5-diphenyltetrazolium bromide (MTT) assay. C: flow cytometry of AECs plated on fibronectin show no differences in apoptotic phase or expression of apoptotic protein markers Apotracker (Apo) and Zombie Violet (Zomb) after treatment with M1 or M2 CM for 24 h. ns, Not statistically different. *P < 0.05, ****P < 0.0001. Representative data shown; all experiments repeated between 2 and 7 times, n = 2–5.
To further quantify these differences in apoptosis rate, we performed a MTT cell viability assay with AECs given either M1 or M2 CM. Surprisingly, this experiment yielded no difference in overall viability between M1 CM-treated and M2 CM-treated cells (Fig. 6B). Therefore, we sought to revalidate our Caspase-Glo 3/7 AEC apoptosis assay by a secondary method. Using flow cytometry to perform a live/dead stain and to quantify the amount of apoptotic cells present in our CM-treated AECs, we found no difference in total apoptosis or differences in stage-specific apoptosis between M1 CM and M2 CM-treated AECs (Fig. 6C). Consequently, we were forced to consider the likely possibility that the increased luminescence detected in Fig. 6A was not the result of AEC-derived active caspase-3/7 but rather due to a caspase-3/7 “lookalike” endopeptidase present in the M2 CM that was also able to cleave the substrate present in the Caspase-Glo 3/7 kit and yield a false positive result. Supplemental Figure S3 demonstrates that M2 CM alone in wells without AECs is able to activate the Caspase-Glo 3/7 reagent, further supporting the presence of an imposter cell factor. As wells with heat-inactivated M2 CM have ∼245-fold decreased luminescent activity compared with wells with nonheated M2 supernatant (Supplemental Fig. S3), we conclude that the masquerading mediator is likely a protein or peptidase.
Transcriptome Data for Secreted Proteins from RNAseq Analysis Suggest Possible Candidates for Caspase-3/7 “Lookalike”
To winnow down the protein/peptidase candidates likely responsible for this unexpected caspase-3/7 cleavage, we returned to our M1-M2 RNAseq data set and used Python to visualize categories of genes for secreted proteins that are differentially expressed in M1 and M2 BMDMs. We noticed that M2 BMDMs have an increased number of differentially expressed genes for secreted proteases compared with M1 BMDMs (Fig. 7A) (23 upregulated genes for secreted proteins in M2s compared with only 5 upregulated in M1s), further implicating the presence of a secreted protease causing the false positive signals in Fig. 6A and Supplemental Figs. S2B and S3. Using the ClueGO plug-in within Cytoscape, we organized all genes for secreted proteins into family gene group clusters based on molecular function for the M1 (Fig. 7B) and M2 (Fig. 7C) transcriptomes (see Supplemental Fig. S4 for pictorial depiction of groups and nodes from Fig. 7, A and B; see Supplemental Tables S3–S6 for complete gene list by category). As expected, the M1 transcriptome for secreted proteins contains gene families related to the immune response including cytokine binding (5%), cytokine receptor binding (26%), and receptor ligand activity (30%), with a total of nine distinct molecular function groups. In contrast, the M2 transcriptome for secreted proteins contains 19 groups covering a wider array of molecular function (Fig. 7C). A sizable percentage of genes are present in molecular functions including integrin binding (6%), heparin binding (8%), growth factor binding (8%), peptidase activity (13%)/positive regulation of peptidase activity (2%), receptor regulator activity (21%), and signaling receptor regulator activity (12%).
As the most robust phenotypic effect was noted in the M2 CM (Fig. 6A) and heat inactivation of the macrophage CM effectively reduced the false positive signal (Supplemental Fig. S3), we further refined our analysis to genes listed in the “peptidase activity” molecular function group of the M2 genes encoding secreted proteins. ClueGO analysis of the molecular function (Fig. 8A) and biological processes (Fig. 8B) of the listed peptidases from the M2 genes encoding secreted proteins of Fig. 7C showed hits for peptidase activity (32%), endopeptidase activity (26%), and metalloendopeptidase activity (10%). Interestingly, additional hits included both negative regulation of cysteine-type endopeptidase activity involved in the apoptotic process (3%) and serine-type peptidase activity (13%). We consequentially used inhibitors against cysteine-type peptidases and against serine-type peptidases with the M1 and M2 CM to investigate which family of peptidases was responsible for cleaving the luminescent substrate. Inhibiting protease activity in M1 CM unsurprisingly had no effect on luminescence, as overall caspase-3/7 substrate cleavage was already low with this CM (Fig. 8C). Interestingly, the Pierce pan-protease cocktail inhibitor was most successful at reducing luminescence in M2 CM compared with serine peptidase inhibitors or cysteine peptidase inhibitors alone, and it inhibited peptidase activity in a dose-dependent manner (Fig. 8D). Although the exact formula is proprietary, this protease cocktail includes E-64, aprotinin, AEBSF, leupeptin, bestatin, and pepstatin A. As neither E-64, aprotinin, nor AEBSF alone altered caspase-3/7 substrate cleavage in the M2 CM, it is unlikely that one of these inhibitors is responsible for decreased enzyme activity noted with the pan-peptidase inhibitor. Decreased caspase-3/7 substrate cleavage is also not likely caused by leupeptin, as leupeptin is a serine and cysteine protease inhibitor and thus targets the same protease families as E-64, apoprotin, and AEBSF together. As bestatin targets amino-peptidases and pepstatin A targets aspartic acid proteases, it is likely that the M2 CM contains either an amino-peptidase or aspartic acid protease that is cleaving our luminescent substrate.
DISCUSSION
Evidence in the literature over the last two decades has shown that macrophages are critical in fibrosis development and that their secreted factors are important in cell cross talk. In this study, we used RNAseq to confirm BMDM polarization to accepted M1/M2 phenotypes. Although no study to our knowledge has performed RNAseq on polarized wild-type mouse BMDMs, our data reveal similarities to gene expression profiles found in polarized rat BMDMs by Guo et al. (39). Like Guo et al., we detected increased pathway enrichment for chemokine/cytokine pathways in M1 BMDMs and increased enrichment for cell processing in M2 BMDMs. We also noted high levels of CCR7 and CD86 and low Arg1 in M1 BMDMs compared with high CD68, CD163, and Arg1 and low expression of CD86 and CCR7 in M2 BMDMs. These similarities in both enrichment pathways and genes associated with a polarized BMDM phenotype confirm the utility of this RNAseq data set for further interrogation by other members of the scientific community.
In addition to the polarization differences yielded in our RNAseq data set, qPCR analysis of M1 and M2 BMDMs depicted expected differences in Arg1, iNOS, TNFα, IL-10, Fizz1, CD163, CD206, and HB-EGF concordant with other studies in the literature (4, 5, 14, 40) (Fig. 2). Although we restricted our macrophage polarization to the broad “M2” phenotype, it is important to note that others have determined that use of different polarization cytokines can beget a wider range of macrophage phenotypes. Although existing work shows that these subgroups may have functions different from each other in vivo (41, 42), there is inconsistent evidence of strong transcriptional differences between the subsets (4, 42, 43). As such, we decided to use the conventional IL-4 + IL-13 polarization conditions to create the M2 BMDM phenotype.
Fibroblast treatment with M2 CM yielded expected profibrotic changes in overall migration and expression of ECM and antiapoptotic proteins (Figs. 3 and 4). Although these profibrotic effects of increased fibroblast migration with M2 CM had not been previously reported, there was a lack of statistical difference in fibroblast functional outcomes for fibroblasts treated with macrophage CM compared with those treated with polarizing growth media containing IL-4 + IL-13. Evidence from the literature shows that IFN-γ is a strong inhibitor of fibroblast proliferation in human lung fibroblasts (44–47), whereas other studies show that IL-4 may promote fibroblast proliferation, though in different organs (48–51). These data together provide evidence to conclude that the polarizing reagents are likely wholly responsible for M1-M2 CM-mediated proliferation differences (Fig. 3, A and B). There is scant evidence connecting any of our polarization cytokines to fibroblast migration; consequently, our observation that IL-4 + IL-13 enhances lung fibroblast migration is a novel and potentially unexpected finding.
Fibroblast treatment with M2 CM also yielded increased expression in ECM and antiapoptotic proteins (Fig. 4). Although IL-4 has been shown previously to increase levels of pro-alpha collagen 1 in human fibroblasts, it is surprising that the IL-4 + IL-13 combination appears responsible for all increases in profibrotic protein expression in fibroblasts receiving M2 CM. This is in part because many different mediators have been shown to increase expression of ECM proteins, including TGF-β, CCL18/PARC, Arg1, and Fizz1 (15, 40, 52, 53) That IL-4 + IL-13 can induce the same phenotype as M2 macrophage CM that itself contains an even wider plethora of profibrotic mediators suggests the dominance of IL-4 and IL-13 in the lung milieu and that their effects supersede those of other mediators that could also be present in fibrotic macrophages.
AEC production of profibrotic mediators (Fig. 5) and apoptosis are common indicators of fibrosis. Surprisingly, MTT and flow cytometry analysis (Fig. 6) indicated no statistical differences in AEC apoptosis between cells that had received M1 and M2 CM. This lack of difference, put alongside the well-accepted theory that AECs apoptose in the fibrotic lung, could suggest that AEC apoptosis requires juxtacrine signaling from macrophages. If this is correct, it could be that for the most robust apoptotic response cells adjacent to AECs are primed by injury cytokines such as IL-4, which have been documented previously to be more prevalent in the fibrotic lung from M2-like macrophages (54). These local cytokines may then promote a juxtacrine signal in an adjacent cell that is responsible for AEC apoptosis. Future experiments can determine whether cell-cell contact with M2 macrophages alters AEC apoptosis.
Given that our M2 CM contained a protease able to cleave a caspase-3/7 substrate, we sought to understand the specific molecular function of the protease genes upregulated in the M2 secreted transcriptome. We performed an analysis similar to Fig. 7 but limited our inputted data to the 49 unique genes present in “peptidase activity” (Fig. 8A, Supplemental Table S5 and Supplemental Fig. S5; Fig. 8B, Supplemental Table S6 and Supplemental Fig. S5). Within this second analysis, functional categories included variants of peptidase activity (endopeptidase activity, peptidase activity, metalloendopeptidase activity), but, interestingly, it also included “negative regulation of cysteine-type endopeptidase activity involved in the apoptotic process.” Despite the prominence of serine and cysteine proteases in the RNAseq data, treatment of M1 and M2 CM with serine protease inhibitors AEBSF and aprotinin and cysteine protease inhibitor E-64 did not yield any reduction in caspase-3/7 substrate cleavage (Fig. 8, C and D). This is contrary to our expectations, particularly because caspase-3 is a cysteine-aspartic protease that would have indicated a likely submission to a cysteine-specific inhibitor (55). Our collective data implicate an aspartic acid protease in the M2 supernatant responsible for cleaving the luminescent substrate.
BLASTing the list of 22 differentially expressed secreted proteases from Fig. 7A against the MEROPS peptidase database (https://www.ebi.ac.uk/merops/) (Supplemental Table S7) yielded a list of 14 metalloproteinases, 13 serine proteases/endopeptidases, and the aspartic acid protease cathepsin D (Ctsd). Of the 22 proteases, we considered cathepsin D to be the most likely candidate based on its function as an aspartic acid protease and its known role in animal models of pulmonary fibrosis (56–60). However, use of recombinant mouse cathepsin D in our Caspase-Glo assay revealed no increase in substrate cleavage-based luminescence over the SFM control, despite doses ranging from 50 µg/mL to 6.25 ng/mL (data not shown). Of the remaining 21 proteases, 12 remain that are upregulated in M2 BMDMs and are not serine proteases (Supplemental Table S7). These proteases include members of the matrix metalloproteinase (MMP) family (Mmp11, 17, 23) and members of the a disintegrin and metalloproteinase with thrombospondin motif (Adamts) family (Adamts1, 10, 12, 2, 5). Although evidence connecting Adamts genes to pulmonary fibrosis is limited (61), MMPs have been highly implicated in IPF and animal models of pulmonary fibrosis (62). Thus, it is possible that the substrate cleavage detected in the M2 CM is a result of a combinatorial effect of these proteases or a different protease that was not detected in our analysis of the 5% most upregulated genes.
Current work in the field supports a highly dynamic and nuanced role of macrophages in the development and progression of pulmonary fibrosis. Although profibrotic macrophages are known to secrete cytokines that are important for cell cross talk, this study is the first to date to have considered the role of polarizing cytokines in the growth media as major contributors to promoting profibrotic phenotypes in neighboring cells in vitro or used a systematic approach to determine whether fibroblast or alveolar epithelial cell responses were attributable to macrophages or polarization factors. In addition to providing a novel RNAseq data set that can be interrogated by future researchers, the data in this report provide further evidence that the profibrotic effects associated with M2 macrophages are more likely related to polarization cytokines than to other M2-secreted factors on lung structural cells, at least in these in vitro assays. Although a limitation of this study is that it used polarized BMDMs rather than lung macrophages or moAMs that may have different transcriptomes and thus secretomes, our results support the concept that elevated IL-4 and IL-13 in lung fibrosis are critical features driving the phenotypes of macrophages, fibroblasts, and AECs. We also identify the fact that M2 macrophages secrete a protease or proteases that can give a false-positive cleavage of the Caspase-Glo 3/7 substrate; thus future experiments should always test supernatant alone as a control in such experiments.
SUPPLEMENTAL DATA
Supplemental Figs. S1–S5: https://doi.org/10.6084/m9.figshare.14818566.
Supplemental Tables S1–S7: https://doi.org/10.6084/m9.figshare.14818545.
GRANTS
This work was supported in part by F31 HL149150 (E.M.H.), R35 HL144481 (B.B.M.), and T32 AI007413 (E.M.H.); the Parker B. Francis fellowship (S.J.G.); the Michigan Post-Doctoral translational scholarship (S.J.G.); and the Boehringer Ingelheim Discovery Award (S.J.G.).
DISCLOSURES
No conflicts of interest, financial or otherwise, are declared by the authors.
AUTHOR CONTRIBUTIONS
E.M.H. and B.B.M. conceived and designed research; E.M.H. performed experiments; E.M.H. and S.J.G. analyzed data; E.M.H. and B.B.M. interpreted results of experiments; E.M.H. and S.J.G. prepared figures; E.M.H. drafted manuscript; E.M.H., S.J.G., and B.B.M. edited and revised manuscript; E.M.H., S.J.G., and B.B.M. approved final version of manuscript.
REFERENCES
- 1.Byrne AJ, Mathie SA, Gregory LG, Lloyd CM. Pulmonary macrophages: key players in the innate defence of the airways. Thorax 70: 1189–1196, 2015. doi: 10.1136/thoraxjnl-2015-207020. [DOI] [PubMed] [Google Scholar]
- 2.Selman M, Pardo A. Role of epithelial cells in idiopathic pulmonary fibrosis from innocent targets to serial killers. Proc Am Thorac Soc 3: 364–372, 2006. doi: 10.1513/pats.200601-003TK. [DOI] [PubMed] [Google Scholar]
- 3.Ryu C, Homer RJ, Herzog EL. The airway in idiopathic pulmonary fibrosis: protecting the lung or promoting disease? Am J Respir Crit Care Med 193: 1081–1082, 2016. doi: 10.1164/rccm.201601-0055ED. [DOI] [PMC free article] [PubMed] [Google Scholar]
- 4.Zhang Z, Wen H, Yang X, Zhang K, He B, Zhang X, Kong L. Macrophages: friend or foe in idiopathic pulmonary fibrosis? Curr Stem Cell Res Ther 14: 239–243, 2019. doi: 10.2174/1574888X14666181205122729. [DOI] [PubMed] [Google Scholar]
- 5.Byrne AJ, Maher TM, Lloyd CM. Pulmonary macrophages: a new therapeutic pathway in fibrosing lung disease? Trends Mol Med 22: 303–316, 2016. doi: 10.1016/j.molmed.2016.02.004. [DOI] [PubMed] [Google Scholar]
- 6.Desai O, Winkler J, Minasyan M, Herzog EL. The role of immune and inflammatory cells in idiopathic pulmonary fibrosis. Front Med (Lausanne) 5: 43, 2018. doi: 10.3389/fmed.2018.00043. [DOI] [PMC free article] [PubMed] [Google Scholar]
- 7.Misharin AV, Morales-Nebreda L, Mutlu GM, Budinger GR, Perlman H. Flow cytometric analysis of macrophages and dendritic cell subsets in the mouse lung. Am J Respir Cell Mol Biol 49: 503–510, 2013. doi: 10.1165/rcmb.2013-0086MA. [DOI] [PMC free article] [PubMed] [Google Scholar]
- 8.Wynn TA, Vannella KM. Type 2 immunity in tissue repair and fibrosis. Immunity 44: 450–462, 2016. doi: 10.1016/j.immuni.2016.02.015. [DOI] [PMC free article] [PubMed] [Google Scholar]
- 9.Misharin AV, Morales-Nebreda L, Reyfman PA, Cuda CM, Walter JM, McQuattie-Pimentel AC, et al. Monocyte-derived alveolar macrophages drive lung fibrosis and persist in the lung over the life span. J Exp Med 214: 2387–2404, 2017. doi: 10.1084/jem.20162152. [DOI] [PMC free article] [PubMed] [Google Scholar]
- 10.Moore BB, Paine R, Christensen PJ, Moore TA, Sitterding S, Ngan R, Wilke CA, Kuziel WA, Toews GB. Protection from pulmonary fibrosis in the absence of CCR2 signaling. J Immunol 167: 4368–4377, 2001. doi: 10.4049/jimmunol.167.8.4368. [DOI] [PubMed] [Google Scholar]
- 11.Zhou Y, Peng H, Sun H, Peng X, Tang C, Gan Y, Chen X, Mathur A, Hu B, Slade MD, Montgomery RR, Shaw AC, Homer RJ, White ES, Lee CM, Moore MW, Gulati M, Lee CG, Elias JA, Herzog EL. Chitinase 3-like 1 suppresses injury and promotes fibroproliferative responses in mammalian lung fibrosis. Sci Transl Med 6: 240ra76, 2014. doi: 10.1126/scitranslmed.3007096. [DOI] [PMC free article] [PubMed] [Google Scholar]
- 12.Moore MW, Herzog EL. Regulation and relevance of myofibroblast responses in idiopathic pulmonary fibrosis. Curr Pathobiol Rep 1: 199–208, 2013. doi: 10.1007/s40139-013-0017-8. [DOI] [PMC free article] [PubMed] [Google Scholar]
- 13.Holt DJ, Chamberlain LM, Grainger DW. Cell-cell signaling in co-cultures of macrophages and fibroblasts. Biomaterials 31: 9382–9394, 2010. doi: 10.1016/j.biomaterials.2010.07.101. [DOI] [PMC free article] [PubMed] [Google Scholar]
- 14.Braga TT, Agudelo JS, Camara NO. Macrophages during the fibrotic process: M2 as friend and foe. Front Immunol 6: 602, 2015. doi: 10.3389/fimmu.2015.00602. [DOI] [PMC free article] [PubMed] [Google Scholar]
- 15.Ruytinx P, Proost P, Van Damme J, Struyf S. Chemokine-induced macrophage polarization in inflammatory conditions. Front Immunol 9: 1930, 2018. doi: 10.3389/fimmu.2018.01930. [DOI] [PMC free article] [PubMed] [Google Scholar]
- 16.West AP, Brodsky IE, Rahner C, Woo DK, Erdjument-Bromage H, Tempst P, Walsh MC, Choi Y, Shadel GS, Ghosh S. TLR signalling augments macrophage bactericidal activity through mitochondrial ROS. Nature 472: 476–480, 2011. doi: 10.1038/nature09973. [DOI] [PMC free article] [PubMed] [Google Scholar]
- 17.Mosser DM, Edwards JP. Exploring the full spectrum of macrophage activation. Nat Rev Immunol 8: 958–969, 2008. [Erratum in Nat Rev Immunol 10: 460, 2010]. doi: 10.1038/nri2448. [DOI] [PMC free article] [PubMed] [Google Scholar]
- 18.Raes G, Noël W, Beschin A, Brys L, de Baetselier P, Hassanzadeh GHG. FIZZ1 and Ym as tools to discriminate between differentially activated macrophages. Dev Immunol 9: 151–159, 2002. doi: 10.1080/1044667031000137629. [DOI] [PMC free article] [PubMed] [Google Scholar]
- 19.Hesketh M, Sahin KB, West ZE, Murray RZ. Macrophage phenotypes regulate scar formation and chronic wound healing. Int J Mol Sci 18: 1545, 2017. doi: 10.3390/ijms18071545. [DOI] [PMC free article] [PubMed] [Google Scholar]
- 20.Ishii M, Wen H, Corsa CA, Liu T, Coelho AL, Allen RM, Carson WF, Cavassani KA, Li X, Lukacs NW, Hogaboam CM, Dou Y, Kunkel SL. Epigenetic regulation of the alternatively activated macrophage phenotype. Blood 114: 3244–3254, 2009. doi: 10.1182/blood-2009-04-217620. [DOI] [PMC free article] [PubMed] [Google Scholar]
- 21.Sun L, Hult EM, Cornell TT, Kim KK, Shanley TP, Wilke CA, Agarwal M, Gurczynski SJ, Moore BB, Dahmer MK. Loss of myeloid-specific protein phosphatase 2A enhances lung injury and fibrosis and results in IL-10-dependent sensitization of epithelial cell apoptosis. Am J Physiol Lung Cell Mol Physiol 316: L1035–L1048, 2019. doi: 10.1152/ajplung.00299.2018. [DOI] [PMC free article] [PubMed] [Google Scholar]
- 22.Bauman KA, Wettlaufer SH, Okunishi K, Vannella KM, Stoolman JS, Huang SK, Courey AJ, White ES, Hogaboam CM, Simon RH, Toews GB, Sisson TH, Moore BB, Peters-Golden M. The antifibrotic effects of plasminogen activation occur via prostaglandin E2 synthesis in humans and mice. J Clin Invest 120: 1950–1960, 2010. doi: 10.1172/JCI38369. [DOI] [PMC free article] [PubMed] [Google Scholar]
- 23.Liang Q, Cai W, Zhao Y, Xu H, Tang H, Chen D, Qian F, Sun L. Lycorine ameliorates bleomycin-induced pulmonary fibrosis via inhibiting NLRP3 inflammasome activation and pyroptosis. Pharmacol Res 158: 104884, 2020. doi: 10.1016/j.phrs.2020.104884. [DOI] [PubMed] [Google Scholar]
- 24.Gharib SA, Johnston LK, Huizar I, Birkland TP, Hanson J, Wang Y, Parks WC, Manicone AM. MMP28 promotes macrophage polarization toward M2 cells and augments pulmonary fibrosis. J Leukoc Biol 95: 9–18, 2014. doi: 10.1189/jlb.1112587. [DOI] [PMC free article] [PubMed] [Google Scholar]
- 25.Bhatia D, Chung KP, Nakahira K, Patino E, Rice MC, Torres LK, Muthukumar T, Choi AM, Akchurin OM, Choi ME. Mitophagy-dependent macrophage reprogramming protects against kidney fibrosis. JCI Insight 4: e132826, 2019. doi: 10.1172/jci.insight.132826. [DOI] [PMC free article] [PubMed] [Google Scholar]
- 26.Schyns J, Bai Q, Ruscitti C, Radermecker C, De Schepper S, Chakarov S, Farnir F, Pirottin D, Ginhoux F, Boeckxstaens G, Bureau F, Marichal T. Non-classical tissue monocytes and two functionally distinct populations of interstitial macrophages populate the mouse lung. Nat Commun 10: 3964, 2019. doi: 10.1038/s41467-019-11843-0. [DOI] [PMC free article] [PubMed] [Google Scholar]
- 27.Nair MG, Cochrane DW, Allen JE. Macrophages in chronic type 2 inflammation have a novel phenotype characterized by the abundant expression of Ym1 and Fizz1 that can be partly replicated in vitro. Immunol Lett 85: 173–180, 2003. doi: 10.1016/S0165-2478(02)00225-0. [DOI] [PubMed] [Google Scholar]
- 28.Wen HJ, Gao S, Wang Y, Ray M, Magnuson MA, Wright CVE, Di Magliano MP, Frankel TL, Crawford HC. Myeloid cell-derived HB-EGF drives tissue recovery after pancreatitis. Cell Mol Gastroenterol Hepatol 8: 173–192, 2019. doi: 10.1016/j.jcmgh.2019.05.006. [DOI] [PMC free article] [PubMed] [Google Scholar]
- 29.Kendall RT, Feghali-Bostwick CA. Fibroblasts in fibrosis: novel roles and mediators. Front Pharmacol 5: 123, 2014. doi: 10.3389/fphar.2014.00123. [DOI] [PMC free article] [PubMed] [Google Scholar]
- 30.Maher TM, Evans IC, Bottoms SE, Mercer PF, Thorley AJ, Nicholson AG, Laurent GJ, Tetley TD, Chambers RC, McAnulty RJ. Diminished prostaglandin E2 contributes to the apoptosis paradox in idiopathic pulmonary fibrosis. Am J Respir Crit Care Med 182: 73–82, 2010. doi: 10.1164/rccm.200905-0674OC. [DOI] [PMC free article] [PubMed] [Google Scholar]
- 31.Nho RS, Peterson M, Hergert P, Henke CA. FoxO3a (Forkhead Box O3a) deficiency protects idiopathic pulmonary fibrosis (IPF) fibroblasts from type I polymerized collagen matrix-induced apoptosis via Caveolin-1 (cav-1) and Fas. PLoS One 8: e61017, 2013. doi: 10.1371/journal.pone.0061017. [DOI] [PMC free article] [PubMed] [Google Scholar]
- 32.Bozyk PD, Moore BB. Prostaglandin E2 and the pathogenesis of pulmonary fibrosis. Am J Respir Cell Mol Biol 45: 445–452, 2011. doi: 10.1165/rcmb.2011-0025RT. [DOI] [PMC free article] [PubMed] [Google Scholar]
- 33.Vancheri C, Mastruzzo C, Sortino MA, Crimi N. The lung as a privileged site for the beneficial actions of PGE2. Trends Immunol 25: 40–46, 2004. doi: 10.1016/j.it.2003.11.001. [DOI] [PubMed] [Google Scholar]
- 34.Misharin AV, Scott Budinger GR. Targeting the myofibroblast in pulmonary fibrosis. Am J Respir Crit Care Med 198: 834–835, 2018. doi: 10.1164/rccm.201806-1037ED. [DOI] [PubMed] [Google Scholar]
- 36.Sgalla G, Iovene B, Calvello M, Ori M, Varone F, Richeldi L. Idiopathic pulmonary fibrosis: pathogenesis and management. Respir Res 19: 32, 2018. doi: 10.1186/s12931-018-0730-2. [DOI] [PMC free article] [PubMed] [Google Scholar]
- 37.Kim SJ, Cheresh P, Jablonski RP, Rachek L, Yeldandi A, Piseaux-Aillon R, Ciesielski MJ, Ridge K, Gottardi C, Lam AP, Pardo A, Selman M, Natarajan V, Kamp DW. Mitochondrial 8-oxoguanine DNA glycosylase mitigates alveolar epithelial cell PINK1 deficiency, mitochondrial DNA damage, apoptosis, and lung fibrosis. Am J Physiol Lung Cell Mol Physiol 318: L1084–L1096, 2020. doi: 10.1152/ajplung.00069.2019. [DOI] [PMC free article] [PubMed] [Google Scholar]
- 38.Akram KM, Lomas NJ, Forsyth NR, Spiteri MA. Alveolar epithelial cells in idiopathic pulmonary fibrosis display upregulation of TRAIL, DR4 and DR5 expression with simultaneous preferential over-expression of pro-apoptotic marker p53. Int J Clin Exp Pathol 7: 552–564, 2014. [PMC free article] [PubMed] [Google Scholar]
- 39.Guo XY, Wang SN, Wu Y, Lin YH, Tang J, Ding SQ, Shen L, Wang R, Hu JG, Lü HZ. Transcriptome profile of rat genes in bone marrow-derived macrophages at different activation statuses by RNA-sequencing. Genomics 111: 986–996, 2019. doi: 10.1016/j.ygeno.2018.06.006. [DOI] [PubMed] [Google Scholar]
- 40.Gordon S, Martinez FO. Alternative activation of macrophages: mechanism and functions. Immunity 32: 593–604, 2010. doi: 10.1016/j.immuni.2010.05.007. [DOI] [PubMed] [Google Scholar]
- 41.Tang L, Zhang H, Wang C, Li H, Zhang Q, Bai J. M2A and M2C macrophage subsets ameliorate inflammation and fibroproliferation in acute lung injury through interleukin 10 pathway. Shock 48: 119–129, 2017. doi: 10.1097/SHK.0000000000000820. [DOI] [PubMed] [Google Scholar]
- 42.Tu GW, Shi Y, Zheng YJ, Ju MJ, He HY, Ma GG, Hao GW, Luo Z. Glucocorticoid attenuates acute lung injury through induction of type 2 macrophage. J Transl Med 15: 181, 2017. doi: 10.1186/s12967-017-1284-7. [DOI] [PMC free article] [PubMed] [Google Scholar]
- 43.Lurier EB, Dalton D, Dampier W, Raman P, Nassiri S, Ferraro NM, Rajagopalan R, Sarmady M, Spiller KL. Transcriptome analysis of IL-10-stimulated (M2c) macrophages by next-generation sequencing. Immunobiology 222: 847–856, 2017. doi: 10.1016/j.imbio.2017.02.006. [DOI] [PMC free article] [PubMed] [Google Scholar]
- 44.Elias JA. Tumor necrosis factor interacts with interleukin-1 and interferons to inhibit fibroblast proliferation via fibroblast prostaglandin-dependent and -independent mechanisms. Am Rev Respir Dis 138: 652–658, 1988. doi: 10.1164/ajrccm/138.3.652. [DOI] [PubMed] [Google Scholar]
- 45.Vu TN, Chen X, Foda HD, Smaldone GC, Hasaneen NA. Interferon-γ enhances the antifibrotic effects of pirfenidone by attenuating IPF lung fibroblast activation and differentiation. Respir Res 20: 206, 2019. doi: 10.1186/s12931-019-1171-2. [DOI] [PMC free article] [PubMed] [Google Scholar]
- 46.Li W, Liang R, Huang H, Wu B, Zhong Y. Effects of IFN-γ on cell growth and the expression of ADAM33 gene in human embryonic lung Mrc-5 fibroblasts in vitro. J Asthma 55: 15–25, 2018. doi: 10.1080/02770903.2017.1310226. [DOI] [PubMed] [Google Scholar]
- 47.DiProspero NA, Meiners S, Geller HM. Inflammatory cytokines interact to modulate extracellular matrix and astrocytic support of neurite outgrowth. Exp Neurol 148: 628–639, 1997. doi: 10.1006/exnr.1997.6700. [DOI] [PubMed] [Google Scholar]
- 48.Saito A, Okazaki H, Sugawara I, Yamamoto K, Takizawa H. Potential action of IL-4 and IL-13 as fibrogenic factors on lung fibroblasts in vitro. Int Arch Allergy Immunol 132: 168–176, 2003. doi: 10.1159/000073718. [DOI] [PubMed] [Google Scholar]
- 49.Atamas SP, Luzina IG, Dai H, Wilt SG, White B. Synergy between CD40 ligation and IL-4 on fibroblast proliferation involves IL-4 receptor signaling. J Immunol 168: 1139–1145, 2002. doi: 10.4049/jimmunol.168.3.1139. [DOI] [PubMed] [Google Scholar]
- 50.Fujita M, Shannon JM, Morikawa O, Gauldie J, Hara N, Mason RJ. Overexpression of tumor necrosis factor-α diminishes pulmonary fibrosis induced by bleomycin or transforming growth factor-β. Am J Respir Cell Mol Biol 29: 669–676, 2003. doi: 10.1165/rcmb.2002-0046OC. [DOI] [PubMed] [Google Scholar]
- 51.Feghali CA, Bost KL, Boulware DW, Levy LS. Human recombinant interleukin-4 induces proliferation and interleukin-6 production by cultured human skin fibroblasts. Clin Immunol Immunopathol 63: 182–187, 1992. doi: 10.1016/0090-1229(92)90011-C. [DOI] [PubMed] [Google Scholar]
- 52.Postlethwaite AE, Holness MA, Katai H, Raghow R. Human fibroblasts synthesize elevated levels of extracellular matrix proteins in response to interleukin 4. J Clin Invest 90: 1479–1485, 1992. doi: 10.1172/JCI116015. [DOI] [PMC free article] [PubMed] [Google Scholar]
- 53.Liu T, Yu H, Ullenbruch M, Jin H, Ito T, Wu Z, Liu J, Phan SH. The in vivo fibrotic role of FIZZ1 in pulmonary fibrosis. PLoS One 9: e88362, 2014. doi: 10.1371/journal.pone.0088362. [DOI] [PMC free article] [PubMed] [Google Scholar]
- 54.La Flamme AC, Kharkrang M, Stone S, Mirmoeini S, Chuluundorj D, Kyle R. Type II-activated murine macrophages produce IL-4. PLoS One 7: e46989, 2012. doi: 10.1371/journal.pone.0046989. [DOI] [PMC free article] [PubMed] [Google Scholar]
- 55.Julien O, Wells JA. Caspases and their substrates. Cell Death Differ 24: 1380–1389, 2017. doi: 10.1038/cdd.2017.44. [DOI] [PMC free article] [PubMed] [Google Scholar]
- 56.Sjöstrand M, Rylander R. Enzymes in lung lavage fluid after inhalation exposure to silica dust. Environ Res 33: 307–311, 1984. doi: 10.1016/0013-9351(84)90028-8. [DOI] [PubMed] [Google Scholar]
- 57.Kasper M, Lackie P, Haase M, Schuh D, Müller M. Immunolocalization of cathepsin D in pneumocytes of normal human lung and in pulmonary fibrosis. Virchows Arch 428: 207–215, 1996. doi: 10.1007/BF00196692. [DOI] [PubMed] [Google Scholar]
- 58.Kasper M, Fehrenbach H. Immunohistochemical evidence for the occurrence of similar epithelial phenotypes during lung development and radiation-induced fibrogenesis. Int J Radiat Biol 76: 493–501, 2000. doi: 10.1080/095530000138493. [DOI] [PubMed] [Google Scholar]
- 59.Koslowski R, Knoch K, Kuhlisch E, Seidel D, Kasper M. Cathepsins in bleomycin-induced lung injury in rat. Eur Respir J 22: 427–435, 2003. doi: 10.1183/09031936.03.00112903. [DOI] [PubMed] [Google Scholar]
- 60.Uhal BD, Nguyen H, Dang M, Gopallawa I, Jiang J, Dang V, Ono S, Morimoto K. Abrogation of ER stress-induced apoptosis of alveolar epithelial cells by angiotensin 1-7. Am J Physiol Lung Cell Mol Physiol 305: L33–L41, 2013. doi: 10.1152/ajplung.00001.2013. [DOI] [PMC free article] [PubMed] [Google Scholar]
- 61.Zhong S, Khalil RA. A Disintegrin and Metalloproteinase (ADAM) and ADAM with thrombospondin motifs (ADAMTS) family in vascular biology and disease. Biochem Pharmacol 164: 188–204, 2019. doi: 10.1016/j.bcp.2019.03.033. [DOI] [PMC free article] [PubMed] [Google Scholar]
- 62.Hendrix AY, Kheradmand F. The role of matrix metalloproteinases in development, repair, and destruction of the lungs. Prog Mol Biol Transl Sci 148: 1–29, 2017. doi: 10.1016/bs.pmbts.2017.04.004. [DOI] [PubMed] [Google Scholar]