

Abstract
BACKGROUND:
Unexpected admissions of term neonates to the neonatal intensive care unit and unexpected postnatal complications have been proposed as neonatal-focused quality metrics for intrapartum care. Previous studies have noted significant variation in overall hospital neonatal intensive care unit admission rates; however, little is known about the influence of obstetric practices on these rates or whether variation among unanticipated admissions in low-risk, term neonates can be attributed to systemic hospital practices.
OBJECTIVE:
The objective of the study was to examine the relative effects of patient characteristics and intrapartum events on unexpected neonatal intensive care unit admissions and to quantify the between-hospital variation in neonatal intensive care unit admission rates among this group of neonates.
STUDY DESIGN:
We performed a retrospective cross-sectional study using data collected as part of the Consortium for Safe Labor study. Women who delivered term (≥37 weeks), singleton, nonanomalous, liveborn infants without an a priori risk for neonatal intensive care unit admission were included. The primary outcome was neonatal intensive care unit admission among this population. Multilevel mixed-effect models were used to calculate adjusted odds ratios for demographics (age, race, insurer), pregnancy characteristics (parity, gestational age, tobacco use, birthweight), maternal comorbidities (chronic and pregnancy-induced hypertension), hospital characteristics (delivery volume, hospital and neonatal intensive care unit level, academic affiliation), and intrapartum events (prolonged second stage, induction of labor, trial of labor after cesarean delivery, chorioamnionitis, meconium-stained amniotic fluid, and abruption). Intraclass correlation coefficients were used to estimate the between-hospital variance in a series of hierarchical models.
RESULTS:
Of the 143,951 infants meeting all patient and hospital inclusion criteria, 7995 (5.6%) were admitted to the neonatal intensive care unit after birth. In the fully adjusted model, the factors associated with the highest odds for neonatal intensive care unit admission included: nulliparity (adjusted odds ratio, 1.62 [95% confidence interval, 1.53–1.71]), large for gestational age (adjusted odds ratio, 1.59 [95% confidence interval, 1.47–1.71]), and small for gestational age (adjusted odds ratio, 1.60 [95% confidence interval, 1.47–1.73]). Induction of labor (adjusted odds ratio, 0.95 [95% confidence interval, 0.89–1.01]) was not associated with increased odds of neonatal intensive care unit admission compared with women who labored spontaneously. The events associated with higher odds of neonatal intensive care unit admission included: prolonged second stage (adjusted odds ratio, 1.66 [95% confidence interval, 1.51–1.83]); chorioamnionitis (adjusted odds ratio, 3.89 [95% confidence interval, 3.42–4.44]), meconium-stained amniotic fluid (adjusted odds ratio, 1.96 [95% confidence interval, 1.82–2.10]), and abruption (adjusted odds ratio, 2.64 [95% confidence interval, 2.16–.21]). Compared with women who did not labor, the odds of neonatal intensive care unit admission were lower for women who labored: adjusted odds ratio, 0.48 (95% confidence interval, 0.45–0.52) for women with no uterine scar and adjusted odds ratio, 0.83 (95% confidence interval, 0.73–0.94) for women with a uterine scar. There was significant variation in neonatal intensive care unit admission rates by hospital, ranging from 2.9% to 11.2%. After accounting for case mix and hospital characteristics, the between-hospital variance was 1.9%, suggesting that little of the variation was explained by the effect of the hospital.
CONCLUSION:
This study contributes to the currently limited understanding of term, neonatal intensive care unit admission rates as a marker of obstetrical care quality. We demonstrated that significant variation exists in hospital unexpected neonatal intensive care unit admission rates and that certain intrapartum events are associated with an increased risk for neonatal intensive care unit admission after delivery. However, the between-hospital variation was low. Unmeasured confounders and extrinsic factors, such as neonatal intensive care unit bed availability, may limit the ability of unexpected term neonatal intensive care unit admissions to meaningfully reflect obstetrical care quality.
Keywords: hospital variation, intrapartum, labor, neonatal intensive care, neonatal intensive care unit, obstetric care, quality
Many quality metrics in obstetrics focus on maternal outcomes but few represent intrapartum care.1 The most commonly recognized metric is the cesarean delivery rate, reported for all women and for various subsets of women at low risk.2–6
Much attention has been focused on the maternal cesarean delivery rate and the potential overuse of this procedure, particularly given its rise over the last 20 years.7–9 While the current rate in the United States (31%) is generally accepted to be too high, the optimal cesarean delivery rate, in which both maternal and neonatal outcomes are maximized, is not known, given the complexity of defining, quantifying, and measuring these outcomes.10–13
Similarly, hospital early-term delivery rates were adopted recently as a proxy measure to reduce neonatal morbidity.14 However, studies have demonstrated that interventions limiting early-term deliveries have not been associated with improved neonatal outcomes, and there have been conflicting reports on the impact on the stillbirth rate.15–17 Currently there are no widely adopted outcome measures that represent neonatal health, which could serve as balancing measures to more maternal-focused metrics.
Unexpected admissions to the intensive care unit and unexpected postnatal complications among term neonates have been proposed as neonatal-focused metrics for intrapartum care.1,18,19 Previous studies have noted significant variation in hospital neonatal intensive care unit (NICU) rates, predominantly in the pediatric literature.20–23 However, little is known about the influence of obstetric practices on NICU admissions or admission variation among this unexpectedly admitted group of neonates. Thus, the primary objective of this study was to examine the relative effects of patient characteristics and intrapartum events on term NICU admissions and to quantify the between-hospital variation in NICU admission rates in this group.
Materials and Methods
This study is a secondary analysis of the Consortium for Safe Labor data.24 The Consortium for Safe Labor project was a multicenter retrospective observational study of women that occurred between 2002 and 2008.
A total of 228,438 pregnancies from 208,695 women in 19 hospitals from 12 health systems were included. Notably, data were abstracted from the electronic medical records, including discharge summaries, from these institutions; data cleaning and validation was overseen by the primary study team. The variables of interest were established prior to the start of the project; maternal and neonatal conditions were defined locally at each institution, and there were no standardized definitions supplied with the data set documentation. The full details of this cohort and the original study have been previously described.24,25
For our study, the primary study group was women who had deliveries of term, singleton, nonanomalous, liveborn infants without an a priori risk for NICU admission. Thus, women were excluded if they had a multiple gestation or if their neonate was preterm (<37 weeks gestation), anomalous, or demised antenatally.
Neonates considered to have an a priori risk for NICU admission were those born to mothers with the following conditions: diabetes (both pregestational and gestational), given the need for glycemic monitoring and risk of hypoglycemia; illicit drug use in pregnancy because infants at risk for neonatal abstinence syndrome may be admitted for monitoring or treatment; and those born to mothers with human immunodeficiency virus because antiviral treatment may be administered in higher-care settings. No other maternal conditions in the data set were thought to be associated with NICU admission; thus, all admissions in the final cohort were considered unexpected. Furthermore, hospitals without a NICU were excluded because infants would not be eligible for NICU admission. Lastly, 3 sites in the original Consortium for Safe Labor project did not contribute data for multiple pregnancy comorbidities or neonatal outcomes; thus, to avoid biases introduced by missing data, these sites were excluded prior to the start of the analysis.
The primary outcome was NICU admission among this cohort of infants, in which NICU admission included recorded admissions to either a Level 2 or 3 NICU. We compared maternal demographic (age, race, insurer), pregnancy characteristics (parity, gestational age, tobacco use, illicit drug use, birthweight), and maternal comorbidities (tobacco use and chronic and pregnancy-induced hypertension) between those infants not admitted and admitted to the NICU. All variables were predefined and categorized in the data set. Categorical variables were compared with χ2 tests, and continuous variables were compared with Student t tests.
The intrapartum and labor events that were examined included prolonged second stage (defined as >3 hours for nulliparous patients and >2 hours for multiparous patients at the time of the original study) among women who reached full dilation, induction of labor among women who underwent a trial of labor, trial of labor after cesarean delivery, chorioamnionitis, presence of meconium-stained amniotic fluid, and intrapartum abruption. Of these, induction of labor and trial of labor after cesarean delivery reflect interventions that affect a woman’s labor management from the start of her admission.
A provider’s decision to recommend that a patient continue pushing in the second stage is presumably predicated on the assumption of reassuring maternal and neonatal status; however, there is known increased morbidity with a prolonged second stage.26–29 Therefore, a prolonged second stage was chosen as a variable of interest related to possible NICU admission.
The other 3 intrapartum events (presence of chorioamnionitis, presence of meconium-stained amniotic fluid, and intrapartum abruption) are not directly under a provider’s control but may be associated with labor management practices in the !rst and second stage of labor. The incidence of NICU admission was compared among the intrapartum events using χ2 tests.
First, the effects of demographics, pregnancy characteristics, and maternal comorbidities were explored on NICU admission using multilevel, mixed-effects logistic regression models that accounted for the random effect of the hospital and the individual patient. This model structure accounts for the possible clustering of outcomes or events among the following: (1) hospitals (n = 15) and (2) patients with multiple pregnancies in the data set (n = 12,238).
Partially adjusted odds ratios incorporated only the random effects of the hospital and individual. Fully adjusted odds ratios adjusted for all maternal and pregnancy characteristics, hospital characteristics, and the random effects. Hospitals were deidentified, but all available hospital characteristics in the original data set were included in the model: number of annual deliveries in 2006; hospital type, defined as university, nonuniversity, or teaching community; NICU level, either level 2 or 3; and hospital level, defined as secondary or tertiary. All definitions for these variables were prede!ned in the original data set. Then, the association of each intrapartum event with NICU admission was determined using similar models.
A subgroup analysis was performed for women without a uterine scar who labored in an attempt to isolate the effects of labor management. Women undergoing a trial of labor after cesarean delivery were excluded from this group because their labor management may be different from those without a uterine scar.
For all patients meeting eligibility criteria, NICU admission rates were calculated for each hospital by dividing the number of infants admitted to the NICU over all term, singleton, nonanomalous liveborn infants without an a priori risk for admission in the data set. The incidence of the following complications, as defined and recorded in the Consortium for Safe Labor data set, were calculated for infants admitted to the NICU: anemia, asphyxia, death, intracranial hemorrhage, intrapartum aspiration, patent ductus arteriosus, pneumonia, respiratory distress syndrome, seizures, transient tachypnea of the newborn, and ventilation use. These complications included both admitting and associated diagnoses.
For the 5 most common complications (transient tachypnea of the newborn, sepsis, anemia, respiratory distress syndrome, and pneumonia), the incidences were calculated and compared for each hospital.
To estimate the between-hospital variation, intraclass correlation coefficients were calculated in a series of random effect hierarchical models. The first model included only the random effect of the hospital and patient. Then maternal demographics and pregnancy characteristics were added to assess the effects of case mix on hospital-level variance. Lastly, characteristics of the hospital (annual delivery volume, NICU level, hospital level, and hospital type) were added.
Intrapartum events (prolonged second stage, induction of labor, trial of labor after cesarean delivery, chorioamnionitis, presence of meconium-stained amniotic fluid, and intrapartum abruption) were not included in these models because these events may be on the causal pathway to NICU admission. In the final model, the intraclass correlation coefficients approximate the amount of variation in NICU admission rates that is attributed to the clustering effect of the hospital, after accounting for case mix.
For reference, the intraclass correlation coefficient can range from 0 to 1. When 0, the coefficient suggests there is no measurable clustering effect attributable to the hospital to explain the observed variation; when 1 (or 100%), the observed variation can all be attributed to the clustering effect of the hospital (ie, due to systematic differences between hospitals). When less than 1, the remaining variation not explained by the hospital is attributed to systematic (unmeasured) differences in patients or their management within a hospital. The details of using this method for studying variation in models with a binary outcome have been previously described.30–32
All analyses were conducted in Stata 15.1 (Stata Corp, College Stastion, TX). The values of P < .05 were considered statistically significant. The Partners Healthcare Human Research Committee exempted this study from review. The Consortium for Safe Labor data were obtained with permission from the Eunice Kennedy Shriver National Institute for Child Health and Development for this specific project.
Results
Figure 1 is a flow diagram of the final cohort included in the analysis. Of the 228,438 deliveries included in the Consortium for Safe Labor study, 171,674 were term, singleton, nonanomalous, liveborn infants born to mothers without comorbidities that may be associated with NICU admission (diabetes, illicit drug use, human immunodeficiency virus). One hospital was excluded because it did not have an NICU (necessary for the primary outcome of this study), and 3 hospitals were excluded because they did not systematically collect covariate information on variables critical to the analyses (eg, indications for NICU admission, maternal comorbidities). Of the 143,951 infants from the 15 hospitals meeting all patient and hospital inclusion criteria, 7995 (5.6%) were admitted to the NICU after birth.
FIGURE 1.
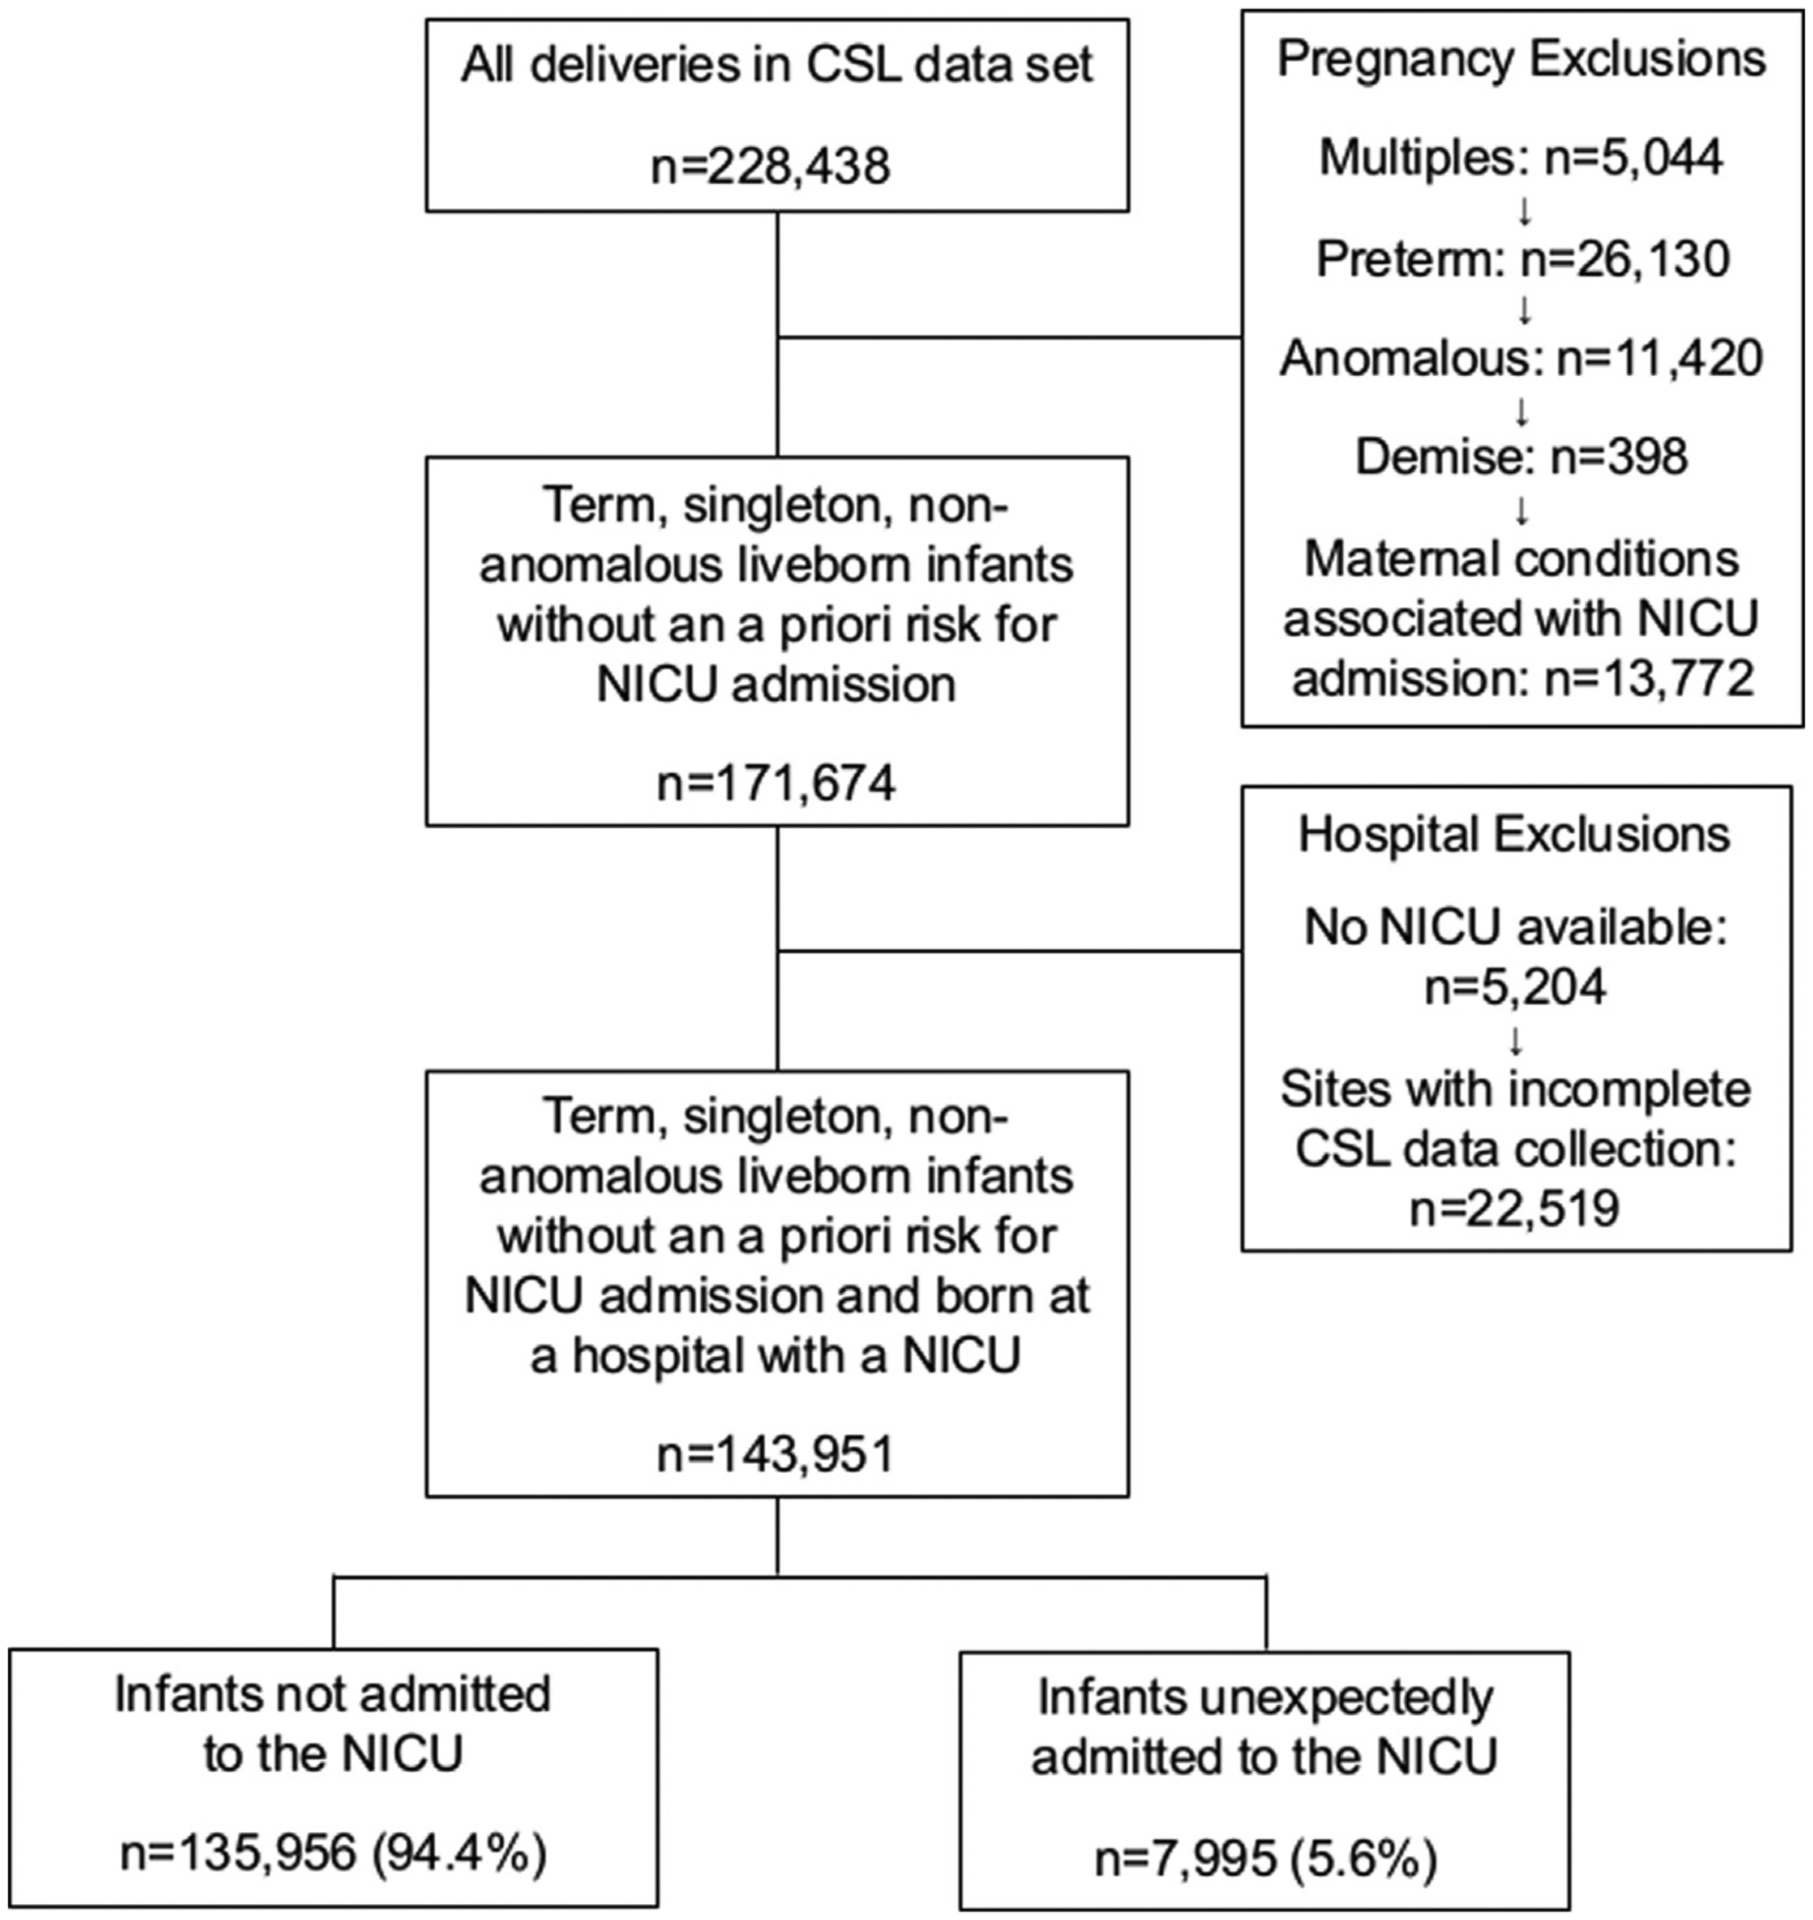
Flow diagram of patients included in the analysis
CSL, Consortium for Safe Labor; NICU, neonatal intensive care unit.
Clapp et al. Unexpected term NICU admissions. Am J Obstet Gynecol 2019.
There was significant variation in NICU admission rates of these infants by hospital, ranging from 2.9% to 11.2%. Figures 2 and 3 highlight the incidence of neonatal complications among infants admitted to the NICU. Figure 2 shows the relative incidence of complications recorded in the original study. Transient tachypnea of the newborn (TTN) accounted for more than one third of neonatal complications. Sepsis had the second highest incidence at 17%. The remainder of the complications had incidences of less than 10%. Figure 3 shows the relative incidences in the 5 most prevalent complications among NICU admissions (TTN, sepsis, anemia, respiratory distress syndrome, and pneumonia) by hospital and each hospital’s NICU admission rate among the study population.
FIGURE 2.
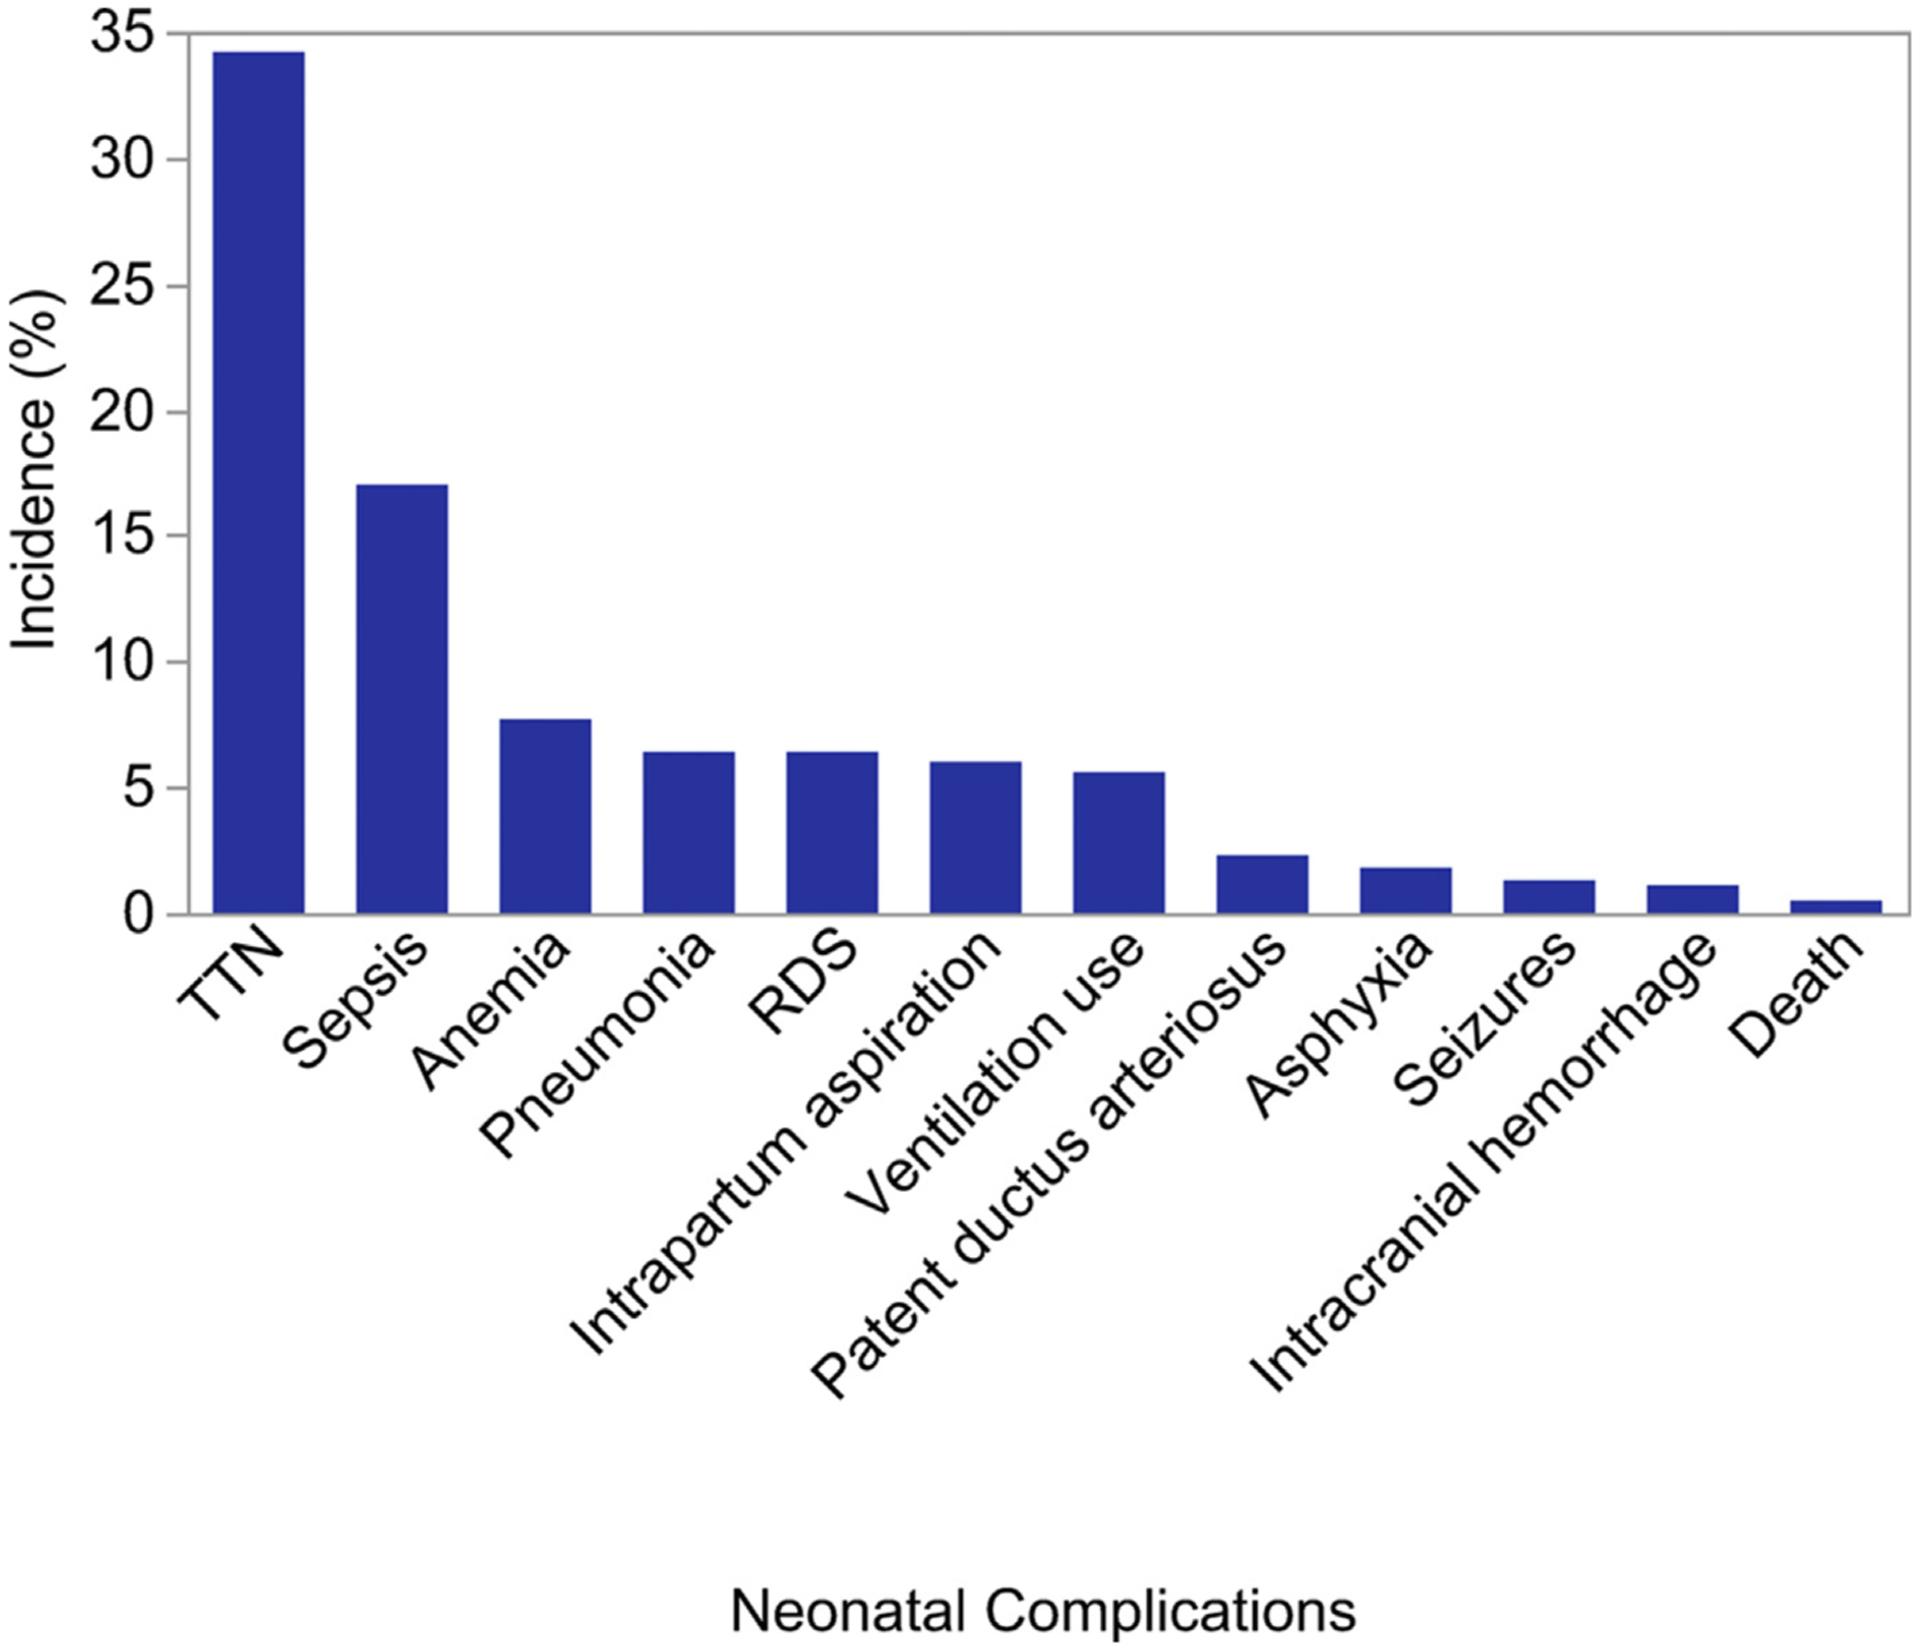
Incidence of neonatal complications among infants admitted to the NICU
One hospital did not collect neonatal sepsis information, resulting in missing data for 794 infants. If this hospital is excluded, the incidence of sepsis among infants admitted to the neonatal intensive care unit was 18.0%.
NICU, neonatal intensive care unit; RDS, respiratory distress syndrome; TTN, transient tachypnea of the newborn.
Clapp et al. Unexpected term NICU admissions. Am J Obstet Gynecol 2019.
FIGURE 3.
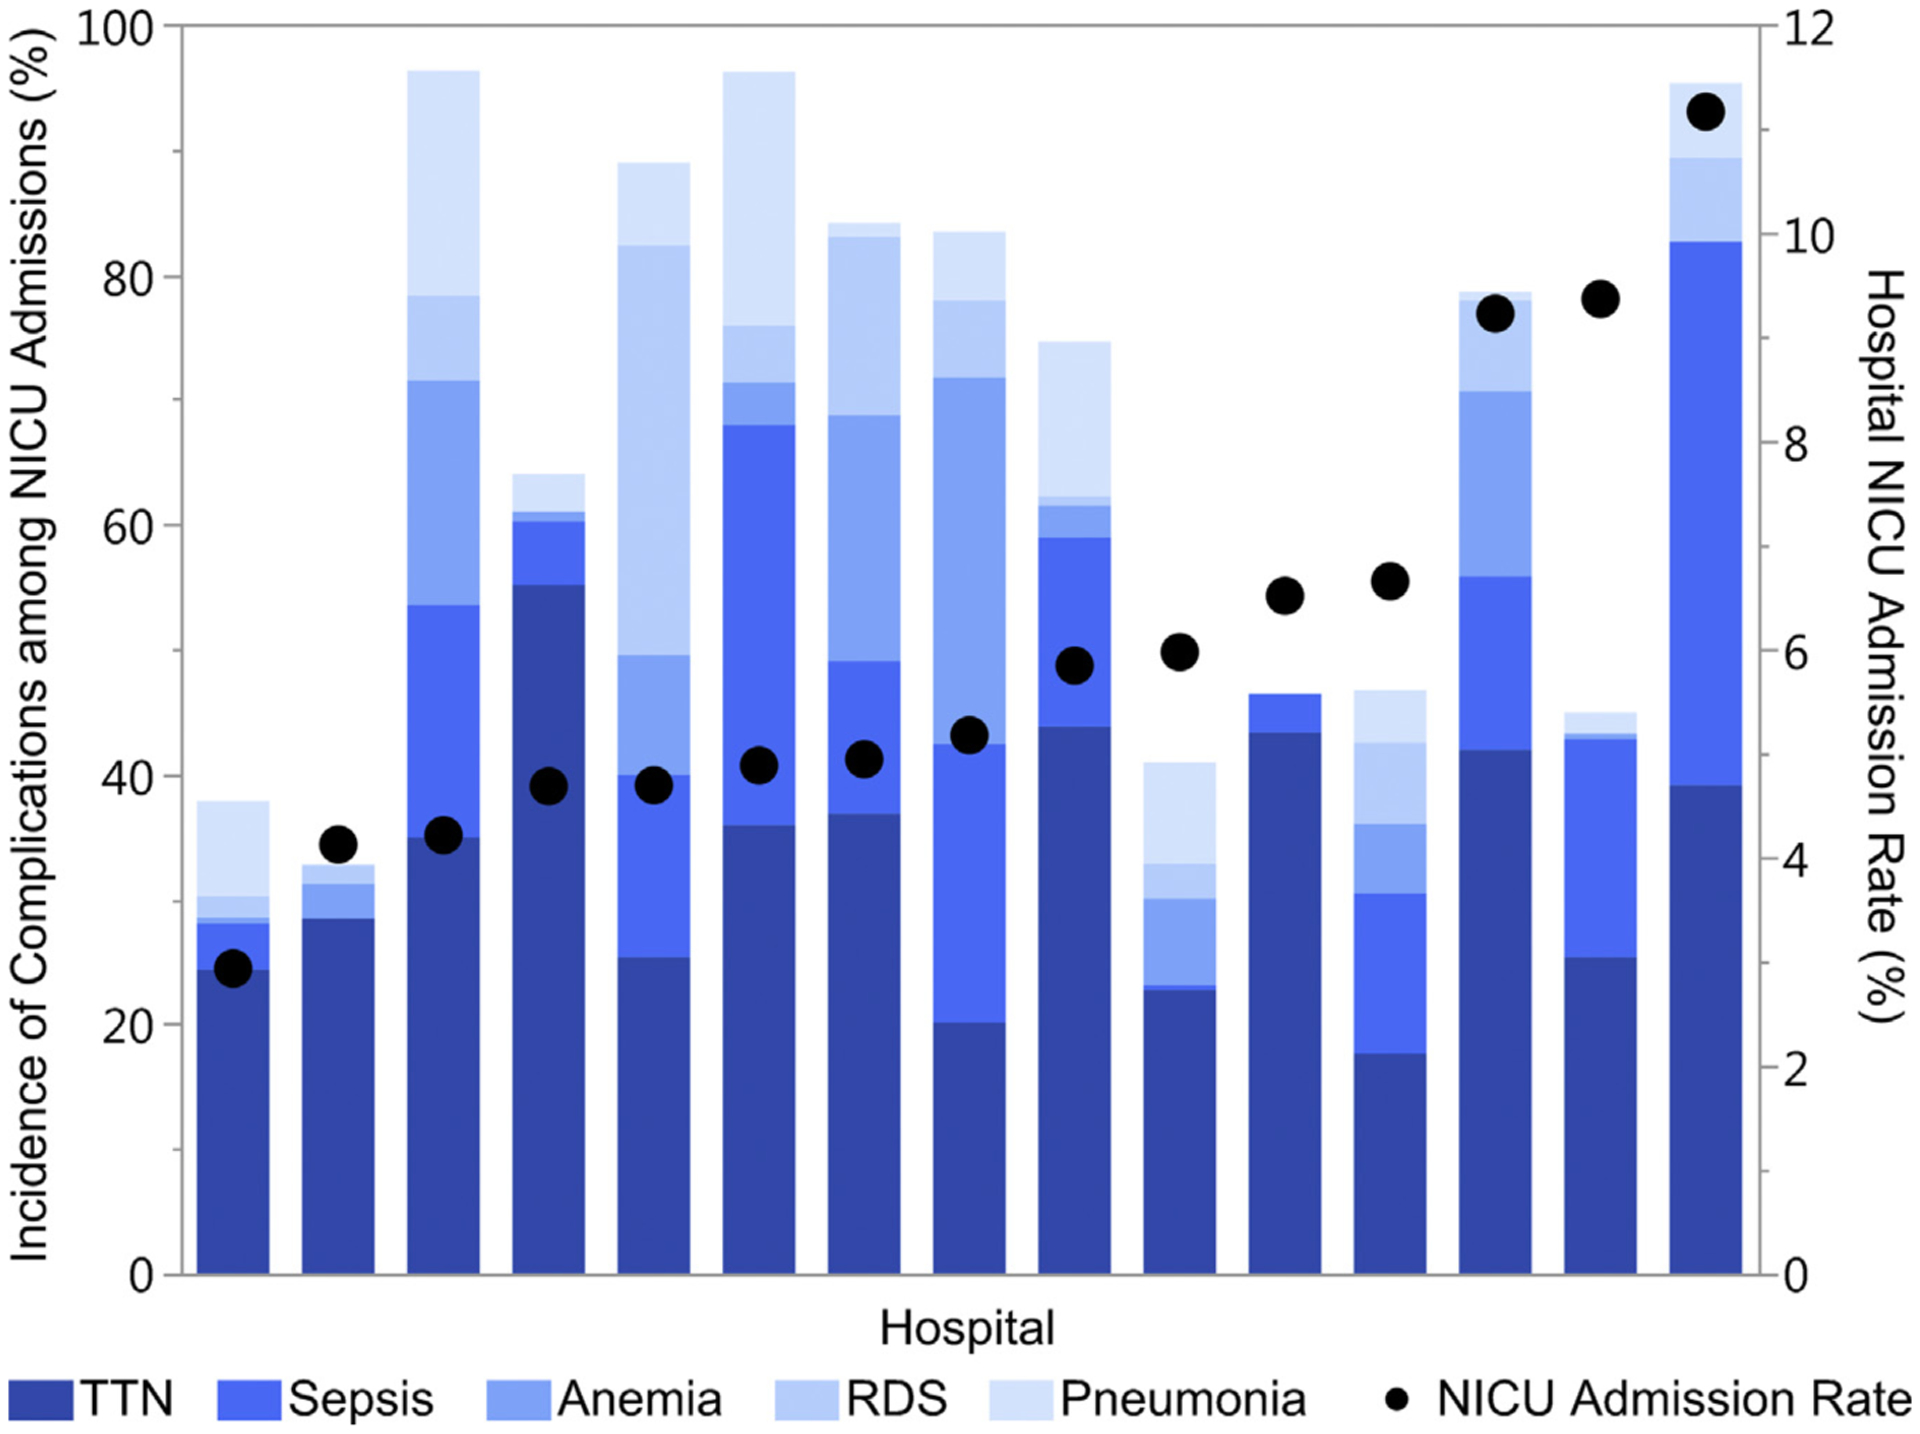
Incidence of the most common neonatal complications in NICU admissions
Relative incidence of the 5 most common neonatal complications among infants admitted to the neonatal intensive care unit in comparison with the hospital’s neonatal intensive care admission rate. The incidence of complications is calculated as the number of complications among NICU admissions in the study population at the hospital over the total number of NICU admissions at the hospital. Because an infant can have more than 1 complication, the incidence of complications can exceed 100% at each hospital. Hospital unexpected term NICU admission rates are shown on the right y-axis; hospitals are shown in ascending order by NICU admission rate.
NICU, neonatal intensive care unit; RDS, respiratory distress syndrome; TTN, transient tachypnea of the newborn.
Clapp et al. Unexpected term NICU admissions. Am J Obstet Gynecol 2019.
Table 1 compares the maternal demographics and pregnancy characteristics among infants admitted and not admitted to the NICU. Table 2 presents the incidence of NICU admissions for intrapartum and labor events. There were statistically significant differences for all comparisons (P <.001), given the overall large sample size with the exception of induction of labor. There were no differences in NICU admissions among women who labored either spontaneously or via induction.
TABLE 1.
Comparison of maternal demographics and pregnancy characteristics among infants admitted and not admitted to the neonatal intensive care unit
| Characteristics | Infant not admitted to NICU (n = 135,956 (94.4%) | Infant admitted to NICU (n = 7995 (5.6%) | Pvalue |
|---|---|---|---|
| Maternal age, y | 27.5 (6.1) | 27.1 (6.3) | < .001 |
| Missing | 216 (<0.1%) | 14 (<0.1%) | |
| Maternal race | < .001 | ||
| White | 67,331 (49.5%) | 3476 (43.5%) | |
| Black | 27,211 (20.0%) | 2237 (28.0%) | |
| Hispanic | 25,859 (19.0%) | 1343 (16.8%) | |
| Asian | 5775 (4.2%) | 256 (3.2%) | |
| Other | 9779 (7.2%) | 683 (8.5%) | |
| Missing | 1 (<1%) | 0 (0.0%) | |
| Maternal insurer | < .001 | ||
| Private | 78,496 (57.7%) | 4520 (56.5%) | |
| Public | 38,393 (28.2%) | 2747 (34.4%) | |
| Uninsured | 1617 (1.2%) | 98 (1.2%) | |
| Other | 193 (0.1%) | 10 (0.1%) | |
| Unknown | 17,257 (12.7%) | 620 (7.8%) | |
| Nulliparity | 54,378 (40.0%) | 3941 (49.3%) | < .001 |
| Gestational age, wks | < .001 | ||
| Early term (37–38) | 43,933 (32.3%) | 2944 (36.8%) | |
| Term (39–40) | 79,773 (58.7%) | 4250 (53.2%) | |
| Post-term (≥41) | 12,250 (9.0%) | 801 (10.0%) | |
| Hypertension | |||
| Chronic | 2419 (1.8%) | 224 (2.8%) | < .001 |
| Hypertensive disorder of pregnancy | 6628 (4.9%) | 592 (7.4%) | < .001 |
| Tobacco use | 5793 (4.3%) | 437 (5.5%) | < .001 |
| Birthweight | < .001 | ||
| Small for gestational age (<10%) | 14,383 (10.6%) | 1278 (16.0%) | |
| Appropriate for gestational age (10–90%) | 109,281 (80.4%) | 5766 (72.1%) | |
| Large for gestational age (>90%) | 12,292 (9.0%) | 951 (11.9%) |
All categorical data are presented as n (percentage). Maternal age, a continuous variable, is presented as mean (SD).
NICU, neonatal intensive care unit.
Clapp et al. Unexpected term NICU admissions. Am J Obstet Gynecol 2019.
TABLE 2.
Incidence of unexpected neonatal intensive care unit admission by intrapartum event
| Intrapartum events | Total number of women | Infants admitted to NICU | Pvalue |
|---|---|---|---|
| Second stage lengtha | < .001 | ||
| Prolonged | 9084 | 809 (8.9%) | |
| Not prolonged | 93,382 | 4235 (4.5%) | |
| Induction of laborb | .11 | ||
| Induced | 51,572 | 2598 (5.0%) | |
| Not induced | 74,029 | 3879 (5.2%) | |
| Trial of labor | < .001 | ||
| No trial of labor | 18,350 | 1510 (8.3%) | |
| No prior uterine scar | 119,466 | 6067 (5.1%) | |
| Prior uterine scar | 6135 | 410 (6.8%) | |
| Chorioamnionitis | < .001 | ||
| Present | 3395 | 531 (15.6%) | |
| Not present | 140,556 | 7464 (5.3%) | |
| Meconium-stained amniotic fluid | < .001 | ||
| Present | 16,345 | 1513 (9.3%) | |
| Not present | 127,605 | 6482 (5.1%) | |
| Intrapartum abruption | < .001 | ||
| Present | 1213 | 167 (13.8%) | |
| Not present | 142,738 | 7828 (5.5%) |
NICU, neonatal intensive care unit.
Prolonged second stage was defined as >3 hours for nulliparous women and >2 hours for multiparous women;
Among women who had a trial of labor and no uterine scar.
Clapp et al. Unexpected term NICU admissions. Am J Obstet Gynecol 2019.
Table 3 shows the results of the partially and fully adjusted logistic regressions for patient and pregnancy characteristics. In the fully adjusted model, the factors associated with the highest odds for NICU admission include nulliparity (adjusted odds ratio [aOR], 1.62 [95% confidence interval [CI], 1.53–1.71]), large for gestational age (aOR, 1.59 [95% CI, 1.47–1.71]), and small for gestational age (aOR, 1.60 [95% CI, 1.47–1.73]).
TABLE 3.
Partially and fully adjusted odds of neonatal intensive care unit admission for maternal demographics and pregnancy characteristics
| Characteristics | Partially adjusted OR (95% CI) | Pvalue | Fully adjusted OR (95% CI) | Pvalue |
|---|---|---|---|---|
| Maternal age | 1.00 (0.99–1.00) | .11 | 1.01 (1.01–1.02) | < .001 |
| Race | ||||
| White | Reference | Reference | ||
| Black | 1.25 (1.16–1.35) | < .001 | 1.27 (1.17–1.38) | < .001 |
| Hispanic | 0.95 (0.88–1.03) | .22 | 0.99 (0.91–1.07) | .79 |
| Asian | 0.94 (0.82–1.09) | .41 | 0.91 (0.79–1.05) | .19 |
| Other | 1.05 (0.95–1.16) | .35 | 1.04 (0.94–1.15) | .50 |
| Insurer | ||||
| Private | Reference | Reference | ||
| Public | 1.16 (1.09–1.24) | < .001 | 1.18 (1.10–1.26) | < .001 |
| Self-pay | 0.93 (0.73–1.17) | ] .70 | 0.96 (0.76–1.21) | .71 |
| Other | 1.06 (0.53–2.11) | .72 | 1.09 (0.54–2.18) | .81 |
| Unknown | 0.70 (0.62–0.79) | < .001 | 0.73 (0.65–0.83) | < .001 |
| Nulliparity | 1.52 (1.45–1.61) | < .001 | 1.62 (1.53–1.71) | < .001 |
| Gestational age, wks | ||||
| Early term (37–38) | 1.27 (1.21–1.34) | < .001 | 1.28 (1.21–1.35) | < .001 |
| Term (39–40) | Reference | Reference | ||
| Past term (≥41) | 1.22 (1.12–1.33) | .001 | 1.16 (1.07–1.27) | .001 |
| Hypertension | ||||
| Chronic | 1.58 (1.35–1.85) | < .001 | 1.26 (1.07–1.48) | < .001 |
| Pregnancy related | 1.66 (1.50–1.83) | < .001 | 1.36 (1.23–1.51) | < .001 |
| Tobacco use in pregnancy | 1.2 (1.11–1.40) | .001 | 1.24 (1.10–1.39) | < .001 |
| Birthweight | ||||
| Small for gestational age (<10%) | 1.70 (1.58–1.83) | < .001 | 1.59 (1.47–1.71) | < .001 |
| Appropriate for gestational age (10–90%) | Reference | Reference | ||
| Large for gestational age (>90%) | 1.54 (1.42–1.67) | < .001 | 1.60 (1.47–1.73) | < .001 |
The partially adjusted model accounts for only the random effects of the hospital and the patient. The fully adjusted model for maternal demographics (age, race, insurance status), pregnancy characteristics (parity, gestational age, hypertension, tobacco use in pregnancy, birthweight), and hospital characteristics (delivery volume, neonatal intensive care unit level, hospital type, and hospital level), and the random effects of the hospital and the patient.
CI, confidence interval; OR, odds ratio.
Clapp et al. Unexpected term NICU admissions. Am J Obstet Gynecol 2019.
Table 4 shows the results of the partially and fully adjusted logistic regressions for each individual intrapartum event. Induction of labor (aOR, 0.95 [95% CI, 0.89–1.01]) was not associated with increased odds of NICU admission compared with women who were in spontaneous labor. The events associated with higher odds of NICU admission included prolonged second stage (aOR, 1.66 [95% CI, 1.51–1.83]); chorioamnionitis (aOR, 3.89 [95% CI, 3.42–4.44]), meconium-stained amniotic fluid (aOR, 1.96 [95% CI, 1.82–2.10]), and abruption (aOR, 2.64 [95% CI, 2.16–3.21]). Compared with women who did not labor, the odds of NICU admission were lower for women who labored, including those who had a trial of labor after cesarean delivery: aOR, 0.48 (95% CI, 0.45–0.52) for women with no uterine scar and aOR, 0.83 (95% CI, 0.73–0.94) for women with a uterine scar.
TABLE 4.
Partially and fully adjusted odds of neonatal intensive care unit admission for labor and intrapartum events
| Intrapartum events | Partially adjusted OR (95% CI) | Pvalue | Fully adjusted OR (95% CI) | Pvalue |
|---|---|---|---|---|
| Prolonged second stagea | 1.86 (1.68–2.04) | < .001 | 1.66 (1.51–1.83) | < .001 |
| Induction of laborb | 1.04 (0.98–1.10) | .17 | 0.95 (0.89–1.01) | .09 |
| Trial of labor | ||||
| No trial of labor | Reference | Reference | ||
| No uterine scar | 0.56 (0.52–0.60) | < .001 | 0.48 (0.45–0.52) | < .001 |
| Uterine scar | 0.73 (0.64–0.82) | < .001 | 0.83 (0.73–0.94) | .003 |
| Chorioamnionitis | 4.40 (3.86–5.01) | < .001 | 3.89 (3.42–4.44) | < .001 |
| Meconium-stained amniotic fluid | 1.97 (1.83–2.11) | < .001 | 1.96 (1.82–2.10) | < .001 |
| Abruption | 2.83 (2.32–3.45) | < .001 | 2.64 (2.16–3.21) | < .001 |
The partially adjusted model accounts for only the random effects of the hospital and the patient. The fully adjusted model for maternal demographics (age, race, insurance status), pregnancy characteristics (parity, gestational age, hypertension, tobacco use in pregnancy, birthweight), and hospital characteristics (delivery volume, neonatal intensive care unit level, hospital type, and hospital level), and the random effects of the hospital and the patient.
CI, confidence interval; OR, odds ratio.
Reference group is women who reached the second stage but had a normal second-stage length;
Among women with no uterine scar. Reference group is women who had spontaneous labor.
Clapp et al. Unexpected term NICU admissions. Am J Obstet Gynecol 2019.
Table 5 presents the series of hierarchical random-effects models, showing the effects of patient and hospitals characteristics on the between-hospital variation estimates (ie, the intraclass correlation coefficients). When accounting for the random effects of the hospital and the individual, the amount of between-hospital variation was 4.5%. After adjustment for patient case mix, the variance decreased to 3.3%. Lastly, with the addition of hospital characteristics, the hospital variance decreased to 1.9%. Thus, only 1.9% of the total variation was explained by between-hospital differences, while 98.1% of the variation in NICU admissions were attributed to unmeasured differences among practice patterns and characteristics at the patient level.
TABLE 5.
Between-hospital variance in neonatal intensive care unit admissions
| Model | Intraclass correlation coefficient (95% confidence interval) |
|---|---|
| No adjustments for patient or hospital characteristics | 4.5% (2.2–9.0%) |
| Adjustment for maternal demographics and pregnancy characteristics (case mix) | 3.3% (1.6–6.6%) |
| Adjustment for case mix and hospital characteristics | 1.9% (0.1–4.2%) |
Clapp et al. Unexpected term NICU admissions. Am J Obstet Gynecol 2019.
The analysis was repeated in the subgroup of women who labored without a prior cesarean delivery (n = 119,466), of which 6607 (5.1%) were admitted to the NICU. The findings from the partially and fully adjusted logistic regressions and the series of hierarchical random-effects models mirrored the results presented from the full model. The tables for these model results are included in Appendix 1, 2, and 3.
Comment
Among women who delivered term, liveborn, singleton, nonanomalous infants, the rates of unexpected NICU admissions varied nearly 4-fold among the 15 hospitals in this large, multicenter cohort. While controlling for patient factors and the random effects of the hospital and the individual, there were increased odds for NICU admission for women who developed chorioamnionitis, had an intrapartum abruption, or had the presence of meconium-stained amniotic fluid. Women who had prolonged second stage also had a 70% increased risk. Notably, induction of labor was not associated with NICU admission.
There was wide variation in the incidence of neonatal complications among NICU admissions by hospital. TTN was the most common indication for NICU admission. After controlling for case mix and hospital-specific factors, the between-hospital attributable variation was minimal (1.9%), suggesting that unmeasured within-hospital factors explained most of the observed variation.
The primary intent of the Consortium for Safe Labor project was to study contemporary patterns of women in labor and their associated neonatal outcomes.24,25 By design, detailed information was collected on intrapartum and neonatal events. Thus, this data set contains highly granular patient information and hospital characteristics, allowing us to examine the association between intrapartum events and NICU admissions.
Three intrapartum events are known to be associated with adverse neonatal outcomes, likely contributing to their higher odds for NICU admission: chorioamnionitis and neonatal sepsis; the presence of meconium-stained amniotic fluid and meconium-aspiration syndrome; and intrapartum abruption with fetal anemia and hypoxic insults.33–37 Of these, chorioamnionitis had the strongest association with unexpected NICU admission with an adjusted odds ratio of 3.89 (95% CI, 3.42–4.44). Notably, the hospital-specific incidence of sepsis among NICU admissions ranged from 0.4% to 43.5% of admissions (median, 14.3%).
We were not able to distinguish between cases of suspected sepsis and confirmed sepsis from the data set, which likely contributed to this wide range; length of stay in the NICU was not reliably captured across all institutions to understand how institution-specific policies for sepsis evaluation and monitoring may have affected an infant’s risk of NICU admission.
Of the 3 provider-influenced intrapartum events, a prolonged second stage was associated with the highest odds of NICU admission (aOR, 1.66 [95% CI, 1.51–1.83]). Compared with women who had a normal second-stage length, twice as many infants were admitted to the NICU after a prolonged second stage. The neonatal complication with the highest incidence among infants admitted to the NICU after a prolonged second stage was sepsis (30.5%), which is likely contributing to this association.
These findings support prior work showing an increased incidence of chorioamnionitis and neonatal sepsis in women with prolonged second stages, although hospital-specific practices for sepsis work-up and management, as discussed, limit the interpretation of the association between NICU admission and a prolonged second stage.26–29
Interestingly, induction of labor was not associated with NICU admission after controlling for gestational age and common indications for induction (hypertension, small for gestational age). These data add to the growing literature on the safety of inductions and supports results from large randomized trials.38,39
In comparison, labor was associated with a lower risk for NICU admission, among both women without a uterine scar (52% risk reduction) and with a uterine scar (17% risk reduction). We hypothesize this is related to lower rates of respiratory morbidity among infants born via vaginal delivery compared with via cesarean delivery.40–42 Comparing the 2 groups of women who had a trial of labor with and without a prior uterine scar, 6.8% of infants born to mothers who underwent a trial of labor after cesarean delivery were admitted to the NICU compared with 5.1% of infants born to mothers with no prior uterine scar.
The variation in the observed NICU admission rates (range, 2.9–11.2%) support prior studies noting that NICU admissions are multifactorial, dependent on such factors as hospital protocols, provider judgment (nurses and neonatal providers), staffing availability, and NICU bed availability.20–23 These factors are often not easily measured or controlled for in population analyses, nor are their effects weighted equally or systematically in each patient, making the examination of NICU admissions challenging.
Using this same data set, although in a different population, Ziegler et al20 demonstrated there was a high rate of unexplained variability among infants with absolute and relative criteria for NICU admissions; they hypothesized that hospital-specific policies may be contributing to the observed variability. In our study, we estimated the between-hospital variation in NICU admission rates (ie, the degree to which hospital clustering explains the variation between hospitals) to understand the effect of systemic hospital practices and factors. Prior to adjustment to any patient factors, less than 5% of the variation was attributed to hospital practice variation. Of this variation, 50% was explained by patient case mix (demographics and comorbidities) and hospital characteristics, which are considered fixed properties of the institution.
After adjustment, the final proportion of the variation attributed to clustering effects at the hospital-level was minimal (1.9%). Thus, the lack of hospital-based clustering suggests that even within individual hospitals, there was considerable variation in which infants were unexpectedly admitted to the NICU.
While this analysis comprised a large, geographically diverse, multiinstitution sample using data that were collected by trained extractors for the Consortium for Safe Labor study, there are several limitations. This analysis was a secondary analysis of a preexisting, retrospectively collected data set. While approximately 150,000 patients were included in the final sample, there were only 15 institutions analyzed; the analysis should be performed in larger sample of hospitals to better understand the effects of interhospital NICU admission variation. Furthermore, information collected on maternal and neonatal conditions relied on local institutional definitions, and their incidences were likely related to hospital-specific documentation and coding practices.
This lack of uniformity can introduce biases of over- and underreporting and have an impact on the estimates of associations; however, this lack of uniformity is a reflection of actual practice and similarly affects all population-level analyses (eg, discharge database studies). To minimize the effects of biases introduced by missing data, variables and hospitals with large amounts of missing data were excluded prior to the analysis.
Also, this data set comprises information that now is at least 10 years old; practice patterns may have changed, limiting the generalizability of these findings to current obstetric and neonatal practices. The data were not specifically collected for this research question, which limited the availability and reliability of the data elements used in this analysis. Notably, we were limited in our ability to quantify or stratify the severity of the primary outcome, NICU admission. As hospitals were deidentified, we were unable to further investigate whether institutional protocols (eg, NICU admission for routine administration of intra-venous antibiotics in the setting of maternal chorioamnionitis) may have contributed to a hospital’s NICU admission rate. If unexpected term NICU admission rates were adopted as a marker of obstetric care quality, many of these same limitations would have to be considered in its interpretation.
This study analyzed unexpected term NICU admissions and contributes to the currently limited understanding of admission rates among this population to reflect obstetrical care quality. We demonstrated that significant variation exists in hospital NICU admission rates and that certain intrapartum events and practices are associated with increased risk for NICU admission after delivery. However, the between-hospital variation was low, of which greater than 50% was explained by factors (case mix and fixed hospital properties) outside the control of providers at a specific institution.
A high degree of between-hospital variation, after accounting for case mix, suggests that systematic practices within an individual hospital may explain the observed variation. From a quality perspective, this finding would prompt further study into the causes of these systematic differences contributing to NICU admission rates, such as labor management among providers at a hospital or protocoled admissions for specific neonatal conditions. The lack of significant between-hospital variation suggests that hospital-based NICU admission rates are unlikely to meaningfully reflect consistent obstetrical care practices within these 15 hospitals.
Future studies should repeat this analysis in a larger sample of hospitals to understand the distribution of unexpected NICU admission rates and between-hospital variation. It is likely that unmeasured confounders and properties extrinsic to intrapartum care (eg, NICU bed availability) will ultimately limit the ability of unexpected term NICU admissions to meaningfully reflect obstetrical care quality.
AJOG at a Glance.
Why was this study conducted?
To determine the relative effects of patient characteristics and intrapartum events on neonatal intensive care unit (NICU) admissions among low-risk neonates.
To understand hospital variation in NICU admission rates and quantify the proportion of variance attributed to hospital-specific practices.
Key findings
Intrapartum events influence a neonate’s risk for NICU admission.
Rates of NICU admission varied by nearly 4-fold among hospitals in this sample.
Little of this variance could be attributed to hospital-specific effects.
What does this add to what is known?
The indications for unexpected term NICU admissions are multifactorial.
NICU admission rates are unlikely to accurately reflect hospital-specific practices.
Many limitations would need to be addressed before adopting this rate as an obstetric quality metric.
Acknowledgment
The Consortium for Safe Labor data were obtained with permission from the Eunice Kennedy Shriver National Institute for Child Health and Development to conduct this analysis.
This study was supported by the Society for Maternal-Fetal Medicine Health Policy Award.
APPENDIX 1. Fully adjusted odds of neonatal intensive care unit admission for maternal demographics and pregnancy characteristics for women who underwent a trial of labor without a uterine scar
| Characteristics | Fully adjusted OR (95% CI) | Pvalue |
|---|---|---|
| Maternal age | 1.01 (1.01–1.02) | < .001 |
| Race | ||
| White | Reference | |
| Black | 1.22 (1.11–1.34) | < .001 |
| Hispanic | 1.05 (0.95–1.15) | .33 |
| Asian | 1.00 (0.85–1.17) | 1.00 |
| Other | 1.03 (0.92–1.16) | .57 |
| Insurer | ||
| Private | Reference | |
| Public | 1.15 (1.07–1.24) | < .001 |
| Self-pay | 1.01 (0.78–1.30) | .97 |
| Other | 0.87 (0.36–2.08) | .75 |
| Unknown | 0.82 (0.71–0.95) | .008 |
| Nulliparity | 1.98 (1.84–2.11) | < .001 |
| Gestational age, wks | ||
| Early term (37–38) | 1.19 (1.12–1.27) | < .001 |
| Term (39–40) | Reference | |
| Past term (≥41) | 1.21 (1.10–1.32) | .001 |
| Hypertension | ||
| Chronic | 1.22 (1.00–1.50) | .05 |
| Pregnancy related | 1.40 (1.25–1.57) | < .001 |
| Tobacco use in pregnancy | 1.31 (1.15–1.49) | < .001 |
| Birthweight | ||
| <10% | 1.53 (1.41–1.67) | < .001 |
| 10–90% | Reference | |
| >90% | 1.65 (1.50–1.82) | < .001 |
The fully adjusted model was for maternal demographics (age, race, insurance status), pregnancy characteristics (parity, gestational age, hypertension, tobacco use in pregnancy, birthweight), and hospital characteristics (delivery volume, neonatal intensive care unit level, hospital type, and hospital level), and the random effects of the hospital and the patient.
CI, confidence interval; OR, odds ratio.
Clapp et al. Unexpected term NICU admissions. Am J Obstet Gynecol 2019.
APPENDIX 2. Fully adjusted odds of neonatal intensive care unit admission for labor and intrapartum events for women who underwent a trial of labor without a uterine scar
| Intrapartum events | Fully adjusted OR (95% CI) | Pvalue |
|---|---|---|
| Prolonged second stagea | 1.59 (1.44–1.76) | < .001 |
| Induction of laborb | 0.96 (0.91–1.03) | .25 |
| Chorioamnionitis | 3.98 (3.46–4.59) | < .001 |
| Meconium-stained amniotic fluid | 2.06 (1.90–2.23) | < .001 |
| Abruption | 2.40 (1.89–3.05) | < .001 |
The fully adjusted model was for maternal demographics (age, race, insurance status), pregnancy characteristics (parity, gestational age, hypertension, tobacco use in pregnancy, birthweight), and hospital characteristics (delivery volume, neonatal intensive care unit level, hospital type, and hospital level), and the random effects of the hospital and the patient.
CI, confidence interval; OR, odds ratio.
Reference group is women who reached the second stage but had a normal second-stage length;
Reference group is women who had spontaneous labor.
Clapp et al. Unexpected term NICU admissions. Am J Obstet Gynecol 2019.
APPENDIX 3. Between-hospital variance in neonatal intensive care unit admissions among infants born to women who underwent a trial of labor without a uterine scar
| Model | Intraclass correlation coefficient (95% confidence interval) |
|---|---|
| No adjustments for patient or hospital characteristics | 4.8% (2.3–9.5%) |
| Adjustment for maternal demographics and pregnancy characteristics (case mix) | 3.7% (1.8–7.6%) |
| Adjustment for case mix and hospital characteristics | 1.9% (0.1–4.1%) |
Clapp et al. Unexpected term NICU admissions. Am J Obstet Gynecol 2019.
Footnotes
The authors report no conflict of interest.
Findings from this project were accepted for oral presentation at the 2019 Pregnancy Meeting of the Society for Maternal-Fetal Medicine, February 11–16, 2019, Las Vegas, NV.
References
- 1.Bailit JL, Gregory KD, Srinivas S, Westover T, Grobman WA, Saade GR. Society for Maternal-Fetal Medicine (SMFM) Special Report: current approaches to measuring quality of care in obstetrics. Am J Obstet Gynecol 2016;215:B8–16. [DOI] [PubMed] [Google Scholar]
- 2.Bailit JL, Love TE, Dawson NV. Quality of obstetric care and risk-adjusted primary cesarean delivery rates. Am J Obstet Gynecol 2006;194:402–7. [DOI] [PubMed] [Google Scholar]
- 3.Armstrong JC, Kozhimannil KB, McDermott P, Saade GR, Srinivas SK; Society for Maternal-Fetal Medicine Health Policy Committee. Comparing variation in hospital rates of cesarean delivery among low-risk women using 3 different measures. Am J Obstet Gynecol 2016;214:153–63. [DOI] [PubMed] [Google Scholar]
- 4.Bailit J, Garrett J. Comparison of risk-adjustment methodologies for cesarean delivery rates. Obstet Gynecol 2003;102: 45–51. [DOI] [PubMed] [Google Scholar]
- 5.Srinivas SK, Fager C, Lorch SA. Evaluating risk-adjusted cesarean delivery rate as a measure of obstetric quality. Obstet Gynecol 2010;115:1007–13. [DOI] [PMC free article] [PubMed] [Google Scholar]
- 6.Main EK, Moore D, Farrell B, et al. Is there a useful cesarean birth measure? Assessment of the nulliparous term singleton vertex cesarean birth rate as a tool for obstetric quality improvement. Am J Obstet Gynecol 2006;194: 1644–51; discussion 1651–52. [DOI] [PubMed] [Google Scholar]
- 7.Kozhimannil KB, Arcaya MC, Subramanian SV. Maternal clinical diagnoses and hospital variation in the risk of cesarean delivery: analyses of a National US Hospital Discharge Database. PLoS Med 2014;11:e1001745. [DOI] [PMC free article] [PubMed] [Google Scholar]
- 8.Kozhimannil KB, Law MR, Virnig BA. Cesarean delivery rates vary tenfold among US hospitals: reducing variation may address quality and cost issues. Health Aff Proj Hope 2013;32: 527–35. [DOI] [PMC free article] [PubMed] [Google Scholar]
- 9.Caughey AB, Cahill AG, Guise J-M, Rouse DJ. Safe prevention of the primary cesarean delivery. Am J Obstet Gynecol 2014;210:179–93. [DOI] [PubMed] [Google Scholar]
- 10.Centers for Disease Control and Prevention (CDC). FastStats—births and natality [Internet]. Available at: https://www.cdc.gov/nchs/fastats/births.htm.AccessedOctober 14, 2017.
- 11.Sachs BP, Kobelin C, Castro MA, Frigoletto F. The risks of lowering the cesarean-delivery rate. N Engl J Med 1999;340:54–7. [DOI] [PubMed] [Google Scholar]
- 12.Clark SL, Garite TJ, Hamilton EF, Belfort MA, Hankins GD. “Doing something” about the cesarean delivery rate. Am J Obstet Gynecol 2018;219:267–71. [DOI] [PubMed] [Google Scholar]
- 13.Molina G, Weiser TG, Lipsitz SR, et al. Relationship between cesarean delivery rate and maternal and neonatal mortality. JAMA 2015;314:2263–70. [DOI] [PubMed] [Google Scholar]
- 14.American College of Obstetricians and Gy-necologists. Nonmedically indicated early-term deliveries. ACOG Committee opinion no. 561. Obstet Gynecol 2013;121:911–5. [DOI] [PubMed] [Google Scholar]
- 15.Snowden JM, Muoto I, Darney BG, et al. Oregon’s hard-stop policy limiting elective early-term deliveries: association with obstetric procedure use and health outcomes. Obstet Gynecol 2016;128:1389–96. [DOI] [PMC free article] [PubMed] [Google Scholar]
- 16.Nicholson JM, Kellar LC, Ahmad S, et al. US term stillbirth rates and the 39-week rule: a cause for concern? Am J Obstet Gynecol 2016;214:621.e1–9. [DOI] [PubMed] [Google Scholar]
- 17.Little SE, Zera CA, Clapp MA, Wilkins-Haug L, Robinson JN. A multi-state analysis of early-term delivery trends and the association with term stillbirth. Obstet Gynecol 2015;126: 1138–45. [DOI] [PubMed] [Google Scholar]
- 18.National Quality Forum. Perinatal and Reproductive Health Project 2015e2016—measures [Internet]. Available at: http://www.qualityforum.org/ProjectMeasures.aspx?ProjectID=80680.AccessedNovember 3, 2018.
- 19.California Maternal Quality Care Collaborative. Unexpected complications in term newborns. California Maternal Quality Care Collaborative; [Internet]. Available at: https://www.cmqcc.org/focus-areas/quality-metrics/unexpected-complications-term-newborns. Accessed November 3, 2018. [Google Scholar]
- 20.Ziegler KA, Paul DA, Hoffman M, Locke R. Variation in NICU admission rates without identifiable cause. Hosp Pediatr 2016;6:255–60. [DOI] [PubMed] [Google Scholar]
- 21.Harrison WN, Wasserman JR, Goodman DC. Regional variation in neonatal intensive care admissions and the relationship to bed supply. J Pediatr 2018;192:73–9.e4. [DOI] [PubMed] [Google Scholar]
- 22.Edwards EM, Horbar JD. Variation in use by NICU types in the United States. Pediatrics 2018:142. [DOI] [PubMed] [Google Scholar]
- 23.Schulman J, Braun D, Lee HC, et al. Association between neonatal intensive care unit admission rates and illness acuity. JAMA Pediatr 2018;172:17–23. [DOI] [PMC free article] [PubMed] [Google Scholar]
- 24.Eunice Kennedy Shriver National Institute for Child Health and Human Development. Consortium on Safe Labor (CSL) [Internet]. Available at: https://www.nichd.nih.gov/about/org/diphr/eb/research/Pages/safe-labor.aspx. Accessed November 12, 2017. [Google Scholar]
- 25.Zhang J, Landy HJ, Branch DW, et al. Contemporary patterns of spontaneous labor with normal neonatal outcomes. Obstet Gynecol 2010;116:1281–7. [DOI] [PMC free article] [PubMed] [Google Scholar]
- 26.Cheng YW, Hopkins LM, Caughey AB. How long is too long: does a prolonged second stage of labor in nulliparous women affect maternal and neonatal outcomes? Am J Obstet Gynecol 2004;191:933–8. [DOI] [PubMed] [Google Scholar]
- 27.Cheng YW, Hopkins LM, Laros RK, Caughey AB. Duration of the second stage of labor in multiparous women: maternal and neonatal outcomes. Am J Obstet Gynecol 2007;196:585.e1–6. [DOI] [PubMed] [Google Scholar]
- 28.Allen VM, Baskett TF, O’Connell CM, McKeen D, Allen AC. Maternal and perinatal outcomes with increasing duration of the second stage of labor. Obstet Gynecol 2009;113:1248–58. [DOI] [PubMed] [Google Scholar]
- 29.Cahill AG, Srinivas SK, Tita ATN, et al. Effect of immediate vs delayed pushing on rates of spontaneous vaginal delivery among nulliparous women receiving neuraxial analgesia: a randomized clinical trial. JAMA 2018;320:1444–54. [DOI] [PMC free article] [PubMed] [Google Scholar]
- 30.Austin PC, Merlo J. Intermediate and advanced topics in multilevel logistic regression analysis. Stat Med 2017;36:3257–77. [DOI] [PMC free article] [PubMed] [Google Scholar]
- 31.Merlo J, Chaix B, Ohlsson H, et al. A brief conceptual tutorial of multilevel analysis in social epidemiology: using measures of clustering in multilevel logistic regression to investigate contextual phenomena. J Epidemiol Community Health 2006;60:290–7. [DOI] [PMC free article] [PubMed] [Google Scholar]
- 32.Sanagou M, Wolfe R, Forbes A, Reid CM. Hospital-level associations with 30-day patient mortality after cardiac surgery: a tutorial on the application and interpretation of marginal and multilevel logistic regression. BMC Med Res Methodol 2012;12:28. [DOI] [PMC free article] [PubMed] [Google Scholar]
- 33.Shane AL, Sánchez PJ, Stoll BJ. Neonatal sepsis. Lancet Lond Engl 2017;390: 1770–80. [DOI] [PubMed] [Google Scholar]
- 34.Meis PJ, Hobel CJ, Ureda JR. Late meconium passage in labor–a sign of fetal distress? Obstet Gynecol 1982;59:332–5. [PubMed] [Google Scholar]
- 35.Katz VL, Bowes WA. Meconium aspiration syndrome: reflections on a murky subject. Am J Obstet Gynecol 1992;166(1 Pt 1):171–83. [DOI] [PubMed] [Google Scholar]
- 36.Oyelese Y, Ananth CV. Placental abruption. Obstet Gynecol 2006;108:1005–16. [DOI] [PubMed] [Google Scholar]
- 37.Downes KL, Grantz KL, Shenassa ED. Maternal, labor, delivery, and perinatal outcomes associated with placental abruption: a systematic review. Am J Perinatol 2017;34:935–57. [DOI] [PMC free article] [PubMed] [Google Scholar]
- 38.Grobman WA, Rice MM, Reddy UM, et al. Labor induction versus expectant management in low-risk nulliparous women. N Engl J Med 2018;379:513–23. [DOI] [PMC free article] [PubMed] [Google Scholar]
- 39.Middleton P, Shepherd E, Crowther CA. Induction of labour for improving birth outcomes for women at or beyond term. Cochrane Database Syst Rev 2018;5:CD004945. [DOI] [PMC free article] [PubMed] [Google Scholar]
- 40.Gerten KA, Coonrod DV, Bay RC, Chambliss LR. Cesarean delivery and respiratory distress syndrome: does labor make a difference? Am J Obstet Gynecol 2005;193(3 Pt 2):1061–4. [DOI] [PubMed] [Google Scholar]
- 41.Tita ATN, Landon MB, Spong CY, et al. Timing of elective repeat cesarean delivery at term and neonatal outcomes. N Engl J Med 2009;360:111–20. [DOI] [PMC free article] [PubMed] [Google Scholar]
- 42.Yee W, Amin H, Wood S. Elective cesarean delivery, neonatal intensive care unit admission, and neonatal respiratory distress. Obstet Gynecol 2008;111:823–8. [DOI] [PubMed] [Google Scholar]