ABSTRACT
Long noncoding RNAs (lncRNAs) have key functions in modulating cervical cancer (CC) genesis and progression. This work focused on exploring lncRNA HNRNPU-AS1's function in CC and the underlying mechanism. HNRNPU-AS1, AXIN2, and microRNA 205-5p (miR-205-5p) levels in CC cases were measured through reverse transcription-quantitative PCR. The relationship between miR-205-5p and AXIN2 or HNRNPU-AS1 was validated through a dual-luciferase assay. Cell proliferation was examined by CCK-8 and cell apoptosis by colony formation and flow cytometry analysis. HNRNPU-AS1 expression loss could be observed in CC patients and cell lines, which predicted the dismal prognosis of CC cases. Moreover, it was identified that the miR-205-5p level was upregulated, which acted as an inhibitory target of HNRNPU-AS1 and AXIN2. HNRNPU-AS1 inhibited cell proliferation and promoted apoptosis. As revealed by Kaplan-Meier curve, CC cases showing low HNRNPU-AS1, high miR-205-5p, and low AXIN2 levels had the poorest prognosis. AXIN2 reversed the CC cell proliferation-promoting, apoptosis-inhibiting, and Wnt/β-catenin signaling-activating behavior mediated by miR-205-5p or HNRNPU-AS1 knockout. In conclusion, the overexpression of lncRNA HNRNPU-AS1 suppressed CC progression by inhibiting the Wnt/β-catenin pathway through the miR-205-5p/AXIN2 axis.
KEYWORDS: HNRNPU-AS1, miR-205-5p, proliferation, apoptosis, cervical cancer, AXIN2, Wnt/β-catenin
INTRODUCTION
Cervical cancer (CC) ranks 2nd among frequently occurring cancers among females (1). The abnormal proliferation and apoptosis, migration, invasion, and other biological behaviors of cervical epithelial cells are remarkably related to CC genesis and progression (2, 3). Long noncoding RNAs (lncRNAs) are 200-nucleotide (nt)-long RNAs with no protein-coding capacity that have indispensable functions in many cancers, including CC (4). Many studies have demonstrated that the abnormal lncRNA expression participates in disease genesis and development, which can guide the targeted treatment and prognosis prediction of patients. For instance, lncRNA TINCR knockout and lncRNA PVT1 overexpression promote the proliferation of colorectal cancer (CRC) (5) and glioma cells (6), respectively. HNRNPU-AS1 is an lncRNA significantly related to the number of rheumatoid arthritis synovial cells (7–9), and it is seldom studied in cancers. Therefore, we are curious about the role of HNRNPU-AS1 in CC and its molecular mechanism. However, both microRNA (miRNA) and lncRNA are important links in regulating gene expression. They mediate mRNA regulation or even translation at posttranscriptional and transcriptional levels. Simultaneously, miRNA and lncRNA have a very subtle interaction relationship.
miRNAs, as the endogenous noncoding small RNAs, are highly conserved in evolution (10). The aberrant miRNA level facilitates the modulation of tumor suppressor and oncogene expression. miRNA 205-5p (miR-205-5p) relates to growth, epithelial-mesenchymal transition (EMT) and apoptosis of bladder cancer cells (11), head and neck squamous cell carcinoma (HNSCC) (12), and gastric cancer (GC) (13); in addition, it is tightly associated with female cancer genesis and progression. miR-205-5p, the NRNPU-AS1 target miRNA, is suggested to affect gemcitabine sensitivity of breast cancer (BC) cells (14) and result in endometrial cancer development and resistance to paclitaxel (15), which promotes the occurrence of cancer through suppressing the downstream target gene expression (such as PTEN, FOXO1, and BRCA1) (12, 15, 16). In addition, miR-205-5p can activate the phosphatidylinositol 3-kinase (PI3K)/Akt (17), mitogen-activated protein kinase (MAPK), and Wnt/β-catenin signaling pathways (18), thereby promoting cancer progression. Therefore, it is speculated that HNRNPU-AS1 is related to CC genesis and progression through modulating its downstream targets.
RESULTS
HNRNPU-AS1 expression decreased within CC cells and tissues.
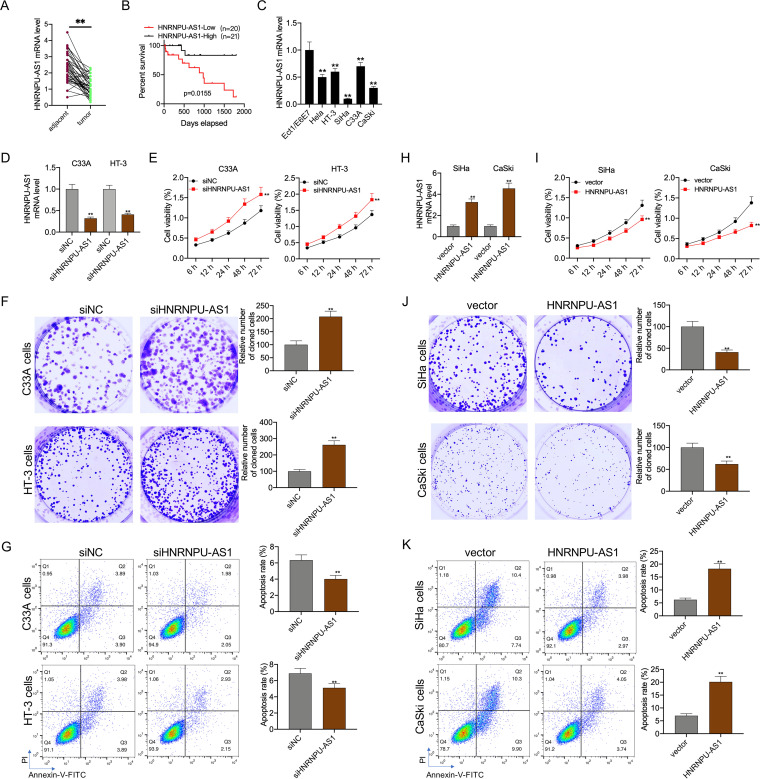
For determining HNRNPU-AS1 expression profiles within CC, this study measured HNRNPU-AS1 levels within 41 CC samples and matched noncarcinoma cervical samples. As a result, HNRNPU-AS1 expression remarkably declined within CC tissues relative to noncarcinoma tissues (Fig. 1A). For analyzing the relationship of HNRNPU-AS1 level with the clinicopathological characteristics of CC, this study classified those 41 CC cases as high- or low-HNRNPU-AS1-expression group according to the median HNRNPU-AS1 expression. According to Pearson chi-square test results, the HNRNPU-AS1 level showed positive correlation with greater tumor size (P = 0.001) (Table 1). Besides, based on Kaplan-Meier (KM) analysis results, CC cases who showed low HNRNPU-AS1 expression were associated with poor prognostic outcome (P = 0.0155) (Fig. 1B). Further, this study analyzed HNRNPU-AS1 levels within CC cells (SiHa, HeLa, HT-3, and C33A) and human normal cervical epithelial Ect1/E6E7 cells by reverse transcription-quantitative PCR (RT-qPCR). According to Fig. 1C, the HNRNPU-AS1 level remarkably declined within CC cells relative to normal cervical epithelial cells. Besides, it was found that HNRNPU-AS1 expression in HT-3 and C33A cells markedly increased relative to the remaining CC cells, with the lowest expression being detected in CaSki and SiHa cells. Therefore, HT-3 and C33A cells were used for the HNRNPU-AS1 overexpression transfection experiment, whereas SiHa and CaSki cells were used for the HNRNPU-AS1 interference transfection experiment.
FIG 1.
HNRNPU-AS1 regulated the proliferation and apoptosis of CC cells. (A) HNRNPU-AS1 levels within CC and matched noncarcinoma tissue samples (n = 41) measured by RT-qPCR. (B) KM analysis on OS of CC cases. (C) HNRNPU-AS1 expression in CC cell lines measured by RT-qPCR. RT-qPCR analysis on HNRNPU-AS1 expression (D and H), CCK-8 assay on cell viability (E and I), colony formation assays for cell proliferation (F and J), and flow cytometric analysis on cell apoptosis (G and K). Data are displayed in the form of means ± SD from 3 individual assays. **, P < 0.01 versus siNC and vector groups.
TABLE 1.
Association between lncRNA HNRNPU-AS1 expression and clinicopathological features in cervical cancera
| Clinical feature | No. in miR-205-5p expression group |
Chi square | P value | |
|---|---|---|---|---|
| Low | High | |||
| All cases (no.) | 20 | 21 | ||
| Age (yr) | 0.223 | 0.636 | ||
| ≥50 | 9 | 11 | ||
| <50 | 11 | 10 | ||
| Tumor size (cm) | 11.607 | 0.001 | ||
| ≥4 | 12 | 2 | ||
| <4 | 8 | 19 | ||
| FIGO stage | 0.034 | 0.853 | ||
| I | 12 | 12 | ||
| II | 8 | 9 | ||
| Lymph node metastasis | 1.953 | 0.162 | ||
| Positive | 11 | 7 | ||
| Negative | 9 | 14 | ||
| Histology | 0.034 | 0.853 | ||
| Squamous | 8 | 9 | ||
| Adenocarcinoma | 12 | 12 | ||
The median expression level of lncRNA HNRNPU-AS1 was used as the cutoff. Pearson chi-square tests were used to analyze the association between lncRNA HNRNPU-AS1 expression and clinical features. FIGO, International Federation of Gynecology and Obstetrics.
HNRNPU-AS1 regulated the proliferation and apoptosis of CC cells.
HNRNPU-AS1 interference and HNRNPU-AS1 overexpression experiments were performed for assessing HNRNPU-AS1’s role in CC cell growth and apoptosis. It was found that in C33A and HT-3 cells, HNRNPU-AS1 interference reduced HNRNPU-AS1 expression at the mRNA level (Fig. 1D); besides, it increased cell proliferation but suppressed their apoptosis (Fig. 1E to G). In contrast, in SiHa and CaSki cells, HNRNPU-AS1 showed high expression within cells transfected with the HNRNPU-AS1 overexpression plasmid (Fig. 1H) to suppress cell proliferation and promote their apoptosis (Fig. 1I to K).
HNRNPU-AS1 functioned to sponge miR-205-5p.
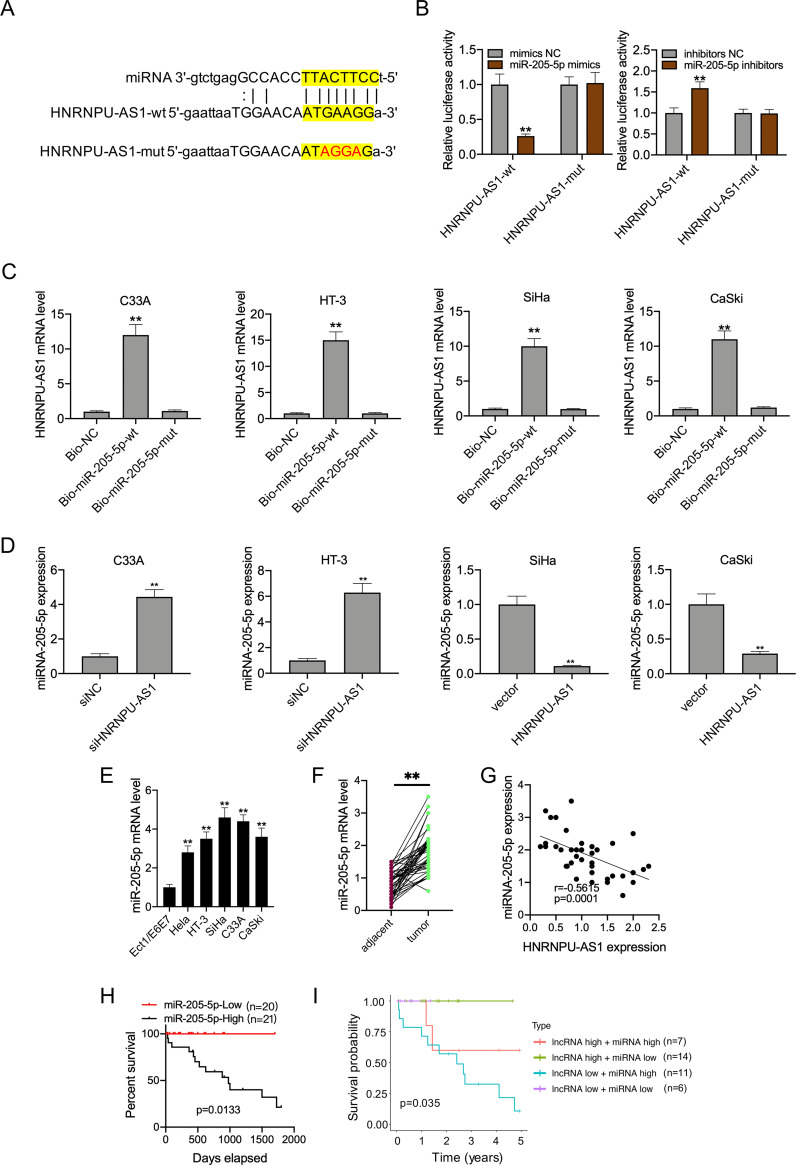
StarBase v2.0 online software (starbase.sysu.edu.cn) was adopted for bioinformatics analysis on candidate HNRNPU-AS1 miRNAs. As a result, there were complementary binding sequences in HNRNPU-AS1 to the miR-205-5p seed regions (Fig. 2A). Moreover, miR-205-5p transfection mimics markedly decreased the HNRNPU-AS1-WT luciferase activity rather than HNRNPU-AS1-MUT, while miR-205-5p inhibitor transfection dramatically increased HNRNPU-AS1-WT luciferase activity, as revealed by luciferase reporter assay (Fig. 2B). Results of RNA pulldown assay showed that HNRNPU-AS1 was dramatically highly expressed within biotinylated miR-205-5p, which indicated that HNRNPU-AS1 directly interacted with miR-205-5p (Fig. 2C). Next, it was found that HNRNPU-AS1 interference upregulated miR-205-5p levels within C33A and HT-3 cells, whereas HNRNPU-AS1 overexpression downregulated miR-205-5p levels within SiHa and CaSki cells (Fig. 2D). According to the above-described results, miR-205-5p levels within CC cells and tissues were dramatically elevated (Fig. 2E and F). It was also found that HNRNPU-AS1 showed the lowest expression within SiHa cells, whereas miR-205-5p exhibited the highest level within SiHa cells. miR-205-5p level was inversely proportional to HNRNPU-AS1 level among CC patients (Fig. 2G). In addition, KM analysis suggested that CC cases who had high miR-205-5p levels had poor OS (P = 0.0133) (Fig. 2H). Typically, the difference in prognosis was statistically significant between patients showing high miR-205-5p but low HNRNPU-AS1 expression and those exhibiting low miR-205-5p but high HNRNPU-AS1 expression (Fig. 2I). Collectively, there was direct interaction between HNRNPU-AS1 and miR-205-5p.
FIG 2.
miR-205-5p was the target of HNRNPU-AS1. (A) miR-205-5p binding sites to HNRNPU-AS1 3′-UTR. (B) Binding relation of miR-205-5p with HNRNPU-AS1 verified through dual-luciferase reporter assay. (C) The dramatic enrichment of HNRNPU-AS1 was detected in biotinylated miR-205-5p by RNA pulldown assay. (D) RT-qPCR assay on miR-205-5p expression in the HNRNPU-AS1 inhibition or overexpression group. (E) miR-205-5p levels in CC cells measured through RT-qPCR. (F) miR-205-5p levels in CC and matched noncarcinoma samples (n = 41) detected by RT-qPCR. (G) Spearman correlation analysis regarding HNRNPU-AS1 with miR-205-5p levels. (H) KM analysis on OS for CC cases. (I) KM survival analysis on OS for HNRNPU-AS1 combined with miR-205-5p in CC patients. Data are displayed in the form of means ± SD from 3 individual assays. **, P < 0.01 versus siNC and vector groups.
AXIN2 was the miR-205-5p direct target and was downregulated within CC cells and tissues.
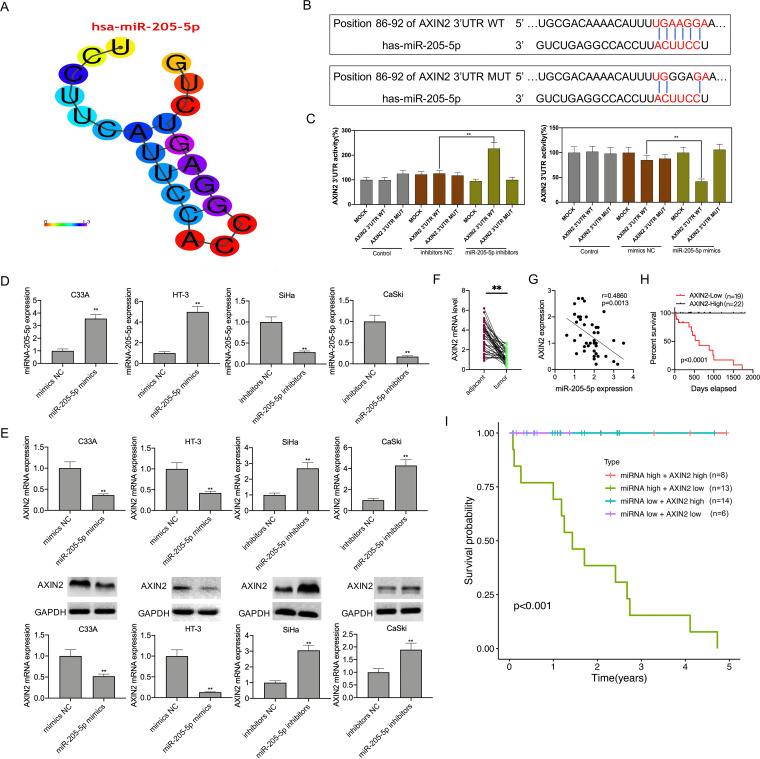
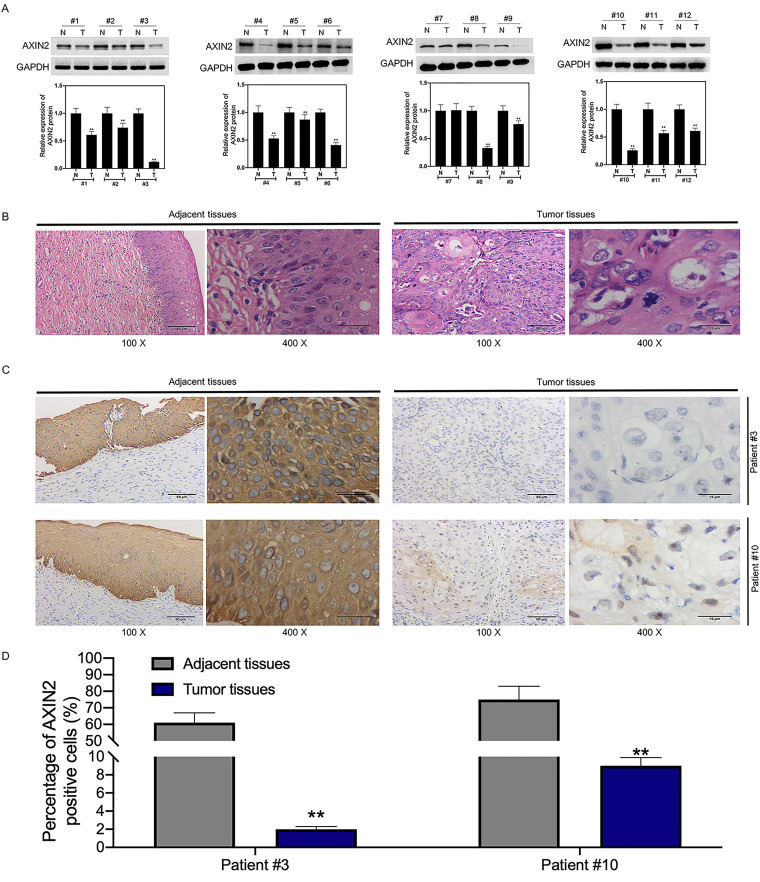
miRNA-205-5p target gene was predicted based on two databases, TargetScan and miRDB. Subsequently, the stem-loop structure of hsa-miR-205-5p was displayed in miRbase database (http://www.mirbase.org/) and visualized by the RNAcofold and RNAfold packages (https://www.tbi.univie.ac.at/RNA) (Fig. 3A). Using the TargetScan database, AXIN2 was predicted as one of the candidate target genes that contained two 3′ untranslated (3′-UTR) sequences matched with miR-205-5p (Fig. 3B). For determining whether AXIN2 was directly regulated by miRNA-205-5p, mutant (MT) or wild-type (WT) 3′-UTR in AXIN2 mRNA was coded into the corresponding plasmid, and later 293T cells were cotransfected with the plasmid and miR-205-5p inhibitors or mimics. According to Fig. 3C, luciferase activity was reduced after miR-205-5p mimic transfection, but that was enhanced upon miR-205-5p inhibitor transfection, which indicated that miR-205-5p repressed AXIN2 directly. The mutant luciferase construct did not significantly reduce luciferase activity. Moreover, miR-205-5p mimic was transfected into HT-3 and C33A cells, whereas miR-205-5p inhibitors were transfected into CaSki and SiHa cells so as to upregulate and downregulate miR-205-5p expression (Fig. 3D). As revealed by RT-qPCR and Western blotting (WB) assays, miR-205-5p mimic transfection reduced AXIN2 levels within HT-3 and C33A cells, while miR-205-5p inhibitor transfection upregulated AXIN2 levels within CaSki and SiHa cells, suggesting that miR-205-5p repressed AXIN2 expression directly (Fig. 3E). As revealed by our observation, AXIN2 levels significantly declined within CC tissues relative to matched noncarcinoma tissues (Fig. 3F). Moreover, AXIN2 level showed negative correlation with miR-205-5 level among CC patients (Fig. 3G). According to KM analysis results, CC cases showing low AXIN2 expression predicted poor OS (P < 0.0001) (Fig. 3H). Notably, patients with low AXIN2 and high miR-205-5p levels had the poorest OS, which was significantly different from those showing low miR-205-5p but high AXIN2 expression levels (Fig. 3I). This study sequentially detected AXIN2 expression in 12 CC tissue samples and 12 matched noncarcinoma cervical tissues selected randomly by WB assay. As a result, the AXIN2 level within CC tissues remarkably decreased compared with that in noncarcinoma cervical tissues (Fig. 4A). As revealed by hematoxylin and eosin (H&E) staining analysis, representative tumor characteristics were observed, including large nuclei, deep staining, and irregular cell arrangement (Fig. 4B). The images of immunohistochemistry (IHC) analysis (×100 and ×400 magnification) are shown in Fig. 4C, suggesting that in patient 3 and patient 10, the positive expression of AXIN2 within cancer samples markedly decreased relative to that in matched noncarcinoma samples (Fig. 4D).
FIG 3.
AXIN2 was the target of miR-205-5p. (A) Predicted secondary stem-loop structure of hsa-miR-205-5p based on miRbase database. (B) miR-205-5p sites binding to AXIN2 3′-UTR predicted by using TargetScan database. (C) Binding relation of miR-205-5p with AXIN2 verified through dual-luciferase reporter assay. (D) RT-qPCR assay for miR-205-5p mRNA levels in CC cell lines transfected with miR-205-5p mimics or miR-205-5p inhibitors. (E) RT-qPCR and WB assays showing the AXIN2 levels in the miR-205-5p inhibitor or mimic group. (F) AXIN2 expression in CC tissues and adjacent tissues (n = 41) measured by RT-qPCR. (G) Spearman correlation analysis regarding AXIN2 with miR-205-5p levels. (H) KM analysis on OS of CC cases. (I) KM analysis on OS of AXIN2 in combination with miR-205-5p among CC cases. Data are displayed in the form of means ± SD from 3 individual assays. **, P < 0.01 versus inhibitor NC and mimic NC groups.
FIG 4.
AXIN2 was downregulated in CC tissues and cells. (A) AXIN2 levels within CC and matched noncarcinoma tissues from CC patients (n = 12) measured by WB assay. (B and C) H&E staining (B) and immunohistochemical staining (C) of tumor and adjacent tissue sections. Pictures were taken under ×100 magnification and ×400 magnification. (D) Statistical graph showing the AXIN2-positive expression. Data are displayed in the form of means ± SD from 3 individual assays. **, P < 0.01 versus the control.
HNRNPU-AS1 positively regulated AXIN2 expression in CC cell lines.
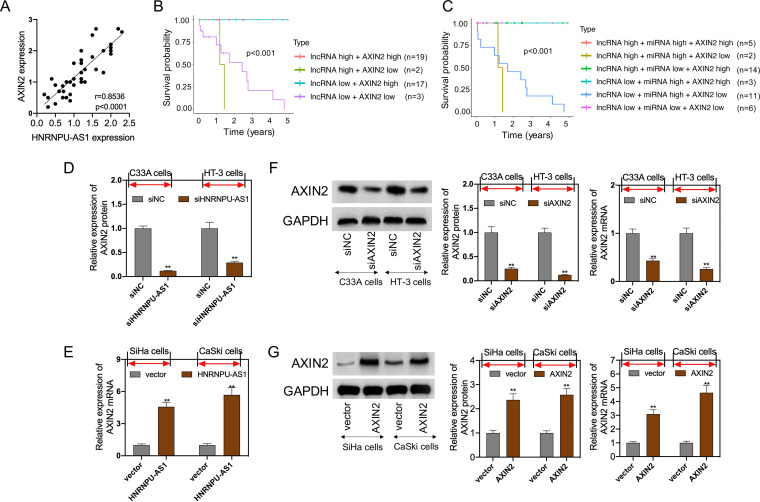
First, HNRNPU-AS1 level showed positive correlation with AXIN2 level in CC cancer (Fig. 5A). In addition, patients with low AXIN2 and HNRNPU-AS1 expression levels exhibited poor prognosis compared with those showing elevated AXIN2 and HNRNPU-AS1 expression levels (Fig. 5B). Further, KM analysis showed that cases displaying low HNRNPU-AS1, high miR-205-5p, and low AXIN2 expression had the poorest prognosis (Fig. 5B). Results of RT-qPCR assay suggested that the transfection of HNRNPU-AS1 interference into C33A and HT-3 cells suppressed AXIN2 expression, whereas the transfection of HNRNPU-AS1 expression plasmids into SiHa and CaSki cells promoted AXIN2 expression (Fig. 5D and E). Therefore, AXIN2 interference was transfected in HT-3 and C33A cells, whereas AXIN2 overexpression in CaSki and SiHa cells inhibited and increased AXIN2 expression (Fig. 5F and G).
FIG 5.
HNRNPU-AS1 positively regulated AXIN2 expression. (A) Spearman correlation analysis between AXIN2 expression and HNRNPU-AS1 expression. (B) KM analysis on the OS of AXIN2 in combination with HNRNPU-AS1 in CC patients. (C) KM survival analysis on the OS of AXIN2 combined with HNRNPU-AS1 and miR-205-5p in CC patients. (D and E) RT-qPCR and WB assays on AXIN2 levels in HNRNPU-AS1 inhibition or overexpression groups. (F and G) RT-qPCR and WB assays on AXIN2 levels in AXIN2 inhibition or overexpression group. Data are displayed in the form of means ± SD from 3 individual assays. **, P < 0.01 versus siNC or vector group.
HNRNPU-AS1 regulated Wnt/β-catenin pathway via miR-205-5p/AXIN2 axis.
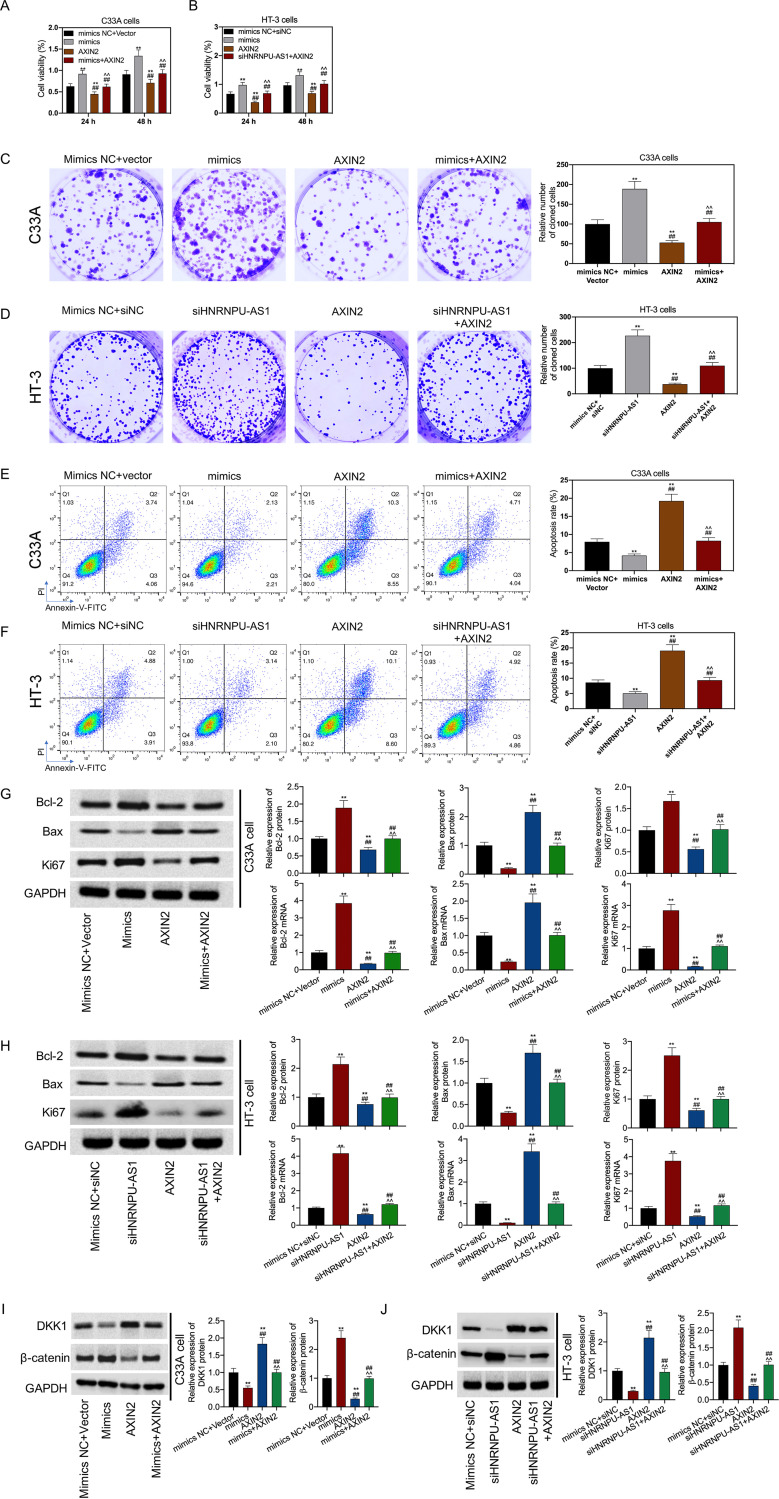
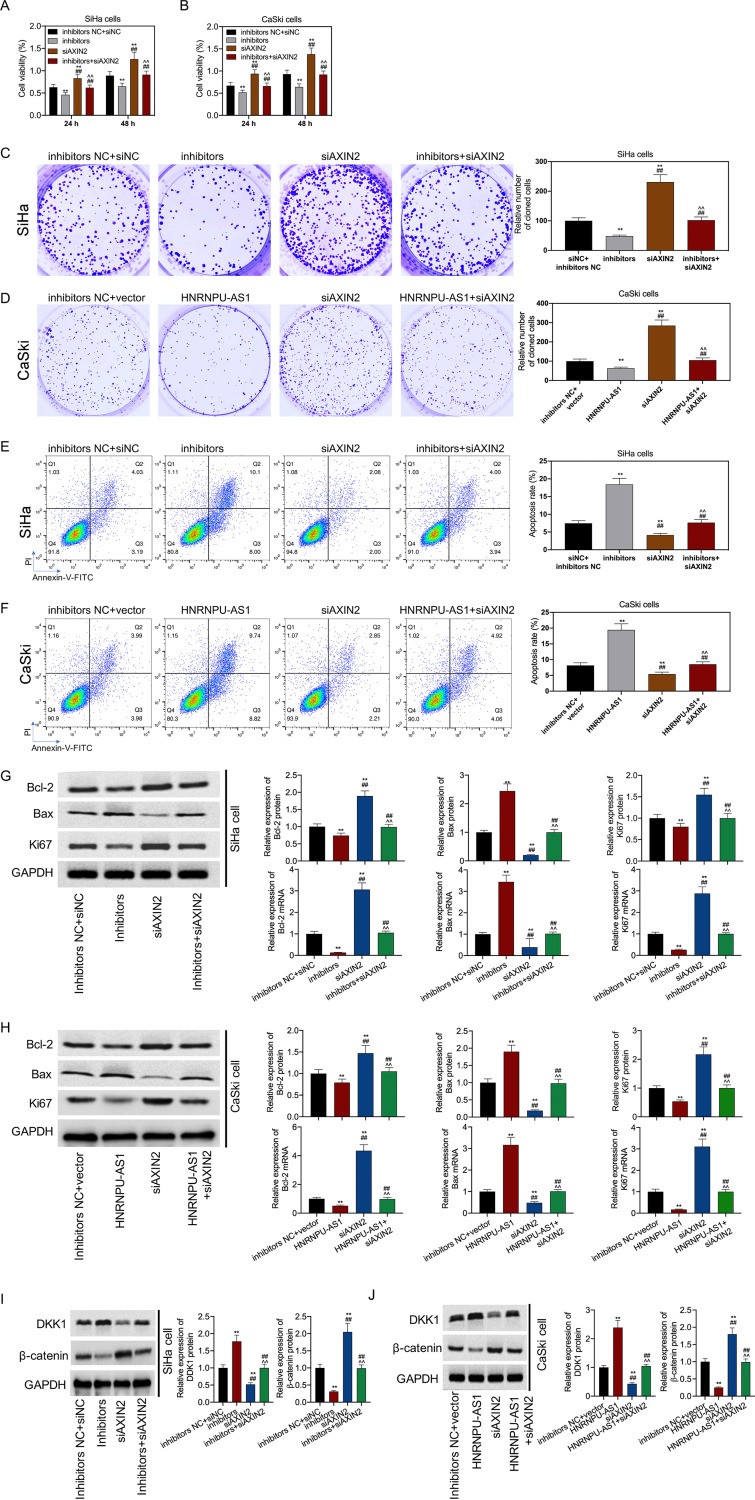
Transfection with miR-205-5p mimics promoted cell viability; however, such effect was reversed by transfection with a vector expressing AXIN2 in CC (Fig. 6A and B). The result indicated that the effect of miR-205-5p upregulation or HNRNPU-AS1 downregulation on promoting the proliferation and inhibition of the apoptosis of C33A and HT-3 cells was abolished by ANXI2 upregulation (Fig. 6C and D). These changes were closely related to the expression of Bcl-2, Bax, and Ki67. It was also found that miR-205-5p upregulation or HNRNPU-AS1 downregulation promoted Ki67 and Bcl-2 expression in HT-3 and C33A cells but suppressed Bax expression. Conversely, upregulation of ANXI2 had opposite effects. However, these functions were abolished by each other among miR-205-5p mimics, short interfering RNA (siRNA)-HNRNPU-AS1, and ANXI2 (Fig. 6G and H). Next, we verified that miR-205-5p upregulation or HNRNPU-AS1 downregulation increased β-catenin expression but inhibited DKK1 expression. The functions of miR-205-5p upregulation and HNRNPU-AS1 downregulation in activating the Wnt/β-catenin pathway were reversed by upregulation of ANXI2 (Fig. 6I and J). Further, when miR-205-5p inhibitors were cotransfected with siRNA-AXIN2, or when vector expressing HNRNPU-AS1 was cotransfected with siRNA-AXIN2, miR-205-5p inhibition or HNRNPU-AS1 overexpression effects on promoting cell apoptosis, inhibiting cell viability and proliferation, modulating Bax, Ki67 and Bcl-2 expression, and inhibiting Wnt/β-catenin pathway activation were reversed by the downregulation of ANXI2 (Fig. 7).
FIG 6.
HNRNPU-AS1 silencing promoted cell proliferation and inhibited apoptosis by promoting the Wnt/β-catenin signaling pathway via the miR-205-5p/AXIN2 axis. When siHNRNPU-AS1 or miR-205-5p mimic was cotransfected with ANXI2, CCK-8 assay was conducted for cell viability (A and B), colony formation assays for cell proliferation (C and D), flow cytometric assay for cell apoptosis (E and F), RT-qPCR and WB assay for gene levels (G and H), and WB assay for DDK1 and β-catenin expression (I and J). Data are displayed in the form of means ± SD from 3 individual assays. **, P < 0.01 versus siNC+mimic NC group; ^^, P < 0.01 versus ANXI2 group; ##, P < 0.01 versus mimic group.
FIG 7.
HNRNPU-AS1 overexpression inhibited cell proliferation and promoted apoptosis by promoting the Wnt/β-catenin signaling pathway via the miR-205-5p/AXIN2 axis. After cotransfection with miR-205-5p inhibitors or vector expressing HNRNPU-AS1 and siANXI2, CCK-8 assay was conducted for cell viability (A and B), colony formation assay for cell proliferation (C and D), flow cytometric analysis for cell apoptosis (E and F), RT-qPCR and WB assays for Bcl-2, Ki67, and Bax expression (G and H), and WB assay for β-catenin and DDK1 expression (I and J). Data were displayed in the form of means ± SD from 3 individual assays. **, P < 0.01 versus siNC+inhbitor NC group; ^^, P < 0.01 versus siANXI2 group; ##, P < 0.01 versus inhibitor group.
DISCUSSION
Cell proliferation and apoptosis are related to tumor genesis and development (19). The present work found that HNRNPU-AS1 showed low expression within human CC cells and tissues. LncRNAs modulate miRNA target degradation as their competing endogenous RNA (ceRNA) sponges, affecting modulation at the posttranscriptional level (20, 21). Therefore, it was important to screen the target miRNAs of HNRNPU-AS1 for exploring the function of HNRNPU-AS1 in CC and the underlying molecular mechanism. This study predicted miR-205-5p as the HNRNPU-AS1 target miRNA, which was upregulated in CC patients. It is also reported to promote cancer occurrence and progression through the Wnt/β-catenin pathway (12). Our results also verified that HNRNPU-AS1 activation at the transcriptional level facilitated apoptosis and inhibited proliferation, whereas knockdown of HNRNPU-AS1 exacerbated the oncogenic activity of miR-205-5p within CC cells. Therefore, lncRNA HNRNPU-AS1 might modulate CC cell growth and apoptosis through sponging miR-205-5p.
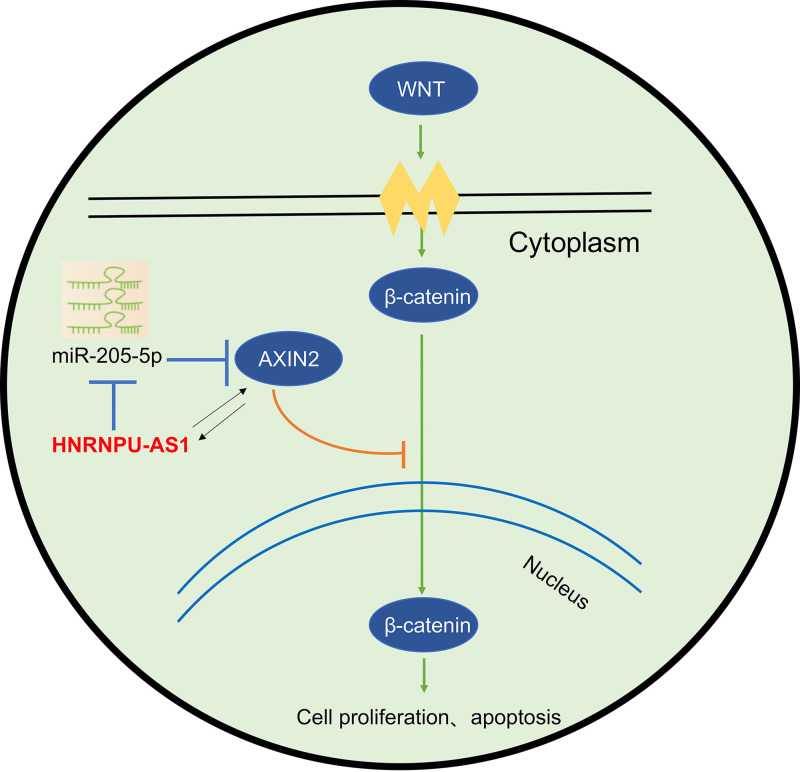
As an miR-205-5p target gene, AXIN2 belongs to the homologous protein of the AXIN family and is widely distributed in the organism (22). AXIN2 binds to other protein molecules (in the form of scaffolding proteins) to form a multifunctional domain, which exerts its corresponding biological functions and participates in a variety of signaling pathways (23). Studies have shown that the expression of ANXI2 is downregulated in cancers like colon cancer (24), lung cancer (25), and liver cancer (26), which is tightly associated with diverse cancer formation. The main biological function of ANXI2 is to negatively regulate Wnt/β-catenin pathway activation (27). According to our results, miR-205-5p mimic enhanced CC cell biological activity by targeting AXIN2. Interestingly, the results of survival analysis indicated that patients with low miRNA and low AXIN2 expression had better prognosis than those with high miRNA and low AXIN2 expression. In addition, CC patients with low AXIN2 expression have dismal prognosis, regardless of the high or low HNRNPU-AS1 or miR-205-5p level. Considering individual differences, miR-205-5p level is low while HNRNPU-AS1 is high in some CC patients, but the low expression of AXIN2 in these patients also promotes CC genesis and progression. This may be because the low expression of AXIN2 plays an oncogenic role in CC, which is regulated not only by miR-205-5p and HNRNPU-AS1 but also by other factors. The above-described research results completely prove that each miRNA or lncRNA is related to disease genesis and progression by modulating one or more targets, and the expression of each gene is also regulated by one or more miRNAs or lncRNAs. These results also further indicate that AXIN2 is regulated not only by one miRNA but also by other upstream genes. Notably, the HNRNPU-AS/miR-205-5p axis is undoubtedly one of the important mechanisms that affect its expression and role in CC. ANXI2 negatively regulates the activation of the Wnt/β-catenin signaling pathway (22). Wnt signal can transmit the signal to cells by interacting with the receptor on the cell membrane, while this then suppresses glycogen synthase kinase 3β (GSK-3β) activity and later dissociates the APC–AXIN–GSK-3β β-catenin degradation complex. In this way, β-catenin will be accumulated within the cytoplasm, and its nuclear translocation contributes to the binding to TCF/LEF transcription factors (TFs), thereby modulating downstream target gene expression (28). DKK1 and β-catenin are the markers for the Wnt/β-catenin pathway (29). Our results showed that knockdown of HNRNPU-AS1 and overexpression of miR-205-5p activated the Wnt/β-catenin signaling pathway by increasing β-catenin expression and inhibiting DDK1 expression. Overexpression of AXIN2 inhibited this pathway activation. As a result, this work illustrated the mechanism by which the HNRNPU-AS1/miR-205-5p axis regulated AXIN2 expression as well as Wnt/β-catenin pathway activation. Finally, this study revealed that HNRNPU-AS1 enhanced AXIN2 expression by inhibiting miR-205-5p, thereby regulating DDK1 and β-catenin protein expression in the downstream Wnt pathway (Fig. 8).
FIG 8.
Schematic diagram depicting the regulatory mechanism of HNRNPU-AS1 in CC. HNRNPU-AS1 decreased miR-205-5p to modulate CC cell growth and apoptosis through the ANXI2-mediated activity of the Wnt/β-catenin pathway.
In conclusion, HNRNPU-AS1 and AXIN2 were downregulated, while miR-205-5p was overexpressed in CC cells and tissues. Our study substantiated that HNRNPU-AS1 modulated AXIN2 expression to affect Wnt pathway activation by sponging miR-205-5p, thereby inhibiting cell proliferation and promoting cell apoptosis in CC. Therefore, this work illustrates the HNRNPU-AS1 regulatory mechanism and offers candidate therapeutic targets for treating CC.
MATERIALS AND METHODS
Patient tissue samples.
Cancer and matched noncarcinoma cervical samples were collected in 41 cases undergoing potentially curative surgery from 2014 to 2019 in the Affiliated Hospital of Qingdao University (Shandong, China). Clinical follow-up data were available in 44 patients. All patients aged 42 to 63 years (Table 1) signed the informed consent. There was no tumor cell in the adjacent normal tissue located 2 to 5 cm from tumor tissues. All tissue samples were diagnosed by histopathological examination and harvested before initiating chemotherapy or radiotherapy. Fresh samples were frozen into liquid nitrogen at once and preserved at −80°C before analysis. The Medical Ethics Committee of the Affiliated Hospital of Qingdao University approved our protocols. The present work was carried out by following the Helsinki Declaration.
H&E staining.
After deparaffinage and hydration, paraffin-embedded sections were subjected to H&E (Nobleryder, China) staining. Later, neutral resin was used to block the sections.
IHC.
After deparaffinage and hydration of paraffin-embedded sections, citrate buffer was used to retrieve antigen, while 3% H2O2 was utilized to block sections for 15 min under ambient temperature. Thereafter, nonspecific binding sites were blocked using Lowenthal serum for 15 min. The anti-AXIN2 primary antibody (1:600; ab109307; Abcam) was adopted to incubate slides overnight at 4°C, and then secondary antibody was applied to incubate the slides for another 20 min under ambient temperature, followed by 20 min of incubation with streptavidin-horseradish peroxidase (SA-HRP) solution. Later, hematoxylin and diaminobenzidine (DAB) (ZSGB-BIO, China) were utilized to stain slides, followed by neutral resin mounting. The light microscope (Olympus, Japan) was employed to obtain images under a magnification of ×200. Image-Pro Plus software was employed for result analysis.
Cell line culture.
Human CC cell lines (SiHa, HeLa, HT-3, Caski, and C33A) and normal cervical cell line (Ect1/E6E7) were obtained from the American Type Culture Collection (ATCC; Rockville, MD). All cell lines then were cultured in Dulbecco’s modified Eagle medium (DMEM) or RPMI 1640 medium (GE Healthcare Life Sciences, Logan, UT) that contained 10% fetal bovine serum (FBS; Invitrogen, Thermo Fisher Scientific, Inc., Waltham, MA) and 1% penicillin-streptomycin and incubated under 37°C and 5% CO2 conditions.
Cell transfection.
siRNA negative-control (siNC), siRNA-HNRNPU-AS1 (si-HNRNPU-AS1), pcDNA3.0 vector (vector), pcDNA3.0-HNRNPU-AS1 (HNRNPU-AS1), miR-205-5p inhibitor, miR-205-5p mimics, miR-negative-control mimics (mimic NC), and miR-negative-control inhibitors (inhibitor NC) were provided by Shanghai GenePharma Pharmaceutical Technology Co., Ltd. (Shanghai, China). Thereafter, we seeded CC cells in the 6-well plates pretransfection and adjusted cell density to 6 × 10⁵/well (confluence, 70%). At 12 to 16 h after culture, Lipofectamine 3000 was utilized for transfection by following specific protocols. Thereafter, we cultured CC cells in the 10% FBS-containing medium for 48 h. Finally, we collected cells and measured transfection efficiency by RT-qPCR and WB assays.
Flow cytometry.
The annexin V--fluorescein isothiocyanate (FITC) assay kit (K201-100; BioVision, USA) was utilized to measure cell apoptosis. We then harvested 2 × 10⁵ cells into the EP tubes (1.5 ml). Later, cells were centrifuged at 2,000 × g at 4°C, and supernatants were eliminated. Subsequently, cells were suspended with binding buffer (200 μl). After adding annexin V-FITC (5 μl), cells were subjected to 30 min of incubation in the dark at 4°C, and then propidium iodide (PI; 5 μl) was added for another 5 min of incubation at ambient temperature. The flow cytometer (FACSCalibur, BD Biosciences) and its CellQuest software were used to analyze the cell apoptosis rate.
WB analysis.
After washing using ice-cold phosphate-buffered saline, cells were lysed with protease inhibitor cocktail-containing lysis buffer. Thereafter, 10% SDS-PAGE was conducted to separate 60-μg proteins, and proteins were transferred onto polyvinylidene difluoride membranes. Tris-buffered saline that contained 5% skimmed milk then was used to block membranes for 1 h under ambient temperature, followed by overnight incubation using primary antibodies (anti-AXIN2, anti-Bcl-2, anti-Bax, anti-Ki67, anti-β-catenin, anti-DKK1, and anti-GAPDH; Santa Cruz, Abcam, Beyotime, or Cell Signaling) contained within blocking buffer at 4°C. After rinsing thrice within Tris-buffered saline–Tween 20 (TBST), membranes were further probed for 1 h using HRP-labeled anti-rabbit/mouse antibodies (1:3,000) at ambient temperature. The enhanced chemiluminescent detection system (Pierce Biotechnology, Inc., Rockford, IL) was employed to detect signals on X-ray films.
Dual-luciferase reporter gene assays.
The cellular cDNA was used to amplify the 3′-UTR of HNRNPU-AS1 or AXIN2, followed by cloning in pGL3 vector (wild-type [WT]-AXIN2 3′-UTR and WT- HNRNPU-AS1 3′-UTR; Promega Corporation). Thereafter, WT-AXIN2 3′-UTR was inserted with 2 site mutations for constructing the corresponding mutant (mut)-HNRNPU-AS1 3′-UTR or mut-AXIN2 3′-UTR. Afterwards, Lipofectamine 2000 was utilized to cotransfect 100 nM WT-HNRNPU-AS1 3′-UTR plasmid with WT-AXIN2 3′-UTR plasmid, 100 nM mut-HNRNPU-AS1 3′-UTR plasmid with Mut-AXIN2 3′-UTR plasmid, and 100 nM miR-205-5p mimics/inhibitors or NC into cells. Dual-Glo Luciferase assay system (Promega Corporation) was utilized for evaluating luciferase activity after 48 h of transfection, where the luciferase activity was measured relative to that of renilla.
RNA pulldown assay.
The pulldown assay was conducted through adopting a magnetic RNA protein pulldown kit (Pierce) based on specific protocols. RiboBio (China) was responsible for synthesizing the biotinylated HNRNPU-AS1 RNA. In every assay, streptavidin-agarose beads (50 μl) rinsed beforehand were incubated with biotinylated RNA (50 pmol) for 1 h at 4°C. Thereafter, lysates derived from nuclear/cytosolic extracts of CC cells were used to incubate RNA-bound beads, followed by detection of eluted proteins through WB analysis, with the 3′UTR of androgen receptor (AR) RNA containing the UC-rich HuR binding sites being the positive control (PC) and poly(A)25 RNA without the HuR binding site as the NC.
CCK-8 assay.
A CCK-8 kit was utilized to determine cell viability. After 24 h of transfection with miRNA, lncRNA, or mRNA, CC cell lines (C33A, HT-3, SiHa, and CaSki) (1 × 10³) were plated in the 96-well plates and cultured for 24 h. At 24 and 48 h, every well was supplemented with CCK-8 solution (10%; Beyotime, Shanghai, China) to incubate for another 2 h at 37°C in the dark. After removing supernatants, we detected the absorbance (optical density) value at 450 nm.
Colony formation assay.
CC cells (500/well) were inoculated in the 6-well plates to culture for another 2 weeks. After fixation, 0.4% crystal violet (Bio Basic Inc., Markham, Canada) contained within 20% ethanol was used to stain colonies for a period of 5 min. Later, photos of cell colonies were taken and the colony number was calculated.
RT-qPCR.
Total cellular and tissue RNAs were isolated by adopting TRIzol reagent (Invitrogen Thermo Fisher Scientific, Inc., Carlsbad, CA). The ABI 7300HT RT-qPCR system (Applied Biosystems-Thermo Fisher Scientific, Inc., Foster City, CA) was employed for RT-qPCR by the use of SYBR green PCR master mix for detecting lncRNA HNRNPU-AS1, AXIN2, and miR-205-5p mRNA levels. In this study, the PCR procedure was 3 min at 95°C for 3 min, 15 s of denaturation at 95°C, and 30 s of annealing/elongation at 58°C for 40 cycles. The primers are listed in Table 2. U6 or GAPDH served as the control for miRNA or mRNA expression, respectively, which was calculated by the 2−ΔΔCq approach.
TABLE 2.
Primer sequences used for quantitative RT-PCR
| cDNA | Directiona | Primer sequence |
|---|---|---|
| miR-205-5p | F | 5′-TCCTTCACAATTCCGTCTGCGG-3′ |
| R | 5′-GCAATTAATACGAACAGCGAGC-3′ | |
| HNRNPU-AS1 | F | 5′-CCGTCAGCTCATGCGC-3′ |
| R | 5′-TCATTGATGGGCTGTATGA-3′ | |
| AXIN2 | F | 5′-GATGACAGGCAAGGATGCAG-3′ |
| R | 5′-CAGTCAGGTCGTTGTATTGTTG-3′ | |
| Bcl-2 | F | 5′-ACGTGCCCTGTGTCAATGTCCCGT-3′ |
| R | 5′-CCTGCCTGTGTTCGAAGCTGCC-3′ | |
| Bax | F | 5′-TCGGTGTGCCACAAGTGCATGACCAA-3′ |
| R | 5′-TGGCTGCTCAGCGTAAATGTAAAAC-3′ | |
| Ki67 | F | 5′-ACCGCGCTGTCAAGTGTCCCGG-3′ |
| R | 5′-CAAACTGCCCTTTCTGCTCGCA-3′ | |
| U6 | F | 5′-ATTGGAACAGACGATAGAAGATT-3′ |
| R | 5′-CTTCACGAATTTGGAACGG-3′ | |
| GAPDH | F | 5′-ATCGTGGACTAAGGCTTGGTA-3′ |
| R | 5′-TTCACAGTATTTGGTGTCATG-3′ |
F, forward; R, reverse.
Statistical analysis.
SPSS20.0 (SPSS, Inc., Chicago, IL) was applied in statistical analyses. Results were presented from Western blotting (WB) in the form of means ± standard deviations (SD). Chi-square test, one-way ANOVA combined with Tukey’s post hoc test, and Student's t test were adopted for data analysis among different groups. Log-rank test and Kaplan-Meier (KM) curve analysis were conducted to assess differences and predict overall survival (OS), respectively. In this study, HNRNPU-AS1 mRNA expression of ≥1.2 (median), miR-205-5p mRNA expression of ≥1.9 (median), and AXIN2 mRNA expression of ≥1.1 (median) were considered high expression. A P value of <0.05 suggested statistical significance. All assays were conducted in triplicate.
Data availability.
The data sets generated/analyzed in the manuscript are available.
ACKNOWLEDGMENTS
This article was supported by grants from Affiliated Hospital of Qingdao University and the Project of Qingdao University (no. 2017M23).
We declare that we have no competing interests.
REFERENCES
- 1.Tsikouras P, Zervoudis S, Manav B, Tomara E, Iatrakis G, Romanidis C, Bothou A, Galazios G. 2016. Cervical cancer: screening, diagnosis and staging. J BUON 21:320–325. [PubMed] [Google Scholar]
- 2.Li FH, Xiang L, Ran L, Zhou S, Huang Z, Chen M, Yu WF. 2019. BNIP1 inhibits cell proliferation, migration and invasion, and promotes apoptosis by mTOR in cervical cancer cells. Eur Rev Med Pharmacol Sci 23:1397–1407. 10.26355/eurrev_201902_17096. [DOI] [PubMed] [Google Scholar]
- 3.Wu Z, Li J, Zhang Y, Hu L, Peng X. 2020. CFTR regulates the proliferation, migration and invasion of cervical cancer cells by inhibiting the NF-κB signalling pathway. Cancer Manag Res 12:4685–4697. 10.2147/CMAR.S252296. [DOI] [PMC free article] [PubMed] [Google Scholar]
- 4.Kopp F, Mendell JT. 2018. Functional classification and experimental dissection of long noncoding RNAs. Cell 172:393–407. 10.1016/j.cell.2018.01.011. [DOI] [PMC free article] [PubMed] [Google Scholar]
- 5.Zhang X, Yao J, Shi H, Gao B, Zhang L. 2019. LncRNA TINCR/microRNA-107/CD36 regulates cell proliferation and apoptosis in colorectal cancer via PPAR signaling pathway based on bioinformatics analysis. Biol Chem 400:663–675. 10.1515/hsz-2018-0236. [DOI] [PubMed] [Google Scholar]
- 6.Fu C, Li D, Zhang X, Liu N, Chi G, Jin X. 2018. LncRNA PVT1 facilitates tumorigenesis and progression of glioma via regulation of MiR-128-3p/GREM1 axis and BMP signaling pathway. Neurotherapeutics 15:1139–1157. 10.1007/s13311-018-0649-9. [DOI] [PMC free article] [PubMed] [Google Scholar] [Retracted]
- 7.Dolcino M, Tinazzi E, Puccetti A, Lunardi C. 2019. Long non-coding RNAs target pathogenetically relevant genes and pathways in rheumatoid arthritis. Cells 8:816. 10.3390/cells8080816. [DOI] [PMC free article] [PubMed] [Google Scholar]
- 8.Ruan ZB, Wang F, Gongben BD, Chen GC, Zhu L. 2020. Identification of circulating lncRNA expression profiles in patients with atrial fibrillation. Dis Markers 2020:1–8. 10.1155/2020/8872142. [DOI] [PMC free article] [PubMed] [Google Scholar]
- 9.Shen LS, Hu XF, Chen T, Shen GL, Cheng D. 2019. Integrated network analysis to explore the key mRNAs and lncRNAs in acute myocardial infarction. Math Biosci Eng 16:6426–6437. 10.3934/mbe.2019321. [DOI] [PubMed] [Google Scholar]
- 10.Saliminejad K, Khorram Khorshid HR, Soleymani Fard S, Ghaffari SH. 2019. An overview of microRNAs: biology, functions, therapeutics, and analysis methods. J Cell Physiol 234:5451–5465. 10.1002/jcp.27486. [DOI] [PubMed] [Google Scholar]
- 11.Ghorbanmehr N, Gharbi S, Korsching E, Tavallaei M, Einollahi B, Mowla SJ. 2019. miR-21-5p, miR-141-3p, and miR-205–5p levels in urine-promising biomarkers for the identification of prostate and bladder cancer. Prostate 79:88–95. 10.1002/pros.23714. [DOI] [PubMed] [Google Scholar]
- 12.Valenti F, Sacconi A, Ganci F, Grasso G, Strano S, Blandino G, Di Agostino S. 2019. The miR-205-5p/BRCA1/RAD17 axis promotes genomic instability in head and neck squamous cell carcinomas. Cancers 11:1347. 10.3390/cancers11091347. [DOI] [PMC free article] [PubMed] [Google Scholar]
- 13.Yao L, Shi W, Gu J. 2019. Micro-RNA 205-5p is involved in the progression of gastric cancer and targets phosphatase and tensin homolog (PTEN) in SGC-7901 human gastric cancer cells. Med Sci Monit 25:6367–6377. 10.12659/MSM.915970. [DOI] [PMC free article] [PubMed] [Google Scholar]
- 14.Ma C, Shi X, Guo W, Feng F, Wang G. 2019. miR-205-5p downregulation decreases gemcitabine sensitivity of breast cancer cells via ERp29 upregulation. Exp Ther Med 18:3525–3533. 10.3892/etm.2019.7962. [DOI] [PMC free article] [PubMed] [Google Scholar]
- 15.Lu Z, Xu Y, Yao Y, Jiang S. 2019. miR-205-5p contributes to paclitaxel resistance and progression of endometrial cancer by downregulating FOXO1. Oncol Res 10.3727/096504018X15452187888839. [DOI] [PubMed] [Google Scholar]
- 16.Zhang P, Lu X, Shi Z, Li X, Zhang Y, Zhao S, Liu H. 2019. miR-205-5p regulates epithelial-mesenchymal transition by targeting PTEN via PI3K/AKT signaling pathway in cisplatin-resistant nasopharyngeal carcinoma cells. Gene 710:103–113. 10.1016/j.gene.2019.05.058. [DOI] [PubMed] [Google Scholar]
- 17.An G, Liang S, Sheng C, Liu Y, Yao W. 2017. Upregulation of microRNA-205 suppresses vascular endothelial growth factor expression-mediated PI3K/Akt signaling transduction in human keloid fibroblasts. Exp Biol Med 242:275–285. 10.1177/1535370216669839. [DOI] [PMC free article] [PubMed] [Google Scholar] [Retracted]
- 18.Xue Y, Liu Y, Bian X, Zhang Y, Li Y, Zhang Q, Yin M. 2020. miR-205-5p inhibits psoriasis-associated proliferation and angiogenesis: Wnt/β-catenin and mitogen-activated protein kinase signaling pathway are involved. J Dermatol 47:882–892. 10.1111/1346-8138.15370. [DOI] [PubMed] [Google Scholar]
- 19.Evan GI, Vousden KH. 2001. Proliferation, cell cycle and apoptosis in cancer. Nature 411:342–348. 10.1038/35077213. [DOI] [PubMed] [Google Scholar]
- 20.Huang Y. 2018. The novel regulatory role of lncRNA-miRNA-mRNA axis in cardiovascular diseases. J Cell Mol Med 22:5768–5775. 10.1111/jcmm.13866. [DOI] [PMC free article] [PubMed] [Google Scholar]
- 21.Paraskevopoulou MD, Hatzigeorgiou AG. 2016. Analyzing miRNA-lncRNA interactions. Methods Mol Biol 1402:271–286. 10.1007/978-1-4939-3378-5_21. [DOI] [PubMed] [Google Scholar]
- 22.Singh S, Mishra A, Mohanbhai SJ, Tiwari V, Chaturvedi RK, Khurana S, Shukla S. 2018. Axin-2 knockdown promote mitochondrial biogenesis and dopaminergic neurogenesis by regulating Wnt/β-catenin signaling in rat model of Parkinson's disease. Free Radic Biol Med 129:73–87. 10.1016/j.freeradbiomed.2018.08.033. [DOI] [PubMed] [Google Scholar]
- 23.Ji L, Jiang B, Jiang X, Charlat O, Chen A, Mickanin C, Bauer A, Xu W, Yan X, Cong F. 2017. The SIAH E3 ubiquitin ligases promote Wnt/β-catenin signaling through mediating Wnt-induced Axin degradation. Genes Dev 31:904–915. 10.1101/gad.300053.117. [DOI] [PMC free article] [PubMed] [Google Scholar]
- 24.Schaal U, Grenz S, Merkel S, Rau TT, Hadjihannas MV, Kremmer E, Chudasama P, Croner RS, Behrens J, Stürzl M, Naschberger E. 2013. Expression and localization of axin 2 in colorectal carcinoma and its clinical implication. Int J Colorectal Dis 28:1469–1478. 10.1007/s00384-013-1709-6. [DOI] [PubMed] [Google Scholar]
- 25.Xu HT, Yang LH, Li QC, Liu SL, Liu D, Xie XM, Wang EH. 2011. Disabled-2 and Axin are concurrently colocalized and underexpressed in lung cancers. Hum Pathol 42:1491–1498. 10.1016/j.humpath.2011.01.004. [DOI] [PubMed] [Google Scholar]
- 26.Joseph NM, Tsokos CG, Umetsu SE, Shain AH, Kelley RK, Onodera C, Bowman S, Talevich E, Ferrell LD, Kakar S, Krings G. 2019. Genomic profiling of combined hepatocellular-cholangiocarcinoma reveals similar genetics to hepatocellular carcinoma. J Pathol 248:164–178. 10.1002/path.5243. [DOI] [PubMed] [Google Scholar]
- 27.Huang SM, Mishina YM, Liu S, Cheung A, Stegmeier F, Michaud GA, Charlat O, Wiellette E, Zhang Y, Wiessner S, Hild M, Shi X, Wilson CJ, Mickanin C, Myer V, Fazal A, Tomlinson R, Serluca F, Shao W, Cheng H, Shultz M, Rau C, Schirle M, Schlegl J, Ghidelli S, Fawell S, Lu C, Curtis D, Kirschner MW, Lengauer C, Finan PM, Tallarico JA, Bouwmeester T, Porter JA, Bauer A, Cong F. 2009. Tankyrase inhibition stabilizes axin and antagonizes Wnt signalling. Nature 461:614–620. 10.1038/nature08356. [DOI] [PubMed] [Google Scholar]
- 28.Zhan T, Rindtorff N, Boutros M. 2017. Wnt signaling in cancer. Oncogene 36:1461–1473. 10.1038/onc.2016.304. [DOI] [PMC free article] [PubMed] [Google Scholar]
- 29.Katoh M. 2018. Multi-layered prevention and treatment of chronic inflammation, organ fibrosis and cancer associated with canonical WNT/β-catenin signaling activation. Int J Mol Med 42:713–725. 10.3892/ijmm.2018.3689. [DOI] [PMC free article] [PubMed] [Google Scholar]
Associated Data
This section collects any data citations, data availability statements, or supplementary materials included in this article.
Data Availability Statement
The data sets generated/analyzed in the manuscript are available.


