

Summary
Most adolescents get less than the recommended 8–10 hours of sleep/night. Functional deficits from lack of sleep include disruption of working memory. Adult neuroimaging studies of sleep deprivation suggest diminished responses in task-related brain networks if performance degrades, but compensatory increased responses with maintained performance. This study utilized functional MRI to examine compensatory and diminished brain responses in adolescents during working memory performance, comparing chronic sleep restriction and healthy sleep duration.
Thirty-six healthy adolescents, 14–17 years old, experienced a 3-week protocol: 1) sleep phase stabilization; 2) sleep restriction (~6.5 hours nightly); and 3) healthy sleep duration (~9 hours nightly). After each sleep manipulation, we acquired functional MRI with an NBack working memory task with four difficulty levels (0 to 3-back).
NBack performance degraded with higher task difficulty, but without a detectable effect of sleep duration. ANOVA revealed main effects of both NBack difficulty and sleep in widespread brain networks. Planned contrasts showed that, compared to healthy sleep, sleep restriction resulted in greater medial prefrontal activation and weaker activation in the precuneus for the most difficult task condition.
During sleep restriction, we found compensatory functional responses in brain regions that process sensory input and vigilance. However, adolescents also showed impaired performance and diminished brain responses during the hardest task level under a week of chronic sleep restriction. Chronic SR during adolescence is common. Understanding the impact of ongoing functional compensation and performance breakdown during this developmental period can have important implications for learning and educational strategies.
Keywords: Adolescents, sleep restriction, functional MRI, working memory
Introduction
Sufficient sleep plays a significant role in maintaining adolescent health. Previous studies have shown 63% to 87% (Hansen & Vandenberg, 1997; Spilsbury et al., 2004) of teens obtain less than the 8 to 10 hours of nightly sleep recommended by the National Sleep Foundation (Hirshkowitz et al., 2015). Lack of sleep strongly influences academic performance and exacerbates problems with mood and behavior (Holm et al., 2009). Disruption of working memory may underlie key functional deficits, as working memory reflects the capacity of information that an individual can actively hold in mind and mentally manipulate while performing tasks (Alloway & Alloway, 2010; Aronen, Vuontela, Steenari, Salmi, & Carlson, 2005).
Most published research related to the influence of inadequate sleep on working memory has been done on adults and mostly under total sleep deprivation. Functional neuroimaging studies of adults have suggested the involvement of two divergent brain networks in mediating both preserved and impaired performance during sleep restriction. One network corresponds to “task-positive” regions (Fox et al., 2005; Owen, McMillan, Laird, & Bullmore, 2005; Sonuga-Barke & Castellanos, 2007), such as lateral frontal and parietal regions, that are commonly activated by tasks requiring attention to stimuli. The other network, comprised of medial prefrontal and posterior cingulate regions and the angular gyri, has a “task-negative” role (Beebe, Difrancesco, Tlustos, McNally, & Holland, 2009; Fox et al., 2005; Sonuga-Barke & Castellanos, 2007; Spreng, Mar, & Kim, 2009), deactivating in response to attentional demands. This network, otherwise known as the default mode network (DMN), underlies introspective, self-referential thought, and must be sufficiently suppressed to attend effectively to external stimuli (Anticevic et al., 2012; Bartova et al., 2015). In this context, adult studies reveal that sleep deprivation results in blunted switching from dominance of the DMN to engagement of attention and other task-positive network regions when performing attention-demanding and working memory tasks (Choo, Lee, Venkatraman, Sheu, & Chee, 2005; Czisch et al., 2012). Degraded performance after sleep deprivation is associated with reduction of task-positive responses (Chee et al., 2006). However, when performance is maintained after sleep deprivation, this is often accompanied by apparently compensatory augmentation of task-positive responses (Drummond, Gillin, & Brown, 2001; Drummond, Meloy, Yanagi, Orff, & Brown, 2005). This is particularly evident at the highest levels of task difficulty (Drummond, Brown, Salamat, & Gillin, 2004).
Compared to adult studies, few neuroimaging investigations have focused on the impact of inadequate sleep on adolescent brain function. This is important because the adolescent brain is still undergoing critical development, especially in frontal regions associated with working memory (Conklin, Luciana, Hooper, & Yarger, 2007; Luciana, Conklin, Hooper, & Yarger, 2005). As a result, adolescence – a period characterized by high exposure to inadequate sleep – may also be a period of unique neurodevelopmental vulnerability. This suggests a need to examine the functional neurological response to inadequate sleep during adolescence in particular. Adult data may offer some guidance but cannot be assumed to fully hold in adolescents. Indeed, given that adolescents very routinely experience chronically short sleep, rather than the total sleep deprivation which typifies most adult sleep deprivation studies with neuroimaging outcomes, there is a need to specifically characterize adolescent brain responses to more realistic “doses” of partial sleep restriction. To date, there has been only one published functional neuroimaging study related to working memory after partial sleep restriction in adolescence (Beebe et al., 2009). In a small sample (n=6) of adolescents, performance and brain activation during a working memory task was compared after 5 nights of 6.5 hours in bed versus 5 nights of 10 hours in bed. Participants did not suffer a loss of working memory performance as a result of sleep restriction, but both task positive and task negative regions had increased amplitude of response, in opposing directions that suggested a compensatory response. That sample was very small, however, and the working memory task was relatively easy, with mean accuracy rates exceeding 85% under either sleep condition.
In the current study, we extended this line of investigation in a larger sample to increase statistical power and by applying a working memory task including a higher level of difficulty that could induce failure in compensatory response, while maintaining a realistic severity of sleep restriction. We hypothesize that response to the working memory task will intensify with task difficulty overall. We further expected that sleep restriction will result in a particular divergence of response at the highest level of task difficulty, given its uniquely intense working memory demands.
Methods
All study methods were approved and overseen by the local Institutional Review Board and were undertaken only after verbal and written informed assent by adolescent participants and written informed consent by a parent or legal guardian.
Participants
Adolescents aged 14–16.9 years were recruited for a sleep manipulation study which was conducted over four consecutive summer seasons. The summer months were chosen to avoid potential adverse impact of sleep restriction on school performance. Participants were excluded for psychiatric disorders, suspicion of substance abuse, history of neurologic illness or injury, use of medications known to impact sleep or daytime alertness, symptoms of obstructive sleep apnea, daily consumption of >1 coffee or >3 caffeinated soft drinks, average habitual sleep duration >10 hours per night, and body mass index greater than 30.
Sleep Manipulation Protocol
The sleep protocol for this study was described in an earlier publication (DiFrancesco, Van Dyk, Altaye, Drummond, & Beebe, 2019). Each participant was asked to complete a three-week sleep protocol, in which rise times were kept consistent, but bedtimes were altered to create different sleep conditions. The protocol began with a 5-night initial sleep phase stabilization period during which bedtime was freely chosen but all participants were asked to rise at the same time every day (the time needed to awaken to make it to an 8:30 AM appointment at the hospital at which data were collected). The phase stabilization period was followed by two weeks of sleep manipulation randomly counterbalanced between a week of Sleep Restriction (SR) versus Healthy Sleep Duration (HD). The two sleep manipulation conditions were based on pilot work with a nearly identical protocol (Beebe et al., 2008) that resulted in mean sleep durations that were either clearly below consensus recommendations for healthy adolescent sleep (hence our adoption of the term Sleep Restriction) or conformed well to those recommendations (hence our use of the term Healthy Duration). The SR condition was comprised of five consecutive nights of 6.5 hours in bed achieved by a later bedtime, and the HD condition was comprised of five consecutive nights with a target of 10 hours in bed, achieved by an earlier bedtime. Each sleep condition was preceded by a 2-night “washout” with instructions identical to the phase stabilization period. Office visits occurred at 8:30 am in the morning immediately following the sleep phase stabilization and each sleep manipulation period, during which staff reviewed the prior week’s sleep, conducted outcome assessments, and provided the next condition’s sleep instructions as needed.
Adherence to the sleep regimen was verified by objective actigraphy (Motionlogger Sleep Watch; Ambulatory Monitoring, Inc., New Jersey, USA) screened for artifacts (e.g., actigraph removal), by using a nightly sleep diary and by direct conversations with a parent and the adolescent during the office visit to reconcile any discrepancies. Actigraphy, which infers sleep-wake states via movement patterns, has been well-validated against overnight polysomnography. We recorded sleep onset, offset, sleep period duration (onset to offset, ignoring nocturnal awakenings), and sleep percent (percent of epochs during the sleep period coded as sleep).
As in our prior work (DiFrancesco et al., 2019), all but 2 participants were considered adherent to the sleep regimen, defined as averaging at least 60 minutes longer sleep period (onset to offset) during the HD nights than the SR nights.
The NBack working memory task
After the 5 days of HD and SR, subjects underwent fMRI while performing an NBack task. For this task, the subject views a sequence of white letters, one at a time, on a black background. The subject is instructed to respond, via button press, to the letters according to one of four conditions: 0-, 1-, 2-, or 3-back. The 0-back, used as a control (baseline), merely required the subject to press the button when an ‘X’ appeared in the screen. In the 1-, 2-, and 3-back conditions, subjects were instructed to press the button when the letter on the screen matched what they saw one, two, or three letters earlier, respectively. After an initial 12-second period during which instructions were shown, the conditions were interwoven in 30-second blocks, with each block starting with a 3.5-second prompt for condition type (e.g. “1-back”), followed by 11 letters shown at the center of the screen in pseudorandom order for one second, interleaved with a fixation asterisk of duration 1.5 seconds. During letter presentation, a reminder of condition type was displayed at the top of the screen (e.g. “1-back”). The series of letters for each condition presentation was designed to have three “hits” requiring a button press. Conditions were ordered pseudorandomly, with each presented 4 times in the course of the task.
Measures of performance on the NBack task during fMRI included the percentage of correct responses and the inverse of the response time (RT). Percentage of correct responses is defined as (number of responses correctly identifying a target n-back stimulus)/(total number of target n-back stimuli) x 100. To analyze change across sleep (SR vs. HD) and n-back difficulty (0, 1, 2, and 3-back), each performance measure was fitted by a linear mixed effects model in Matlab (Mathworks, Natick, MA), including the fixed effects of sleep condition and NBack difficulty and random effect of subject for the intercept.
MRI Acquisition
Images were acquired on a Philips Achieva 3T MRI scanner (Philips Corporation, Eindhoven, The Netherlands). Each scan session included three fMRI tasks, including the NBack task. During NBack, functional imaging consisted of 258 gradient echo, echo planner imaging (EPI) acquisitions with the following parameters: repetition time (TR) = 2000 ms, echo time (TE) = 30 ms, field of view (FOV) = 25.6 × 25.6 cm, and matrix size = 64×64 with 33 axial slices, 4 mm thick, covering the whole brain volume. The first 6 images of the NBack series were acquired during the 12-second presentation of introductory instruction text. In addition, a 3D Magnetization Prepared Rapid Acquisition Gradient Echo (MPRAGE) sequence was acquired to obtain a T1-weighted, high spatial resolution (1 mm3 isotropic) image for anatomical reference and overlay of functional image data.
Image Processing
Imaging data from each session were preprocessed using SPM12 (Flavell et al., 1992). The first six images obtained during the introduction were discarded, ensuring T1 relaxation equilibrium. Standard preprocessing steps were applied to the imaging series, including motion correction by rigid body realignment of all functional images to the first image of the series, coregistration of the anatomic image to the mean realigned functional image, joint segmentation and normalization of the anatomic image to the MNI brain reference space (Ashburner & Friston, 2005), application of the normalization transform to the functional series, and finally, spatial smoothing with an 8 mm Gaussian kernel.
Voxel-wise first-level analysis proceeded after preprocessing of each imaging dataset. The blood oxygenation-level-dependent (BOLD) signal for each voxel was regressed against the task time course in a general linear model (GLM) with a block design that included the boxcar time courses of the individual NBack conditions as regressors of primary interest, and the time course of the prompts that preceded the blocks of NBack stimuli as a nuisance regressor, each convolved with a canonical hemodynamic response function. We used additional regressors to account for the effects of motion and poor image quality. These nuisance regressors included the 3 translational and 3 rotational realignment parameters. Individual images with excessive artifact were detected using the Artifact Detection Tool (ART) (Cofer et al., 1999), adding a regressor for each image to be scrubbed from the dataset due to differential composite motion exceeding 3 mm or image intensity deviating more than 3 standard deviations from the series mean. In addition to ART, we applied a component-based correction method (aCompCor) (Behzadi, Restom, Liau, & Liu, 2007) to account for potential non-neuronal physiological signal variation. Using principle component analysis (PCA), time courses of the first five principle components within the brain’s white matter and within the cerebrospinal fluid (CSF) were extracted as representative of physiological noise and used as regressors in the GLM. The GLM resulted, for each dataset, in a brain-wide parametric map for each NBack condition.
Contrasts between each level of NBack difficulty (1-, 2-, and 3-back) and the 0-back condition, which controlled for some attention, motor (button press) and visual activation, were taken to a second, dataset-level analysis. A within-subject ANOVA including two sleep conditions, HD and SR, and three levels of NBack difficulty (1-, 2-, and 3-back, each contrasted with 0-back) was performed to assess the main effects of sleep condition and difficulty level of the NBack task as well as their interaction. Self-reported gender, race (dichotomized for analysis as Caucasian vs. other), and measured IQ (based upon a validated intelligence screener administered during the initial office visit (AS & NL, 2004)) were included as covariates in the ANOVA design. Finally, because ANOVA does not account for potentially non-linear ordinal shifts in NBack difficulty, and to test our expectation that effects would be particularly intense at the highest levels of task difficulty, we undertook planned contrasts of activation patterns during SR vs. HD when comparing 2-back relative to 1-back, and when comparing 3-back relative to 2-back.
Family-wise error (FWE) correction was applied to all results, with a significance threshold of p < 0.05 at the cluster level. This correction accounted for voxels across the whole brain, unless a small-volume correction (SVC) was appropriate for a targeted subregion of the brain.
Results
Participants
Out of a total of 50 adolescents recruited for the fMRI study, complete data of satisfactory quality were collected on a total of 36 participants. Exclusion of data resulted from excessive artifact due to motion for five subjects, failure to complete the NBack task due to fatigue for three subjects, non-adherence to the sleep manipulation by two subjects, failure to return for the second scan by three subjects, and loss of NBack performance recording for one subject. Participants whose data were subjected to analysis had a mean (± SD) age of 15.7 ± 0.8 years and IQ of 99.1 ± 12.9. Females comprised 67% of the analyzed cohort and 53% were Caucasian. They averaged 6.47 ± 0.51 hours/night of sleep during SR and 9.04 ± 0.70 hours/night of sleep during HD, p<.00001. As intended, this was due to later sleep onset times during SR (12:34am ± 0:40) than HD (10:04pm ± 0:56), p < .0001, with similar rise times (7:01am ± 0:32 vs 7:05 am ± 0:33), p = .34. Likely reflecting increased homeostatic sleep pressure, sleep percent was a bit higher during SR (93.8 ± 5.1) than HD (90.3 ± 5.9), p < .0001, though both were well within the healthy range.
NBack Performance
The mixed effects models found a main effect of NBack difficulty level on percent correct responses, reaching significance for 2-back (p<0.00001) and 3-back (p<0.00001), and on inverse response time (1/RT), reaching significance at the 3-back level (p=0.00016). Percent correct and 1/RT declined with increased task difficulty. However, there were no significant effects of sleep state nor interaction between sleep state and task difficulty (p>0.05). These mixed effects performance outcomes are summarized in Table 1. Summary statistics for performance metrics, by task difficulty level and sleep state, are detailed in Supplementary Table 1.
Table 1.
Mixed Effects Models* for n-back Performance Measures.
| percent correct | 1/RT | |||
|---|---|---|---|---|
|
| ||||
| n-back difficulty vs. 0-back | Estimate | p-value | Estimate | p-value |
| 1-back | −4.630 | 0.106 | −0.037 | 0.517 |
| 2-back | −14.815 | <0.001 | −0.096 | 0.092 |
| 3-back | −26.620 | <0.001 | −0.217 | <0.001 |
| sleep state | ||||
|
| ||||
| SR vs. HD | −2.315 | 0.418 | −0.007 | 0.908 |
| Interaction: SR:n-back | ||||
|
| ||||
| SR:1-back | −0.694 | 0.864 | 0.007 | 0.929 |
| SR:2-back | −0.926 | 0.819 | 0.014 | 0.861 |
| SR:3-back | −3.241 | 0.423 | 0.031 | 0.696 |
Fixed effects: sleep state and n-back difficulty. Random effect: subject.
SR = sleep restricted; HD = healthy duration; 1/RT = inverse reaction time.
NBack fMRI Analysis
A composite activation map for the contrast of 2-back vs. 0-back is provided in Figure 1 as a reference for the pattern of activation and deactivation stimulated by the NBack task. The within-subjects ANOVA revealed an extensive network with a main effect of NBack difficulty level, comprised of clusters in a variety of lateral frontal gyri, the fusiform, parahippocampus, and in posterior regions including posterior cingulate, precuneus, angular gyri, and cerebellum. This network is illustrated in Figure 2, with detailed cluster characteristics listed in Table 2. This main effect pattern reflected the observed progression of activation and deactivation across individual NBack difficulty levels; a consistent task-positive fronto-parietal pattern and elements of a task-negative default-mode network (see Figure 1) that grow in intensity with task difficulty (see Supplementary Figure 1).
Figure 1:
Composite activation map for the 2-back vs. 0-back contrast. Red regions indicate where 2-back > 0-back, while blue regions indicate where 0-back > 2-back. All regions delineate voxels with p < 0.005, family-wise error corrected.
Figure 2:

Activation map of the main effect of working memory (NBack) task difficulty, with significance threshold of F=19.04, p < 0.001, family-wise error corrected.
Table 2.
ANOVA: Main effect of NBack difficulty.
| Peak MNI coordinates |
||||||
|---|---|---|---|---|---|---|
| Anatomical Regions | Hemisphere | x | y | z | p | k |
| Middle Frontal | L | −26 | 8 | 50 | <0.001 | 141 |
| Inferior Temporal Fusiform |
R R |
42 | −68 | −2 | <0.001 | 166 |
| Precuneus Angular Superior Occipital |
L,R R R |
6 | −68 | 46 | <0.001 | 230 |
| Inferior Parietal Angular Middle Occipital |
L L L |
−34 | −44 | 34 | <0.001 | 114 |
| Inferior Frontal Operculum Inferior Frontal Triangular Precentral |
L L L |
−38 | 8 | 26 | <0.001 | 92 |
| Superior Frontal Middle Frontal |
R R |
26 | 8 | 58 | <0.001 | 75 |
| Cerebellum Fusiform Parahippocampus |
L L L |
−30 | −60 | −18 | <0.001 | 72 |
| Posterior Cingulate Precuneus Calcarine Lingual |
L,R L L L |
−6 | −44 | 22 | <0.001 | 98 |
L = left, R = right, p is the cluster-level p value, family-wise error (FWE) corrected, k = number of cluster voxels.
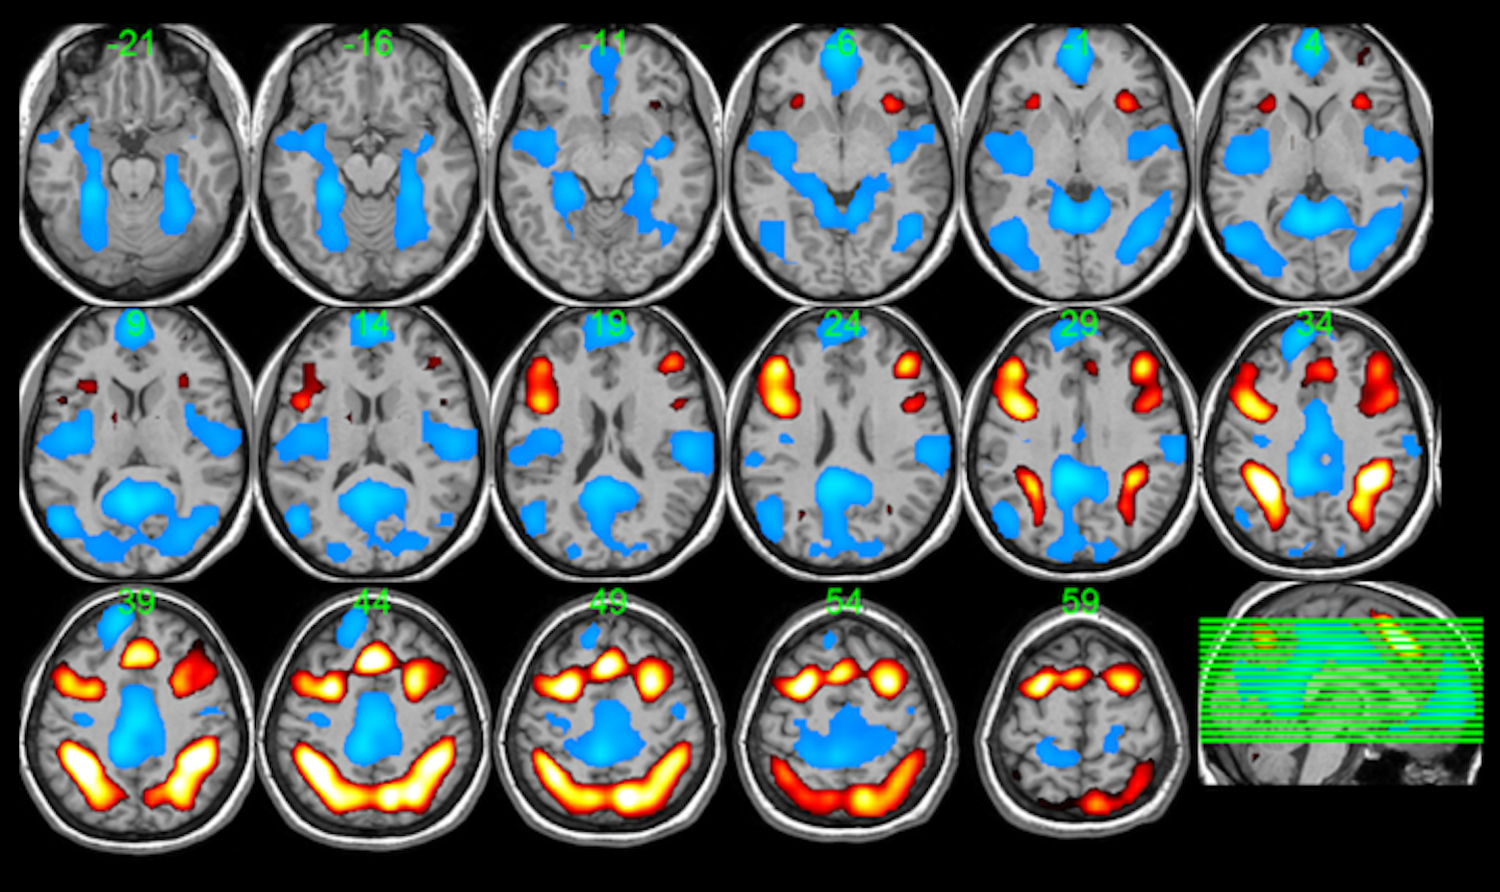
The ANOVA detected a significant main effect of experimental sleep state in several brain regions, including greater activity during SR compared to HD in clusters covering the amygdala, anterior cingulate, precentral and postcentral gyri, the superior temporal gyrus, and posterior regions such as the cuneus, precuneus, other parietal areas, and the cerebellum, and several clusters with lower activity during SR compared to HD. The voxel clusters associated with this effect are shown in Figure 3, with anatomical localization detailed in Table 3. Interpretation of the main effect of sleep state on task activations vs. deactivations is aided by the composite in Figure 1 and by individual parametric maps for the HD and SR conditions separately provided by Supplementary Figure 2.
Figure 3:

Activation map of main effect of sleep (36 subjects). Hot colors refer to voxels that are more active for the contrast sleep restricted (SR) > healthy duration (HD). Cool colors refer to voxels that are activated for the opposite contrast HD > SR. Clusters were generated with nominal voxel threshold p <0.005 (T > 2.60) uncorrected. Cluster-level p < 0.05 family-wise error corrected.
Table 3.
ANOVA: Main effect of sleep condition.
| Peak MNI coordinates |
|||||||
|---|---|---|---|---|---|---|---|
| Contrast | Anatomical Regions | Hemisphere | x | y | z | p | k |
| SR > HD | Amygdala Putamen Insula Pallidum Thalamus |
R R R R R |
30 | −4 | −10 | 0.001 | 248 |
| Superior Medial Frontal Anterior Cingulate |
L,R L |
−2 | 60 | 26 | 0.001 | 243 | |
| HD > SR | Precuneus Superior Parietal Cuneus Inferior Temporal Inferior Parietal Middle Occipital |
L,R L,R L,R L L L |
−10 | −68 | 50 | <0.001 | 740 |
| Cerebellum Lingual |
L,R L,R |
−6 | −56 | −10 | <0.001 | 344 | |
| Precentral Middle Frontal Superior Frontal Postcentral |
L L L L |
−50 | 0 | 22 | 0.016 | 149 | |
| Superior Temporal | R | 74 | −20 | 6 | 0.041 | 120 | |
SR = sleep restricted; HD = healthy duration, L = left, R = right, p is the cluster-level p value, corrected by family-wise error (FWE) , k = number of cluster voxels.
The ANOVA resulted in no significant interaction effects between task difficulty and sleep condition after appropriate cluster significance thresholding. However, planned contrasts followed up on the potential for differential effects of sleep condition as the N-back increased ordinally with task difficulty (not just nominally, as assumed by ANOVA) via a voxel-wise calculation of paired differences in activation between sleep states for the contrast of 2-back vs. 1-back and for the contrast of 3-back vs. 2-back. This approach resulted in no significant clusters for the difference between sleep conditions when contrasting 2-back and 1-back. For the contrast of 3-back vs. 2-back, however, a significant cluster reflecting the difference between sleep conditions, SR > HD, was found in a medial prefrontal region, shown in Figure 4, based on small volume correction within the significant cluster at MNI coordinates [−2, 60, 26] generated from the sleep effect in our analysis (Table 3). Changes in response, between sleep conditions, to individual difficulty levels, 1-back vs. 0-back, 2-back vs. 0-back, and 3-back vs. 0-back, were also examined. Only at the 3-back vs. 0-back level did the paired comparison result in a single significant cluster in the parietal/precuneus region for SR < HD, shown in Figure 5, after small volume correction within the sleep effect cluster at MNI coordinates [−10, −68, 50] (Table 3). We also completed corresponding paired comparisons, between sleep states, of NBack performance metrics, percent correct and 1/RT, at specific levels of task difficulty. No difference between sleep states was discerned at any difficulty level for 1/RT (p > 0.72). The percent correct metric similarly did not differ between sleep states for 1-back (p=0.19) and 2-back (p=0.28), but trended significant for SR < HD at the 3-back difficulty level (p=0.08). There were no discernible correlations between paired changes in activation and paired changes in performance metrics.
Figure 4:

Paired T-test activation map, showing a cluster for SR > HD for the contrast 3-back > 2-back, with nominal voxel threshold of T=2.3, cluster-level p = 0.04, family-wise error corrected after small volume correction (SVC) within the sleep effect cluster at [−2, 60, 26] (Table 3). Peak MNI coordinate [x,y,z] = [−2, 44, 22]. Anatomical regions included bilateral medial superior frontal cortex, anterior cingulate cortex, and medial orbitofrontal cortex. The bar plot shows the mean ± standard error of 3-back and 2-back response (beta parameters of first level analysis) for each sleep condition at the peak voxel.
Figure 5:

Paired T-test activation map, showing a cluster for HD > SR for the contrast 3-back > 0-back, with nominal voxel threshold of T=2.3, cluster-level p = 0.002, family-wise error corrected after small volume correction (SVC) within the sleep effect cluster at [−10, −68, 50] (Table 3). Peak MNI coordinate [x,y,z] = [−22, −64, 46]. Anatomical regions included left inferior and superior parietal cortex and the precuneus. The bar plot shows the mean ± standard error of 3-back and 0-back response (beta parameters of first level analysis) for each sleep condition at the peak voxel.
Discussion
This study examined the effect of a chronic sleep restriction manipulation on brain function supporting working memory in healthy adolescents. The degree of sleep restriction imposed (resulting in approximately 6.5 hours vs. 9 hours of sleep per night for 5 nights) is similar to what many US adolescents experience regularly on school nights versus non-school nights such as weekends (Hansen & Vandenberg, 1997; Matthews, Hall, & Dahl, 2014). Although the field lacks a gold-standard measure of sleep need or sleep health for individual adolescents, the HD condition resulted in mean sleep durations that conformed well to consensus recommendations for adolescent sleep (Hirshkowitz et al., 2015), whereas the SR condition was clearly below those recommendations. An NBack working memory task imposing three levels of difficulty was intended to elicit performance changes dependent on sleep condition, at least at the highest level of difficulty. A mixed effects analysis found significant degradation of performance at the two highest levels of difficulty, though performance was not found to have a main effect of sleep condition, nor a significant sleep-by-difficulty interaction effect.
A voxel-wise ANOVA of functional response mirrored, expanded, and contextualized the outcomes for task performance and the impact of SR. A main effect of NBack difficulty level was apparent throughout task-positive and task-negative networks in this study. A main effect of sleep condition was also detected, suggesting that adolescents subjected to a chronic sleep restriction manipulation have weaker activation in superior parietal and lateral prefrontal regions while having shallower deactivation in medial prefrontal cortex in the SR vs. HD conditions. At the same time, the SR condition also led to deeper deactivation in more inferior parietal areas, and an increase in thalamic activation. A significant interaction effect between sleep condition and task difficulty, however, could not be discerned from the ANOVA.
Prior studies of working memory and other cognitive domains in adults under total sleep deprivation suggest that circumstances of maintained performance often result in compensatory increases in activation in frontal and/or parietal brain regions (Drummond et al., 2004; Drummond et al., 2005; Lythe, Williams, Anderson, Libri, & Mehta, 2012). Our early work on the impact of sleep restriction on working memory in adolescents (Beebe et al., 2009), seemed to suggest such a compensatory mechanism, including a corresponding deeper deactivation in default mode regions. Some studies also show that when sleep deprivation results in performance decline, the compensatory mechanism breaks down with a reversal of activation response, i.e. diminished task-positive activation (Chee et al., 2006; Choo et al., 2005; Javaheipour et al., 2019; Lythe et al., 2012; Ma, Dinges, Basner, & Rao, 2015; Mu et al., 2005) and task-negative deactivation (Chee & Choo, 2004; Choo et al., 2005). Our fMRI analyses appear to result in a mixture of compensatory and degraded neuronal responses to sleep restriction. Referring to the composite task-related activation and deactivation patterns in Figure 1 relative to the sleep condition main effects in Figure 3, we observe compensatory enhancement of thalamic activation and deepening of deactivation of the task-negative inferior parietal regions following 5 days of SR compared to HD. Further, we observe a weakening of lateral prefrontal and superior parietal activation and medial prefrontal deactivation that suggest breakdown of compensation. The breakdown signatures of response appear to be in conflict with the lack of a sleep condition main effect in our mixed model for NBack performance metrics.
Exploration of within-subject changes between sleep conditions, specific to task difficulty level, revealed that at least part of the effect of sleep condition might be explained by the impact of SR at the most difficult NBack level. Differential responses between difficulty levels were only significant in the transition from 2-back to 3-back, for which there was less deactivation of the medial prefrontal (task negative) region for SR vs. HD. Similarly, diminished activation was discerned for SR vs. HD in the superior parietal (task-positive) region only for the 3-back vs. 0-back functional contrast. Of note, there was a trend towards degraded response accuracy at the most difficult, 3-back level under SR compared to HD. It remains plausible that even the mild sleep restriction imposed on the adolescents in this study can lead to breakdown in compensatory response if the task at hand is challenging enough.
It is also intriguing to note that the ongoing compensatory responses in the thalamus and the cuneus/precuneus regions (apparent as increased activation and deeper deactivation, respectively, for the main effect of SR vs. HD in Figure 3 and Table 3, with consideration of Supplementary Figure 2) can be interpreted as serving the conveyance of sensory input and vigilance to salient stimuli, respectively. The cuneus/precuneus deactivated by the task, part of the default mode network, may play a part in the “sentinel” role of that network (Bowman et al., 2017; Gilbert, Dumontheil, Simons, Frith, & Burgess, 2007; Raichle et al., 2001); maintaining vigilance to salient changes in ongoing stimuli, as experienced during the NBack task. If these brain mechanisms for stimulus sensitivity are indeed being maintained under SR, it might explain resilience of response time performance regardless of NBack difficulty.
Conclusions from this study are tempered by several limitations. First, while the sleep protocol maintained rise times similar to those seen in US adolescents on school days, this meant that only bedtimes could be adjusted during the sleep manipulation. As a consequence, the manipulation resulted in a modest shift in sleep timing in addition to sleep duration; future research is needed to better understand the unique effects of each, especially in relation to each individual’s internal sleep phase. Second, our use of ambulatory sleep monitors allowed for objective and unobtrusive estimation of sleep onset, offset and continuity, but did not measure other aspects of sleep, such as subjective sleep quality or sleep architecture. Third, several factors may have limited statistical power: (a) the sleep manipulation was designed to mimic ecologically valid chronic sleep restriction patterns for adolescents, but it was relatively mild; there may be more prominent behavioral or imaging effects of more severe sleep curtailment; (b) although napping was prohibited, it is impossible to fully rule out naps using actigraphy; any undetected naps might have attenuated effect sizes; and (c) the sample size was modest. Finally, our use of a classic “boxcar” fMRI design for stimulus presentation, chosen for analytic parsimony, may have inadvertently dampened the effect of inadequate sleep by causing each task to be broken into relatively brief “blocks”. On a behavioral level, inadequate sleep often has the greatest impact on sustained performance across prolonged tasks, possibly because shorter tasks allow for re-orientation and refocused attention.
Despite these limitations, this study found that common levels of sleep restriction can impact how otherwise healthy adolescents’ brains respond to even brief working memory demands. During sleep restriction, we found compensatory functional responses in brain regions subserving the processing of sensory input and vigilance, which may have preserved speed of processing across brief trials. However, we found that adolescents undergoing mild sleep restriction begin to experience a breakdown in working-memory performance and associated neuronal response on difficult tasks, even if they are relatively brief. Given the pervasiveness of chronic sleep restriction during adolescence, it will be important to understand the potential costs of prolonged attempts at functional compensation, as well as the impact of breakdowns in performance.
Supplementary Material
Acknowledgements
Supported by National Institutes of Health, R01 HL092149, UL1-TR000077.
Footnotes
Conflict of interest: The authors declare that there is no conflict of interest.
References
- Alloway TP, & Alloway RG (2010). Investigating the predictive roles of working memory and IQ in academic attainment. Journal of Experimental Child Psychology, 106(1), 20–29. 10.1016/j.jecp.2009.11.003 [DOI] [PubMed] [Google Scholar]
- Anticevic A, Cole MW, Murray JD, Corlett PR, Wang XJ, & Krystal JH (2012). The role of default network deactivation in cognition and disease. Trends Cogn Sci, 16(12), 584–592. 10.1016/j.tics.2012.10.008 [DOI] [PMC free article] [PubMed] [Google Scholar]
- Aronen ET, Vuontela V, Steenari MR, Salmi J, & Carlson S (2005). Working memory, psychiatric symptoms, and academic performance at school. Neurobiology of Learning and Memory, 83(1), 33–42. 10.1016/j.nlm.2004.06.010 [DOI] [PubMed] [Google Scholar]
- AS K, & NL K (2004). Kaufman Assessment Battery for Children, Second edition. Circle Pine, MN: AGS Publishing. [Google Scholar]
- Ashburner J, & Friston KJ (2005). Unified segmentation. Neuroimage, 26(3), 839–851. 10.1016/j.neuroimage.2005.02.018 [DOI] [PubMed] [Google Scholar]
- Bartova L, Meyer BM, Diers K, Rabl U, Scharinger C, Popovic A, … Pezawas L (2015). Reduced default mode network suppression during a working memory task in remitted major depression. J Psychiatr Res, 64, 9–18. 10.1016/j.jpsychires.2015.02.025 [DOI] [PMC free article] [PubMed] [Google Scholar]
- Beebe DW, Difrancesco MW, Tlustos SJ, McNally KA, & Holland SK (2009). Preliminary fMRI findings in experimentally sleep-restricted adolescents engaged in a working memory task. Behav Brain Funct, 5, 9. 10.1186/1744-9081-5-9 [DOI] [PMC free article] [PubMed] [Google Scholar]
- Beebe DW, Fallone G, Godiwala N, Flanigan M, Martin D, Schaffner L, & Amin R (2008). Feasibility and behavioral effects of an at-home multi-night sleep restriction protocol for adolescents. J Child Psychol Psychiatry, 49(9), 915–923. 10.1111/j.1469-7610.2008.01885.x [DOI] [PubMed] [Google Scholar]
- Behzadi Y, Restom K, Liau J, & Liu TT (2007). A component based noise correction method (CompCor) for BOLD and perfusion based fMRI. Neuroimage, 37(1), 90–101. 10.1016/j.neuroimage.2007.04.042 [DOI] [PMC free article] [PubMed] [Google Scholar]
- Bowman AD, Griffis JC, Visscher KM, Dobbins AC, Gawne TJ, DiFrancesco MW, & Szaflarski JP (2017). Relationship Between Alpha Rhythm and the Default Mode Network: An EEG-fMRI Study. J Clin Neurophysiol. 10.1097/WNP.0000000000000411 [DOI] [PMC free article] [PubMed]
- Chee MW, & Choo WC (2004). Functional imaging of working memory after 24 hr of total sleep deprivation. J Neurosci, 24(19), 4560–4567. Retrieved from http://www.ncbi.nlm.nih.gov/entrez/query.fcgi?cmd=Retrieve&db=PubMed&dopt=Citation&list_uids=15140927 [DOI] [PMC free article] [PubMed] [Google Scholar]
- Chee MW, Chuah LY, Venkatraman V, Chan WY, Philip P, & Dinges DF (2006). Functional imaging of working memory following normal sleep and after 24 and 35 h of sleep deprivation: Correlations of fronto-parietal activation with performance. Neuroimage, 31(1), 419–428. Retrieved from http://www.ncbi.nlm.nih.gov/entrez/query.fcgi?cmd=Retrieve&db=PubMed&dopt=Citation&list_uids=16427321 [DOI] [PubMed] [Google Scholar]
- Choo WC, Lee WW, Venkatraman V, Sheu FS, & Chee MW (2005). Dissociation of cortical regions modulated by both working memory load and sleep deprivation and by sleep deprivation alone. Neuroimage, 25(2), 579–587. Retrieved from http://www.ncbi.nlm.nih.gov/entrez/query.fcgi?cmd=Retrieve&db=PubMed&dopt=Citation&list_uids=15784437 [DOI] [PubMed] [Google Scholar]
- Cofer LF, Grice JW, Sethre-Hofstad L, Radi CJ, Zimmerman LK, Palmer-Seal D, & Santa-Maria G (1999). Developmental perspectives on morningness-eveningness and social interactions. Human Development, 42, 169–198. [Google Scholar]
- Conklin HM, Luciana M, Hooper CJ, & Yarger RS (2007). Working memory performance in typically developing children and adolescents: behavioral evidence of protracted frontal lobe development. Dev Neuropsychol, 31(1), 103–128. 10.1080/87565640709336889 [DOI] [PubMed] [Google Scholar]
- Czisch M, Wehrle R, Harsay HA, Wetter TC, Holsboer F, Samann PG, & Drummond SP (2012). On the Need of Objective Vigilance Monitoring: Effects of Sleep Loss on Target Detection and Task-Negative Activity Using Combined EEG/fMRI. Front Neurol, 3, 67. 10.3389/fneur.2012.00067 [DOI] [PMC free article] [PubMed] [Google Scholar]
- DiFrancesco MW, Van Dyk T, Altaye M, Drummond SPA, & Beebe DW (2019). Network-based Responses to the Psychomotor Vigilance Task during Lapses in Adolescents after Short and Extended Sleep. Sci Rep, 9(1), 13913. 10.1038/s41598-019-50180-6 [DOI] [PMC free article] [PubMed] [Google Scholar]
- Drummond SP, Brown GG, Salamat JS, & Gillin JC (2004). Increasing task difficulty facilitates the cerebral compensatory response to total sleep deprivation. Sleep, 27(3), 445–451. Retrieved from http://www.ncbi.nlm.nih.gov/entrez/query.fcgi?cmd=Retrieve&db=PubMed&dopt=Citation&list_uids=15164897 [PubMed] [Google Scholar]
- Drummond SP, Gillin JC, & Brown GG (2001). Increased cerebral response during a divided attention task following sleep deprivation. J Sleep Res, 10(2), 85–92. Retrieved from http://www.ncbi.nlm.nih.gov/entrez/query.fcgi?cmd=Retrieve&db=PubMed&dopt=Citation&list_uids=11422722 [DOI] [PubMed] [Google Scholar]
- Drummond SP, Meloy MJ, Yanagi MA, Orff HJ, & Brown GG (2005). Compensatory recruitment after sleep deprivation and the relationship with performance. Psychiatry Res, 140(3), 211–223. Retrieved from http://www.ncbi.nlm.nih.gov/entrez/query.fcgi?cmd=Retrieve&db=PubMed&dopt=Citation&list_uids=16263248 [DOI] [PubMed] [Google Scholar]
- Flavell H, Marshall R, Thornton AT, Clements PL, Antic R, & EcEvoy RD (1992). Hypoxia episodes during sleep in high tetraplegia. Archives of Physical Medicine and Rehabilitation, 73, 623–627. [PubMed] [Google Scholar]
- Fox MD, Snyder AZ, Vincent JL, Corbetta M, Van Essen DC, & Raichle ME (2005). The human brain is intrinsically organized into dynamic, anticorrelated functional networks. Proceedings of the National Academy of Sciences, 102(27), 9673–9678. [DOI] [PMC free article] [PubMed] [Google Scholar]
- Gilbert SJ, Dumontheil I, Simons JS, Frith CD, & Burgess PW (2007). Comment on “Wandering minds: the default network and stimulus-independent thought”. Science, 317(5834), 43; author reply 43. 10.1126/science.1140801 [DOI] [PubMed] [Google Scholar]
- Guilleminault C, Winkle R, Korobkin R, & Simmons B (1982). Children and nocturnal snoring: Evaluation of the effects of sleep related respiratory resistive load and daytime functioning. European Journal of Pediatrics, 139, 165–171. [DOI] [PubMed] [Google Scholar]
- Hansen DE, & Vandenberg B (1997). Neuropsychological features and differential diagnosis of sleep apnea syndrome in children. Journal of Clinical Child Psychology, 26, 304–310. [DOI] [PubMed] [Google Scholar]
- Hirshkowitz M, Whiton K, Albert SM, Alessi C, Bruni O, DonCarlos L, … Adams Hillard PJ (2015). National Sleep Foundation’s sleep time duration recommendations: methodology and results summary. Sleep Health, 1(1), 40–43. 10.1016/j.sleh.2014.12.010 [DOI] [PubMed] [Google Scholar]
- Holm SM, Forbes EE, Ryan ND, Phillips ML, Tarr JA, & Dahl RE (2009). Reward-related brain function and sleep in pre/early pubertal and mid/late pubertal adolescents. Journal of Adolescent Health, 45(4), 326–334. [DOI] [PMC free article] [PubMed] [Google Scholar]
- Javaheipour N, Shahdipour N, Noori K, Zarei M, Camilleri JA, Laird AR, … Tahmasian M (2019). Functional brain alterations in acute sleep deprivation: An activation likelihood estimation meta-analysis. Sleep Med Rev, 46, 64–73. 10.1016/j.smrv.2019.03.008 [DOI] [PMC free article] [PubMed] [Google Scholar]
- Luciana M, Conklin HM, Hooper CJ, & Yarger RS (2005). The development of nonverbal working memory and executive control processes in adolescents. Child Dev, 76(3), 697–712. 10.1111/j.1467-8624.2005.00872.x [DOI] [PubMed] [Google Scholar]
- Lythe KE, Williams SC, Anderson C, Libri V, & Mehta MA (2012). Frontal and parietal activity after sleep deprivation is dependent on task difficulty and can be predicted by the fMRI response after normal sleep. Behav Brain Res, 233(1), 62–70. 10.1016/j.bbr.2012.04.050 [DOI] [PubMed] [Google Scholar]
- Ma N, Dinges DF, Basner M, & Rao H (2015). How acute total sleep loss affects the attending brain: a meta-analysis of neuroimaging studies. Sleep, 38(2), 233–240. 10.5665/sleep.4404 [DOI] [PMC free article] [PubMed] [Google Scholar]
- Matthews KA, Hall M, & Dahl RE (2014). Sleep in healthy black and white adolescents. Pediatrics, 133(5), e1189–1196. 10.1542/peds.2013-2399 [DOI] [PMC free article] [PubMed] [Google Scholar]
- Mu Q, Nahas Z, Johnson KA, Yamanaka K, Mishory A, Koola J, … George MS (2005). Decreased Cortical Response to Verbal Working Memory Following Sleep Deprivation. Sleep, 28(1), 55–67. 10.1093/sleep/28.1.55 [DOI] [PubMed] [Google Scholar]
- Owen AM, McMillan KM, Laird AR, & Bullmore E (2005). N-back working memory paradigm: A meta-analysis of normative functional neuroimaging studies. Human brain mapping, 25(1), 46–59. [DOI] [PMC free article] [PubMed] [Google Scholar]
- Raichle ME, MacLeod AM, Snyder AZ, Powers WJ, Gusnard DA, & Shulman GL (2001). A default mode of brain function. Proc Natl Acad Sci U S A, 98(2), 676–682. Retrieved from http://www.ncbi.nlm.nih.gov/entrez/query.fcgi?cmd=Retrieve&db=PubMed&dopt=Citation&list_uids=11209064 [DOI] [PMC free article] [PubMed] [Google Scholar]
- Sonuga-Barke EJ, & Castellanos FX (2007). Spontaneous attentional fluctuations in impaired states and pathological conditions: a neurobiological hypothesis. Neuroscience & Biobehavioral Reviews, 31(7), 977–986. [DOI] [PubMed] [Google Scholar]
- Spilsbury JC, Storfer-Isser A, Drotar D, Rosen CL, Kirchner LH, Benham H, & Redline S (2004). Sleep behavior in an urban US sample of school-aged children. Arch Pediatr Adolesc Med, 158(10), 988–994. 10.1001/archpedi.158.10.988 [DOI] [PubMed] [Google Scholar]
- Spreng RN, Mar RA, & Kim AS (2009). The common neural basis of autobiographical memory, prospection, navigation, theory of mind, and the default mode: a quantitative meta-analysis. Journal of cognitive neuroscience, 21(3), 489–510. [DOI] [PubMed] [Google Scholar]
Associated Data
This section collects any data citations, data availability statements, or supplementary materials included in this article.