
Figure 3. Dynamics of the ATPase domain of ALC1.
(A) Left: consensus map from 3D refinement in RELION of 43,698 particles, displayed at a contour level of 0.015 and in disc view. Regions of the map assigned to an interaction with the nucleosome acidic patch and to the macro domain are labeled. Right: UMAP visualization of the latent variable distribution of these same 43,698 particle images after training of an 8-dimensional latent variable model with cryoDRGN. Dots indicate all latent space coordinates that are part of the calculated graph traversal, labeled red dots indicate coordinates of maps shown in panels (B) – (G). Black lines are a visual guide and do not represent actual connectivity of the graph traversal. (B – G) Maps sampled at representative steps along the graph traversal shown in (A). All maps are displayed at a contour level of 0.025 and in gyres view.

Figure 3—figure supplement 1. UMAP visualizations of the latent variable distributions from three replicate training runs of cryoDRGN with independent initializations, and with the indicated image size, pixel size, network architecture, and dimensionality of the latent variable.

Figure 3—figure supplement 2. Atomic model of auto-inhibited ALC1 (PDB 7EPU) rigid-body fitted into one of the maps from cryoDRGN with an open conformation of the ATPase motor.
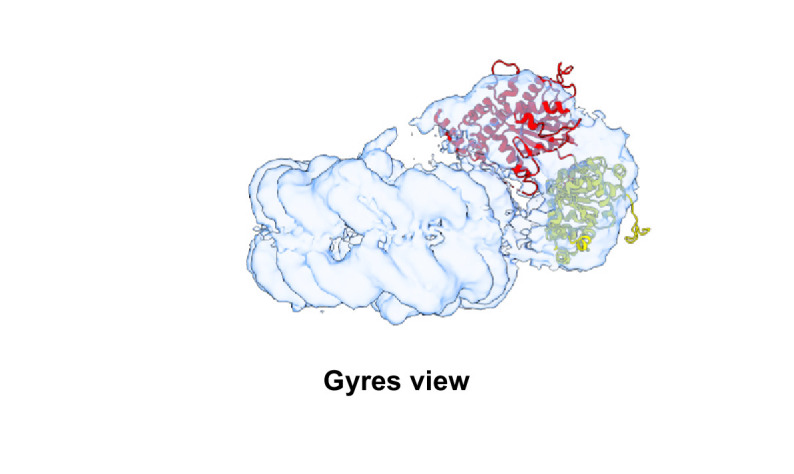
Figure 3—figure supplement 3. Distribution of Z values from a one-dimensional latent variable training run of cryoDRGN.
