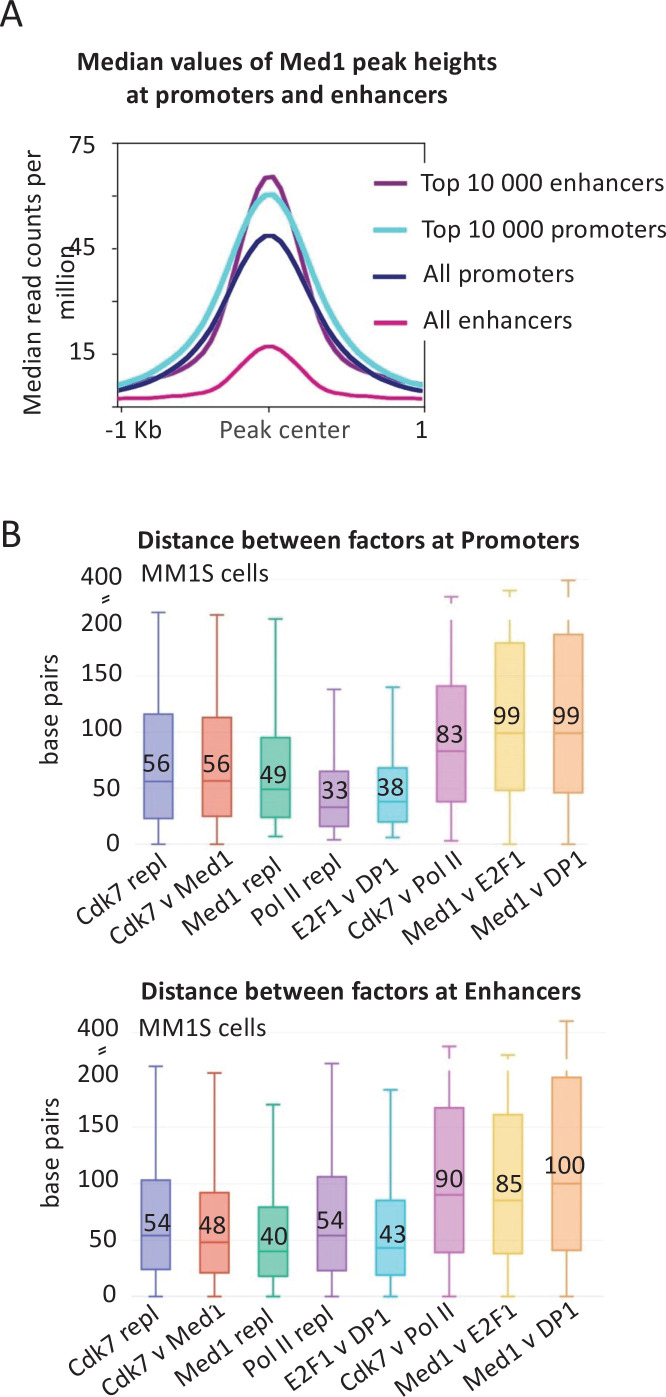
Figure 2. Mediator association and distance between factors at promoters and enhancers.
(A) Medan occupancy values at and surrounding the preinitiation complex (PIC) peak center defined by general transcription factor (GTF occupancy) of the top 10,000 promoters and enhancers as well as all promoters and enhancers in MM1S cells. All enhancers include the ~60,000 genomic regions where any Mediator signal is detected, including the top 10,000. It does not include the ~100,000 enhancers where no Mediator signal is detected. (B) Absolute values of the distances in base pairs betwen the indicated factors (or replicates) at top 10,000 promoters and enhancers (Loven et al., 2013) in MM1S cells. The boxplot indicates the median value (also written as a number), as well as the 25th and 75th percentiles, represented as the edges of the box.

