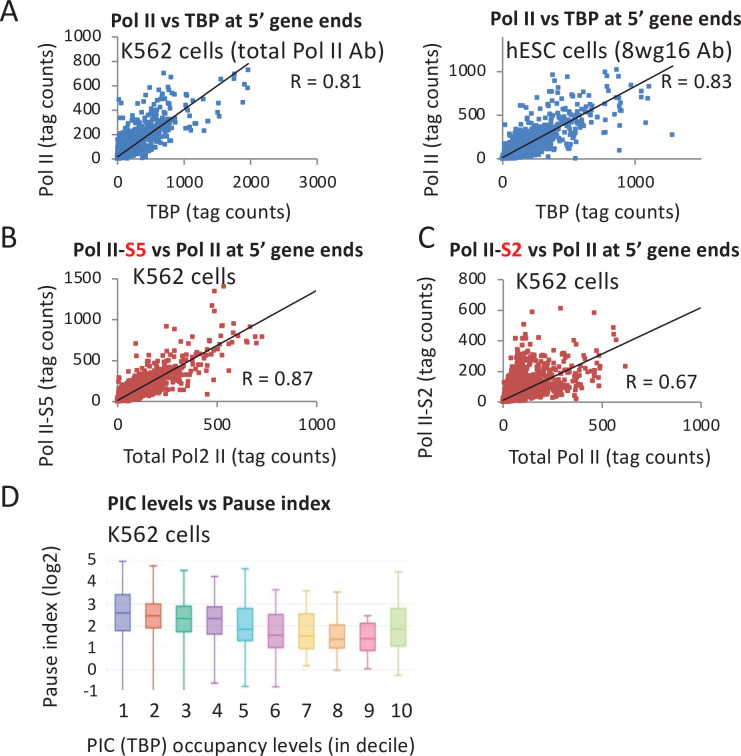
Figure 5. Relationship of TATA-binding protein (TBP) occupancy with various forms of Pol II.
(A) Relative occupancy levels of TBP and total Pol II in the vicinity of individual promoters (10,000 most active by TBP occupancy) in the indicated human cell lines. (B) Relative occupancy levels of total Pol II and the form of Pol II phosphorylated at serine 5 in the C-terminal domain in the vicinity of individual promoters in K562 cells. (C) Relative occupancy levels of total Pol II and the form of Pol II phosphorylated at serine 2 in the C-terminal domain in the vicinity of individual promoters in K562 cells. (D) Relationship between TBP occupancy levels subdivided into deciles, in which high values indicate high occupancy with the Pol II pausing index (ratio of Pol II in the promoter-proximal peak relative to the coding region).


