. 2021 Sep 13;10:e67964. doi: 10.7554/eLife.67964

Figure 7. Location and relative occupancy of Taf7, Taf1, and TATA-binding protein (TBP).

(A, B) Relative occupancy levels of TBP and Taf7 at individual mRNA and non-coding RNA promoters in Schizosaccharomyces pombe. Genes with relatively high Taf7:TBP ratios (red dots) are indicated along with enriched gene categories. (C) Relative Taf7:TBP and Taf1:TBP occupancy ratios at 10,000 most active promoters (by TBP occupancy) in the indicated human cell lines. Genes with relatively high Taf7:Taf1 ratios (red dots) are indicated along with enriched gene categories. (D) Relative occupancy levels of Taf7 and Taf1 at the 300 most expressed (by TBP occupancy) non-coding RNA promoters in the indicated cell lines. (E) Mean occupancies of the TBP, Taf1, Taf7, and Pol II with respect to the transcription start site (TSS) at promoters in the K562 cells with Taf7 at downstream locations. (F) Mean occupancies of the TBP, Taf1, Taf7, and Pol II with respect to the TSS at promoters in the K562 cells with Taf7 at the TSS. The genes in each category for E and F are presented in Supplementary file 2.

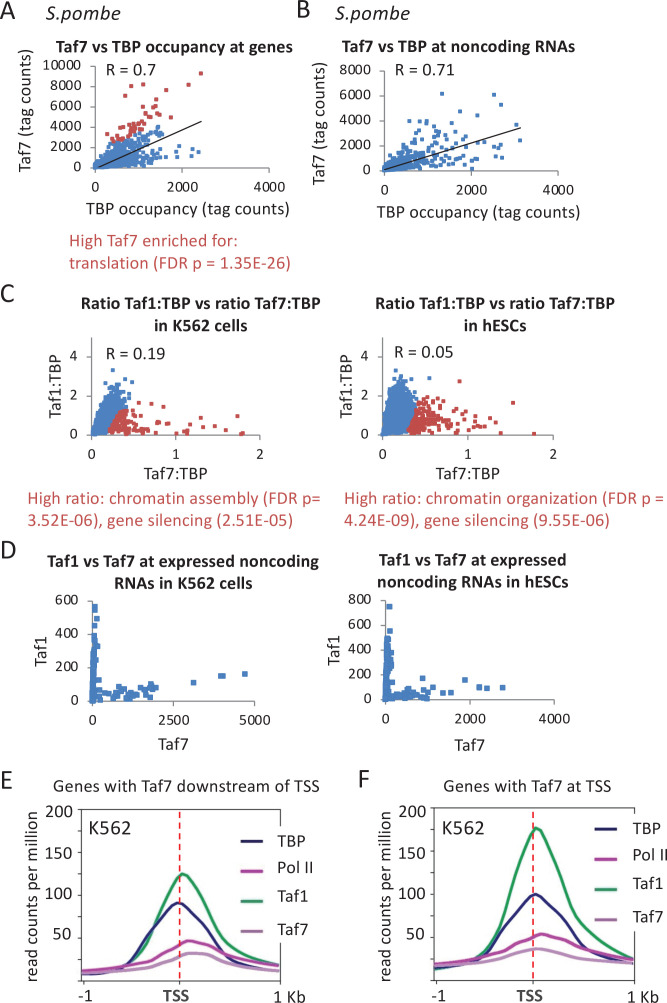
Figure 7.

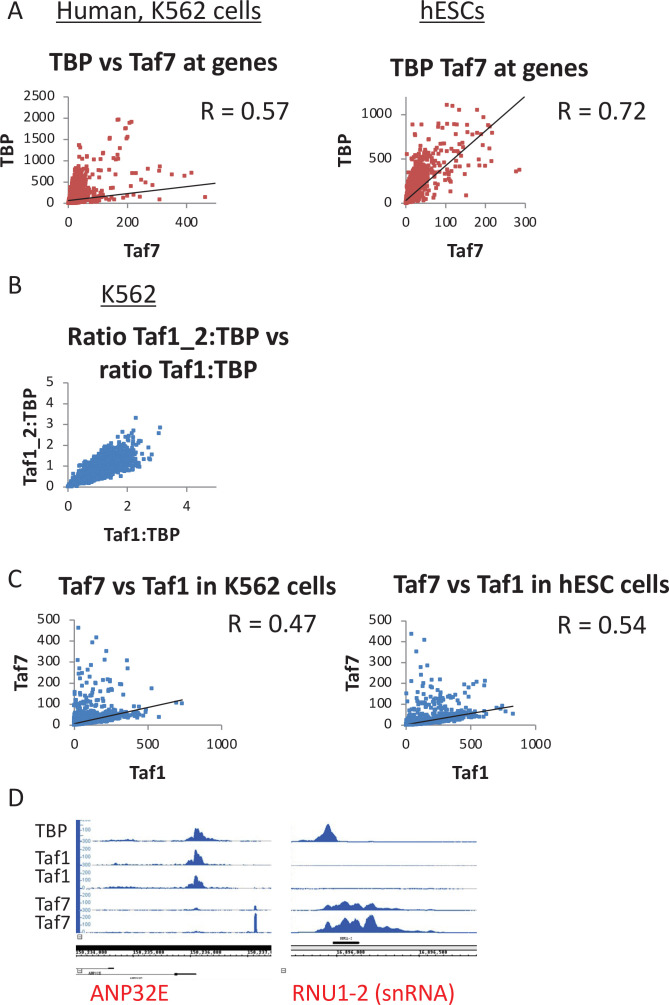
Figure 7—figure supplement 1. Relative occupancy of Taf7, Taf1, and TATA-binding protein (TBP) in human cells.

Figure 7—figure supplement 1.

(A) Relative occupancy levels of TBP and Taf7 at the 10,000 most active mRNA promoters in the indicated cell lines. (B) Comparison of Taf1 and TBP occupancy ratios at individual promoters in biological replicates, to complement Figure 6C. (C) Relative occupancy levels of Taf7 and Taf1 at the 10,000 most active mRNA promoters in the indicated cell lines. (D) Screenshot of TBP, Taf1, and Taf7 occupancy levels at two non-coding RNA promoters.
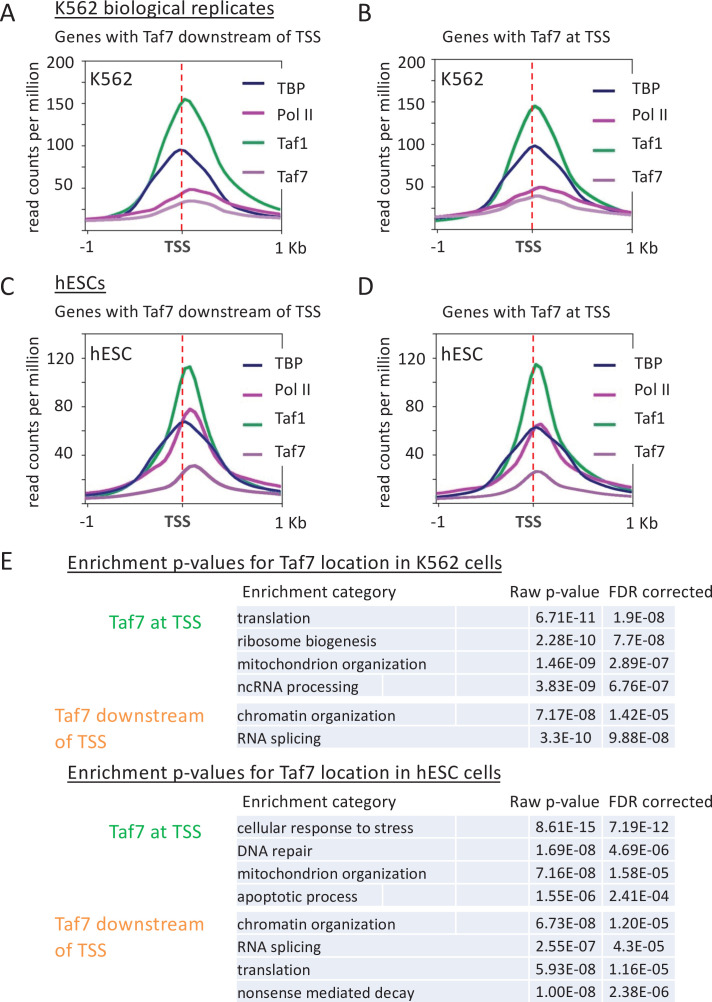
Figure 7—figure supplement 2. Comparison of mRNA promoters in which Taf7 is located downstream or at the transcription start site (TSS) in K562 (A, B) and human embryonic stem cell (hESC) (C, D) lines.

Figure 7—figure supplement 2.

(A, B) are biological replicates to the datasets in Figure 6E and F. Mean Pol II occupancies of Pol II, TATA-binding protein (TBP), Taf1, and Taf7 at promoters in which Taf7 is located near (A, C) or downstream (B, D) of the TSS. (E) Enriched gene categories for promoters with Taf7 located near or downstream of the TSS with raw and FDR-corrected p-values.
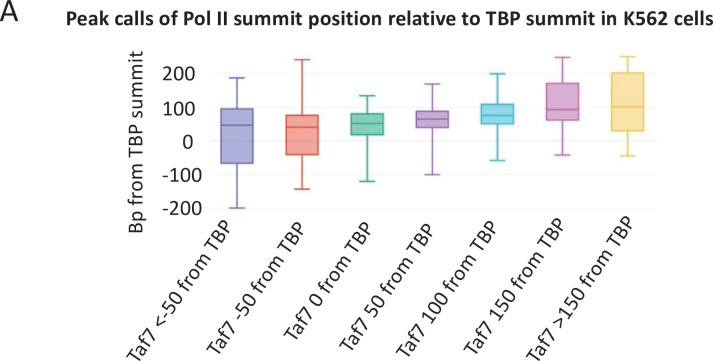
Figure 7—figure supplement 3. Relationship of Taf7 location with Pol II location and occupancy.

Figure 7—figure supplement 3.

Distance (in bp) between the TATA-binding protein (TBP) and Pol II-binding summit, obtained using MACS, in promoters having the indicated distance between Taf7 and TBP in K562 cells.