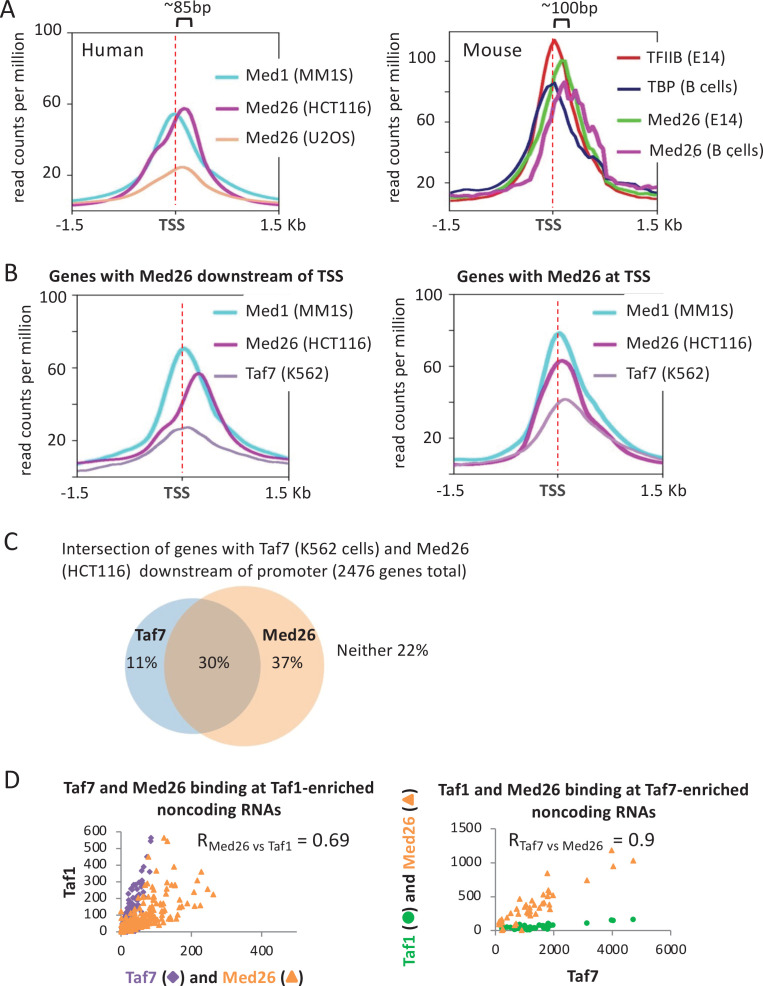
Figure 8. Relationship between Taf7 and Med26 occupancy in the vicinity of promoters.
(A) Mean occupancies of the indicated proteins in the indicated mouse and human cell lines at the 10,000 most active mRNA promoters (by TATA-binding protein [TBP] occupancy). (B) Mean occupancies of Med1, Med26, and Taf7 in the indicated mouse and human cell lines for mRNA genes where Med26 is located downstream or at the transcription start site (TSS). (C) Venn diagram showing the intersection of promoters with Taf7 (K562 cells) and/or Med26 (HCT116 cells) at downstream locations. (D) Relative occupancies of Taf7 and Med26, versus Taf1 levels, at Taf1-enriched non-coding RNAs and relative occupancies of Taf1 and Med26 binding, versus Taf7 levels, at Taf7-enriched non-coding RNAs.


