

Abstract
Phosphorylation is arguably the most important post-translational modification that occurs within proteins. Phosphorylation is used as a signal to control numerous physiological activities ranging from gene expression to metabolism. Identifying phosphorylation sites within proteins was historically a challenge as it required either radioisotope labeling or the use of phospho-specific antibodies. The advent of mass spectrometry (MS) has had a major impact on the ability to qualitatively and quantitatively characterize phosphorylated proteins. In this article, we describe MS methods for characterizing phosphorylation sites within individual proteins as well as entire proteome samples. The utility of these methods is illustrated in examples that show the information that can be gained using these MS techniques.
Keywords: Phosphorylation, mass spectrometry, peptide mapping, tandem mass spectrometry (MS2), phosphoproteomics, immobilized metal affinity chromatography (IMAC), metal oxide affinity chromatography (MOAC)
1. INTRODUCTION
While biological functions are most closely related to the primary structures of proteins, post-translational modifications (PTMs) serve to increase functional diversity. This increase in functional diversity can range from as subtle as changing a protein’s location within a cell to enabling or disabling its activity [1–3]. The human genome is estimated to contain between 19,900–21,400 protein-coding genes, and there is direct evidence for almost 17,700 translated protein products of these genes [4, 5]. Some estimates put the number of unique proteins in the human proteome above 1,000,000, owing to PTMs of these protein products [6]. Some of these modifications are particularly rare and are observed only in a specific class of proteins (e.g., sulfimine bonds in collagen [7]), while others are highly prevalent (e.g., phosphorylation, glycosylation, methylation, acetylation, etc.) and observed in a variety of different types of proteins. About fifteen years ago, the number of known PTMs was estimated to be about 200 [8]; however, today, this number is estimated to exceed 300 [9]. This number has increased rapidly over the past several years due to the development of discovery-driven technologies such as mass spectrometry (MS).
The curated database PhosphoSitePlus® lists over 479,000 different PTMs identified across the human proteome. Of these, just over 290,000 are phosphorylation of serine (Ser), threonine (Thr), and tyrosine (Tyr) residues [10]. There are currently over 500 genes that encode kinases, which are proteins that catalyze the phosphorylation of a protein, lipid, carbohydrate, or small molecule. Interestingly, there is a much smaller number of genes that encode phosphatases, yet they play an equally important role in reversing kinase signaling events. The importance in characterizing these proteins, along with their substrates, is highlighted by the greater than 180 kinases that are implicated in various diseases, especially cancer [11]. So far, over 60 kinase inhibitors have been approved for clinical use [12], and more than 150 are in clinical trials [13].
Historically, identification of phosphorylated proteins has been performed by radiolabeling the target protein using 32P inorganic phosphate (32Pi) in vivo or [γ32P]-ATP in vitro [14, 15]. After the proteins are radiolabeled, they are fractionated using one- or two-dimensional polyacrylamide gel electrophoresis (1D or 2D-PAGE) or high-performance liquid chromatography (HPLC). The radiolabeled proteins are detected via autoradiography or scintillation counting. Unfortunately, this method does not directly reveal the exact residue that is modified, a very important detail when deciphering intimate aspects of a protein’s mechanism of action. To determine the modified amino acid (i.e., Ser, Thr, or Tyr), the protein is hydrolyzed and the phosphoamino acid content determined. To identify the exact site(s) of phosphorylation, the protein is digested into peptides that are fractionated using, for example, HPLC. Edman degradation is then used to sequence the radiolabeled peptides to determine the phosphorylated residue(s) [16]. Not only are these methods laborious, but they do not provide quantitative information. For quantitative studies 32P-labeled samples were fractionated via SDS-PAGE and the relative intensity of each phosphorylated spot was compared using autoradiography. The protein spots were then identified using Edman sequencing or MS. As with qualitative methods, this technique was laborious and hampered by the safety issues surrounding the use of radioactive isotopes. While dedicating less expensive scientific equipment (i.e., pippettemen, gel running apparatus, etc.) to radiolabeling experiments is feasible, setting aside an entire mass spectrometer is inefficient and impractical. While it would be possible to identify the phosphoproteins from a third gel fractionating non-radiolabeled proteins, this method has its own issues related to gel-to-gel reproducibility and the presence of co-fractionating proteins.
In contrast, stable isotope labeling has played a key role in global quantitative proteomics. However, its impact on labeling phosphorylation sites has been limited either to in vitro kinase reactions or chemical labeling techniques [17, 18]. Recently, the ability to label phosphorylated residues with [γ-18O4]ATP in vivo has been demonstrated; however, ATPase-driven exchange of the heavy isotope oxygen atoms was also observed [19].
As an alternative to radioactive analysis, immunoaffinity approaches have been employed either in an immunoblotting or protein array format [20, 21]. The challenge with affinity-based methods is that they do not directly identify the modified residue unless a site-specific antibody is available. Knowing the exact site of phosphorylation is critical since phosphorylation events at different sites within the same protein can greatly affect the protein’s activity. For example, cardiac myosin binding protein-C (cMyBP-C) is a key regulator of myocardial contractility via its phosphorylation by protein kinases A (PKA), Cε (PKCε) and ribosomal S6 kinase II (RSK2) [22]. Each of these kinases has unique specificity for cMyBP-C; however, these sites are not independent of each other. Indeed, it has been shown that cMyBP-C is positively or negatively regulated via communication between the various phosphorylation sites within the protein [22]. PKA phosphorylation of three conserved serine residues within the amino terminus of cMyBP-C antagonizes phosphorylation by PKCε, and vice versa, while PKA phosphorylation promotes RSK2 phosphorylation of cMyBP-C. A series of amino-terminal domains in various phosphorylation states were shown to differentially interact with cardiac thin filaments and the S2 domain of cardiac myosin. This study demonstrates that combinations of phosphorylated residues affect the interactions between proteins, signifying the importance of understanding the phosphorylation state at each specific location.
2. MASS SPECTROMETRY FOR IDENTIFICATION OF PHOSPHORYLATED PROTEINS
Historically, Western blotting via antibody detection has generally been considered to be the “gold-standard” for identifying phosphorylated proteins. Over the past several years, MS has replaced Western blotting as the method of choice for characterizing phosphorylated proteins primarily owing to its specificity. Depending on the MS technique used, the data can either simply show that a protein is phosphorylated or directly identify the residue(s) that is phosphorylated. There are two general techniques used to identify phosphorylated residues: i) phosphopeptide mapping and ii) molecular dissociation. While each technique has its own specific goal and instrument setup, most mass spectrometers can perform both types of experiments.
2.1. Phosphopeptide Mapping
While top-down techniques in which the intact protein is analyzed using MS have made tremendous strides [23], most phosphorylated residues are still identified by first enzymatically digesting the protein into peptides [24]. Digestion of the protein into peptides is utilized regardless of whether the study requires phosphopeptide mapping or molecular dissociation.
Protease selection is an important consideration when performing phosphopeptide mapping. Peptides with mass-to-charge (m/z) ratios in the range of 500–1,500 are optimally detected using MS. Since most peptides are measured either as singly or doubly charged species (i.e., z = 1 or 2), the ideal size of peptides range between 500 and 3,000 Da (approximately 5–27 amino acid residues). The most commonly used protease is trypsin, which digests proteins into peptides with either a lysine (Lys) or arginine (Arg) residue at the C-terminus. Another popular protease is endoproteinase Lys-C, which results in peptides terminating with Lys residues [25]. The prevalence of Lys and Arg residues in most organisms’ proteome means that enzymes cleaving at these residues produce peptides of optimal size for MS analysis. The presence of a Lys or Arg at the C-terminus of the peptide also provides another potential site of positive charge that can enhance the detection of the peptide and results in larger peptides having an m/z ratio that is also optimal for MS detection [26]. In cases where a highly basic protein is being studied (e.g., histones, etc.), a protease with different specificity (e.g., endoproteinase Glu-C) or a limited proteolysis strategy can be employed.
The peptides are analyzed using a mass spectrometer operating in MS mode, in which the instrument simply records the m/z ratios of the various peptides [27]. The result of the analysis is a list of peptide m/z values (Fig. 1). To identify a phosphorylated peptide, this list is compared to a list of expected m/z values from an in silico digestion of the protein based on the cleavage rules of the protease used in the study. Signals arising from phosphorylated peptides are identified since the average mass is 79.9799 Da higher (79.9663 Da if measuring monoisotopic mass) than the calculated mass of the unmodified peptide. Since the experimental masses of the peptides are critical to identifying the phosphopeptide, mass spectrometers that provide high mass accuracy, such as time-of-flight (TOF) and Orbitrap MS, will provide the most definitive results.
Fig. (1).
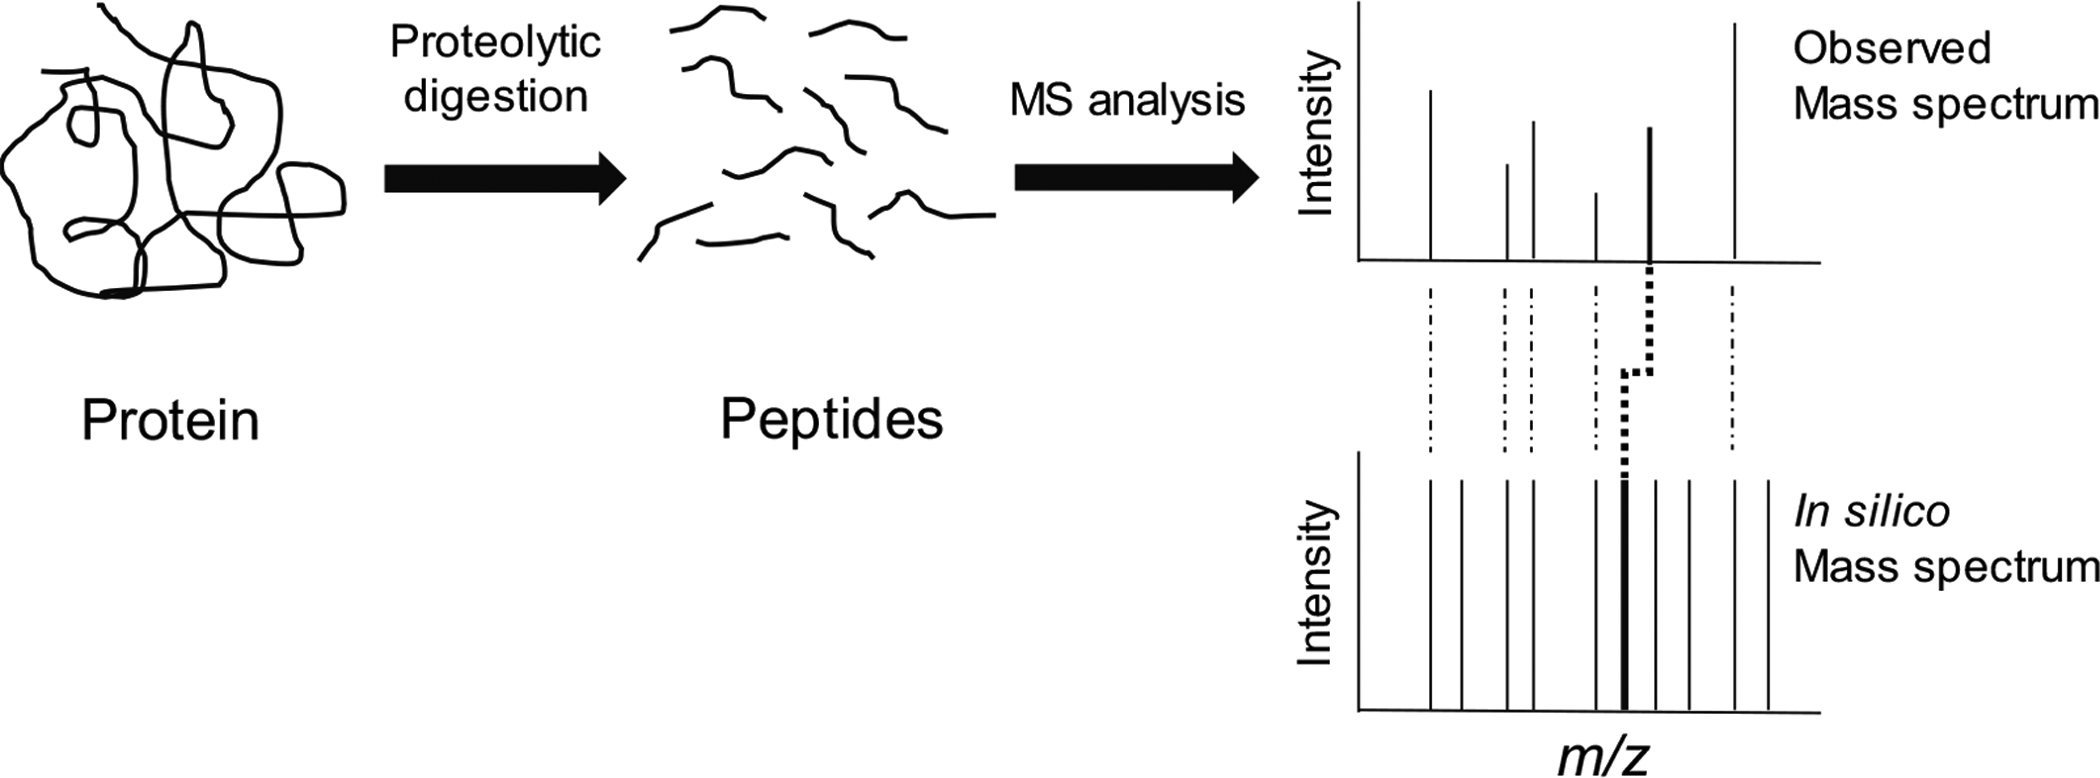
Identification of phosphorylated peptides using peptide mapping. In a peptide mapping experiment, a protein is proteolytically digested into peptides. The mass-to-charge (m/z) ratios of the peptides are recorded using mass spectrometry (MS). The observed m/z ratios are compared to those that arise from an in silico digest of proteins within a database with the same protease used to conduct the physical experiment. The protein is identified through the correlation between m/z ratios of unmodified peptides and their in silico ratios. Phosphorylated peptides are identified by virtue of their experimental m/z ratios being 80 (for singly charged peptide ions) higher than their predicted in silico ratios. Peptide mapping is most effective for identifying phosphorylated proteins in simple mixtures containing only a few (i.e., <5–10) proteins.
One of the most significant limitations of phosphopeptide mapping is the required purity of the sample. Since experimental peptide masses are being compared to in silico generated lists, the phosphopeptide is more readily identified if most of the recorded peptide masses are from a single protein [28]. This requirement means the protein of interest should be purified to a relatively high degree. Fortunately, simple methods, such as SDS-PAGE, often provide sufficient purity for phosphopeptide mapping experiments.
2.2. Molecular Dissociation
Molecular dissociation methods in the form of collision-induced dissociation (CID), electron transfer dissociation (ETD), electron capture dissociation (ECD), etc., are often collectively referred to as mass spectrometry/mass spectrometry (aka tandem MS, MS/MS or MS2) and represent the most common methods used for identifying phosphorylation sites within proteins [29]. While the techniques used for CID, ECD, and ETD differ, their basic strategies are similar. They all aim to break the molecule into small fragments that can be used to determine the original structure of the molecule. For example, in the process of CID the peptide collides with an inert gas (e.g., N2(g)) that causes the peptide to fragment into small pieces. A major site of fragmentation is across the peptide bond, allowing the sequence of the peptide to be reconstructed from the masses observed in the resulting mass spectrum.
While phosphotyrosyl (pTyr) residues are relatively stable during CID, the phosphoester bonds of phosphoseryl (pSer) and phosphothreonyl (pThr) residues are labile. A commonly observed fragment in a CID spectrum of a pSeror pThr-phosphopeptide is an intense peak representing the intact peptide minus an H3PO4 group. Loss of the phosphate group during CID often results in ineffective fragmentation of the phosphopeptide. In the case of most phosphopeptides, however, a population of phosphorylated residues retains their phosphate group throughout the entire process. Retention of the phosphate group causes a shift of approximately 80 Da in the recorded masses of the peptide fragments. By examining the differences between the masses of the major signals in the MS2 spectrum, the exact site of phosphorylation can be determined. For example, the MS2 spectrum of a phosphopeptide is compared to its non-phosphorylated version in (Fig. 2). In the MS2 spectrum of the phosphorylated peptide, an intense peak at approximately m/z 875 is observed, representing the peptide minus an H3PO4 group. This signal provides evidence that the peptide is phosphorylated. The next important step is to determine where the peptide is modified. A comparison of the two spectra moving from left to right shows the excellent correspondence between the position of major ions. This correlation is particularly evident in ions y4-y11. Past this point, however, the correlation breaks down. The difference between the y11 and y12 ions in the phosphorylated peptide is 181.1, while that for the non-phosphorylated version is only 101.1. The typical mass of a pThr residue observed by CID is 181.1 Da, while an unmodified Thr residue gives a mass of 101.1 Da. Therefore, the MS2 spectrum not only indicates the peptide is phosphorylated but also is able to pinpoint the location of the phosphorylation site to the Thr residue.
Fig. (2).
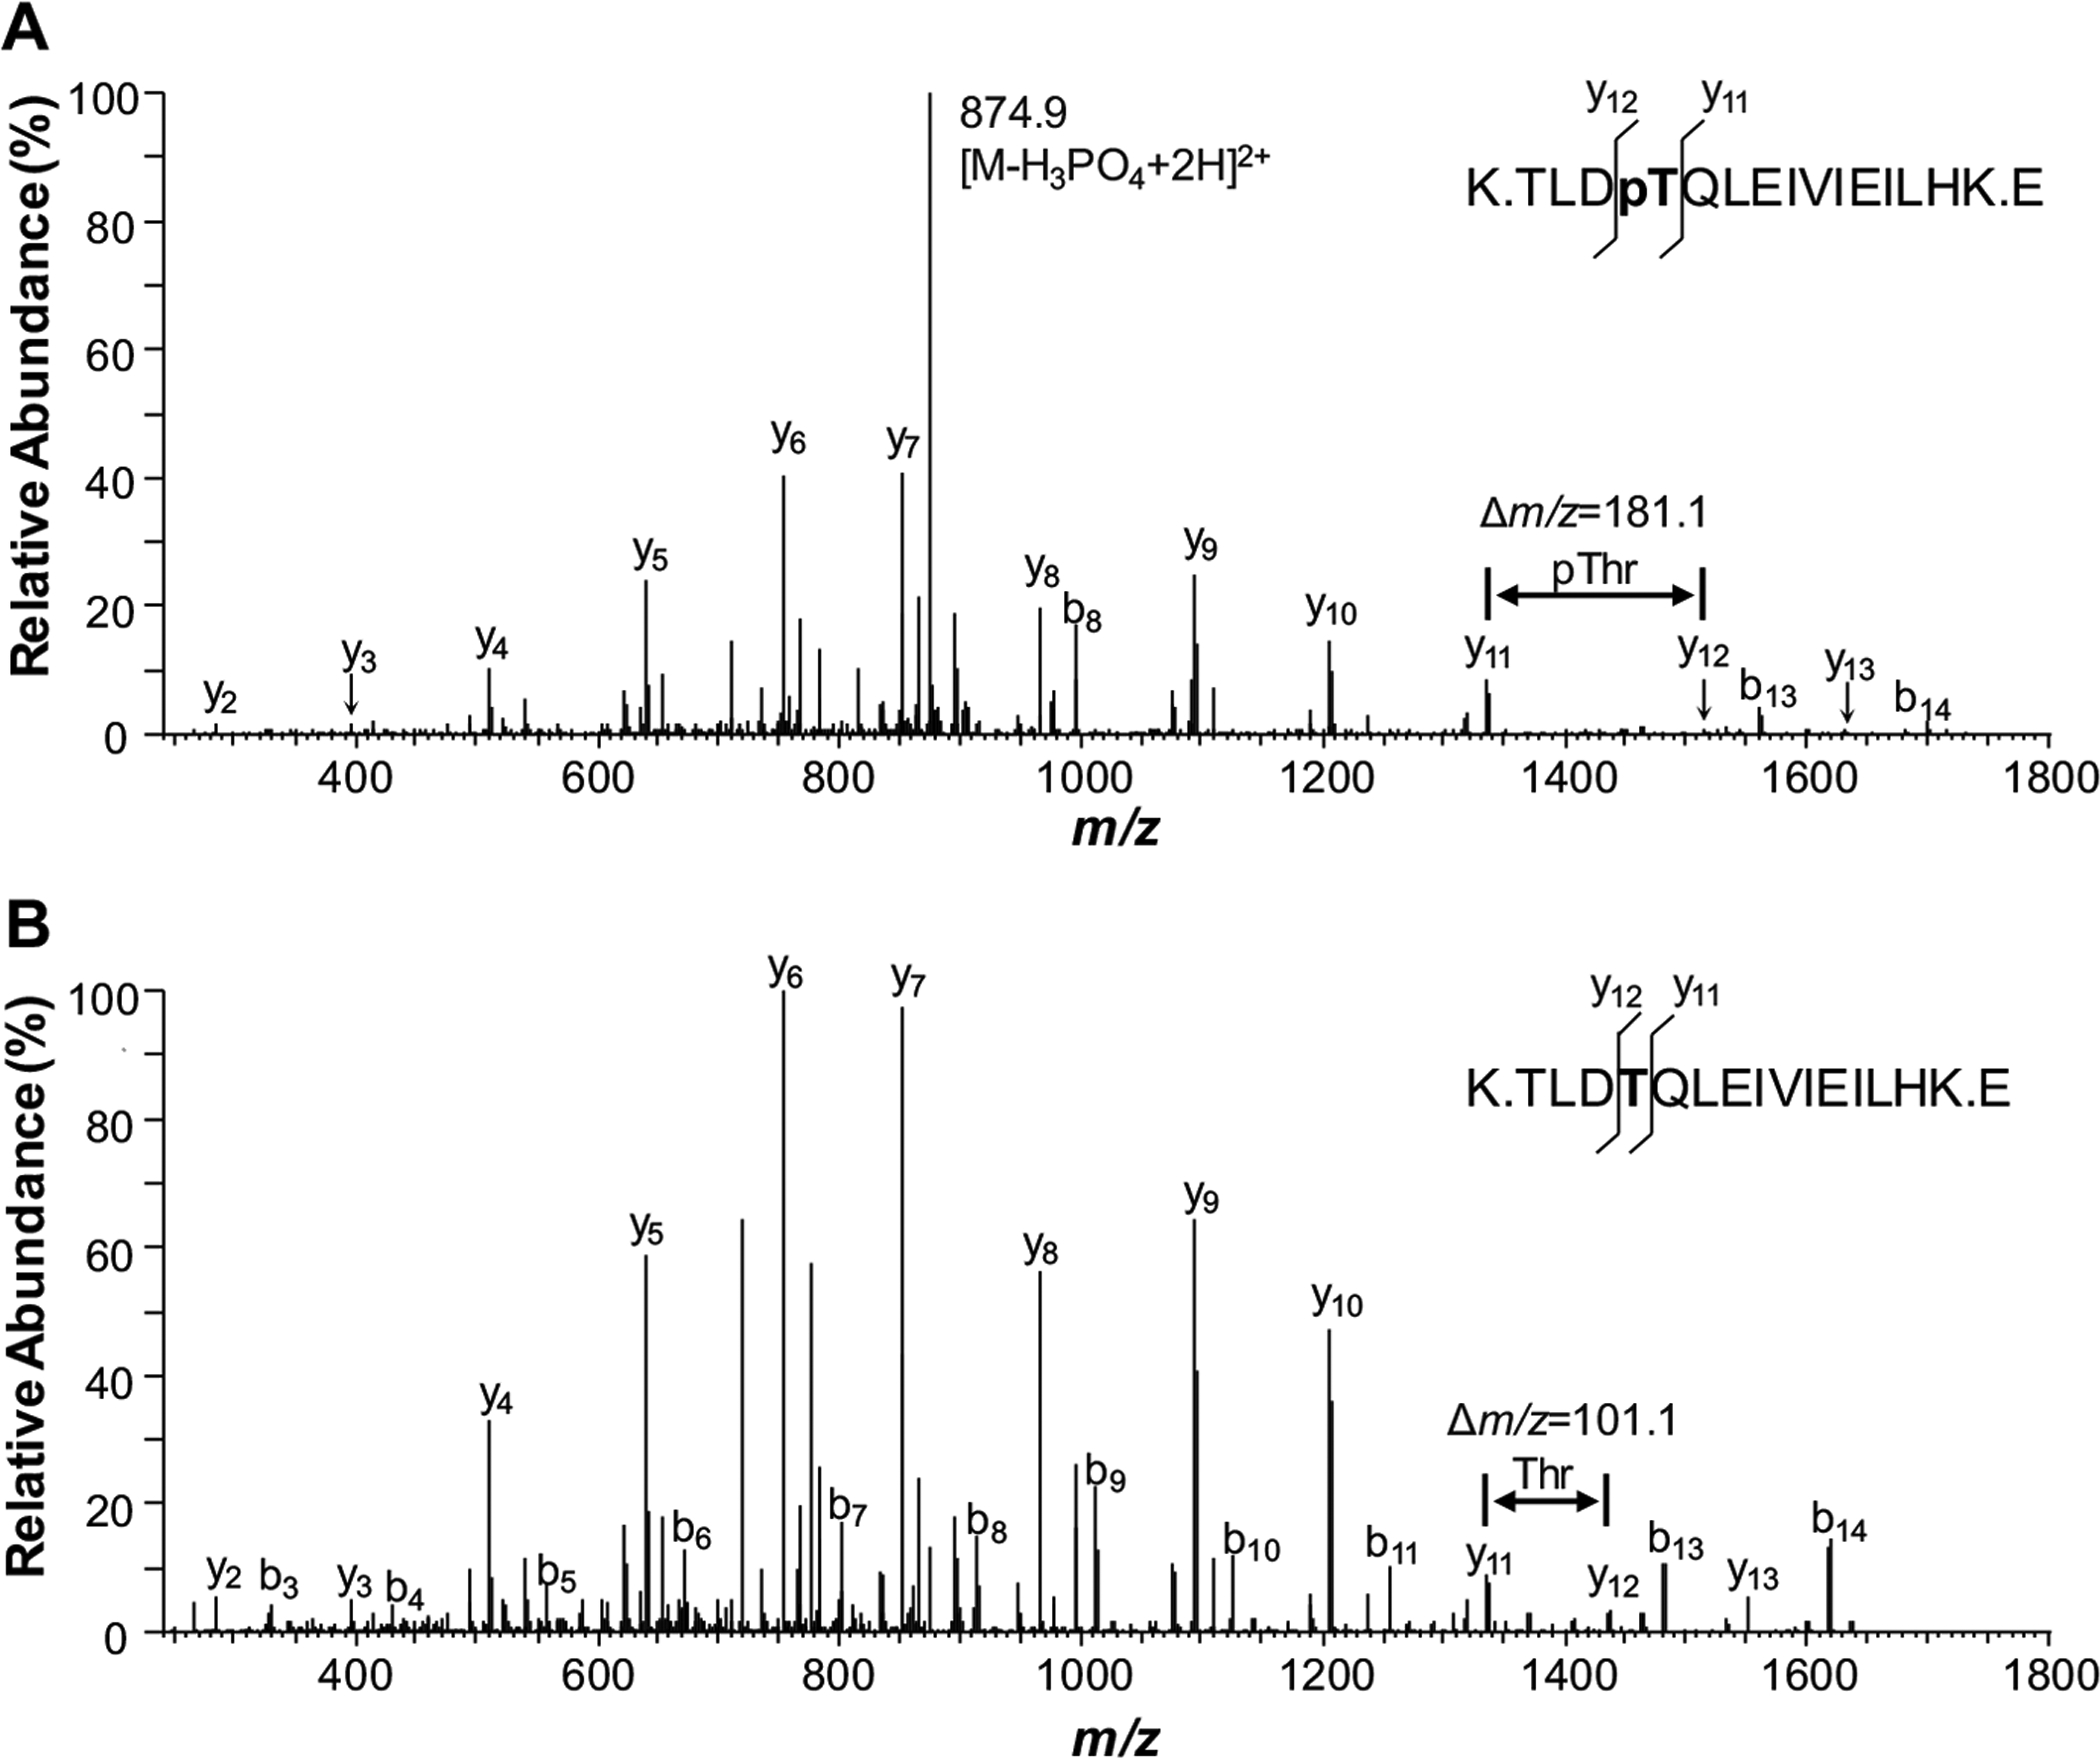
Phosphopeptide identification via tandem mass spectrometry (MS2). A comparison of the MS2 spectra of the phosphopeptide (A) with its unphosphorylated counterpart (B) shows excellent correspondence between the position of majority of fragment ions. The difference between the y11 and y12 ions in the phosphorylated peptide is 80 Da more than that for the non-phosphorylated version, indicating an addition of a phosphate group. Therefore, the MS2 spectrum not only indicates the peptide is phosphorylated, but also is able to pinpoint the location of the phosphorylation site.
While a sufficient population of phosphorylated peptide ions survives the CID process, there are many times when the collision energy completely removes the phosphate group from the peptide prior to detection. Since the phosphoester bonds of phosphorylated Ser and Thr residues are labile, they can easily fragment within a collision cell or ion source of the mass spectrometer, resulting in the loss of the phosphate group from the peptide prior to detection. (Fig. 3) shows an example of a phosphopeptide with an m/z of 454.4 that was subjected to CID. The resulting MS2 spectrum is very sparse, showing a single intense peak at m/z 405.4. While the presence of the peak suggests that the peptide is phosphorylated, it is impossible to determine the identity of the peptide-based on the available data. Fortunately, one of the most common types of mass spectrometer used for acquiring peptide sequence data is referred to as an ion- trap. These instruments act just as their name suggests: they “trap” ions [30, 31]. In this case, the instrument traps the m/z 405.4 ion and subjects it to another round of CID. Fragmentation of this version of the peptide without the phosphate group provides information that enables not only the sequence of the peptide but also the site of phosphorylation to be determined. In protein phosphorylation, the formation of a phosphoester bond with a Ser, Thr, or Tyr residue results in a net mass addition of 80 Da to the protein. However, loss of H3PO4 (i.e., −98 Da) from the phosphorylated amino acid residue during CID marks that residue with a net mass loss of 18 Da (i.e., −H2O). Thus the modification site can be determined based on the fragment ions in the MS3 spectrum. Since the loss of H2O is often observed during peptide CID, challenges exist to identify the exact site of phosphorylation using MS3 in peptides that contain multiple Ser or Thr residues.
Fig. (3).
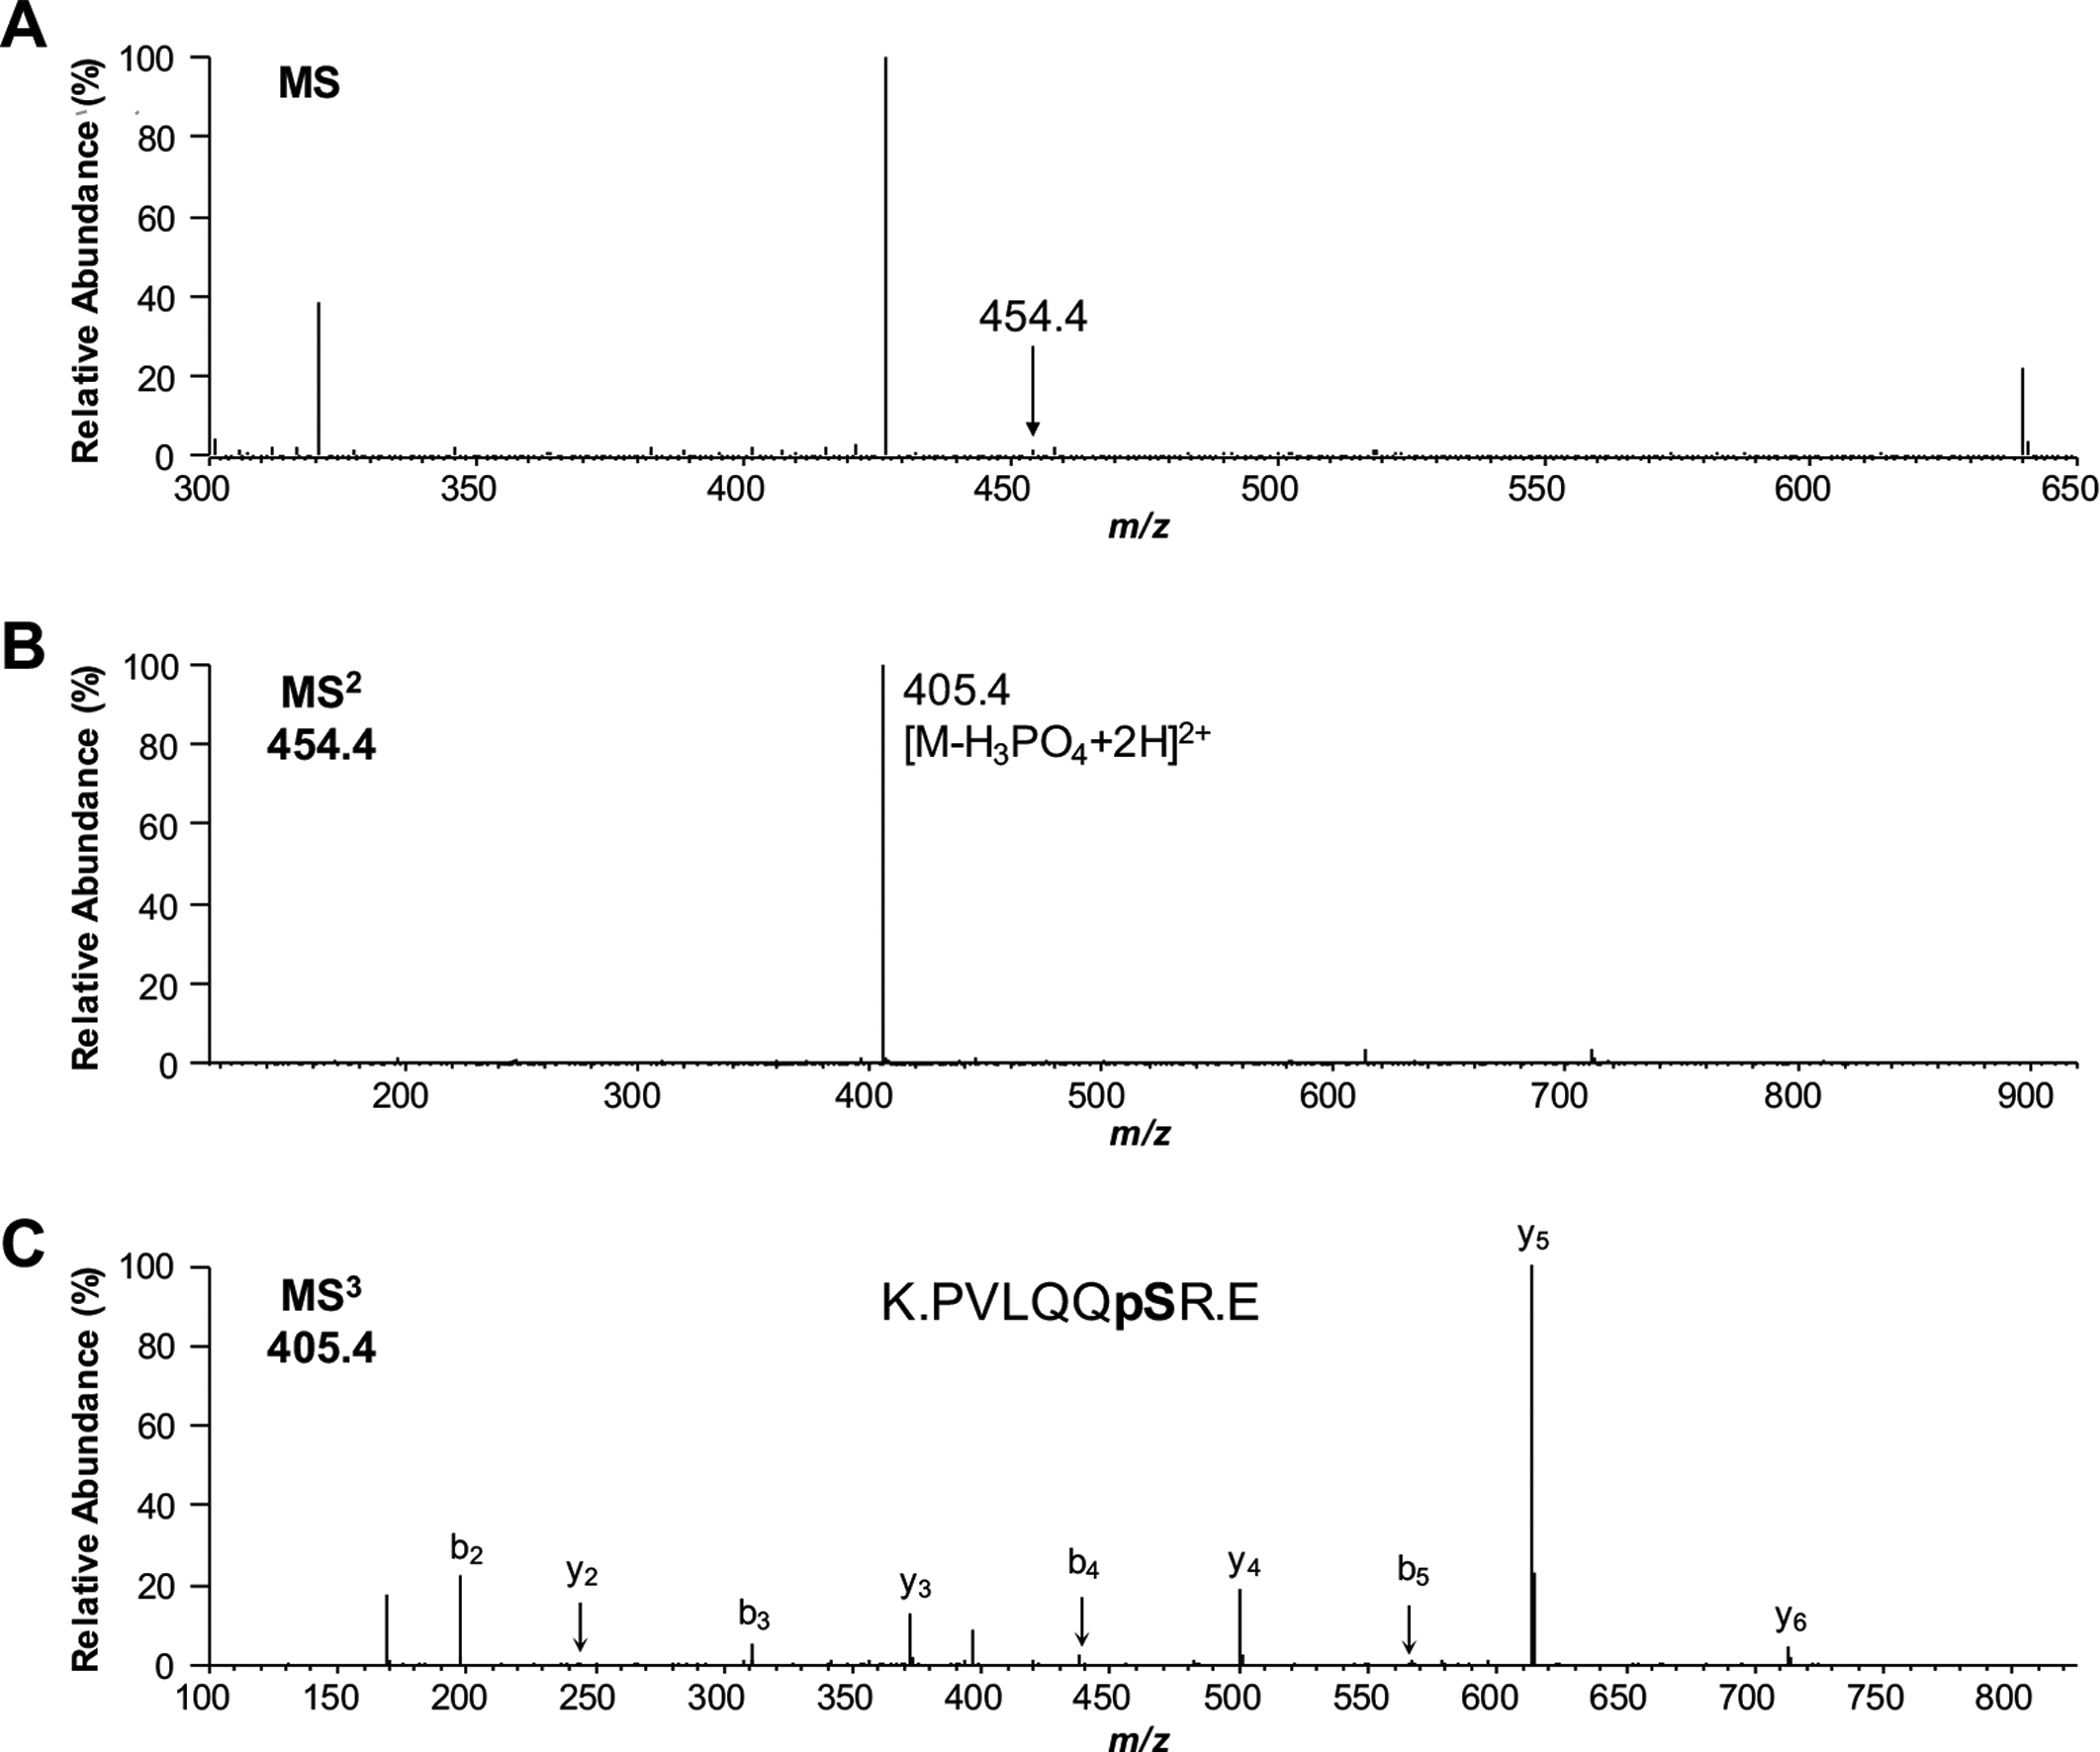
Use of MS3 for phosphorylated peptide identification. (A) The peak at m/z 454.4 was automatically selected for MS2 from a MS spectrum showing several peptide signals. (B) The resulting MS2 spectrum showed a single dominant signal at m/z 405.4, suggesting that the peptide was phosphorylated; however, insufficient data was available to identify the peptide sequence. (C) Selection and fragmentation of this ion, however, was able to provide enough data to identify the peptide sequence and the exact site of phosphorylation.
While phosphopeptides can be analyzed using MS2 or MS3, one study considered whether using both technologies would increase the number of phosphopeptides identified in a complex proteome sample [32]. In this study, the phosphoproteome was extracted from HeLa cells, digested with trypsin, separated using reversed-phase liquid chromatography (RPLC), and analyzed using MS2 and MS3 (RPLC-MS2-MS3). Of the 858 phosphopeptides identified, 41% were identified using only MS2, 35% were identified using only MS3, and 24% were identified using both techniques. If the study had been conducted using only MS2, the number of phosphopeptides identified would have been only 560 (~65%).
2.3. Electron Capture and Electron Transfer Dissociation
While CID has been the major technique used for fragmenting peptides for the purpose of identification, ECD and ETD methods have gained traction as they reduce the amount of fragmentation along the phosphoester bond between the amino acid side chain and the phosphate group [33, 34]. In addition, ECD and ETD methods are more amenable to identifying phosphorylation sites in large protein fragments, whereas CID is limited to peptides in the range of 5–30 amino acids in length. ECD and ETD result in a greater percentage of amino acids retaining their phosphate modification, theoretically identifying phosphorylation sties more obviously. In ECD, low energy electrons are introduced into the trap of the mass spectrometer along with the phosphopeptide of interest [35]. The energy of the electrons is dissipated almost exclusively along the peptide backbone, resulting in cleavage of N-Cα bonds and leaving the phosphate group attached to the amino acid side chain. While ECD is capable of identifying phosphorylated residues within peptides, its greatest utility is analyzing large protein fragments in top-down studies where the protein is not digested into peptides prior to MS analysis.
Electron transfer dissociation has many of the same qualities of ECD (i.e., effective on larger proteins, the lower rate of phosphoester bond fragmentation, etc.). In ETD, however, the protein/peptide is fragmented using low energy anions generated from the chemical ionization of fluoranthene [36]. Similar to ECD, ETD generally results in fragmentation along N-Cα bonds, keeping modified amino acids intact. While not discussed as part of this article, ETD has also made a major impact on the identification of glycosylation sites within proteins [37].
3. ENRICHMENT OF PHOSPHOPEPTIDES
Mass spectrometry instrumentation continues to improve exponentially year after year. Arguably, the most impactful improvements have been the increase in sensitivity and throughput of these instruments. For the purpose of this article, throughput refers to the rate at which a mass spectrometer is able to collect tandem MS data for the purpose of identifying a peptide or phosphopeptide. Throughput is important in the context of proteomics as the aim of many studies is to identify as many components within a sample as possible. Considering that a tryptically digested proteome can be conservatively estimated to contain upwards of 100,000 unique peptides, it is impossible for every peptide to be analyzed in a single or small number (i.e., 5–10) of MS analyses even with current MS instruments.
A basic goal in a proteomic study is to collect data on as many proteins as possible. If the aim is to characterize a specific class of proteins (e.g., membrane proteins, mitochondrial, nuclear, glycosylated, phosphorylated, etc.), the highest coverage will be attained if that specific class is somehow enriched prior to MS analysis. This enrichment strategy is routinely employed when using MS to identify components of protein complexes. For example, immunoprecipitation is routinely used to target a specific member of a protein complex to isolate other proteins associated with the complex. This strategy reduces the number of proteins requiring identification by at least three orders of magnitude. A similar strategy, albeit using different technologies, is often employed when identifying phosphorylated proteins. Identification of phosphorylated peptides is hindered by the low stoichiometry of the phosphorylated compared to the corresponding non-phosphorylated versions. In addition, although it is one of the most common PTMs, the percentage of phosphorylated peptides within the entire peptide pool of a digested protein is still very low. Various strategies for extracting phosphopeptides from a complex mixture are described in the following sections. Note that the choice of strategy is most often dictated by the number of phosphorylated proteins being targeted in the study.
3.1. Immunoaffinity Chromatography
If the goal is to characterize the phosphorylation state of a single protein, immunoprecipitation is probably the best choice to isolate the protein. The antibody used for extracting the protein can be directed towards either a phosphorylated or non-phosphorylated epitope within the protein. The immunoprecipitated protein sample can be enzymatically digested into peptides or further isolated using SDS-PAGE (followed by in-gel enzymatic digestion) prior to MS analysis. If the goal is to characterize a phosphoproteome, a pan-antibody directed towards pSer, pThr, and pTyr residues is utilized. It should be noted that a single anti-pSer or anti-pThr antibody may not achieve broad coverage of pSer or pThr phosphoproteome due to the limited specificity of these antibodies. However, the availability of robust anti-pTyr antibodies with high specificity enables broad analysis of pTyr phosphoproteomes.
A recent study utilized an immunoaffinity approach to study how vascular endothelial protein tyrosine phosphatase (VE-PTP), a receptor-type phosphatase, regulates endothelial junctions and blood vessel development [38]. It had previously been demonstrated that VE-PTP carries out its function through dephosphorylation of substrates such as the angiopoietin-1 receptor TIE2, the endothelial adherens junction protein VE-cadherin and the vascular endothelial growth factor receptor VEGFR2. In this more recent study, the investigators sought to identify additional VE-PTP substrates by comparing untreated cells and the cells treated with an inhibitor that specifically inhibited VE-PTP phosphatase activity. In the first approach, endothelial cells were treated with a VE-PTP-specific phosphatase inhibitor. After the proteome was extracted from the harvested cells, tyrosine-phosphorylated proteins were extracted using a phosphotyrosine-specific antibody. The isolated phosphorylated proteins were then identified using MS2. In the second approach, a mutant version of VE-PTP that irreversibly binds to phosphorylated proteins was used to extract targets, which were also analyzed using MS2. A large fraction (29%) of the phosphorylated proteins identified by both methods were annotated as cell junction proteins. The most prominently identified phosphorylated protein was Ephrin type-B receptor 4 (EPHB4), a receptor tyrosine kinase known to regulate a number of developmental processes, particularly within the nervous system. Further validation not only confirmed the interaction between EPHB4 and VE-PTP but also showed that angiopoietin-1 receptor TIE2, which is also a tyrosine-protein kinase receptor, binds to this complex. The phosphorylation state of both EPHB4 and TIE2 was shown to be controlled by VE-PTP, showing that this protein is a key regulator of cellular junctions not only in development but also signaling between cells.
The data obtained in the previous report was ultimately filtered down to the study of two critical phosphoproteins; however, when most scientists hear the word “phosphoproteomics”, they imagine experiments that characterize hundreds of phosphoproteins. In this case, two different antibody-based strategies can be used (Fig. 4). The differences in the two strategies are most evident in the first and last stages of the experiment. In one strategy, the extracted proteome is digested into peptides prior to extraction of the phosphorylated peptides using an anti-phosphorylation antibody. This strategy results in a much less complex mixture for MS analysis, and a greater percentage of peptides will be identified as phosphorylated. In the second strategy, phosphoproteins are initially extracted from the proteome sample and then digested into peptides. This strategy leaves a much more complex mixture for MS analysis, and most of the analyzed peptides will be unphosphorylated. A study that employed an anti-phosphotyrosine antibody-based phosphopeptide enrichment (along with titanium dioxide, TiO2) provides an excellent example of a broad phosphoproteomic study [39]. A macrophage cell line stimulated with interleukin-33 (IL-33) was compared to unstimulated cells. This study also incorporated differential isotope labeling in cell culture to enable the quantitation of differential phosphopeptides from IL-33 stimulation. The IL-33 stimulated cells were combined with the unstimulated cells, and the proteome was extracted. After digesting the proteome into peptides, phosphopeptides were extracted by both TiO2 chromatography and immunoaffinity using an anti-phosphotyrosine antibody. Almost 7,200 phosphorylated residues originating from just over 2,700 proteins were identified after MS analysis. Differential isotope labeling led to the identification of alterations in the abundance of just over 1,000 of these phosphopeptides when stimulated and unstimulated cells were compared.
Fig. (4).
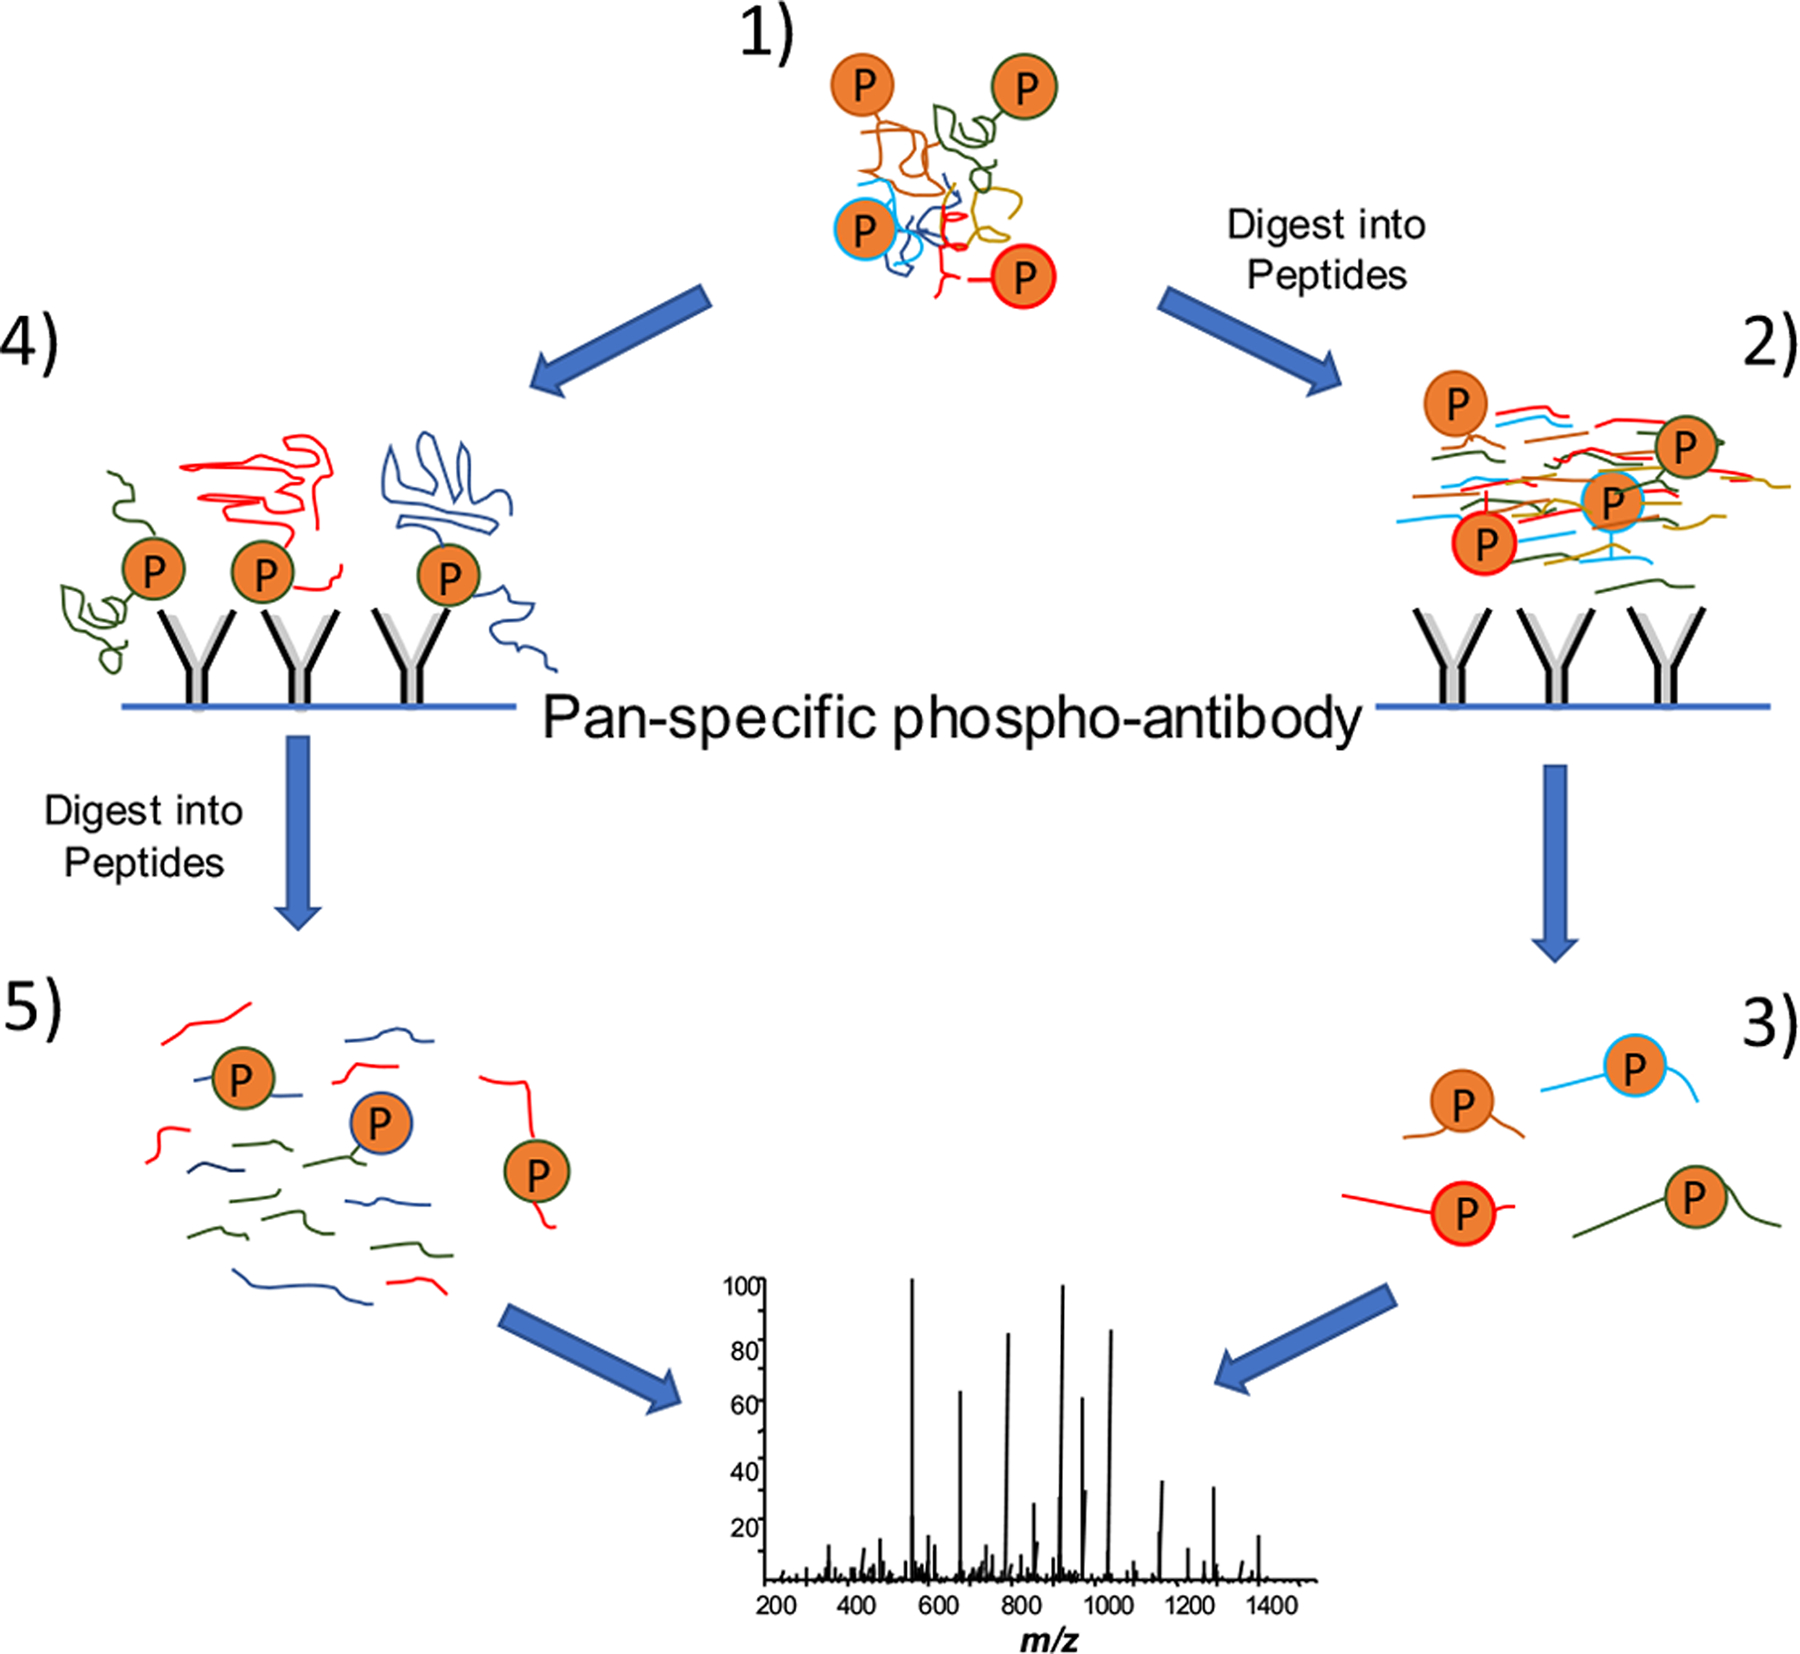
Strategies for extraction and identification of phosphorylated peptides using immunoprecipitation. The extracted proteome sample (1) can be immediately digested into peptides, and phosphopeptides are extracted from this mixture using immunoprecipitation (2). The resultant mixture is highly enriched with phosphopeptides (3), from which a high percentage of the mass spectrometry (MS) identifications are phosphorylated peptides. Using an alternative strategy, intact phosphoproteins are extracted from the proteome sample (4) and then digested into peptides (5). The result is a mixture of peptides in which most of the species are unphosphorylated. As a result, only a small percentage of the MS identifications are phosphorylated.
Many protein kinases were identified among the IL-33 dependent phosphoproteins, including mitogen-activated protein kinase-activated protein kinase 2 (Mapkapk2), receptor-interacting serine-threonine kinase 1 (Ripk1), and nicotinamide adenine dinucleotide (NAD) kinase (Fig. 5). Not only kinases, but also a number of phosphatases, including protein tyrosine phosphatase non-receptor type 12 (Ptpn12) and inositol polyphosphate-5-phosphatase D (Inpp5d), were regulated by IL-33. Grouping of the phosphoproteins into functional categories revealed that many of those that showed a quantitative change upon IL-33 activation were involved in actin binding and cytoskeletal rearrangement. Not only do these results increase the understanding of IL-33 mediated signaling events, but they also provide a wealth of therapeutic targets that can be explored to combat conditions where IL-33 dysregulation is observed (e.g., asthma, inflammatory bowel disease, etc.).
Fig. (5).
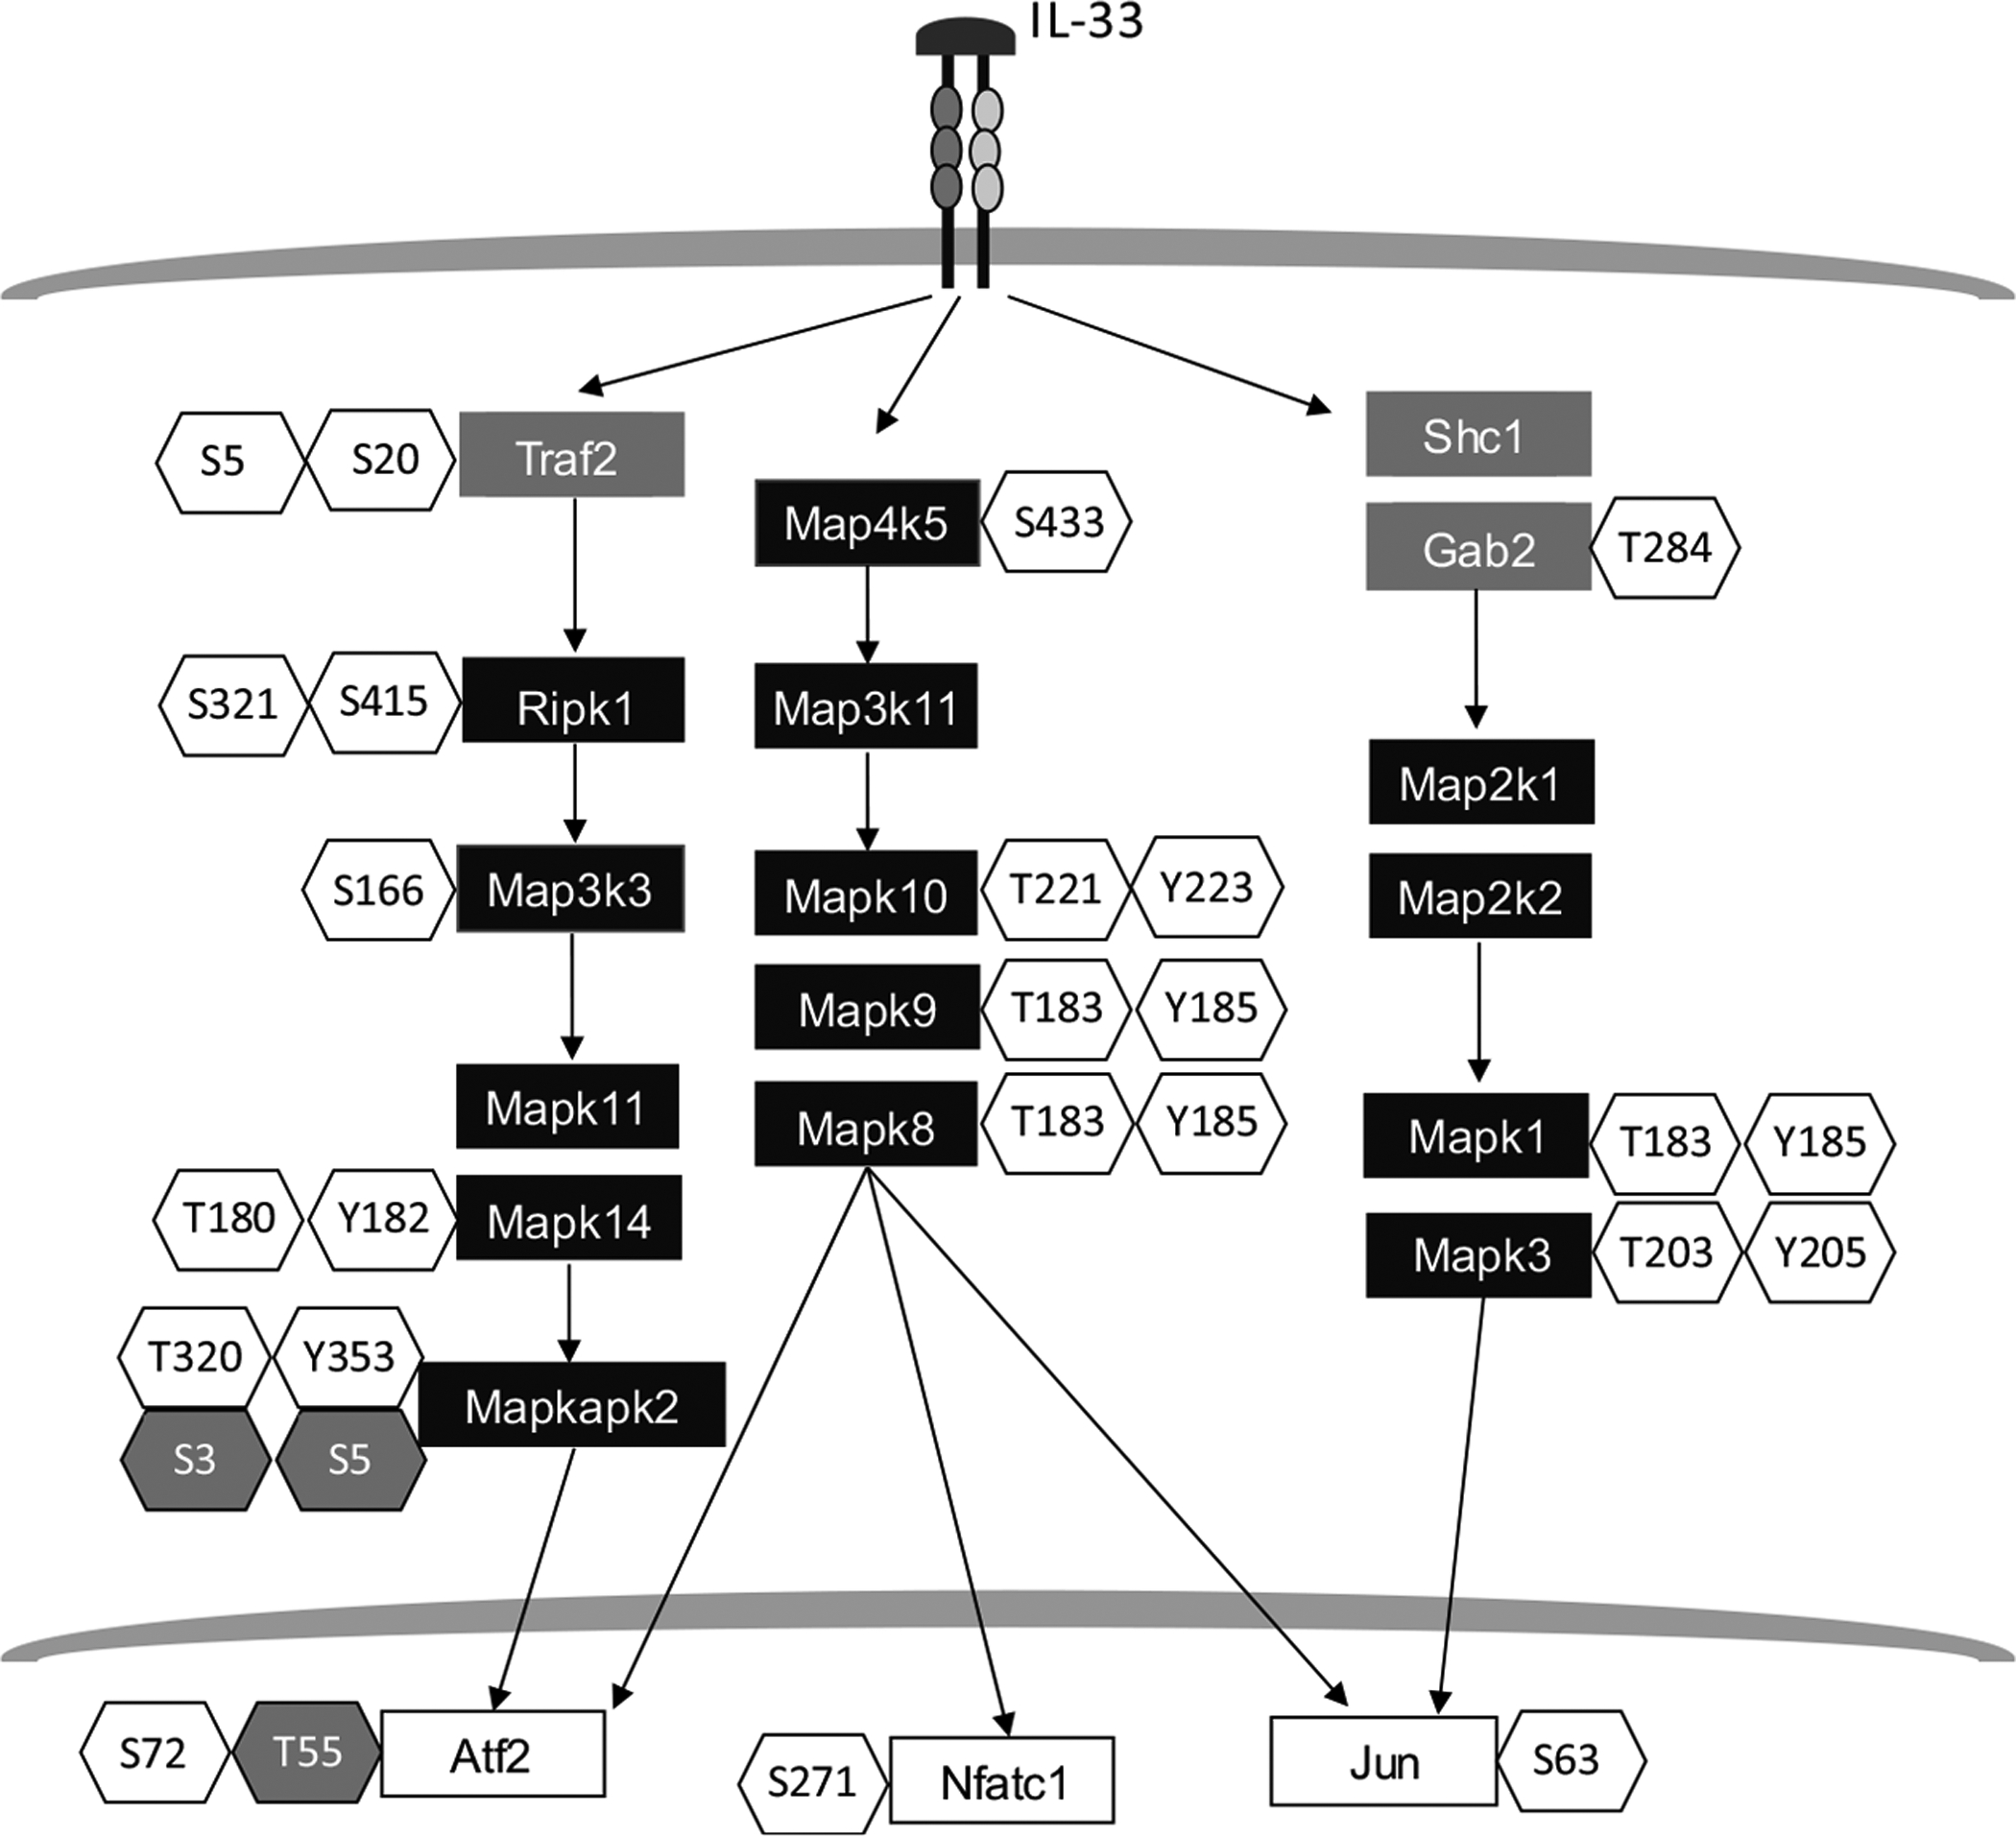
Partial view of phosphoproteins identified in murine macrophage cells treated with interleukin-33 (IL-33). A total of 7,191 phosphorylated sites originated from 2,746 proteins were identified in IL-33 treated murine macrophages [39]. This figure shows a selection of kinases (black-filled rectangles), transcription factors (white-filled rectangles), and signaling molecules (grey-filled rectangles). Phosphorylated residues that were observed to be up-regulated are shown in unshaded hexagons, while those that were observed to be down-regulated are shown in gray-shaded hexagons.
3.2. Cation Exchange Chromatographic Enrichment of Phosphopeptides
Many chromatographic techniques have been used to exploit the presence of negatively charged phosphate groups on phosphopeptides. One of the earliest demonstrations that chromatography could be utilized to enrich phosphopeptides used strong cation exchange (SCX) [40]. Cation exchange columns bind positively charged molecules with various affinities depending on the charge state of the molecule. The investigators performed an in silico tryptic digest of all known proteins in the human proteome and found that 68% of these peptides had a +2 charge state at pH 2.7, owing to the presence of their amino terminus, as well as a Lys or Arg residue at their carboxyl terminus. If any of these peptides contained a single phosphorylation site, their net charge would be +1. Since SCX is based primarily on the ionic charge of the peptide, phosphorylated tryptic peptides would be expected to elute prior to non-phosphorylated peptides. To prove this hypothesis, the investigators separated a tryptic peptide mixture prepared from a HeLa cell lysate using SCX at pH 2.7. Their results showed that the early fractions collected from the SCX column were highly enriched with phosphopeptides having a +1 charge state (as determined by MS). They further confirmed this finding using a library made up of 2,000 synthetically prepared phosphopeptides. This study demonstrated how charge state could be used to extract phosphopeptides from a complex mixture and laid the groundwork for other methods that provided even higher levels of extraction efficiency.
3.3. Immobilized Metal Affinity Chromatography
While SCX is able to enrich phosphopeptides, its resolution is quite low. Shortly after the value of phosphoproteomics was recognized, the application of immobilized metal affinity chromatography (IMAC) to extract phosphopeptides was investigated [41]. IMAC employs the same basic strategy of SCX; however, it uses divalent, trivalent, or quadrivalent cations such as Ni2+, Cu2+, Zn2+, Fe3+, Ga3+, or Ti4+ coupled to a solid support. Owing to the presence of the negatively charged phosphate group, phosphopeptides have a greater affinity towards IMAC columns than their unmodified counterparts. After allowing peptides from a complex proteome digest to bind to the column, non-specifically bound peptides are washed from the column. Peptides retained by the column are eluted and analyzed using MS. While both proteins and peptides can be fractionated, a vast majority of phosphoproteomic studies utilize IMAC for the separation of peptides. Unfortunately, non-specific binding of unphosphorylated peptides is a major problem with IMAC. In particular, the carboxylate groups from acidic amino acid residues (i.e., Asp and Glu) and the C-terminus of the peptide also bind to IMAC columns [42]. To increase IMAC selectivity, one group added methanolic-HCl to convert all the carboxylate groups to methyl esters while leaving the phosphate groups intact [43]. When this strategy was applied to a whole yeast lysate, more than 1,000 phosphopeptides were identified. While this does not sound like a large number compared to today’s standards, this number was achieved over a decade ago with mass spectrometers far less powerful than those currently available.
3.4. Metal Oxide Affinity Chromatography
Metal oxide affinity chromatography (MOAC), especially the use of titanium dioxide (TiO2) and zirconium dioxide (ZrO2), is another useful strategy for extracting phosphopeptides from complex mixtures [44, 45]. MOAC generally exhibits higher selectivity and has a higher capacity than IMAC [46]. To improve the selectivity of MOAC columns, molecules such as phthalic acid, glutamate, or dihydroxybenzoic acid are added to the loading buffer. These molecules serve to block non-phosphorylated peptides that contain acidic residues from occupying binding sites on the column.
Neither IMAC nor MOAC provides perfect extraction of phosphopeptides. Studies have shown that MOAC methods using chelating agents such as TiO2 are able to separate singly phosphorylated peptides more efficiently than multi-phosphorylated peptides, while IMAC is most effective for enriching for multi-phosphorylated peptides. While studies have utilized MOAC and IMAC columns in sequence, this strategy requires additional material and is very laborious. Other investigators have developed hybrid chromatographies containing both MOAC and IMAC particles enabling a single process for extracting phosphopeptides. In one study, investigators created a MOAC-IMAC hybrid column in which TiO2 (i.e., MOAC) was coated onto silica particles followed by a coating of 3-(trihydroxysilyl)propyl methylphosphonate (THPMP) to chelate Ti4+ ions (i.e., IMAC) onto the particles outer surface [47]. The hybrid MOAC-IMAC particles were evaluated against MOAC and IMAC particles individually for their ability to extract phosphopeptides from a sample of nonfat milk, which is known to contain the highly phosphorylated protein β-casein. Using MS for detection, only 6 and 10 phosphopeptides were observable when MOAC or IMAC chromatography was used to enrich for phosphopeptides, respectively. In the case of the MOAC column, 5 out of the 6 phosphopeptides were singly phosphorylated. In the case of the IMAC column, 6 out of the 10 phosphopeptides were multiply phosphorylated. The hybrid column enabled 15 phosphopeptides to be detected. In addition, there was no significant bias between the extraction of singly or multiply phosphorylated peptides.
CONCLUSION
Protein modification via reversible phosphorylation represents the major signaling mechanism through which biological molecules interact. Phosphorylation regulates most of the major functions that occur within eukaryotic organisms. Deciphering the complexity of this communication network used to be done solely by directed approaches that analyzed a single event per experiment. Considering there are almost half a million curated phosphorylated sites within the human proteome, a directed strategy would require enormous resources yet could not provide context for all the phosphorylation signaling events continuously happening within human cells. The development of highly sensitive, highly accurate, and rapid MS systems over the past two decades has made the greatest impact on studying phosphorylation since the development of Western blotting. When combined with chromatography for phosphoprotein/phosphopeptide extraction, MS methods are now capable of identifying thousands of phosphorylation sites within single samples. This complexity leads to the next major need for almost every field of “omics”: temporal collation of the data. A temporal collation will enable the relationships between phosphorylation events to be arranged in terms of connectivity and relevance. This arrangement will help us understand how the complex circuitry of phosphorylation regulates cellular events and allow us to predict what occurs to cells when they are perturbed through some natural (e.g., cancers, nutrients, etc.) or unnatural (e.g., medications, xenobiotics, etc.) processes.
ACKNOWLEDGEMENTS
TV would like to acknowledge Cedarville University for their support in preparing this article. This article reflects the views of the authors and does not necessarily reflect those of the Food and Drug Administration.
FUNDING
This study was supported with funds (S00626) from the National Center for Toxicological Research of the U.S. Food and Drug Administration (to LRY), Jefferson, Arkansas.
Footnotes
CONFLICT OF INTEREST
Declared none.
REFERENCES
- [1].Wang Y; Wang L; Gong Z Regulation of acetylation in high mobility group protein B1 cytosol translocation. DNA Cell Biol, 2019, 38(5), 491–499. 10.1089/dna.2018.4592 [DOI] [PubMed] [Google Scholar]
- [2].Mestermann K; Giavridis T; Weber J; Rydzek J; Frenz S; Nerreter T; Mades A; Sadelain M; Einsele H; Hudecek M The tyrosine kinase inhibitor dasatinib acts as a pharmacologic on/off switch for CAR T cells. Sci. Transl. Med, 2019, 11(499), 1–11. 10.1126/scitranslmed.aau5907 [DOI] [PMC free article] [PubMed] [Google Scholar]
- [3].Belman JP; Habtemichael EN; Bogan JS A proteolytic pathway that controls glucose uptake in fat and muscle. Rev. Endocr. Metab. Disord, 2014, 15(1), 55–66. 10.1007/s11154-013-9276-2 [DOI] [PMC free article] [PubMed] [Google Scholar]
- [4].Salzberg SL Open questions: How many genes do we have? BMC Biol., 2018, 16(1), 94. 10.1186/s12915-018-0564-x [DOI] [PMC free article] [PubMed] [Google Scholar]
- [5].Available from: nextprot.org/about/protein-existence
- [6].Smith LM; Kelleher NL Consortium for Top Down Proteomics. Proteoform: a single term describing protein complexity. Nat. Methods, 2013, 10(3), 186–187. 10.1038/nmeth.2369 [DOI] [PMC free article] [PubMed] [Google Scholar]
- [7].Vanacore R; Ham AJ; Voehler M; Sanders CR; Conrads TP; Veenstra TD; Sharpless KB; Dawson PE; Hudson BG A sulfilimine bond identified in collagen IV. Science, 2009, 325(5945), 1230–1234. 10.1126/science.1176811 [DOI] [PMC free article] [PubMed] [Google Scholar]
- [8].Garavelli JS The RESID Database of Protein Modifications as a resource and annotation tool. Proteomics, 2004, 4(6), 1527–1533. 10.1002/pmic.200300777 [DOI] [PubMed] [Google Scholar]
- [9].Yakubu RR; Nieves E; Weiss LM The methods employed in mass spectrometric analysis of posttranslational modifications (PTMs) and protein-protein interactions (PPIs). Adv. Exp. Med. Biol, 2019, 1140, 169–198. 10.1007/978-3-030-15950-4_10 [DOI] [PMC free article] [PubMed] [Google Scholar]
- [10].Available from: phosphosite.org/staticSiteStatistics.action
- [11].Available from: cellsignal.com/contents/resources-reference-tables/kinase-disease-associations/science-tables-kinase-diseas
- [12].Available from: brimr.org/PKI/PKIs.htm
- [13].Available from: kinase-screen.mrc.ac.uk/about-us
- [14].Manning DR; DiSalvo J; Stull JT Protein phosphorylation: quantitative analysis in vivo and in intact cell systems. Mol. Cell. Endocrinol, 1980, 19(1), 1–19. 10.1016/0303-7207(80)90026-X [DOI] [PubMed] [Google Scholar]
- [15].Dzandu JK; Johnson RM Membrane protein phosphorylation in intact normal and sickle cell erythrocytes. J. Biol. Chem, 1980, 255(13), 6382–6386. [PubMed] [Google Scholar]
- [16].Loyet KM; Stults JT; Arnott D Mass spectrometric contributions to the practice of phosphorylation site mapping through 2003: a literature review. Mol. Cell. Proteomics, 2005, 4(3), 235–245. 10.1074/mcp.R400011-MCP200 [DOI] [PubMed] [Google Scholar]
- [17].Zhou M; Meng Z; Jobson AG; Pommier Y; Veenstra TD Detection of in vitro kinase generated protein phosphorylation sites using gamma[18O4]-ATP and mass spectrometry. Anal. Chem, 2007, 79(20), 7603–7610. 10.1021/ac071584r [DOI] [PubMed] [Google Scholar]
- [18].Goshe MB; Veenstra TD; Panisko EA; Conrads TP; Angell NH; Smith RD Phosphoprotein isotope-coded affinity tags: application to the enrichment and identification of low-abundance phosphoproteins. Anal. Chem, 2002, 74(3), 607–616. 10.1021/ac015528g [DOI] [PubMed] [Google Scholar]
- [19].Molden RC; Goya J; Khan Z; Garcia BA Stable isotope labeling of phosphoproteins for large-scale phosphorylation rate determination. Mol. Cell. Proteomics, 2014, 13(4), 1106–1118. 10.1074/mcp.O113.036145 [DOI] [PMC free article] [PubMed] [Google Scholar]
- [20].Ducret A; Desponts C; Desmarais S; Gresser MJ; Ramachandran C A general method for the rapid characterization of tyrosine-phosphorylated proteins by mini two-dimensional gel electrophoresis. Electrophoresis, 2000, 21(11), 2196–2208. 10.1002/1522-2683(20000601)21:11<2196::AID-ELPS2196>3.0.CO;2-Z [DOI] [PubMed] [Google Scholar]
- [21].Wulfkuhle JD; Aquino JA; Calvert VS; Fishman DA; Coukos G; Liotta LA; Petricoin EF III Signal pathway profiling of ovarian cancer from human tissue specimens using reverse-phase protein microarrays. Proteomics, 2003, 3(11), 2085–2090. 10.1002/pmic.200300591 [DOI] [PubMed] [Google Scholar]
- [22].Ponnam S; Sevrieva I; Sun YB; Irving M; Kampourakis T Site-specific phosphorylation of myosin binding protein-C coordinates thin and thick filament activation in cardiac muscle. Proc. Natl. Acad. Sci. USA, 2019, 116(31), 15485–15494. 10.1073/pnas.1903033116 [DOI] [PMC free article] [PubMed] [Google Scholar]
- [23].Zheng Y; Huang X; Kelleher NL Epiproteomics: quantitative analysis of histone marks and codes by mass spectrometry. Curr. Opin. Chem. Biol, 2016, 33, 142–150. 10.1016/j.cbpa.2016.06.007 [DOI] [PMC free article] [PubMed] [Google Scholar]
- [24].Aslebagh R; Wormwood KL; Channaveerappa D; Wetie AGN; Woods AG; Darie CC Identification of posttranslational modifications (PTMs) of proteins by mass spectrometry. Adv. Exp. Med. Biol, 2019, 1140, 199–224. 10.1007/978-3-030-15950-4_11 [DOI] [PubMed] [Google Scholar]
- [25].Wierenga SK; Zocher MJ; Mirus MM; Conrads TP; Goshe MB; Veenstra TD A method to evaluate tryptic digestion efficiency for high-throughput proteome analyses. Rapid Commun. Mass Spectrom, 2002, 16(14), 1404–1408. 10.1002/rcm.729 [DOI] [PubMed] [Google Scholar]
- [26].Tabb DL; Huang Y; Wysocki VH; Yates JR III Influence of basic residue content on fragment ion peak intensities in low-energy collision-induced dissociation spectra of peptides. Anal. Chem, 2004, 76(5), 1243–1248. 10.1021/ac0351163 [DOI] [PMC free article] [PubMed] [Google Scholar]
- [27].Areces LB; Matafora V; Bachi A Analysis of protein phosphorylation by mass spectrometry. Eur. J. Mass. Spectrom. (Chichester), 2004, 10(3), 383–392. 10.1255/ejms.601 [DOI] [PubMed] [Google Scholar]
- [28].Dephoure N; Gould KL; Gygi SP; Kellogg DR Mapping and analysis of phosphorylation sites: a quick guide for cell biologists. Mol. Biol. Cell, 2013, 24(5), 535–542. 10.1091/mbc.e12-09-0677 [DOI] [PMC free article] [PubMed] [Google Scholar]
- [29].Palumbo AM; Smith SA; Kalcic CL; Dantus M; Stemmer PM; Reid GE Tandem mass spectrometry strategies for phosphoproteome analysis. Mass Spectrom. Rev, 2011, 30(4), 600–625. 10.1002/mas.20310 [DOI] [PubMed] [Google Scholar]
- [30].Nolting D; Malek R; Makarov A Ion traps in modern mass spectrometry. Mass Spectrom. Rev, 2019, 38(2), 150–168. 10.1002/mas.21549 [DOI] [PubMed] [Google Scholar]
- [31].Berberich MJ; Paulo JA; Everley RA MS3-IDQ: Utilizing MS3 spectra beyond quantification yields increased coverage of the phosphoproteome in isobaric tag experiments. J. Proteome Res, 2018, 17(4), 1741–1747. 10.1021/acs.jproteome.8b00006 [DOI] [PMC free article] [PubMed] [Google Scholar]
- [32].Yu LR; Zhu Z; Chan KC; Issaq HJ; Dimitrov DS; Veenstra TD Improved titanium dioxide enrichment of phosphopeptides from HeLa cells and high confident phosphopeptide identification by cross-validation of MS/MS and MS/MS/MS spectra. J. Proteome Res, 2007, 6(11), 4150–4162. 10.1021/pr070152u [DOI] [PubMed] [Google Scholar]
- [33].Sarbu M; Ghiulai RM; Zamfir AD Recent developments and applications of electron transfer dissociation mass spectrometry in proteomics. Amino Acids, 2014, 46(7), 1625–1634. 10.1007/s00726-014-1726-y [DOI] [PubMed] [Google Scholar]
- [34].Syka JE; Coon JJ; Schroeder MJ; Shabanowitz J; Hunt DF Peptide and protein sequence analysis by electron transfer dissociation mass spectrometry. Proc. Natl. Acad. Sci. USA, 2004, 101(26), 9528–9533. 10.1073/pnas.0402700101 [DOI] [PMC free article] [PubMed] [Google Scholar]
- [35].Zubarev RA Electron-capture dissociation tandem mass spectrometry. Curr. Opin. Biotechnol, 2004, 15(1), 12–16. 10.1016/j.copbio.2003.12.002 [DOI] [PubMed] [Google Scholar]
- [36].Mikesh LM; Ueberheide B; Chi A; Coon JJ; Syka JE; Shabanowitz J; Hunt DF The utility of ETD mass spectrometry in proteomic analysis. Biochim. Biophys. Acta, 2006, 1764(12), 1811–1822. 10.1016/j.bbapap.2006.10.003 [DOI] [PMC free article] [PubMed] [Google Scholar]
- [37].Hevér H; Darula Z; Medzihradszky KF Characterization of site-specific N-glycosylation. Methods Mol. Biol, 2019, 1934, 93–125. 10.1007/978-1-4939-9055-9_8 [DOI] [PubMed] [Google Scholar]
- [38].Drexler HCA; Vockel M; Polaschegg C; Frye M; Peters K; Vestweber D Vascular endothelial receptor tyrosine phosphatase: identification of novel substrates related to junctions and a ternary complex with EPHB4 and TIE2. Mol. Cell. Proteomics, 2019, 18(10), 2058–2077. 10.1074/mcp.RA119.001716 [DOI] [PMC free article] [PubMed] [Google Scholar]
- [39].Pinto SM; Nirujogi RS; Rojas PL; Patil AH; Manda SS; Subbannayya Y; Roa JC; Chatterjee A; Prasad TS; Pandey A Quantitative phosphoproteomic analysis of IL-33-mediated signaling. Proteomics, 2015, 15(2–3), 532–544. 10.1002/pmic.201400303 [DOI] [PMC free article] [PubMed] [Google Scholar]
- [40].Beausoleil SA; Jedrychowski M; Schwartz D; Elias JE; Villén J; Li J; Cohn MA; Cantley LC; Gygi SP Large-scale characterization of HeLa cell nuclear phosphoproteins. Proc. Natl. Acad. Sci. USA, 2004, 101(33), 12130–12135. 10.1073/pnas.0404720101 [DOI] [PMC free article] [PubMed] [Google Scholar]
- [41].Thingholm TE; Jensen ON Enrichment and characterization of phosphopeptides by immobilized metal affinity chromatography (IMAC) and mass spectrometry. Methods Mol. Biol, 2009, 527, 47–56, xi. 10.1007/978-1-60327-834-8_4 [DOI] [PubMed] [Google Scholar]
- [42].Yu LR; Veenstra T Phosphopeptide enrichment using offline titanium dioxide columns for phosphoproteomics. Methods Mol. Biol, 2013, 1002, 93–103. 10.1007/978-1-62703-360-2_8 [DOI] [PMC free article] [PubMed] [Google Scholar]
- [43].Ficarro SB; McCleland ML; Stukenberg PT; Burke DJ; Ross MM; Shabanowitz J; Hunt DF; White FM Phosphoproteome analysis by mass spectrometry and its application to Saccharomyces cerevisiae. Nat. Biotechnol, 2002, 20(3), 301–305. 10.1038/nbt0302-301 [DOI] [PubMed] [Google Scholar]
- [44].Liu H; Yang T; Dai J; Zhu J; Li X; Wen R; Yang X Hydrophilic modification of titania nanomaterials as a biofunctional adsorbent for selective enrichment of phosphopeptides. Analyst (Lond.), 2015, 140(19), 6652–6659. 10.1039/C5AN01544H [DOI] [PubMed] [Google Scholar]
- [45].Wang ST; Wang MY; Su X; Yuan BF; Feng YQ Facile preparation of SiO2/TiO2 composite monolithic capillary column and its application in enrichment of phosphopeptides. Anal. Chem, 2012, 84(18), 7763–7770. 10.1021/ac301258q [DOI] [PubMed] [Google Scholar]
- [46].Beltran L; Cutillas PR Advances in phosphopeptide enrichment techniques for phosphoproteomics. Amino Acids, 2012, 43(3), 1009–1024. 10.1007/s00726-012-1288-9 [DOI] [PubMed] [Google Scholar]
- [47].Yang DS; Ding XY; Min HP; Li B; Su MX; Niu MM; Di B; Yan F Design and synthesis of an immobilized metal affinity chromatography and metal oxide affinity chromatography hybrid material for improved phosphopeptide enrichment. J. Chromatogr. A, 2017, 1505, 56–62. 10.1016/j.chroma.2017.05.025 [DOI] [PubMed] [Google Scholar]