

Abstract
Purpose:
To determine the effect of transitioning from SITA Standard to SITA Faster on visual field (VF) performance in glaucomatous eyes with a broad spectrum of disease severity undergoing longitudinal VF testing in a real-world clinical setting.
Design:
Retrospective, longitudinal study
Participants:
Four-hundred and twenty-one patients (766 eyes) with manifest or suspect glaucoma followed at a single institution.
Methods:
Each included eye received the following sequence of VF examinations during routine clinical care: 1) SITA Standard, 2) SITA Standard, 3) SITA Faster (mean time between tests = 13.9 months). Intra-eye comparisons were made between the first two VFs (Standard-Standard sequence) and the last two VFs (Standard-Faster sequence). The primary dependent variable was the difference in MD between the second and first VF of the sequence (ΔMD, calculated as MDVF2 – MDVF1). The primary independent variable was the VF sequence (Standard-Standard or Standard-Faster). Linear mixed-effects models were used to study the effect of testing sequence on ΔMD, adjusting for confounders including time between VFs and change in FP errors. Results were stratified to understand the effect of glaucoma severity on the relationship between testing sequence and ΔMD.
Main Outcome Measures:
The difference in ΔMD between Standard-Standard and Standard-Faster sequence by mild, moderate, and advanced disease severity.
Results:
In eyes with mild or suspect glaucoma, there was no significant difference in ΔMD between Standard-Faster and Standard-Standard sequences (−0.23 dB [95% CI: −0.60 to 0.15 dB]). However, the Standard-Faster sequence was associated with a 0.87 dB (95% CI: 0.18 to 1.57 dB) improvement in ΔMD compared to the Standard-Standard sequence in eyes with moderate glaucoma and a 1.49 dB (95% CI: 0.79 to 2.19 dB) improvement in ΔMD in eyes with advanced glaucoma.
Conclusions:
Converting to SITA Faster in eyes that were previously followed with SITA Standard led to similar visual field performance in mild glaucoma but resulted in higher MD values in moderate and advanced glaucoma. For patients with moderate or severe glaucoma, this may conceal disease progression when transitioning testing strategies.
Keywords: SITA Faster, SITA Standard, visual field, mean deviation
PRECIS
Transitioning from SITA Standard to SITA Faster results in statistically higher mean deviation measurements in eyes with moderate or advanced glaucoma but not in eyes with mild glaucoma.
Introduction
Visual field (VF) testing is essential to diagnose and track the progression of glaucoma, the leading cause of irreversible blindness worldwide.1 There are various methods of measuring VF damage in clinical practice; the most widely used is standard automated perimetry (SAP) with the Humphrey Field Analyzer (HFA - Carl Zeiss Meditec, Dublin, California, USA). In the past, the predominant test strategy employed on the HFA instrument was Full Threshold but it has since been supplanted by the Swedish Interactive Thresholding Algorithms (SITA) due to shorter testing times with similar accuracy and reproducibility.2,3 Traditionally, SITA is available as SITA Standard which takes approximately 7 minutes per eye, and SITA Fast which takes approximately 4 min per eye. Although SITA Fast has shorter test durations, SITA Standard remains more popular due to testing variability observed with SITA Fast.4,5
In general, SAP has inherent variability between serial VF examinations, which is even more pronounced in eyes with advanced glaucoma.6–8 As a result, frequent testing is necessary to distinguish instrument noise from true disease progression, and this has driven efforts toward determining the optimal and effective monitoring intervals. For example, Chauhan et al. 2008 reported that a minimum of three VF examinations per year for the first two years after initial diagnosis is needed to identify the rapid progression of glaucoma.9 There have been subsequent studies to establish evidence-based guidelines on the frequency of VF testing to improve disease management, and they have similarly found that increased frequency of testing enables earlier detection of disease progression.10–12
In clinical practice, these recommendations are impractical to implement due to access to transportation, scheduling conflicts, appointment costs, clinic capacities, and testing burden on the patient.13–18 To encourage healthcare providers to follow current glaucoma recommendations, Heijl et al. developed a shorter testing algorithm to reduce the burden of testing, SITA Faster, which was derived from SITA Fast. SITA Faster typically takes 2.87 minutes to complete while SITA Standard typically takes 6.16 minutes to complete.19
In addition to addressing one bottleneck for testing (i.e. the number of tests that can be done with a given number of machines/technicians), shorter testing times are also conducive to public health recommendations amid the novel coronavirus (COVID-19) pandemic. The Centers for Disease Control and Prevention advises healthcare personnel to avoid being within 6 feet for at least 15 minutes.20,21 Hence, an accurate and faster method of measuring VF performance may be beneficial to protect patients and healthcare workers as clinics and practices reopen to full capacity.
While SITA Faster was found to give nearly identical results to SITA Fast and demonstrated similar levels of variability to SITA Standard it remains to be determined whether one might expect discontinuities in VF summary measures when converting from one algorithm to the other.19 In particular, if SITA Faster were to replace SITA Standard, it is unknown how VF performance would change in eyes that had been receiving SITA Standard tests but are then transitioned to SITA Faster and how such changes in VF performance may vary based on the eyes’ glaucoma severity. Such information would be critical as large changes in VF performance (e.g., mean deviation [MD]) that are due to changes in testing strategy may be erroneously attributed to changes related to disease severity, influencing management decisions. The primary purpose of this investigation is to study the effect of changing test strategies from SITA Standard to SITA Faster on VF performance in eyes with glaucoma, and assess how such effects vary based on glaucoma severity.
Methods
This study protocol was approved by the Johns Hopkins University School of Medicine Institutional Review Board, adhered to the tenets of the Declaration of Helsinki. A waiver of consent was obtained to review VF data.
Study Participants
Patients who received VF testing at the Wilmer Eye Institute Glaucoma Center of Excellence between 2018 to 2020 were considered for this study. Eligible men and women were those with manifest glaucoma or those being followed as glaucoma suspects. Either one or both eyes were included in the data analysis. We included eyes that underwent at least three VF examinations with the following temporal sequence of testing strategies: 1) SITA Standard 2) SITA Standard 3) SITA Faster. Tests were performed using HFA II or III machines, of note, any test that was done using the SITA Faster algorithm was performed on the HFA III as this is the only device that supports this algorithm. As the purpose of the study was to assess the reproducibility and reliability of different VF strategies, eyes were not excluded from having poor reliability metrics. VF data were exported as DICOM objects from FORUM (Carl Zeiss Meditec, Dublin, CA). The following variables were obtained: testing strategy, duration, false positive (FP) errors, MD. Disease severity for each eye was calculated by averaging the intra-eye MD values over time. Mild, moderate, and advanced disease was defined as average MD better than −6 dB, between −6 dB and −12 dB, and less than −12 dB respectively.
Primary Aim: The Effect of Testing Sequence on Mean Deviation Change
Our primary aim was to investigate the effect of testing sequence on eye-level VF performance for different stages of glaucoma severity. To accomplish this goal, we made intra-eye comparisons between the first two VF exams, SITA Standard to SITA Standard (Standard-Standard sequence), and the last two VF exams, SITA Standard to SITA Faster (Standard-Faster sequence). The primary outcome variable was the difference in MD between the first and second VF in the sequence (ΔMD, calculated as MDVF2 – MDVF1). We chose to study changes in MD and not other global indices such as visual field index (VFI) or pattern standard deviation (PSD) because MD has been shown to detect significant longitudinal deterioration sooner.22 We performed exploratory analysis and created density plots of ΔMD for Standard-Standard and Standard-Faster sequences stratified by disease severity. We then compared the effect of Standard-Standard and Standard-Faster sequences on ΔMD using paired t-tests. Finally, we employed both adjusted and unadjusted multilevel mixed linear models to assess the impact of Standard-Standard and Standard-Faster sequences (independent variable) on ΔMD (dependent variable). Models included interaction terms between testing sequence and disease severity so that the effect of testing sequence on ΔMD for various stages of glaucoma could be assessed. Additionally, models incorporated random effect terms to account for the presence of multiple VFs from the same eye and multiple eyes from the same patient in the dataset. To account for the effect of confounders on ΔMD, the adjusted model incorporated terms accounting for the different lengths of time and different FP rates between the first and second VF in each sequence. Additionally, we performed a sensitivity analysis to account for the season (spring, summer, fall, winter) and time of day (morning, afternoon) of the last VF.
Secondary Aim: The Effect of Testing Strategy on Other Visual Field Parameters
A secondary aim involved determining the effect of testing strategy on other VF parameters such as FP errors and test duration for different stages of glaucoma severity. To assess this, we analyzed the last VF in the Standard-Standard and Standard-Faster sequences to determine the individual effect of Standard and Faster strategies respectively. We performed paired t-tests to assess the effect of Standard and Faster strategies on the following: test duration, FP errors, and seeding point errors (SPE). SPEs are a source of low test reliability observed in SITA Faster that is determined by low sensitivities in the four primary test points.23 Next, the impact on FPs and test duration by disease stage was visualized by creating density plots stratified by disease severity. Finally, we created multilevel linear models to assess the impact of Standard or Faster test strategy (independent variable) on the percent FPs and test duration (dependent variables) in the last VF of the sequence. Models incorporated random effects terms as described above. To account for confounders, the adjusted models included terms for disease severity as an independent variable; the adjusted model for duration also included FP errors as a possible confounder. Statistical analysis was performed R 3.5.1 (R Foundation for Statistical Computing, Vienna, Austria).
Results
The overall demographic data and unadjusted VF characteristics between the different testing strategy sequences for all eyes are shown in Table 1. Our investigation included a total of 766 eyes with a glaucoma-related diagnosis from 421 subjects with a mean age of 69.3 (SD: 13.60). Of these eyes, 488 (63.71%), 139 (18.15%), and 139 (18.15%) had mild/suspect, moderate, and severe glaucoma respectively.
Table 1.
Summary of Demographic and Visual Field Characteristics
| Population Characteristics | |||
|---|---|---|---|
| Patients, n | 421 | ||
| Eyes, n | 766 | ||
| Mean Age, years (SD) | 69.3 (13.60) | ||
| Severity of Glaucoma | Mild | Moderate | Severe |
| Mean MD, dB (SD) | −1.92 (2.32) | −8.70 (2.74) | −18.1 (5.57) |
| Eyes, n (%) | 488 (63.71) | 139 (18.15) | 139 (18.15) |
| Visual Field Characteristics | |||
| Standard-Standard | Standard-Faster | P-value | |
| Difference in MD Between First and Second VF, dB (SD) | −0.30 (3.42) | 0.23 (3.12) | 0.01 |
| Time Difference between Tests, days (SD) | 440 (760) | 394 (592) | 0.19 |
| Mean MD at Last VF, dB (SD) | −6.19 (6.94) | −5.96 (7.03) | 0.06 |
| False Positive at Last VF, % (SD) | 4.81 (6.92) | 6.82 (9.62) | <0.01 |
| Test Duration at Last VF, s (SD) | 378 (79.20) | 178 (52.60) | <0.01 |
P-values obtained from paired T. test. MD = mean deviation, SD = standard deviation, VF = visual field
ΔMD was found to be statistically different between Standard-Standard and Standard-Faster sequences (Table 1). The Standard-Faster sequence was associated with an average positive MD change (SD) of 0.23 (3.12) dB, indicating eyes appeared to slightly improve on average when transitioning to SITA Faster from SITA Standard. On the other hand, the Standard-Standard sequence was associated with an average MD change (SD) of −0.30 (3.42) dB, indicating eyes appeared to slightly worsen on average. The number (proportion) of eyes that appeared to improve (ΔMD > 0.50 dB), worsen (ΔMD < −0.50 dB), or remain the same (−0.50 dB < ΔMD < 0.50 dB) was 325 (42.43%), 271 (35.38%) and 170 (22.19%) for the Standard-Faster sequence and 270 (35.25%), 328 (42.82%) and 168 (21.93%) for the Standard-Standard sequence (p<0.01) when comparing proportions between sequences.
The duration and level of FP on the last VF were found to be statistically different between Standard-Standard and Standard-Faster sequences. The mean test duration (SD) for SITA Faster was 178 (52.60) seconds which was 52.91% shorter than SITA Standard. A greater percentage of FP errors (SD) were seen in SITA Faster (6.82 % [9.62]) compared to SITA Standard (4.81 % [6.92], p < 0.01). The frequency of SPEs was also found to be significantly higher in SITA Faster (39.03%) than SITA Standard (27.28%, p < 0.01). Lastly, the time difference between VF tests within each sequence was found to be similar and the MD of the last VF was found to be of borderline significance. The average time between VF tests (SD) was 394 (592) days and 440 (760) days for Standard-Faster and Standard-Standard sequences, respectively (p=0.19). The average MD (SD) of the last VF was -5.97 (7.03) and −6.19 (6.94) for Standard-Faster and Standard-Standard sequences, respectively (p=0.06).
Primary Aim: The Effect of Testing Sequence on Mean Deviation Change
Table 2 shows the effect of various VF parameters on ΔMD using linear multilevel modeling. Testing sequence, severity of glaucoma, time between VFs, and level of FP errors were shown to have a significant impact on the ΔMD (p<0.05). In the adjusted model, the overall effect of testing sequence on ΔMD (95% CI) was found to be 0.29 (−0.01 to 0.59) dB higher in Standard-Faster compared to Standard-Standard and was of borderline significance (p=0.06). When examining the effect of testing sequence on ΔMD by glaucoma stage, the differences in the ΔMD for Standard-Standard vs. Standard-Faster sequences were not statistically different for mild glaucoma but were statistically higher, indicating greater sensitivity in the second VF of the sequence, for moderate and advanced disease. However, despite a statistical difference in ΔMD values between the testing sequences for moderate and advanced disease, Figure 1 demonstrates that there was substantial overlap between the distribution of ΔMD for the various sequences. Additionally, ΔMD (95% CI) was also found to decrease by 0.04 (0.03 to 0.05) dB and increase by 0.11 (0.09 to 0.12) dB for every 30-day increase in time between VFs in the sequence and every one-percent FP increase on the last VF respectively (Table 2). A sensitivity analysis for the season and time of day during the last VF of each sequence and did not significantly change our main results.
Table 2.
Effect of Visual Field Testing Parameters on Change in Mean Deviation (dB) Over A Sequence of Two Visual Fields
| Unadjusted Difference in ΔMD (95% CI) | Adjusted Difference in ΔMD (95% CI) | |
|---|---|---|
| Testing Strategy Employed in VF Sequence (Standard-Faster vs. Standard-Standard) | 0.53 (0.20 to 0.85)* | 0.29 (−0.01 to 0.59) |
| Mild Glaucoma | 0.09 (−0.30 to 0.50) | −0.23 (−0.60 to 0.15) |
| Moderate | 0.99 (0.22 to 1.75)* | 0.87 (0.18 to 1.57)* |
| Advanced | 1.54 (0.80 to 2.33)* | 1.49 (0.79 to 2.19)* |
| Severity of Glaucoma | ||
| Moderate vs. Mild | −0.10 (−0.53 to 0.34) | −0.48 (−1.05 to 0.07) |
| Advanced vs. Mild | −0.95 (−1.38 to −0.51)* | 0.14 (−0.41 to 0.71) |
| 30 Day Increase in Time Between VFs | −0.04 (−0.05 to −0.03)* | −0.04 (−0.05 to −0.03)* |
| One Percent Increase in False Positives Between VFs | 0.11 (0.09 to 0.12)* | 0.11 (0.09 to 0.12)* |
ΔMD = change in mean deviation between second and first exam; dB = decibels; CI = confidence interval; FP = false-positive; VF = visual field.
p<0.05 to indicate statistical significance
Figure 1.
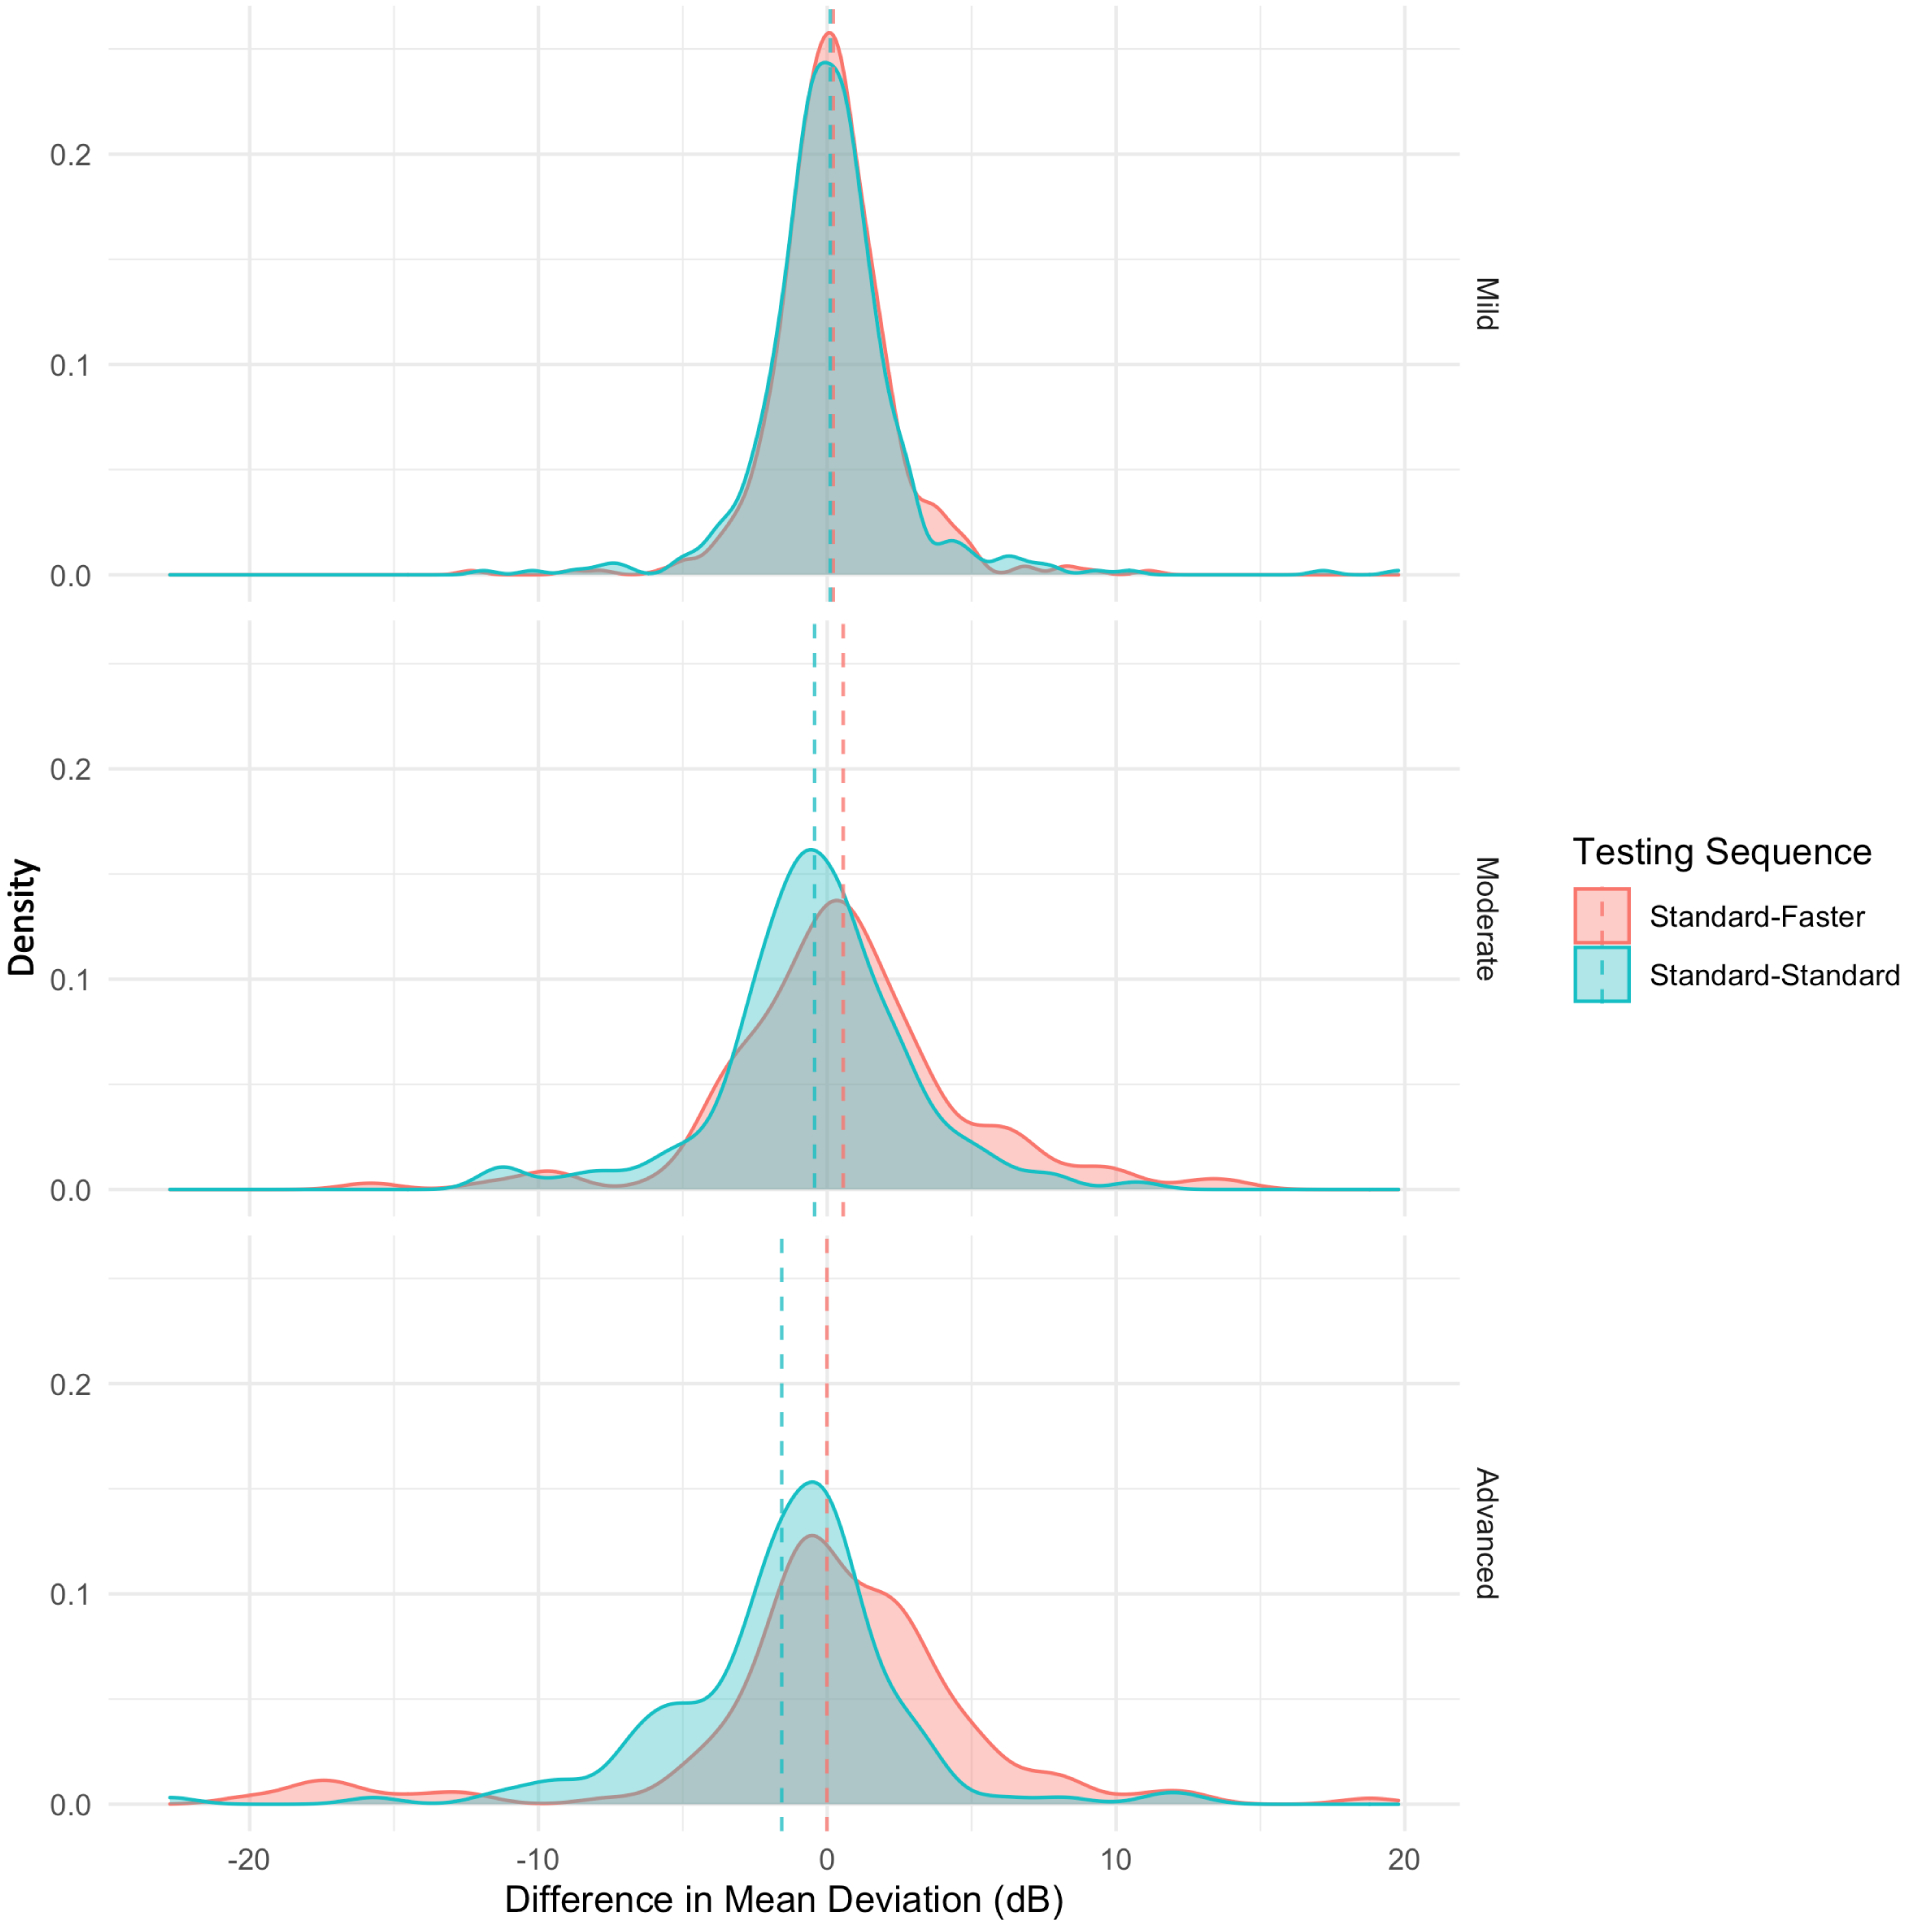
Effect of Testing Sequence on Difference in Mean Deviation Between Two Visual Fields Stratified by Disease Severity
Secondary Aim: The Effect of Testing Strategy on Other Visual Field Parameters
Table 3 demonstrates that the testing strategy and severity of disease are associated with FP errors in the last VF test of Standard-Standard or Standard-Faster sequences. In the adjusted model, the average level of FP errors (95% CI) was 2.00% (1.33 to 2.67) higher in SITA Faster than SITA Standard independent of the testing sequence. Additionally, FP errors (95% CI) were 2.08% (0.83 to 3.33) lower in advanced glaucoma in comparison with mild glaucoma. Figure 2 demonstrates the effect of testing strategy on FPs stratified by disease stage. There is a distinct difference in the distribution of FP errors between SITA Faster and SITA Standard in mild disease; however, as glaucoma advances, this difference diminishes, and FP errors become more comparable between the testing strategies.
Table 3.
Effect of Visual Field Testing Metrics on Percentage of False Positives in Last Visual Field of Sequence
| Unadjusted Effect on False Positives (95% CI) | Adjusted Effect on False positives (95% CI) | |
|---|---|---|
| Visual Field Strategy (Faster vs Standard) | 2.00 (1.33 to 2.67)* | 2.00 (1.33 to 2.67)* |
| Severity | ||
| Moderate vs. Mild | −0.96 (−2.12 to 0.20) | −0.95 (−2.10 to 0.19) |
| Advanced vs. Mild | −2.80 (−3.33 to −0.82)* | −2.08 (−3.33 to −0.83)* |
CI = confidence interval
p<0.05
Figure 2.
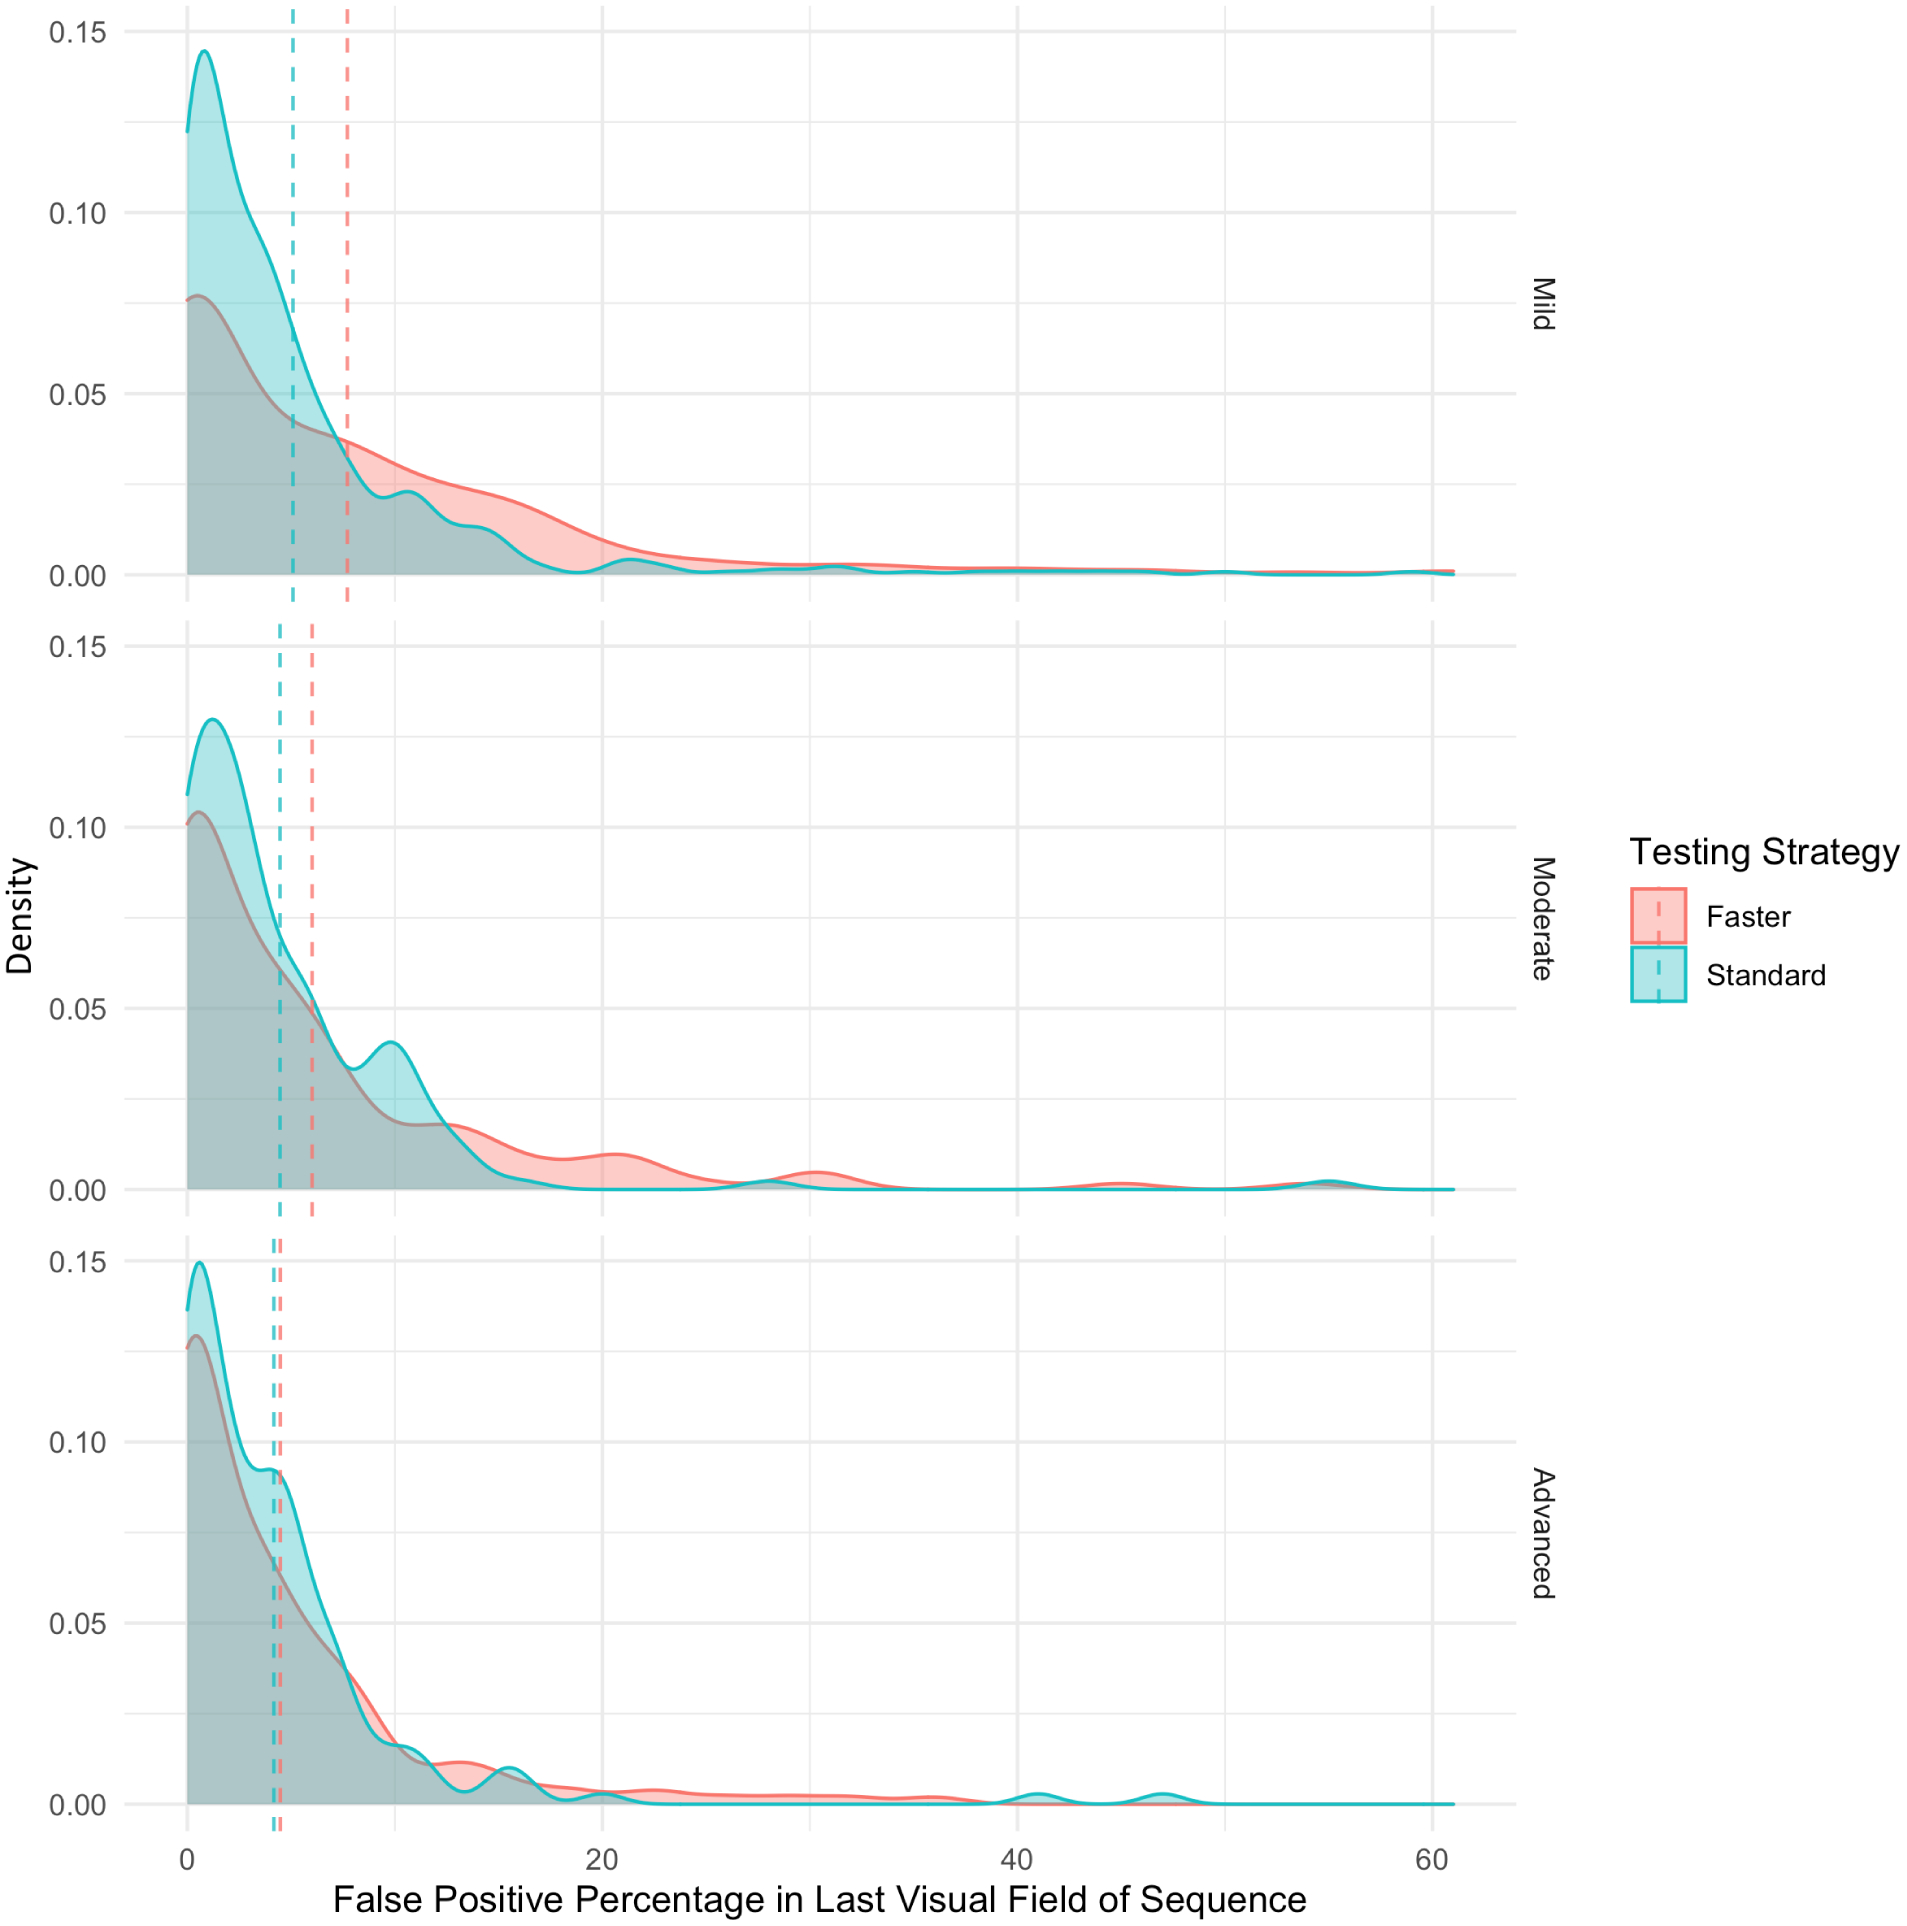
Effect of Testing Strategy on Percentage of False Positives in The Last Visual Field of Testing Sequence
Table 4 shows that the average test duration (95% CI) in SITA Faster was 203.14 (199.12 to 207.15) seconds shorter than SITA Standard on adjusted analysis. Compared to VF tests done in eyes with mild glaucoma, the test duration (95% CI) of VF tests in eyes with moderate and advanced glaucoma was 70.69 (63.86 to 77.52) seconds, and 102.55 (93.14 to 109.96) seconds longer, respectively. Test duration in later stages of disease was prolonged regardless of the testing strategy employed (Figure 3).
Table 4.
Effect of Visual Field Testing Metrics on Test Duration (Seconds) in Last Visual Field of Sequence
| Unadjusted Effect on Test Duration (95% CI) | Adjusted Effect on Test duration (95% CI) | |
|---|---|---|
| Visual Field Strategy (Standard vs. Faster) | 200.15 (196.15 to 204.15)* | 203.14 (199.12 to 207.15)* |
| Severity | ||
| Moderate vs. Mild | 73.53 (58.56 to 88.50)* | 70.69 (63.86 to 77.52)* |
| Advanced vs. Mild | 104.70 (89.72 to 119.67)* | 102.55 (93.14 to 109.96)* |
| One Percent Increase in False Positives | −0.11 (−0.83 to 0.59) | 1.49 (1.19 to 1.78)* |
CI = confidence interval
p<0.05
Figure 3.
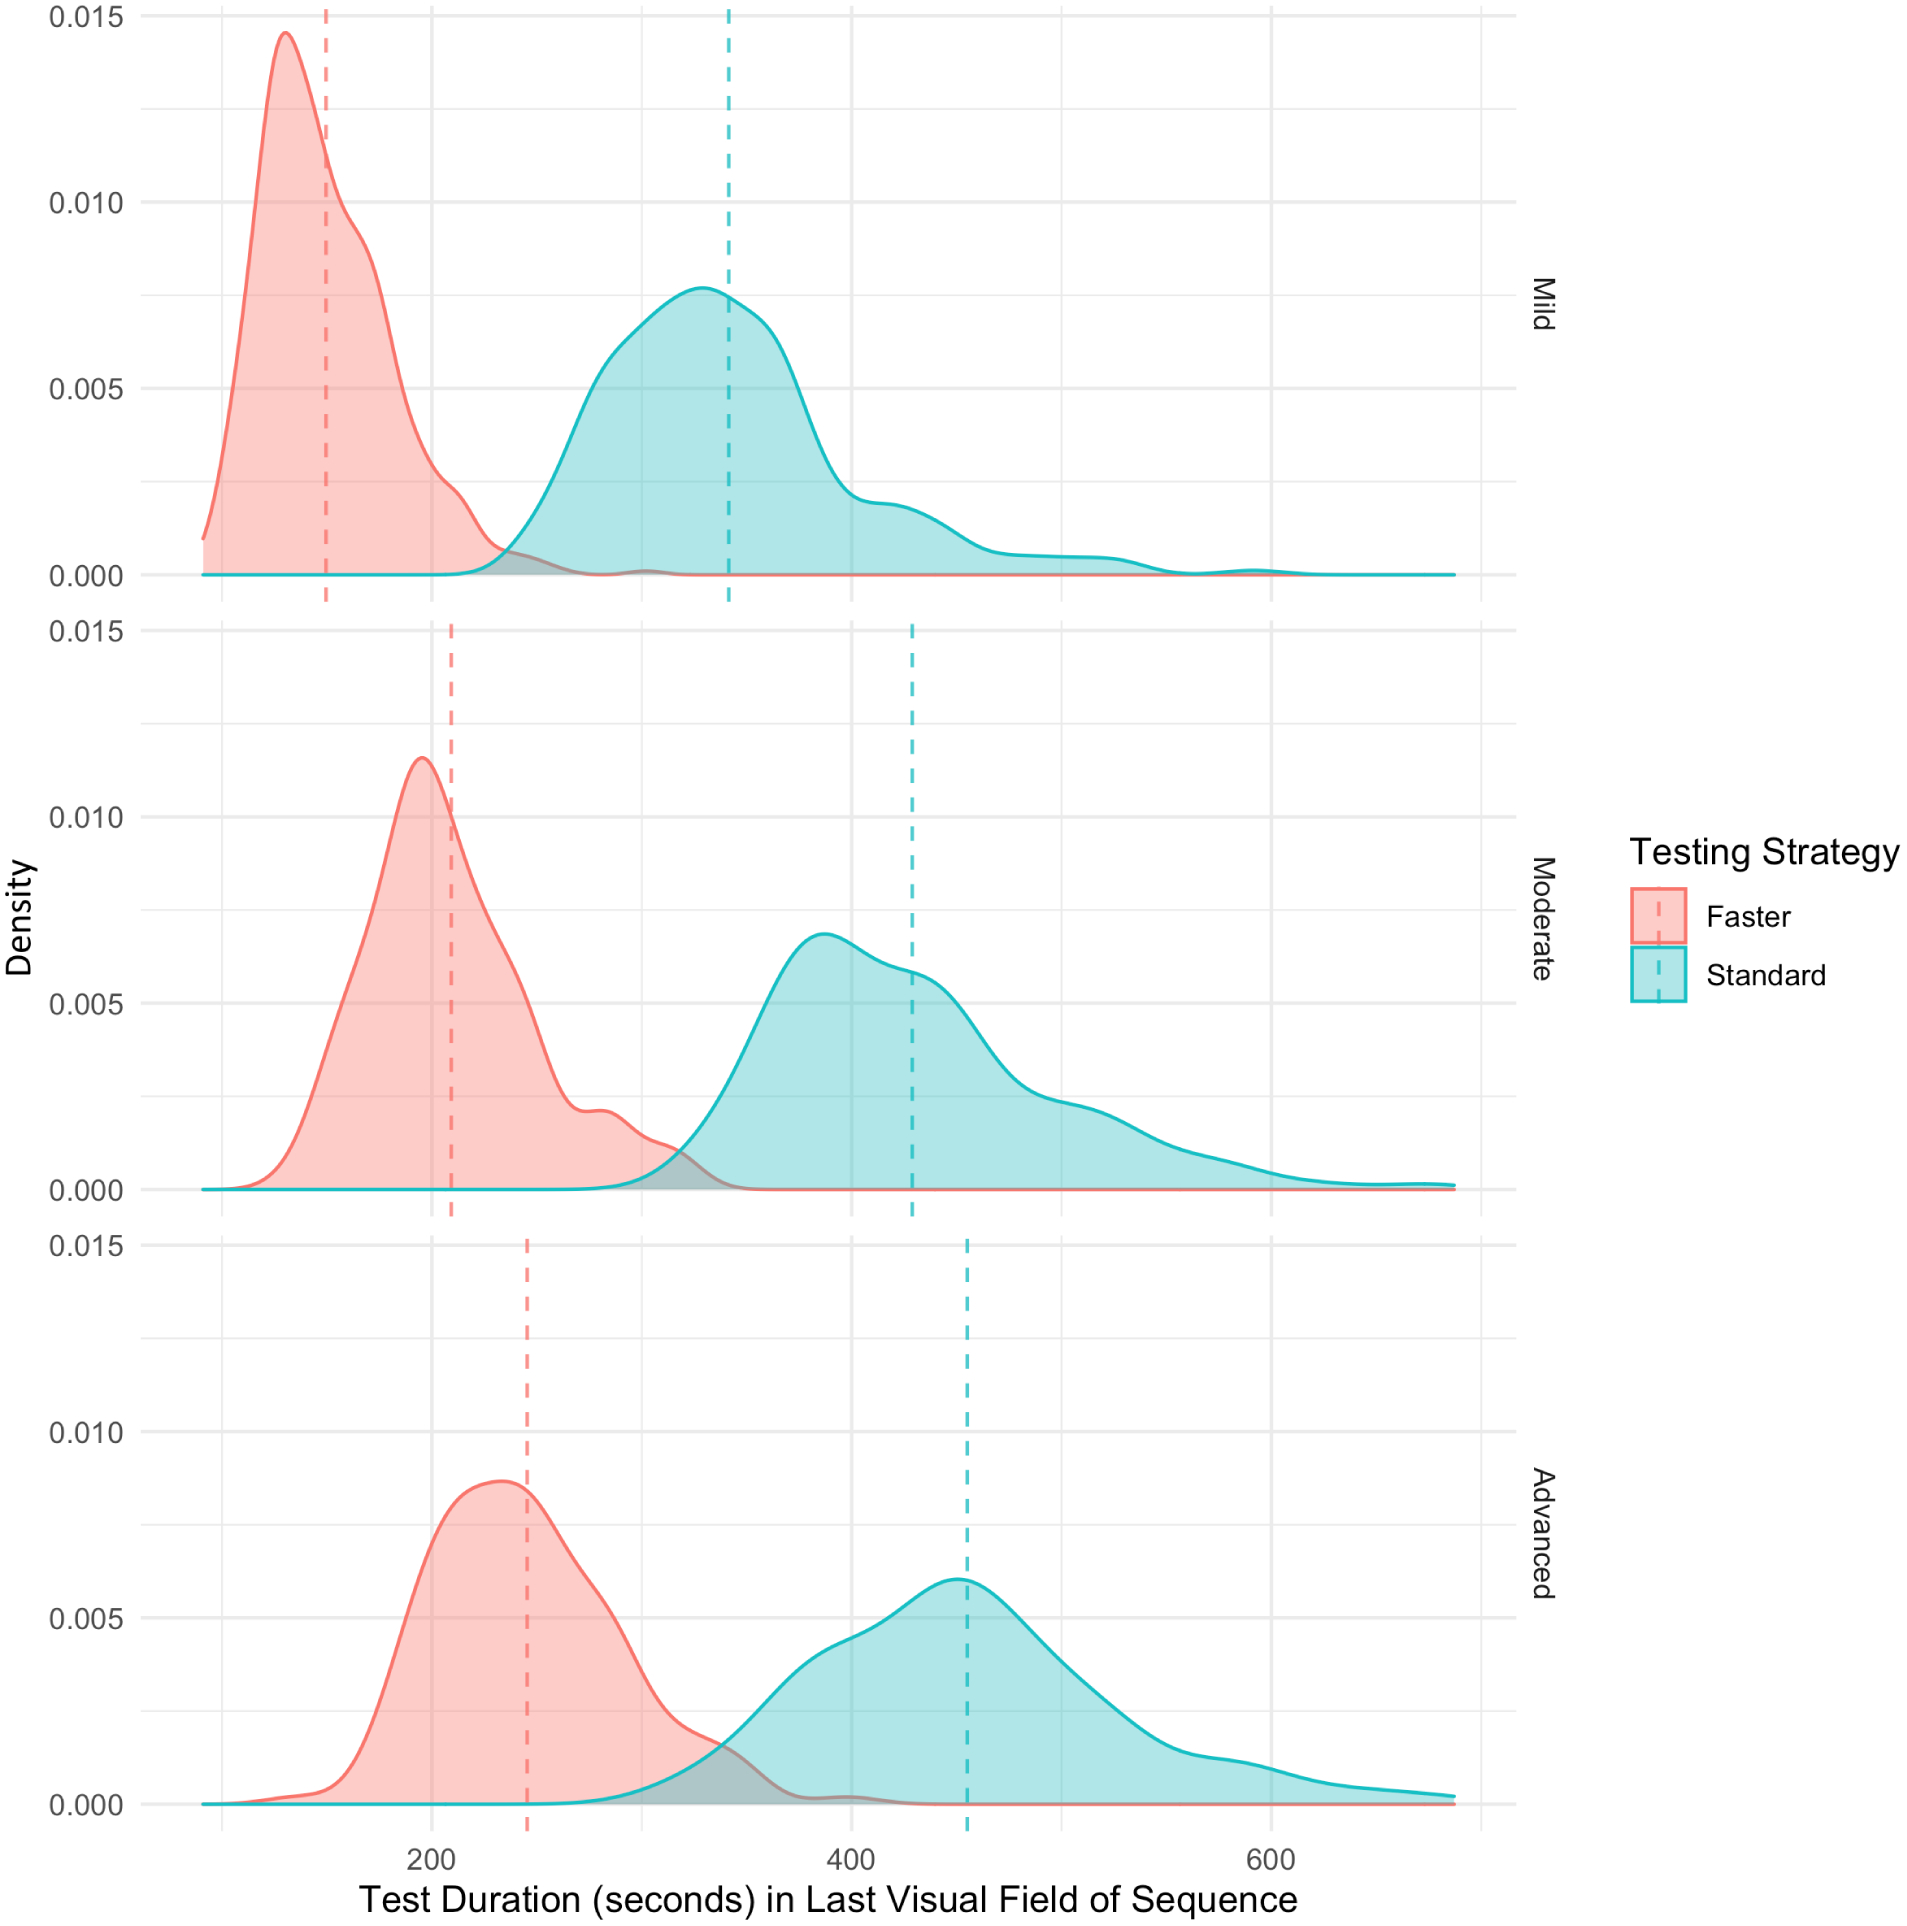
Effect of Testing Strategy on Test Duration in The Last Visual Field of Testing Sequence
Discussion
We found that eyes that transition from SITA Standard to SITA Faster in a real-world clinical setting, on average, demonstrate an improvement in visual field performance (MD) depending on disease severity. In particular, eyes that have moderate and severe disease demonstrate a greater increase in MD when transitioned to SITA Faster compared with eyes that have mild disease which on average demonstrate no change. Additionally, SITA Faster was associated with shorter test durations, greater levels of FP errors, and greater frequency of SPEs compared to SITA Standard.
Testing Sequence on Mean Deviation Change
Converting an eye from SITA Standard to SITA Faster, on average, resulted in a 0.29 dB better MD than if that eye had continued with SITA Standard testing and this finding was of borderline significance (p=0.06). While changing test strategies did not significantly impact MD values in eyes with mild disease; eyes with moderate and advanced glaucoma demonstrated a 0.87 and 1.49 dB higher (better) MD value in Standard-Faster sequence than Standard-Standard sequence. Unlike our current study which demonstrates a significant difference in longitudinal MD change between SITA Standard and SITA Faster in moderate and advanced glaucoma, previous cross-sectional studies have shown that same-day MD measurements are similar between the two strategies.19,23,24 Heijl et al. found the median MD value for SITA Faster was similar to SITA Standard (−6.42 dB and −6.44 dB respectively, p=0.91). Similarly, Lavanya et al. found similar median MD values for SITA Faster and SITA Standard (−7.6 dB and −7.3 dB, respectively, P=0.73). The discrepancy in the findings of our study and previous studies can be attributed to several differences in study demographics and design. First, previous studies may have a different spectrum of disease severity. If a study population has a greater representation of less abnormal eyes (i.e., mild or suspect disease), one may not find a significant difference in MD. In the investigation by Heijl et al., the distribution of disease severity is not specified.19 Meanwhile, the study by Phu et al. included predominantly glaucoma suspects and mild glaucoma (91.8%).23 Second, previous investigations had smaller sample sizes which may not have had enough statistical power to detect a difference. The studies by Lavanya et al., Heijl et al., and Phu et al. included 89, 126, and 196 eyes, respectively, with manifest glaucoma or suspect glaucoma while our study includes 766 eyes.19,23,24 Finally, unlike prior work which compared performance between SITA Standard and SITA Faster tests performed the same day, our study compares the effect of transitioning from SITA Standard to SITA Faster throughout routine clinical follow up (months between serial VFs) which may produce different results but is likely more in line with what is done in clinical practice.
There are multiple reasons why Standard-Faster, on average, produces higher MD values on the second VF in eyes with moderate and advanced glaucoma. First, prior work comparing SITA algorithms with Full Threshold has shown that faster perimetric tests result in higher sensitivity and MD values and these differences are accentuated in more diseased eyes.2,3,25–29 The rationale is that longer test durations result in greater visual fatigue which has been shown to impact VF measurements.30 Additional data demonstrate that eyes with more advanced glaucoma are more prone to larger visual fatigue effects.31,32 Previous studies found that SITA Fast, which had the shortest test durations at the time, tended to underestimate mean defect more than SITA Standard and Full Threshold.33,34 Hence, one may expect a similar underestimation with SITA Faster which has even shorter test times. Furthermore, being derived from SITA Fast, SITA Faster may have an increased error-related factor cutoff in comparison to SITA Standard.19,34 This leads to an earlier interruption of the stimulus sequence. Since SITA Faster begins at the age-corrected normal threshold for seed points (instead of finding the threshold value as SITA standard does), this may lead to higher threshold measurements that consequently result in higher MD values.4 We also found a greater number of SPEs with SITA Faster. This may also contribute to the difference observed since it has been demonstrated that SPEs are associated with changes in VF global indices, such as MD.35
It is important to note that although our results demonstrate a difference in the average MD change, the distributions in MD change between eyes that undergo the Standard-Faster and Standard-Standard sequences still overlap substantially as shown in Figure 1. Thus, there is still individual variance in MD change that makes it challenging to account for differences in testing strategy with a simple correction factor. Lastly, while the effects of testing sequence on VF performance are statistically significant, these differences are small, especially in less severe disease, and practitioners should determine whether they are clinically meaningful.
Testing Strategy and Disease Severity on Other Visual Field Parameters
Our data demonstrate the SITA-Faster testing strategy is associated with higher rates of FPs compared to SITA Standard and this is consistent with previous studies.19,23,24 These higher rates have been attributed to differences in the starting stimulus intensities19. SITA Standard utilizes a positive start bias in which several stimuli, that are easier to perceive, are presented before the 50% visual threshold is reached. On the other hand, SITA Faster starts near the expected visual threshold and provides less time between unseen stimuli and new stimuli, creating a more difficult testing situation that results in an inclination to respond when uncertain. Our analysis revealed that advanced glaucoma was associated with a significantly lower rate of FP errors compared to mild glaucoma. This is likely because eyes with greater field loss will have a negative start bias in which several infraluminal steps are presented before the 50% threshold is reached and this allows the patient to respond more appropriately. Thus, when we observe that FP errors become comparable between the different testing algorithms at later stages of glaucoma, this is due to field loss offsetting the difficult test conditions associated with SITA Faster. At points with greater VF loss and lower threshold sensitivities, both SITA Standard and SITA Faster begin with a starting bias that leads to similar rates of FP errors.
Additionally, we considered the impact that higher FPs seen in SITA Faster may have on MD values. We have previously demonstrated that high rates of FP errors are associated with a greater MD.36 However, although SITA Faster is associated with higher FP rates, our adjusted analysis demonstrates Standard Faster sequence increases MD independent of the effect of FP errors (Table 2). Furthermore, if higher levels of FPs were the only factor driving MD increases with SITA Faster, one would expect FP errors to be higher in moderate and advanced disease but this is not the case (Table 3).
Our clinical study has a number of strengths. Our study population is larger than previous studies evaluating SITA Faster VF performance, includes a broad range of glaucoma stages, and has a greater number of moderate and advanced cases than in previous studies.19,23,24 The present study evaluates SITA Faster in a longitudinal clinical setting as opposed to previous studies comparing same-day measurements. Because the VF data used in this study were obtained from patients with glaucoma who were being followed at a large clinical glaucoma practice, our results are representative of changes that would be seen in real-world clinical circumstances. A limitation of this investigation is the possibility of selection bias as patient conversion to SITA Faster at the glaucoma clinic was not universal. We were not able to document any patient performance challenges with the more difficult testing situation in SITA Faster although we recognize the possibility of a learning effect for naïve patients who have not had prior experience with perimetric tests that specifically begin near threshold. In addition, we only studied MD as a metric to monitor disease progression because it was shown to detect longitudinal deterioration sooner.22 We did not study other summary measures such as the VFI and PSD. Another way to monitor glaucoma progression is to observe changes in individual point data such as threshold sensitivities, total deviation, pattern deviation, and their associated probability scores which we did not analyze in the present study. Lastly, there were varying amounts of time between VF examinations among different eyes. However, the mean rate of VF over time in glaucoma patients is low and we also adjusted for the time between tests in our modeling.37
Our results indicate that transitioning from SITA Standard to SITA Faster is associated with improved VF performance in eyes with moderate and advanced glaucoma but no difference in VF performance in eyes with mild glaucoma. SITA Faster testing is also associated with a higher rate of FP errors and shorter test durations. Overall, changing testing strategies from SITA Standard to SITA Faster may obscure the detection of worsening disease in those with more severe stages of glaucoma at baseline, and clinicians should consider this effect when implementing this transition.
Financial Support:
Supported by grants from the National Institute of Health 5K12EY015025-14
Abbreviations and Acronyms:
- dB
decibels
- FP
false positive
- HFA
Humphrey Visual Field Analyzer
- MD
mean deviation
- SAP
standard automated perimetry
- SITA
Swedish Interactive Thresholding Algorithm
- SPE
seeding point error
- PSD
pattern standard deviation
- VF
visual field
- VFI
visual field index
Footnotes
Publisher's Disclaimer: This is a PDF file of an unedited manuscript that has been accepted for publication. As a service to our customers we are providing this early version of the manuscript. The manuscript will undergo copyediting, typesetting, and review of the resulting proof before it is published in its final form. Please note that during the production process errors may be discovered which could affect the content, and all legal disclaimers that apply to the journal pertain.
Meeting Presentation: American Glaucoma Society 2021
Conflict of Interest: A.T. Pham. None; M.V. Boland, Carl Zeiss Meditec; P.Y. Ramulu, None; J. Yohannan, None
References
- 1.Jampel HD, Singh K, Lin SC, et al. Assessment of Visual Function in Glaucoma: A Report by the American Academy of Ophthalmology. Ophthalmology. 2011;118(5):986–1002. doi: 10.1016/j.ophtha.2011.03.019 [DOI] [PubMed] [Google Scholar]
- 2.Shirato S, Inoue R, Fukushima K, Suzuki Y. Clinical evaluation of SITA: a new family of perimetric testing strategies. Graefes Arch Clin Exp Ophthalmol. 1999;237(1):29–34. doi: 10.1007/s004170050190 [DOI] [PubMed] [Google Scholar]
- 3.Sharma AK, Goldberg I, Graham SL, Mohsin M. Comparison of the Humphrey swedish interactive thresholding algorithm (SITA) and full threshold strategies. J Glaucoma. 2000;9(1):20–27. doi: 10.1097/00061198-200002000-00005 [DOI] [PubMed] [Google Scholar]
- 4.Artes PH, Iwase A, Ohno Y, Kitazawa Y, Chauhan BC. Properties of perimetric threshold estimates from Full Threshold, SITA Standard, and SITA Fast strategies. Invest Ophthalmol Vis Sci. 2002;43(8):2654–2659. [PubMed] [Google Scholar]
- 5.Sekhar GC, Naduvilath TJ, Lakkai M, et al. Sensitivity of Swedish interactive threshold algorithm compared with standard full threshold algorithm in Humphrey visual field testing. Ophthalmology. 2000;107(7):1303–1308. doi: 10.1016/s0161-6420(00)00140-8 [DOI] [PubMed] [Google Scholar]
- 6.Flammer J, Drance SM, Zulauf M. Differential light threshold. Short- and long-term fluctuation in patients with glaucoma, normal controls, and patients with suspected glaucoma. Arch Ophthalmol. 1984;102(5):704–706. doi: 10.1001/archopht.1984.01040030560017 [DOI] [PubMed] [Google Scholar]
- 7.Gardiner SK, Swanson WH, Goren D, Mansberger SL, Demirel S. Assessment of the Reliability of Standard Automated Perimetry in Regions of Glaucomatous Damage. Ophthalmology. 2014;121(7):1359–1369. doi: 10.1016/j.ophtha.2014.01.020 [DOI] [PMC free article] [PubMed] [Google Scholar]
- 8.Heijl A, Lindgren G, Olsson J. Normal Variability of Static Perimetric Threshold Values Across the Central Visual Field. Arch Ophthalmol. 1987;105(11):1544–1549. doi: 10.1001/archopht.1987.01060110090039 [DOI] [PubMed] [Google Scholar]
- 9.Chauhan BC, Garway-Heath DF, Goni FJ, et al. Practical recommendations for measuring rates of visual field change in glaucoma. British Journal of Ophthalmology. 2008;92(4):569–573. doi: 10.1136/bjo.2007.135012 [DOI] [PMC free article] [PubMed] [Google Scholar]
- 10.Nouri-Mahdavi K, Zarei R, Caprioli J. Influence of Visual Field Testing Frequency on Detection of Glaucoma Progression With Trend Analyses. Arch Ophthalmol. 2011;129(12):1521–1527. doi: 10.1001/archophthalmol.2011.224 [DOI] [PubMed] [Google Scholar]
- 11.Perdicchi A, Abdolrahimzadeh S, Cutini A, Ciarnella A, Scuderi GL. Evaluation of the progression of visual field damage in patients suffering from early manifest glaucoma. Clin Ophthalmol. 2016;10:1647–1651. doi: 10.2147/OPTH.S113995 [DOI] [PMC free article] [PubMed] [Google Scholar]
- 12.Wu Z, Saunders LJ, Daga FB, Diniz-Filho A, Medeiros FA. Frequency of Testing to Detect Visual Field Progression Derived Using a Longitudinal Cohort of Glaucoma Patients. Ophthalmology. 2017;124(6):786–792. doi: 10.1016/j.ophtha.2017.01.027 [DOI] [PubMed] [Google Scholar]
- 13.Elam AR, Lee PP. High-Risk Populations for Vision Loss and Eye Care Underutilization: A Review of the Literature and Ideas on Moving Forward. Survey of Ophthalmology. 2013;58(4):348–358. doi: 10.1016/j.survophthal.2012.07.005 [DOI] [PubMed] [Google Scholar]
- 14.Gower EW, Silverman E, Cassard SD, Williams SK, Baldonado K, Friedman DS. Barriers to Attending an Eye Examination after Vision Screening Referral within a Vulnerable Population. Journal of Health Care for the Poor and Underserved. 2013;24(3):1042–1052. doi: 10.1353/hpu.2013.0134 [DOI] [PubMed] [Google Scholar]
- 15.Owsley C, McGwin G, Scilley K, Girkin CA, Phillips JM, Searcey K. Perceived Barriers to Care and Attitudes about Vision and Eye Care: Focus Groups with Older African Americans and Eye Care Providers. Invest Ophthalmol Vis Sci. 2006;47(7):2797–2802. doi: 10.1167/iovs.06-0107 [DOI] [PubMed] [Google Scholar]
- 16.Malik R, Baker H, Russell RA, Crabb DP. A survey of attitudes of glaucoma subspecialists in England and Wales to visual field test intervals in relation to NICE guidelines. BMJ Open. 2013;3(5). doi: 10.1136/bmjopen-2012-002067 [DOI] [PMC free article] [PubMed] [Google Scholar]
- 17.Crabb DP, Russell RA, Malik R, et al. Frequency of Visual Field Testing When Monitoring Patients Newly Diagnosed with Glaucoma: Mixed Methods and Modelling. NIHR Journals Library; 2014. Accessed June 27, 2020. http://www.ncbi.nlm.nih.gov/books/NBK259972/ [PubMed] [Google Scholar]
- 18.Boodhna T, Crabb DP. More frequent, more costly? Health economic modelling aspects of monitoring glaucoma patients in England. BMC Health Serv Res. 2016;16(1):611. doi: 10.1186/s12913-016-1849-9 [DOI] [PMC free article] [PubMed] [Google Scholar]
- 19.Heijl A, Patella VM, Chong LX, et al. A New SITA Perimetric Threshold Testing Algorithm: Construction and a Multicenter Clinical Study. Am J Ophthalmol. 2019;198:154–165. doi: 10.1016/j.ajo.2018.10.010 [DOI] [PubMed] [Google Scholar]
- 20.Infection Control: Severe acute respiratory syndrome coronavirus 2 (SARS-CoV-2) | CDC. Accessed September 3, 2020. https://www.cdc.gov/coronavirus/2019-ncov/hcp/infection-control-recommendations.html
- 21.Operational Considerations for Adapting a Contact Tracing Program to Respond to the COVID-19 Pandemic | CDC. AccessedSeptember 3, 2020. https://www.cdc.gov/coronavirus/2019-ncov/global-covid-19/operational-considerations-contact-tracing.html
- 22.Gardiner SK, Demirel S. Detecting change using standard global perimetric indices in glaucoma. Am J Ophthalmol. 2017;176:148–156. doi: 10.1016/j.ajo.2017.01.013 [DOI] [PMC free article] [PubMed] [Google Scholar]
- 23.Phu J, Khuu SK, Agar A, Kalloniatis M. Clinical Evaluation of Swedish Interactive Thresholding Algorithm-Faster Compared With Swedish Interactive Thresholding Algorithm-Standard in Normal Subjects, Glaucoma Suspects, and Patients With Glaucoma. Am J Ophthalmol. 2019;208:251–264. doi: 10.1016/j.ajo.2019.08.013 [DOI] [PubMed] [Google Scholar]
- 24.Lavanya R, Riyazuddin M, Dasari S, et al. A Comparison of the Visual Field Parameters of SITA Faster and SITA Standard Strategies in Glaucoma. Journal of Glaucoma. 2020;Publish Ahead of Print. doi: 10.1097/IJG.0000000000001551 [DOI] [PubMed] [Google Scholar]
- 25.Nordmann JP, Brion F, Hamard P, Mouton-Chopin D. [Evaluation of the Humphrey perimetry programs SITA Standard and SITA Fast in normal probands and patients with glaucoma]. J Fr Ophtalmol. 1998;21(8):549–554. [PubMed] [Google Scholar]
- 26.Budenz DL, Rhee P, Feuer WJ, McSoley J, Johnson CA, Anderson DR. Comparison of glaucomatous visual field defects using standard full threshold and Swedish interactive threshold algorithms. Arch Ophthalmol. 2002;120(9):1136–1141. doi: 10.1001/archopht.120.9.1136 [DOI] [PubMed] [Google Scholar]
- 27.Aoki Y, Takahashi G, Kitahara K. Comparison of Swedish interactive threshold algorithm and full threshold algorithm for glaucomatous visual field loss. Eur J Ophthalmol. 2007;17(2):196–202. doi: 10.1177/112067210701700208 [DOI] [PubMed] [Google Scholar]
- 28.Wild JM, Pacey IE, O’Neill EC, Cunliffe IA. The SITA Perimetric Threshold Algorithms in Glaucoma. Invest Ophthalmol Vis Sci. 1999;40(9):1998–2009. [PubMed] [Google Scholar]
- 29.Jm W, Ie P, Sa H, Ia C. Between-algorithm, between-individual differences in normal perimetric sensitivity: full threshold, FASTPAC, and SITA. Swedish Interactive Threshold algorithm. Investigative ophthalmology & visual science. Published May 1999.AccessedSeptember 16, 2020. https://pubmed.ncbi.nlm.nih.gov/10235548/ [PubMed] [Google Scholar]
- 30.Hudson C, Wild JM, O’Neill EC. Fatigue effects during a single session of automated static threshold perimetry. Invest Ophthalmol Vis Sci. 1994;35(1):268–280. [PubMed] [Google Scholar]
- 31.Heijl A Time changes of contrast thresholds during automatic perimetry. Acta Ophthalmol (Copenh). 1977;55(4):696–708. doi: 10.1111/j.1755-3768.1977.tb05668.x [DOI] [PubMed] [Google Scholar]
- 32.Heijl A, Drance SM. Changes in differential threshold in patients with glaucoma during prolonged perimetry. Br J Ophthalmol. 1983;67(8):512–516. doi: 10.1136/bjo.67.8.512 [DOI] [PMC free article] [PubMed] [Google Scholar]
- 33.Bengtsson B, Heijl A. Comparing significance and magnitude of glaucomatous visual field defects using the SITA and Full Threshold strategies. Acta Ophthalmologica Scandinavica. 1999;77(2):143–146. doi: 10.1034/j.1600-0420.1999.770205.x [DOI] [PubMed] [Google Scholar]
- 34.Bengtsson B, Heijl A. SITA Fast, a new rapid perimetric threshold test. Description of methods and evaluation in patients with manifest and suspect glaucoma. Acta Ophthalmol Scand. 1998;76(4):431–437. doi: 10.1034/j.1600-0420.1998.760408.x [DOI] [PubMed] [Google Scholar]
- 35.Phu J, Kalloniatis M. A Strategy for Seeding Point Error Assessment for Retesting (SPEAR) in Perimetry Applied to Normal Subjects, Glaucoma Suspects, and Patients With Glaucoma. American Journal of Ophthalmology. 2021;221:115–130. doi: 10.1016/j.ajo.2020.07.047 [DOI] [PubMed] [Google Scholar]
- 36.Yohannan J, Wang J, Brown J, et al. Evidence-based Criteria for Assessment of Visual Field Reliability. Ophthalmology. 2017;124(11):1612–1620. doi: 10.1016/j.ophtha.2017.04.035 [DOI] [PMC free article] [PubMed] [Google Scholar]
- 37.Chauhan BC, Malik R, Shuba LM, Rafuse PE, Nicolela MT, Artes PH. Rates of Glaucomatous Visual Field Change in a Large Clinical Population. Invest Ophthalmol Vis Sci. 2014;55(7):4135–4143. doi: 10.1167/iovs.14-14643 [DOI] [PubMed] [Google Scholar]