Abstract
Background and Aims
Hepatoblastoma (HBL) is a devastating pediatric liver cancer with multiple treatment options, but it ultimately requires surgery for a cure. The most malicious form of HBL is a chemo‐resistant aggressive tumor that is characterized by rapid growth, metastases, and poor response to treatment. Very little is known of the mechanisms of aggressive HBL, and recent focuses have been on developing alternative treatment strategies. In this study, we examined the role of human chromosomal regions, called aggressive liver cancer domains (ALCDs), in liver cancer and evaluated the mechanisms that activate ALCDs in aggressive HBL.
Results
We found that ALCDs are critical regions of the human genome that are located on all human chromosomes, preferentially in intronic regions of the oncogenes and other cancer‐associated genes. In aggressive HBL and in patients with Hepatocellular (HCC), JNK1/2 phosphorylates p53 at Ser6, which leads to the ph‐S6‐p53 interacting with and delivering the poly(adenosine diphosphate ribose) polymerase 1 (PARP1)/Ku70 complexes on the oncogenes containing ALCDs. The ph‐S6‐p53‐PARP1 complexes open chromatin around ALCDs and activate multiple oncogenic pathways. We found that the inhibition of PARP1 in patient‐derived xenografts (PDXs) from aggressive HBL by the Food and Drug Administration (FDA)–approved inhibitor olaparib (Ola) significantly inhibits tumor growth. Additionally, this is associated with the reduction of the ph‐S6‐p53/PARP1 complexes and subsequent inhibition of ALCD‐dependent oncogenes. Studies in cultured cancer cells confirmed that the Ola‐mediated inhibition of the ph‐S6‐p53‐PARP1‐ALCD axis inhibits proliferation of cancer cells.
Conclusions
In this study, we showed that aggressive HBL is moderated by ALCDs, which are activated by the ph‐S6‐p53/PARP1 pathway. By using the PARP1 inhibitor Ola, we suppressed tumor growth in HBL‐PDX models, which demonstrated its utility in future clinical models.
Abbreviations
- ALCD
aggressive liver cancer domain
- ChIP
chromatin immunoprecipitation assay
- cDNA
complementary DNA
- C/EBP
CCAAT/enhancer binding protein
- co‐IP
co‐immunoprecipitation
- CTNNB1
catenin (cadherin‐associated protein) beta 1
- CYP
cytochrome P450
- GPC3
glypican 3
- HACE1
HECT domain and ankyrin repeat containing E3 ubiquitin protein ligase 1
- HBL
hepatoblastoma
- H&E
hematoxylin and eosin
- HNF4α
hepatocyte nuclear factor 4α
- MW
molecular weight
- NRF2
nuclear erythroid 2 p45‐related factor 2
- Ola
olaparib
- PARP1
poly(adenosine diphosphate ribose) polymerase 1
- PDX
patient‐derived xenograft
- PGAP1
post‐GPI attachment to proteins inositol deacylase 1
- qRT‐PCR
quantitative reverse‐transcription PCR
- RUNDC1
RUN domain‐containing protein 1
- SEC
size exclusion chromatography
- SLC
solute carrier family
- TSP
tumor suppressor protein
- TF
transcription factor
- Veh
vehicle
- WB
western blot
Hepatoblastoma (HBL) is the most common pediatric liver cancer, typically affecting children in their first 3 years.( 1 , 2 , 3 ) While overall survival for HBL has improved through cisplatin‐based chemotherapy and subsequent resection, a substantial number of patients experience metastasis or are faced with aggressive tumors, which do not respond favorably to chemotherapy or can be unresectable.( 4 , 5 ) Hepatocellular (HCC) is characterized by multiple genetic mutations, whereas HBL has a very low level of genetic mutations: 1.9% per case, primarily in the catenin (cadherin‐associated protein) beta 1 (CTNNB1) and nuclear erythroid 2 p45‐related factor 2 (NRF2) genes.( 6 , 7 , 8 , 9 ) This suggests that epigenetic and posttranslational modifications are critical in HBL. Previously, we identified modifications of tumor suppressors CCAAT/enhancer binding protein (C/EBP)–alpha and CUGBP1 within HBL, which are converted into oncogenes. ( 10 , 11 )
CTNNB1 is one of the most frequently mutated genes in liver cancer.( 12 , 13 , 14 ) The CTNNB1 gene encodes a Wnt ligand response co‐activator, beta‐catenin. Very often, the functions of beta‐catenin are associated with WNT signaling and are presented as WNT/beta‐catenin signaling.( 14 , 15 , 16 ) The known pathways of activation of beta‐catenin are translocation of the beta‐catenin protein from the cell surface to nucleus,( 17 ) and mutations within the protein beta‐catenin.( 14 , 16 , 17 ) In the nucleus, beta‐catenin interacts with the transcription factor, Transcription Factor 4 and activates expression of cancer genes.( 16 , 17 ) We have found that the beta‐catenin gene contains chromatin regions called aggressive liver cancer domains (ALCDs) that are repressed in normal liver while open/activated in HBL.( 18 ) In addition to activation of beta‐catenin, ALCDs activate many other oncogenic pathways.( 18 )
Recent studies have revealed that oncogenic forms of tumor suppressor proteins (TSPs) and posttranslational modifications play a role in the development of HBL.( 10 , 11 ) For example, C/EBP‐alpha, which is a TSP and a strong inhibitor of liver proliferation, is activated by ALCDs and is converted to an oncogene by de‐phosphorylation at serine 190.( 10 , 18 , 19 , 20 ) Moreover, the mouse model with an oncogenic form of C/EBP‐alpha shows the development of spontaneous liver cancer by initiating the de‐differentiation of hepatocytes into cancer cells.( 10 )
In this study, we found that another TSP, p53, is converted into a protein with oncogenic activity by JNK1/2‐dependent phosphorylation at serine 6. The oncogenic activity of ph‐S6‐p53 is associated with delivery of poly(adenosine diphosphate ribose) polymerase 1 (PARP1)/Ku70 complexes to ALCDs, and subsequent activation of multiple oncogenic pathways. We found that inhibition of the ph‐S6‐p53‐PARP1‐ALCD axis in patient‐derived xenografts (PDXs) with the PARP1 inhibitor, Olaparib (Ola), inhibits growth of aggressive HBL.
Experimental Procedures
Animals
Animal experiments were approved by the Institutional Animal Care and Use Committee (IACUC) at Cincinnati Children’s Hospital (protocol IACUC2014‐0042).
Generation of PDXs
Five well‐established PDX lines from patients with HBL( 21 ) were selected based on elevation of PARP1 and p53 (Supporting Table S1 and Fig. 4A). All models were developed in athymic nude mice, in which the tumor was implanted into the interscapular region. Tumors were serially transplanted into recipient mice and were compared to confirm preservation of histological features. Each study arm consisted of three mice per patient’s HBL; thus, our control arm had 15 mice along with 15 in the Ola group.
FIG. 4.
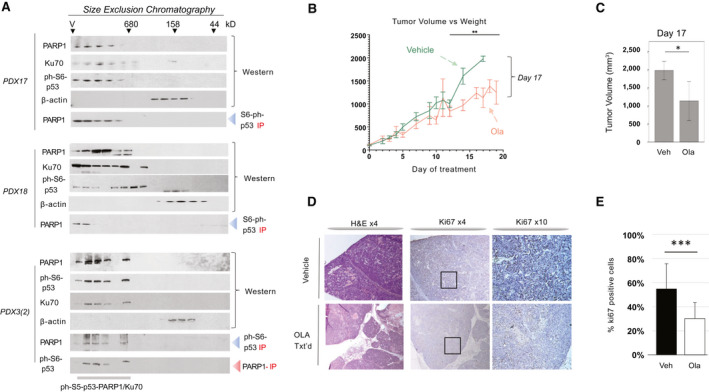
Treatments of HBL PDXs by Ola inhibit tumor growth of engrafted HBL. (A) Examination of three PDXs by SEC shows that PDXs preserve the ph‐S6‐p53/PARP1/Ku70 complexes. PDXs 17 and 18 are from the Cincinnati Children’s Hospital Medical Center and present examination of the first generation of PDXs. PDX 3(2) is from the regenerated set of PDXs.( 21 ) Nuclear proteins were fractionated on SEC600 column, and levels of proteins in each fraction of SEC were examined by WB. Co‐IP shows the complexes. (B) Tumor volume of the control and Ola‐treated PDXs at different time points after initiation. Fifteen control and 15 Ola‐treated PDXs from 5 patients were used. (C) A summary of tumor volume at day 17. (D) H&E and ki67 staining of the HBL in control and Ola‐treated PDXs. (E) Quantitation of ki67 staining. Abbreviation: Veh, vehicle.
Mice did not receive vehicle or Ola before confirmation of tumor growth (approximately 10‐14 days). Calipers were used to measure the width and length of the tumor. The following formula was used to calculate the tumor volume (in cubic millimeters): = (length [mm] × width [mm]2)/2. Treatment was initiated for tumors when they reached a volume of 100 mm3. Control vehicle (10% DMSO/90% of 0.5% methylcellulose) was dosed at 10 mL/kg per os every day up to 19 days. Ola (10% DMSO/60% HP‐beta‐CD) was dosed at 50 mg/kg per os every day up to 19 days. When tumors reached 864 mm3 to 1,764 mm3, mice were sacrificed following IACUC guidelines. Tumor, liver, and serum were collected for investigations described subsequently.
Immunohistochemistry
PDX sections were fixed in 4% paraformaldehyde, embedded in paraffin, and sectioned (6‐m sections). Immunohistochemistry for ki67 was completed on HBL samples from PDXs. Multiple sections (three to four per specimen) of tumors were evaluated at ×10 microscopy. Cell counts were verified by two investigators. Average count per specimen and arm of study were accumulated, and Student t test was used to compare total counts.
Clinical and Histological Data on Pediatric Patients With HBL and Adult Patients With HCC
This study underwent review and was approved before undertaking by the institutional review board (IRB) at the Cincinnati Children’s Hospital Medical Center and the University of Cincinnati Medical Center. Informed consent was obtained by each study patient before obtaining specimens. Additionally, all ethical guidelines and consents were obtained by XenTech (Évry‐Courcouronnes, France) per French legislation for samples used in the PDX models.
Real‐Time Quantitative Reverse‐Transcription PCR
Total RNA was isolated from mouse and human livers and tumors.( 18 , 19 ) Complementary DNA (cDNA) was synthesized with 2 μg of total RNA using a High‐Capacity cDNA Reverse Transcription Kit (Applied Biosystems, Foster City, CA). cDNA was diluted 5 times and subsequently used for reverse‐transcription PCR with the TaqMan Gene Expression system (Applied Biosystems). Gene‐expression analysis was performed using the TaqMan Universal PCR Master Mix (Applied Biosystems) according to instructions. The list of probe mixtures for quantitative reverse‐transcription PCR (qRT‐PCR) is shown in the Supporting Information. Levels of all mRNAs were normalized to 18S ribosomal RNA. Results were analyzed using the Delta Ct (2‐ΔΔCT) method, and comparisons are described within each figure. The qRT‐PCR results were confirmed on two to three studies in duplicates.
Antibodies, Protein Isolation, Western Blotting, Co‐immunoprecipitation
Nuclear, cytoplasmic, and whole cell extracts were prepared as previously described.( 18 , 19 ) The protein lysates were isolated from tumor sections and from adjacent regions (background) of livers of the same patients with HBL and HCC. Proteins from background and tumor sections (50 µg) were loaded on 4%‐20% gradient gels (Bio‐Rad Laboratories, Hercules, CA) and transferred to nitrocellulose membranes (Bio‐Rad). Co‐immunoprecipitations were performed using an improved TrueBlot protocol as previously described.( 18 ) See the Supporting Information for the list of antibodies used and for more details of the protein isolation and western blotting (WB). Whole images of WB are shown in the Supporting Information.
HPLC‐Based Size Exclusion Chromatography
To determine the size of ph‐S6/p53/PARP1 complexes, nuclear proteins from background sections and from tumor sections of HBL and HCC were separated on HPLC size exclusion chromatography (SEC) column (SEC600; Bio‐Rad). Proteins from SEC fractions were loaded on denaturing 4%‐20% acrylamide gel and examined by WB with antibodies to ph‐S6‐p53, PARP1, Ku70, and β‐actin. More details for HPLC‐based SEC can be found in our previous papers.( 18 , 19 )
Proliferation Assay
Huh6 and HepG2 cells were seeded in 96‐well plates at 5 × 10⁴. Cells were treated with Ola (1 μm, 5 μm, and 20 μm), SP600125 (5 μm and 10 μm) and with combinations of Ola plus SP600125 for 48 hours. Then the CCK‐8 reagent (Sigma‐Aldrich, St. Louis, MO) was added into each well and incubated for 4 hours, followed by an absorbance reading at 450 nm on a microplate reader. Each experiment had six repeats per treatment and was repeated 3 times. The proliferation rate was calculated by comparing the absorbance of the treated and nontreated well after 48 hours, with the 0‐hour nontreated well.
Chromatin Immunoprecipitation Assay
Chromatin immunoprecipitation assay (ChIP) assays were performed as described in our previous studies.( 18 , 19 ) Primers for beta‐catenin and NRF2 ALCDs can be found in our previous study.( 18 )
Locations of ALCDs Within Corresponding Genes
For gene‐specific locations, ALCD sequences were compared against the Homo sapiens GRCh 38 genome build using the BLAST‐like alignment tool (BLAT). (Further analyses indicated the location of ALCD sequences within promoters, introns, or exons of corresponding genes). BLAT analysis was performed using the Ensembl Genome Browser (Ensembl.org).
Statistical Analysis
All values are presented as means ± SEM. Either GraphPad Prism 6.0 software (GraphPad, San Diego, CA) or JMP (Cary, NC) were used for statistical analyses. An unpaired Student t test was applied for comparison of normally distributed data, which was confirmed by analyzing Gaussian distribution. Two‐way ANOVA analysis was used with a Bonferroni test for multiple comparisons between different time points if the P value was less than 0.05. Statistical significance was defined as *P < 0.05, **P < 0.01, ***P < 0.001, and ****P < 0.0001. All statistical analysis was done using GraphPad Prism 6.0.
Results
Locations of HBL‐Specific ALCDs on Human Chromosomes and Within Cancer Genes
Our previous studies showed that chromosomal regions, ALCDs, are repressed in normal liver but are open in oncogenes in patients with pediatric liver cancer.( 18 ) To further understand the role of ALCDs in liver disorders, we examined the localization of these domains on chromosomes and within cancer genes. With the exception of chromosomes 8 and 21, all human chromosomes contain one or more ALCDs that are activated in aggressive HBL (Fig. 1A). Five ALCDs are detected on chromosomes 3, 9, and 17, suggesting that these have substantial portions of the DNA that are open for transcription in livers of patients with HBL. Examination of the locations of ALCDs in 38 individual cancer genes showed that two genes, LINK03341 and C/EBPα, have ALCDs located in their promoters, whereas other genes have ALCDs located in introns (Fig. 1B). This suggests that ALCDs activate genes through long‐distance interactions of proteins bound to ALCDs with proteins that are bound to the promoters. Further studies of such interactions need detailed examination of transcription factors (TFs), which may be interacting with ALCDs and involved in activating cancer genes.
FIG. 1.
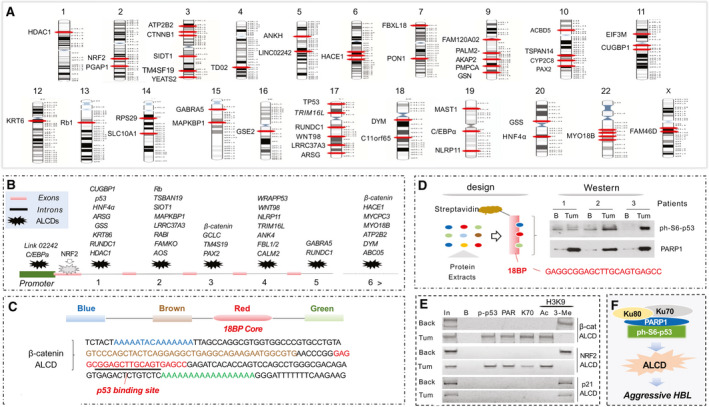
ALCDs are bound by ph‐S6‐p53‐PARP1 complexes in patients with HBL. (A) Locations of ALCDs on human chromosomes. (B) Locations of ALCDs in cancer‐related genes. (C) The structure of ALCDs and a sequence of ALCD in the beta‐catenin gene. (D) Pull‐down experiment showing that ph‐S6‐p53 binds to the core sequence of ALCDs. (E) ChIP assay with HBL21 shows that ph‐S6‐p53/PARP1 complexes occupy ALCDs of beta‐catenin and NRF2 genes, but not an “inactive” ALCD within p21 gene. (F) The hypothesis for the role of ph‐S6‐p53/PARP1 complexes in aggressive HBL.
Ph‐S6‐p53 Delivers PARP1‐Ku70 Complexes to ALCDs, Which Activate Multiple Oncogenic Pathways
The activation of ALCD‐dependent oncogenes in aggressive HBL is associated with binding of PARP1‐Ku70 complexes to ALCDs.( 18 ) However, PARP1 and Ku70 do not bind to DNA in a sequence‐specific manner and need to be delivered to ALCDs by certain TFs. Because previous studies showed that PARP1 interacts with the 18BP core sequence of ALCDs, which is 100% homologous in all ALCDs (Fig. 1C, red), we scanned the 18BP core against a “library” of TF binding site motifs( 22 ) and found that the “GGAGCTTGCAG” sequence is predicted to be a strong binding site for the p53 protein (Fig. 1C). Aggressive HBL primarily expresses p53, which is phosphorylated at Ser6( 18 ); therefore, we examined whether ph‐S6‐p53 interacts with the 18BP region of the ALCDs. We linked a biotinylated 18BP DNA oligomer to streptavidin beads and incubated them with proteins from background and tumor sections of three HBL specimens. WB showed that ph‐S6‐p53 directly binds to the 18BP region of ALCD, along with PARP1 (Fig. 1D). This suggested that ph‐S6‐p53 delivers PARP1 to the 18BP core of ALCDs.
To examine the binding of ph‐S6‐p53 to ALCDs in patients with HBL, we performed a ChIP assay with tumor and background regions of HBL using specific primers for ALCDs within the beta‐catenin and NRF2 genes. We found that the ph‐S6‐p53/PARP1/Ku70 complex is bound to the beta‐catenin and NRF2 ALCDs in HBL tumor; however, PARP1 and Ku70 were not detected on the ALCDs in background regions (Fig. 1E). Histone H3 is acetylated at K9 on ALCDs in HepG2 and in HBL tumors, but is methylated in background regions, suggesting that binding of ph‐S6‐p53/PARP1 opens the chromatin structure. The activation of the beta‐catenin and NRF2 ALCDs is specific, as an “inactive” ALCD within the p21 gene( 18 ) is not bound by the ph‐6S‐p53‐PARP1 complex and is repressed in tumor sections of HBL. Therefore, we hypothesized that the ph‐S6‐p53/PARP1 complex is the main activator of expression of ALCD‐dependent oncogenes in aggressive liver cancer (Fig. 1F).
Ph‐S6‐p53 and PARP1 Are Elevated and Form High Molecular‐Weight Complexes in HBL
During the last 5 years, we have collected 22 HBL samples and protein extracts using procedures that prevent protein degradation, destruction of protein–protein complexes, and de‐phosphorylation of proteins. qRT‐PCR analysis showed that approximately half of the fresh HBL samples contained elevated levels of PARP1 mRNA (Fig. 2A). For the following studies, we used this portion of the samples. Note that most PARP1‐abundent HBLs are aggressive forms of the cancer. Therefore, we performed comparisons of PARP1‐positive aggressive HBL with background regions of aggressive HBL or with PARP1‐negative, mild (“classic”) HBL. Examination of eight HBL tumors and four background regions showed that the amounts of PARP1 and ph‐S6‐p53 are increased in tumor sections (Fig. 2B).
FIG. 2.
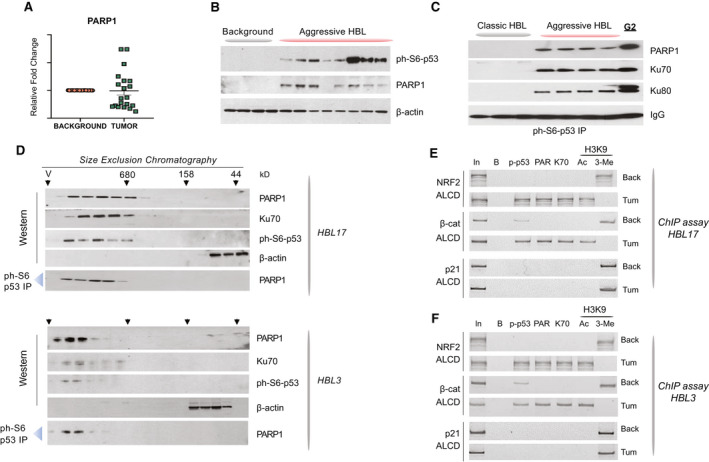
Ph‐S6‐p53/PARP1 complexes are abundant in aggressive HBL. (A) qRT‐PCR‐based analysis of PARP1 in a fresh Bio Bank. (B) PARP1 and ph‐S6‐p53 are elevated in aggressive HBL. WB was performed with nuclear extracts from background and from tumors of aggressive HBL. (C) Co‐IP studies showing that ph‐S6‐p53 forms complexes with PARP1/Ku70 in aggressive HBL and in HepG2 cells. Ph‐S6‐p53 was immunoprecipitated from tumors of mild (classic) HBL and from tumors of aggressive HBL. PARP1, Ku70, and Ku80 were examined in these IPs by WB. (D) HPLC‐based SEC was performed with tumor sections of two aggressive HBL samples. After fractionation, proteins were detected in each fraction by WB. Co‐IP from each fraction shows that ph‐S6‐p53/PARP1 complexes are detected in high MW regions of SEC. (E,F) The ph‐S6‐p53‐PARP1/Ku70 complexes occupy ALCDs of NRF2 and beta‐catenin genes, but not “inactive” ALCD within the p21 gene in 2 additional patients with aggressive HBL. ChIP assay was performed as described in Fig. 1E.
Co‐immunoprecipitation (Co‐IP) studies showed that ph‐S6‐p53‐PARP1 complexes are increased in HBL and in HepG2 cells (Fig. 2C). We next utilized SEC and analyzed the complexes in HBL patients. These studies revealed that ph‐S6‐p53, PARP1, and Ku70 co‐localize in high molecular‐weight (MW) fractions containing complexes of proteins with MW from 600 kD to 1 minute (Fig. 2D). The co‐IP showed that these proteins form a complex that has a higher sum than that of p53 (53 kD), PARP1 (110 kD), and Ku70 (70 kD) (total of 223 kD), suggesting that it contains additional components. ChIP assays with two additional HBL samples showed that the ph‐S6‐p53/PARP1/Ku70 complex occupies ALCDs in NRF2 and beta‐catenin genes (Fig. 2E,F). Examination of histone H3K9 modifications revealed that the complex likely opens the chromatin structure on these ALCDs. This binding to and activation of ALCDs in additional HBLs is specific, as “inactive” p21 ALCD is not bound by the ph‐S6‐p53‐PARP1 complexes.
The ph‐S6‐p53‐PARP1 Pathway Is Activated in Adult Patients With HCC
Previous studies found that HBL contains some molecular pathway with similarity to HCC typically observed in adults.( 6 , 10 ) Given the elevation of ph‐S6‐p53/PARP1 complexes in aggressive HBL, we asked whether this pathway is activated in adult patients with HCC. Because the analysis of such a pathway requires fresh samples with appropriate treatments of tissues, we recently collected five fresh HCC samples with high‐quality proteins and performed an examination of the ph‐S6‐p53/PARP1 pathway (Fig. 3A and Supporting Table S2). CT scans showed detection of tumors in patients with HCC (Fig. 3B). Hematoxylin and eosin (H&E) staining of the HCC is shown in Supporting Fig. S1. For the next studies, we selected four HCC samples, the amounts of which were sufficient for careful biochemical analyses.
FIG. 3.
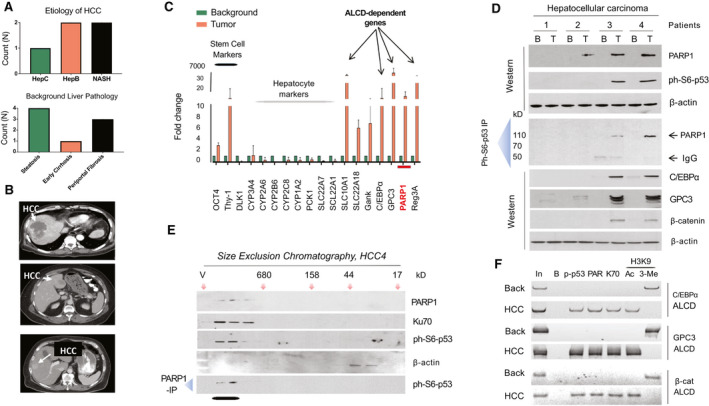
Patients with HCC have activated ph‐S6‐p63/PARP1 pathway. (A) Etiology of HCC and pathology of background regions. (B) CT analysis of 3 patients with HCC. Arrows show location of the HCC in livers of patients. (C) An example of qRT‐PCR analyses of 2 patients with elevated PARP1 (patients 3 and 4). Background is an adjacent region of the liver, which was removed from the same patient. (D) ph‐Sp53, PARP1, and ALCD‐dependent C/EBPα, GPC3, and beta‐catenin are elevated in 2 patients with HCC. WB (upper) and co‐IP studies were performed for 4 patients with HCC. In co‐IP studies, ph‐S6‐p53 was immunoprecipitated and PARP1 was examined in these IPs. (E) HCC‐specific ph‐S6‐p53/PARP1 complexes are observed in high MW region of SEC. Nuclear proteins were fractionated by SEC, and the fractions were analyzed by WB with Abs to ph‐S6‐p53, PARP1, and β‐actin. Bottom: The PARP1‐IP p53 WB was performed. (F) ChIP assay was performed with ALCDs of C/EBPα, GPC3, and beta‐catenin genes in background and tumor sections of HCC (patient 4).
We first examined the cancer‐related pathways of interest through qRT‐PCR. We detected reduction of markers of hepatocyte cytochrome P450 (CYP) family proteins and elevation of stem cell markers, Thy‐1 and Oct4. Figure 3C shows an example of this analysis (patients 3 and 4). In these patients, we detected 10‐fold elevation of PARP1. Note that targets of ph‐S6‐p53‐PARP1, C/EBPα, glypican 3 (GPC3), and beta‐catenin (Supporting Fig. S2) are also elevated in these HCCs. Next, we found that both components of the PARP1‐ph‐S6‐p53 complexes are increased in these 2 patients (Fig. 3D). Examination of the ph‐S6‐p53/PARP1 complexes using a co‐IP approach found that PARP1 and ph‐S6‐p53 form complexes in HCC of patients 3 and 4 (Fig. 3D). An HPLC‐based SEC approach (Fig. 3E) showed that the ph‐S6‐p53/PARP1 complex is observed in the high MW region. Examination of levels of proteins, genes of which contain ALCDs, C/EBPα, GPC3 and beta‐catenin, by WB (Fig. 3D, bottom) and examination of corresponding ALCDs by ChIP assay showed that these targets of the ph‐S6‐p53‐PARP1 complexes are elevated in patients with HBL by activation of the ALCDs, located in these genes (Fig. 3F). Thus, our studies of four fresh adult HCC samples showed that 2 patients with HCC have an activated ph‐S6‐p53‐PARP1‐ALCD pathway, demonstrating a similar activation of the ph‐S6‐p53‐PARP1 pathway previously found in aggressive HBL. This suggests that a portion of patients with HCC also have activation of this pathway. Our next studies focused on PDXs generated from aggressive HBL, as HCC PDXs were unable to be used due to the difficulty in their generation.
Ola Treatment of HBL‐PDXs Inhibit Tumor Growth
Because p53 gene is under control of the PARP1‐ALCD axis,( 18 ) we examined levels of PARP1 and p53 in HBL‐PDXs described by Nicolle at al.( 21 ) Examination of PARP1 in 22 PDXs by qRT‐PCR found that 50% of these PDXs have elevated levels of PARP1 (Supporting Fig. S3). We next examined seven of those specimens with high levels of PARP1 and found that all contained elevation of p53 (Supporting Fig. S3). This result is in alignment with our previous suspicion of the presence of ALCD in the p53 gene (Fig. 1). We next examined whether the PDXs preserve ph‐S6‐p53/PARP1/Ku70 complexes. For this goal, we also generated PDXs at the Cincinnati Children’s Hospital using fresh HBL samples that were taken immediately after surgery. For this set of PDXs, we had access to the original HBLs and PDX HBLs. Therefore, we examined whether these PDXs preserve ph‐S6‐p53/PARP1 complexes after growth in mice. SEC studies of three PDXs showed that they had elevated ph‐S6‐p53/PARP1/Ku70 complexes (Figs. 4A and 5A). The comparison of SEC of HBL17 (Fig. 2D) and SEC of PDX17 (generated from this patient; Fig. 4A) clearly demonstrated that the generated PDXs preserved ph‐S6‐p53/PARP1 complexes. The tumors from PDXs with elevation in PARP1, p53, and ph‐S6‐p53/PARP1/Ku70 complexes were used in our next studies. All clinical and genetic information for these PDXs is described by Nicolle et al., and additional details can be found in Supporting Table S1.( 21 ) Particularly, CTNNB1 mutations (deletion of exon 3) were observed in three PDXs used in our studies. The original patients of these specimens displayed clinically aggressive features including relapsed HBL, multiple hepatic nodules at diagnosis, vascular invasion, and metastatic at diagnosis.
FIG. 5.
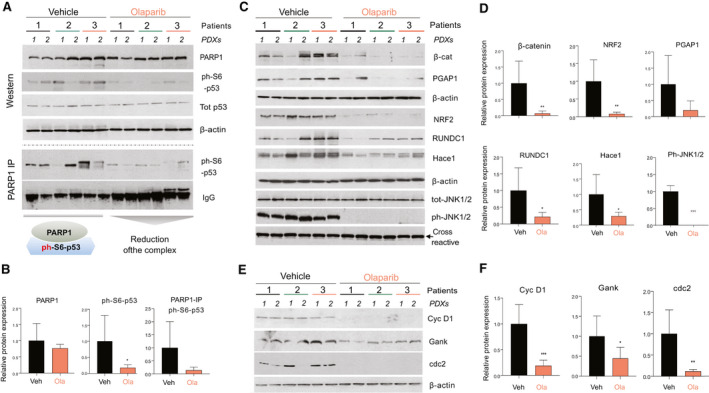
Treatments with Ola reduce the ph‐S6‐p53/PARP1 pathway in engrafted PDXs. (A) Ola reduces ph‐S6‐p53/PARP1 complexes in tumor sections of PDXs. Upper part shows the WB of six control PDXs and six Ola‐treated PDXs. Bottom part shows co‐IP studies of the same PDXs. (B) Bar graphs show levels of proteins from (A) as ratios to β‐actin or IgGs in co‐IP. (C) ALCD‐dependent genes are down‐regulated by Ola. (D) Levels of the proteins in (B) were calculated as ratios to β‐actin. (E) WB showing that levels of cell cycle proteins are reduced by Ola treatments. (F) Bar graphs showing levels of cell cycle proteins as ratios to β‐actin.
PARP1 regulates transcription through direct interactions with a histone modifier EZH2.( 23 ) It also interacts with CCCTC‐binding factor, initiating interactions between active and inactive nuclear compartments.( 24 ) Because the inhibition of PARP1 activity by Ola inhibited these interactions and proliferation of cancer cells,( 23 ) we used Ola to inhibit activity of the ph‐S6‐p53‐PARP1 complexes in HBL‐PDX models. Supporting Fig. S4 shows the strategy for these studies. Fifteen mice engrafted with HBL tumors derived from 5 patients (three mice per patient), which were described in the preceding study, were treated with Ola, whereas 15 PDXs from the same patients were treated with vehicle (control). In most of the vehicle‐treated PDXs, the tumor grew rapidly, whereas in the Ola‐treated PDXs, the rate of tumor growth was significantly reduced (Fig. 4B). The vehicle and Ola‐treated mice did not show differences in body weight (data not shown). Within the first 12 days, tumors grew rapidly in both vehicle and Ola‐treated PDXs. However, Ola‐treated PDXs showed significant inhibition of tumor growth starting at 12 days following initiation of treatment. At day 17, this difference was greater than 50% (Fig. 4C), but studies were required to be halted due to the controls exceeding IRB‐approved volumes. H&E staining revealed an improvement of liver morphology in Ola‐treated PDXs. Ki‐67 staining showed that tumors of vehicle‐treated PDXs had about 50%‐70% of ki67‐positive HBL cells, whereas treatment with Ola reduced ki67‐positive cells to less than 40% (Fig. 4D,E). Supporting Fig. S5 shows additional images of ki67 staining. Taken together, these studies show that treatments of PDXs with Ola reduced tumor growth and inhibited proliferation in PDX‐engrafted HBL tumors.
Ola Treatment Reduces ph‐S6‐p53/PARP1 Complexes and Expression of ALCD‐Dependent Genes in HBL‐PDXs
We next examined the ph‐S6‐p53‐PARP1 pathway in vehicle‐treated versus Ola‐treated PDXs. WB analysis showed that protein levels of PARP1 are not changed by Ola (Fig. 5A,B). However, we surprisingly found that levels of ph‐S6‐p53 were reduced in Ola‐treated PDXs, whereas levels of total p53 were unchanged. ph‐S6‐p53/PARP1 complexes are abundant in all examined control PDXs; however, Ola reduced levels of these complexes in PDXs compared with the corresponding control PDXs (Fig. 5A,B). Downstream targets of the ph‐S6‐p53/PARP1 complexes (containing ALCDs), beta‐catenin, NRF2, post‐GPI attachment to proteins inositol deacylase 1 (PGAP1), RUN domain‐containing protein 1 (RUNDC1), and HECT domain and ankyrin repeat containing E3 ubiquitin protein ligase 1 (HACE1) are reduced in the Ola‐treated PDXs (Fig. 5C,D). We next asked whether the JNK1/2 kinase (which phosphorylates p53 at Ser6 ( 25 )) is affected in PDXs treated with Ola. WB with phosphor‐specific Abs showed that active ph‐JNK1/2 is reduced in Ola‐treated PDXs, but total levels of JNK1/2 are not changed (Fig. 5C). Cell cycle proteins cdc2 and cyclin D1 are significantly reduced in Ola‐treated PDXs, while levels of the oncogene gankyrin are reduced to a lesser degree (Fig. 5E,F). Given the Ola‐mediated inhibition of levels of ALCD‐containing genes beta‐catenin, NRF2, PGAP1, RUNDC1 and HACE1, we examined the status of ALCDs in these genes in PDXs treated with Olaparib versus control PDXs. Figure 6A,B shows that the ALCDs within these genes are bound and activated by ph‐S6‐p53‐PARP1 complexes in vehicle‐treated PDXs; however, Ola removes the complexes from the ALCDs and represses ALCDs, as H3 is tri‐methylated at K9 in Ola‐treated PDXs (Fig. 6A‐C). These ChIP studies are summarized in Fig. 6C.
FIG. 6.
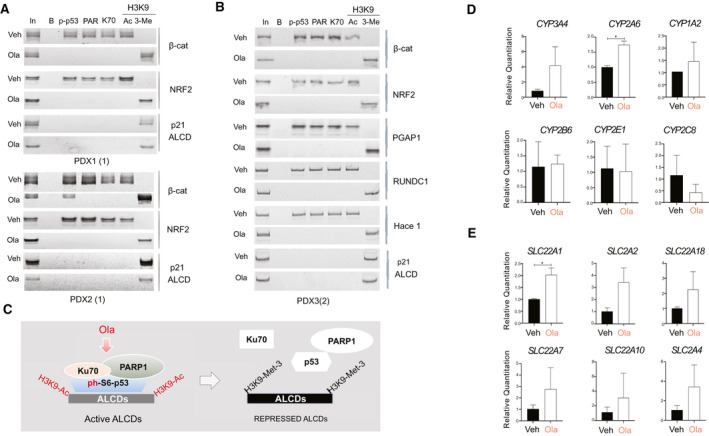
Repression of ALCDs within oncogenes and elevation of hepatocyte markers in Ola‐treated PDXs. (A,B) Chip assay with ALCDs of oncogenes shown on the right. Chromatin solutions were isolated from PDXs 1(1), 2(1), and 3(2), treated with vehicle and with Ola, and used for ChIP assay as described in the “Experimental Procedures” section. (C) Diagram summarizing the ChIP results. (D) Markers of hepatocytes are increased in PDXs after treatments with Ola (qRT‐PCR was performed). (E) Members of SLC family are increased in Ola‐treated HBL‐PDXs. QRT PCR was performed with RNA isolated from vehicle and Ola‐treated PDXs.
Levels of markers of hepatocytes CYP and solute carrier family (SLC) proteins are reduced in patients with HBL,( 19 ) thus we examined levels of mRNAs in these families and found that CYP3A4, CYP2A, CYP1A2, SLC28C, SLC22A88, SLC22A7, SLC22A10, and SLC2A4 mRNAs are increased in PDXs treated with Ola (Fig. 6C,D). These results show that Ola causes elevation of markers of hepatocytes, suggesting that the reduction of the ph‐S6‐p53/PARP1 complexes leads to accumulation of baseline/“healthy” hepatocytes.
Ola Inhibits the JNK1/2‐ph‐S6‐p53 Pathway
Due to Ola inhibited phosphorylation of p53 at Ser6 and expression of active ph‐JNK1/2 (Fig. 5), which phosphorylates p53 at Ser6,( 25 ) we asked whether Ola inhibits the JNK1/2 pathway in cultured cancer cells. Treatments of Huh6 cells with Ola showed that Ola inhibits phosphorylation of JNK1/2 in a dose‐dependent manner, while total levels of JNK1/2 are unchanged. We also observed that phosphorylation of p53 at Ser6 is reduced in cells treated with Ola. Additionally, a marker of hepatocytes, CYP3A4, showed a slight elevation in Ola‐treated cells (Fig. 7A). We next examined whether Ola changes expression of ALCD‐dependent oncogenes. For ChIP assays, we chose ALCD located proximal to the beta‐catenin and NRF2 genes, as these genes were implicated in proliferation of HBL cancer cells.( 16 , 17 , 26 ) Similar to the beta‐catenin ALCD (Fig. 1C), the NRF2 ALCD contains a 100% homologous 18BP core sequence, to which ph‐S6‐p53/PARP1 binds (Supporting Fig. S6). We found that, similar to Ola‐treated PDXs, the Ola treatments remove PARP1 and Ku70 from both ALCDs (Fig. 7B) in HBL Huh6 and HepG2 cells. Ph‐S6‐p53 is usually removed from ALCDs by Ola; however, in some cases, ph‐S6‐p53 is still detectable on these ALCDs (Fig. 7B).
FIG. 7.
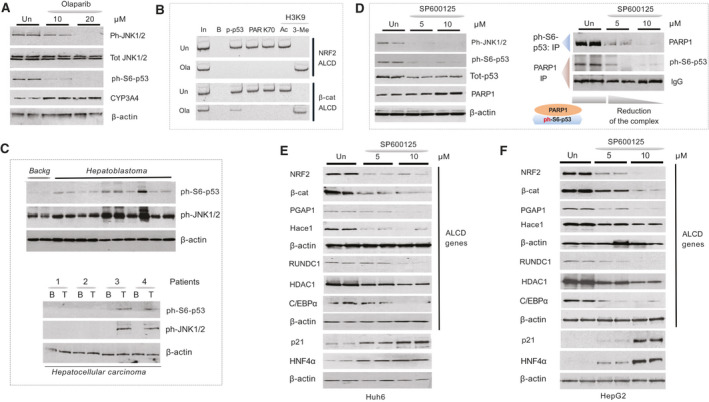
Ola treatments inhibit JNK1/2‐ph‐S6‐p53 pathway and reduce expression of ph‐S6‐p53‐PARP1‐dependent, ALCD‐containing genes. (A) Treatments of Huh6 cells with Ola inhibit the JNK1/2‐ph‐S6‐p53 pathway. (B) ChIP assay with ALCDs in NRF2 and beta‐catenin genes. (C) JNK1/2‐ph‐S6‐p53 pathway is activated in patients with aggressive HBL (upper) and HCC (bottom). WB was performed with background and tumor sections of patients with HBL and HCC. (D) Left: WB shows that the inhibition of JNK1/2 reduces levels of ph‐S6‐p53 protein. Right: Co‐IP studies. (E) Levels of ALCD‐dependent proteins are reduced in Huh6 cells with inhibited JNK1/2. WB was performed with Abs shown on the right. (F) Levels of ALCD‐dependent proteins are reduced in HepG2 cells treated with inhibitor of JNK1/2 SP600125.
We next asked whether the JNK1/2 pathway is activated in patients with aggressive HBL and in patients with HCC with an elevated ph‐S6‐p53/PARP1 pathway. WB analysis of 10 HBL samples revealed that all samples contained increased amounts of ph‐S6‐p53 and ph‐JNK1/2 (Fig. 7C). Examination of the patients with PARP1‐positive HCC (patients 3 and 4) showed elevation of ph‐JNK1/2 in tumor sections (Fig. 7C, bottom). These results revealed that the JNK1/2‐ph‐S6‐p53 pathway is activated in aggressive HBL and in adult HCC.
Inhibition of JNK1/2 by SP600125 Reduces ph‐S6‐p53/PARP1 Complexes and Inhibits Expression of ALCD‐Dependent Genes
To further examine the role of the JNK1/2‐ph‐S6‐p53 pathway in activation of ALCD‐dependent genes, we applied a pharmacological approach using the inhibitor of JNK1/2 SP600125. Figure 7D shows that SP600125 inhibits phosphorylation of p53 in a dose‐specific manner. We also observed a reduction of total p53, likely because the p53 gene contains an ALCD that might reduce p53 expression by auto‐inhibition. The SP600125‐mediated inhibition of JNK1/2 reduces the ph‐S6‐p53/PARP1 complexes (Fig. 7D, right) and levels of ALCD‐dependent NRF2, beta‐catenin, PGAP1, HACE1, RUNDC1, HDAC1, and C/EBPα (Fig. 7E), whereas the marker of hepatocytes hepatocyte nuclear factor 4α (HNF4α) and the inhibitor of proliferation p21 are increased. A similar inhibition of ALCD‐dependent genes was found in HepG2 cells treated with SP600125 (Fig. 7F). Thus, inhibition of JNK1/2 is sufficient to reduce ph‐S6‐p53/PARP1 complexes, and to inhibit expression of ALCD‐dependent genes.
SP600125 Removes the ph‐S6‐p53/PARP1 Complexes From ALCDs and Inhibits Cell Proliferation
To examine whether SP600125 represses ALCD‐dependent genes through inhibition of the ph‐S6‐p53‐PARP1‐ALCD axis in Huh6 and HepG2 cells, we performed ChIP analysis with ALCDs in NRF2, beta‐catenin, and p21 (containing “inactive” ALCD) genes and found that SP600125 removes ph‐S6‐p53/PARP1 complexes from the ALCDs and produces repressive chromatin states around ALCDs in cells treated with SP600125 (Fig. 8A). This change is specific, as ALCD within p21 gene is not affected by SP600125. We next asked whether Ola and SP600125 inhibit proliferation of Huh6 and HepG2 cells. We examined different concentrations of Ola and SP600125 and found that 20 μM Ola and 10 μM SP600125 have a stronger effect on the proliferation of Huh6 cells (Supporting Fig. S7). Figure 8B,C shows that the treatments of Huh6 and HepG2 cells by Ola alone and by SP600125 alone inhibit cell proliferation by 50%‐60%. However, the combined treatments cause much stronger inhibition of proliferation. We next examined images of treated Huh6 and HepG2 cells. About 80%‐90% of untreated Huh6 and HepG2 cells formed large clusters; however, most of the cells treated with Ola and SP600125 contain much smaller cell clusters (Fig. 8B,C). Combined treatments further reduce their size. WB with proteins isolated from Huh6 plates and HepG2 plates showed that Ola and SP600125 treatments reduced expression of cdk2, cdc2, and cyclins D1 and E, and combined treatments have a stronger effect (Fig. 8D).
FIG. 8.
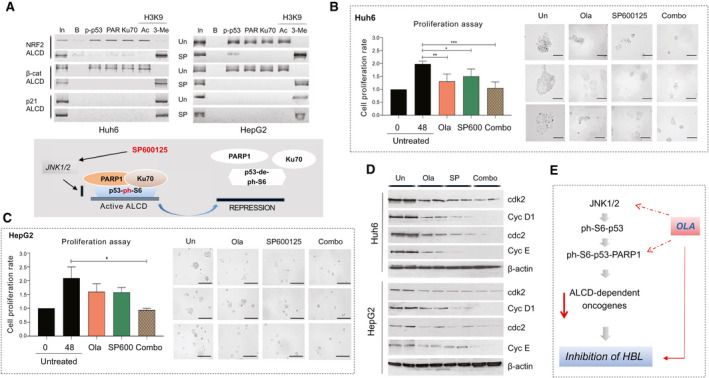
SP600125‐mediated removal of ph‐S6‐p53/PARP1 complexes from ALCDs inhibits proliferation of HBL cells. (A) ChIP assay shows that the treatments of Huh6 and HepG2 cells with SP600125 remove the ph‐S6‐p53/PARP1 complexes from ALCDs of NRF2 and beta‐catenin genes. “Inactive” ALCD within the p21 gene was included as the control. (B,C) Inhibition of proliferation of Huh6 and HepG2 cells by Ola and SP600125 and by combination of these drugs. Images of untreated HepG2 and Huh6 cells and cells treated with drugs, as shown on the right. (D) WB of the cell cycle proteins using protein lysates from untreated and treated Huh6 and HepG2 cells. (E) Hypothesis showing mechanisms by which Ola inhibits pediatric liver cancer.
Discussion
In contrast to HCC, pediatric liver cancer, HBL, is characterized by a small number of genomic mutations, which are observed primarily in the beta‐catenin and NRF2 genes.( 6 , 7 ) Searching for mutation‐independent mechanisms of aggressive HBL, we identified genomic regions (ALCDs) that are located in many oncogenes and are activated by PARP1/Ku70 complexes.( 18 ) We also found that aggressive HBL expresses p53, which is phosphorylated at Ser6.( 18 ) Our current analysis surprisingly identified ph‐S6‐p53 as the protein that binds to ALCDs and delivers PARP1 complexes to ALCDs. We identified that JNK1/2 is activated in HBL and phosphorylates p53 at Ser6, which is consistent with previous reports.( 25 ) Our data also demonstrate that the appearance of the ph‐S6‐p53/PARP1 complexes in aggressive HBL requires several abnormal events, including elevation of PARP1 and activation of JNK1/2. It is important to note that the effects of Ola on activity (status) of ALCDs are specific to oncogenes containing “active” ALCDs, but Ola does not affect ALCDs that are not involved in the regulation of gene expression. An “inactive” ALCD within the p21 gene does not control expression of p21 and is not affected by Ola (Figs. 1, 2, 6, and 7).
In this study, we focused on the ALCD‐dependent activation of genes on two genes that are important drivers of aggressive HBL and that contain ALCDs, beta‐catenin, and NRF2.( 14 , 15 , 16 , 26 ) ChIP studies and examination of the expression of these genes revealed that the ph‐S6‐p53/PARP1 complexes are critical activators of the beta‐catenin and NRF2 genes within HBL. Interestingly, the p53 gene also contains an ALCD, allowing for autoregulation of its own expression level, as it is seen with inhibition of JNK1/2 (Fig. 7). To understand the significance of the ph‐S6‐p53‐PARP1‐mediated activation of ALCD‐dependent oncogenes, we tested whether the inhibition of ALCDs and ALCD‐dependent genes reduces tumor proliferation using HBL‐PDX models and cultured HBL cells. In PDX studies, inhibition of PARP1 by Ola reduced ph‐S6‐p53/PARP1 complexes and tumor growth by 50% at 17 days. Such incomplete inhibition might be explained by the complexity of the HBL and the existence of additional pathways. It is also possible that higher doses of Ola are required for better inhibition of ALCD‐dependent genes, as ph‐S6‐p53/PARP1 complexes are reduced but not completely inhibited (Fig. 5A). Surprisingly, Ola resulted in inhibition of JNK1/2 activity in PDX models and HBL cells. Our further studies in cancer cells confirmed this inhibition. Figure 8E summarizes Ola‐dependent pathways of inhibition of tumor growth. The ability of Ola to inhibit the oncogenic JNK1/2‐ph‐S6‐p53 axis is promising for further therapeutic considerations, as our studies demonstrated a stronger inhibition of cell proliferation by combinations of Ola and SP600125. Further studies will test whether the combined effects of Ola and SP600125 in PDX models will provide a stronger inhibition of human HBL.
Author Contributions
M.J. helped to design the study, perform the experiments, analyze the data, and draft the manuscript. R.G. helped to perform the experiments. M.R. contributed to the qRT‐PCR studies and statistical analysis. D.N., A.G., and S.C. generated PDXs and performed treatments of PDXs with Ola. A.B., J.G., and G.T. collected the HBL samples and helped to design the study. M.W. performed the search for TFs that could interact with the ALCDs and was involved in discussion of the results. N.T. generated the overall design for the studies, performed a portion of the experiments, drafted the manuscript, and obtained funding. All authors helped to interpret the data.
Supporting information
Supplementary Material
Acknowledgment
The authors thank Ashley Cast for the help with organization of this project, Mary Wright and Leila Valanejad for the help with qRT‐PCR studies, and Kathryn Glaser for the critical review of the paper. An additional thanks to Dr. Shimal Shah and Dr. Jiang Wang for the assistance in obtaining specimens.
Supported by the National Institutes of Health (R01DK102597 and R01CA159942 to N.T.) and by Internal Development Funds from the Cincinnati Children’s Hospital Medical Center (to N.T.).
Potential conflict of interest: Nothing to report.
References
- 1. Weinberg AG, Finegold MJ. Primary hepatic tumors of childhood. Hum Pathol 1983;14:512‐537. [DOI] [PubMed] [Google Scholar]
- 2. Kalish JM, Doros L, Helman LJ, Hennekam RC, Kuiper RP, Maas SM, et al. Surveillance recommendations for children with overgrowth syndromes and predisposition to Wilms tumors and hepatoblastoma. Clin Cancer Res 2017;23:115‐122. [DOI] [PMC free article] [PubMed] [Google Scholar]
- 3. Czauderna P, Lopez‐Terrada D, Hiyama E, Haberle B, Malogolowkin MH, Meyers RL. Hepatoblastoma state of the art: pathology, genetics, risk stratification, and chemotherapy. Curr Opin Pediatr 2014;26:19‐28. [DOI] [PubMed] [Google Scholar]
- 4. Meyer A, Ghandour R, Bergman A, Castaneda C, Wosnitzer M, Hruby G, et al. The natural history of clinically complete responders to neoadjuvant chemotherapy for urothelial carcinoma of the bladder. J Urol 2014;192:696‐701. [DOI] [PubMed] [Google Scholar]
- 5. Trobaugh‐Lotrario AD, Meyers RL, O'Neill AF, Feusner JH. Unresectable hepatoblastoma: current perspectives. Hepat Med 2017;1:1‐6. [DOI] [PMC free article] [PubMed] [Google Scholar]
- 6. Eichenmüller M, Trippel F, Kreuder M, Beck A, Schwarzmayr T, Häberle B, et al. The genomic landscape of hepatoblastoma and their progenies with HCC‐like features. J Hepatol 2014;61:1312‐1320. [DOI] [PubMed] [Google Scholar]
- 7. Cairo SA, Armengol C, De Reyniès A, Wei Y, Thomas E, Renard C‐A, et al. Hepatic stem‐like phenotype and interplay of Wnt/beta‐catenin and Myc signaling in aggressive childhood liver cancer. Cancer Cell 2008;14:471‐484. [DOI] [PubMed] [Google Scholar]
- 8. Cairo S, Wang Y, de Reynies A, Duroure K, Dahan J, Redon M‐J, et al. Stem cell‐like micro‐RNA signature driven by Myc in aggressive liver cancer. Proc Natl Acad Sci U S A 2010;107:20471‐20476. [DOI] [PMC free article] [PubMed] [Google Scholar]
- 9. Lee H, El Jabbour T, Ainechi S, Gay LM, Elvin JA, Vergilio J‐A, et al. General paucity of genomic alteration and low tumor mutation burden in refractory and metastatic hepatoblastoma: comprehensive genomic profiling study. Hum Pathol 2017;70:84‐91. [DOI] [PubMed] [Google Scholar]
- 10. Cast A, Valanejad L, Wright M, Nguyen PH, Gupta A, Zhu L, et al. C/EBPα‐dependent pre‐neoplastic tumor foci are the origin of hepatocellular carcinoma and aggressive pediatric liver cancer. Hepatology 2018;2018:1857‐1871. [DOI] [PMC free article] [PubMed] [Google Scholar]
- 11. Lewis K, Valanejad L, Cast A, Wright M, Wei C, Iakova P, et al. RNA binding protein CUGBP1 inhibits liver cancer in a phosphorylation dependent manner. Mol Cell Biol 2017;37:e00128‐17. [DOI] [PMC free article] [PubMed] [Google Scholar]
- 12. Ranganathan S, Lopez‐Terrada D, Alaggio R. Hepatoblastoma and pediatric hepatocellular carcinoma: an update. Pediatr Dev Pathol 2020;23:79‐95. [DOI] [PubMed] [Google Scholar]
- 13. Mavila N, Thundimadathil J. The emerging roles of cancer stem cells and Wnt/beta‐catenin signaling in hepatoblastoma. Cancers (Basel) 2019;11:1406. [DOI] [PMC free article] [PubMed] [Google Scholar]
- 14. Sha YL, Liu S, Yan WW, Dong B. Wnt/β‐catenin signaling as a useful therapeutic target in hepatoblastoma. Biosci Rep 2019;39:BSR20192466. [DOI] [PMC free article] [PubMed] [Google Scholar]
- 15. Crippa S, Ancey PB, Vazquez J, Angelino P, Rougemont AL, Guettier C, et al. Mutant CTNNB1 and histological heterogeneity define metabolic subtypes of hepatoblastoma. EMBO Mol Med 2017;9:1589‐1604. [DOI] [PMC free article] [PubMed] [Google Scholar]
- 16. Min Q, Molina L, Li J, Adebay MAO, Russell JO, Preziosi ME, et al. β‐Catenin and yes‐associated protein 1 cooperate in hepatoblastoma pathogenesis. Am J Pathol 2019;189:1091‐1104. [DOI] [PMC free article] [PubMed] [Google Scholar]
- 17. Zhang W, Meyfeldt J, Wang H, Kulkarni S, Lu J, Mandel JA, et al. β‐Catenin mutations as determinants of hepatoblastoma phenotypes in mice. J Biol Chem 2019;294:17524‐17542. [DOI] [PMC free article] [PubMed] [Google Scholar]
- 18. Valanejad L, Cast A, Wright M, Bissig KM, Karns R, Weirauch MT, et al. PARP1 activation increases expression of modified tumor suppressors and pathways underlying development of aggressive hepatoblastoma. Commun Biol 2018;1:67. [DOI] [PMC free article] [PubMed] [Google Scholar]
- 19. Valanejad L, Lewis K, Wright M, Jiang Y, D’Souza A, Karns R, et al. FXR‐Gankyrin axis is involved in development of pediatric liver cancer. Carcinogenesis 2017;38:738‐747. [DOI] [PMC free article] [PubMed] [Google Scholar]
- 20. Wang G‐L, Iakova P, Wilde M, Awad S, Timchenko NA. Liver tumors escape negative control of proliferation via PI3K/Akt‐mediated block of C/EBPα growth inhibitory activity. Genes Dev 2004;18:912‐925. [DOI] [PMC free article] [PubMed] [Google Scholar]
- 21. Nicolle D, Fabre M, Simon‐Coma M, Gorse A, Kappler R, Nonell L, et al. Patient‐derived mouse xenografts from pediatric liver cancer predict tumor recurrence and advise clinical management. Hepatology 2016;64:1121‐1135. [DOI] [PubMed] [Google Scholar]
- 22. Lambert SA, Yang AWH, Sasse A, Cowley G, Albu M, Caddick MX, et al. Similarity regression predicts evolution of transcription factor sequence specificity. Nat Genet 2019;51:981‐989. [DOI] [PubMed] [Google Scholar]
- 23. Caruso LB, Martin KA, Lauretti E, Hulse M, Siciliano M, Lupey‐Green LN, et al. Poly(ADP‐ribose) polymerase 1, PARP1, modifies EZH2 and inhibits EZH2 histone methyltransferase activity after DNA damage. Oncotarget 2018;9:10585‐10605. [DOI] [PMC free article] [PubMed] [Google Scholar]
- 24. Zhao H, Sifakis EG, Sumida N, Millán‐Ariño L, Scholz BA, Svensson JP, et al. PARP1‐ and CTCF‐mediated interactions between active and repressed chromatin at the lamina promote oscillating transcription. Mol Cell 2015;59:984‐997. [DOI] [PubMed] [Google Scholar]
- 25. Oleinik NV, Krupenko NI, Krupenko SA. Cooperation between JNK1 and JNK2 in activation of p53 apoptotic pathway. Oncogene 2007;26:7222‐7230. [DOI] [PubMed] [Google Scholar]
- 26. Comerford SA, Hinnant EA, Chen Y, Bansal H, Klapproth S, Rakheja D, et al. Hepatoblastoma modeling in mice places Nrf2 within a cancer field established by mutant β‐catenin. JCI Insight 2016;1:e88549. [DOI] [PMC free article] [PubMed] [Google Scholar]
Associated Data
This section collects any data citations, data availability statements, or supplementary materials included in this article.
Supplementary Materials
Supplementary Material


