Abstract
Introduction
In patients with non-small cell lung cancer (NSCLC), the prognostic significance of the tumor microenvironment (TME) immune composition has been demonstrated using single or dual-marker staining on sequential tissue sections. While these studies show that relative abundance and localization of immune cells are important parameters, deeper analyses of the NSCLC TME are necessary to refine the potential application of these findings to clinical care. Currently, the complex spatial relationships between cells of the NSCLC TME and potential drivers contributing to its immunologic composition remain unknown.
Methods
We employed multispectral quantitative imaging on the lung adenocarcinoma TME in 153 patients with resected tumors. On a single slide per patient, we evaluated the TME with markers for CD3, CD8, CD14, CD19, major histocompatibility complex II (MHCII), cytokeratin, and DAPI. Image analysis including tissue segmentation, phenotyping, and spatial localization were performed.
Results
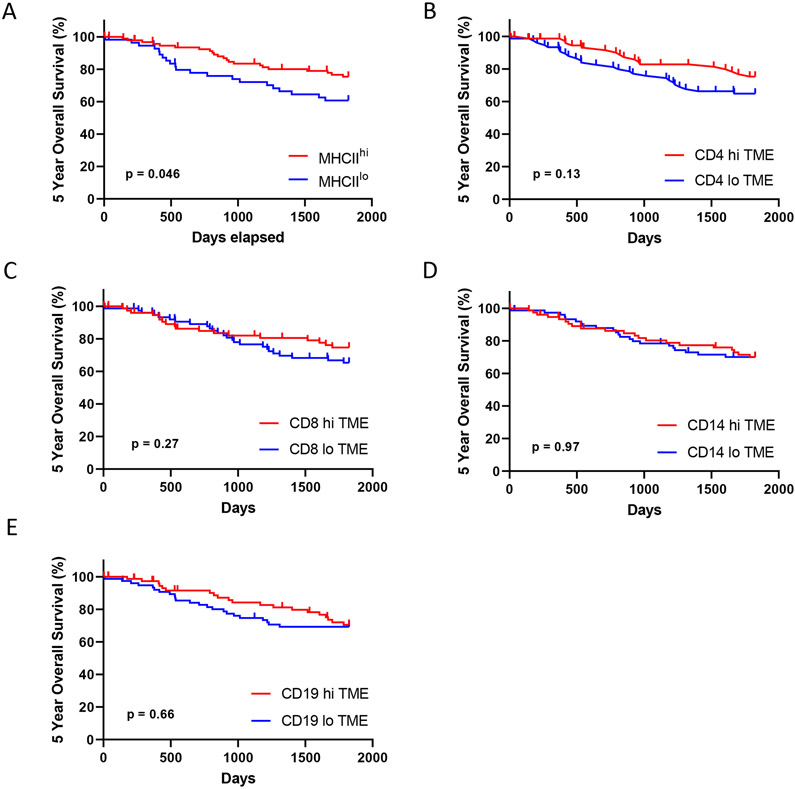
Specimens where ≥5% of lung cancer cells expressed MHCII (MHCIIhi TME) demonstrated increased levels of CD4+ and CD8+ T cell and CD14+ cell infiltration. In the MHCIIhi TME, the immune infiltrate was closer to cancer cells and expressed an activated phenotype. Morphologic image analysis revealed cancer cells in the MHCIIhi TME more frequently interfaced with CD4+ and CD8+ T cells. Patients with an MHCIIhi TME experienced improved overall survival (p=0.046).
Conclusions
Lung cancer cell-specific expression of MHCII associates with levels of immune cell infiltration, spatial localization, and activation status within the TME. This suggest cancer cell-specific expression of MHCII may represent a biomarker for the immune system’s recognition and activation against the tumor.
Introduction
The tumor microenvironment (TME) is a complex interface between cancer cells, stroma, and infiltrating immune cells. Multiple preclinical models of cancer have demonstrated that these interactions shape the natural history of tumor progression including the early events of primary tumor formation and how rapidly metastases develop (Reviewed in [1]). In patients with lung cancer, multiple analyses have demonstrated the prognostic significance of the TME immune composition[2]. High levels of immune infiltration within hematoxylin and eosin stained sections were associated with improved patient outcomes in a cohort of 1,546 patients with resected non-small cell lung cancer (NSCLC)[3]. Even in patients with stage I disease, immunologic characteristics of the TME including the proportion of FoxP3+ cells to total T cell infiltration correlated with disease recurrence in 956 patients with resected lung adenocarcinoma[4]. In addition to the differences in the numbers of immune cells, the location of specific populations within the NSCLC TME influences patient outcomes. In a cohort of 797 patients with resected lung cancer, high numbers of CD8+ T cells in the stroma associated with improved overall survival[5]. While these studies and others have demonstrated that relative abundance and localization of immune cells within the NSCLC TME are important parameters, deeper analyses of the NSCLC TME are necessary to refine the potential application of these findings to clinical care[1]. Currently, the complex spatial relationships between cells of the NSCLC TME and potential drivers contributing to its immunologic composition remain unknown.
Previously, we have reported that cancer cell-specific expression of major histocompatibility complex II (MHCII) modulates the TME within orthotopic mouse models of lung cancer[6]. Downregulation of MHCII in CMT167, a murine lung adenocarcinoma that expresses MHCII in vivo, resulted in fewer CD4+ and CD8+ T cells compared to the parental line[6]. Conversely, upregulation of MHCII in LLC, a murine lung adenocarcinoma that does not express MHCII in vivo, led to increased infiltration of CD4+ and CD8+ T cells compared to the parental line[6]. Ex-vivo experiments demonstrated MHCII expressing cancer cells presented antigen to CD4+ T cells and resulted in a Th1 phenotype. Studies of NSCLC tissues have demonstrated tumor cell positivity for MHCII and that cancer cell expression of MHCII associates with increased CD4+ T cell TME infiltration[6, 7]. We hypothesized NSCLC cancer cell-specific expression of MHCII would be a determinant of abundance and spatial organization of the immune infiltration within the NSCLC TME. We tested our hypothesis in a cohort of 153 patients with resected NSCLC adenocarcinoma and employed multispectral imaging for a deeper analysis of multiple cell phenotypes and their relative spatial distributions within the NSCLC TME. Here, we report NSCLC cancer cell-specific expression of MHCII results in a more abundant immune infiltration with a significant increase in proximity and interface of both CD4+ and CD8+ T cells to cancer cells. Notably, patients with NSCLC cancer cell-specific expression of MHCII experience improved overall survival.
Methods
Patient Studies:
Tumor specimens were collected through a protocol approved by the Mayo Clinic Institutional Review Board and obtained from the Mayo Clinic Lung Cancer Repository. Written informed consent was obtained from all patients in accordance with the Declaration of Helsinki. Patients were identified from the tissue repository that underwent curative surgical resection of lung adenocarcinoma between 2004 and 2007, who had not previously received cancer directed therapy, and had available residual tumor specimens. The electronic medical record was reviewed and pertinent clinical data including age at time of surgery, gender, smoking status, pack years, and last follow up date or date of death was extracted. Patients were staged based on surgical findings using the 8th edition of the AJCC TNM system for NSCLC [8]. Formalin-fixed paraffin-embedded (FFPE) tissue blocks were sectioned into 5μm slides by the Pathology Research Core (Mayo Clinic, Rochester, MN). Hematoxylin and eosin slides were reviewed by a thoracic pathologist (JMB) to verify the presence of tumor.
Tissue multiplex immunohistochemistry:
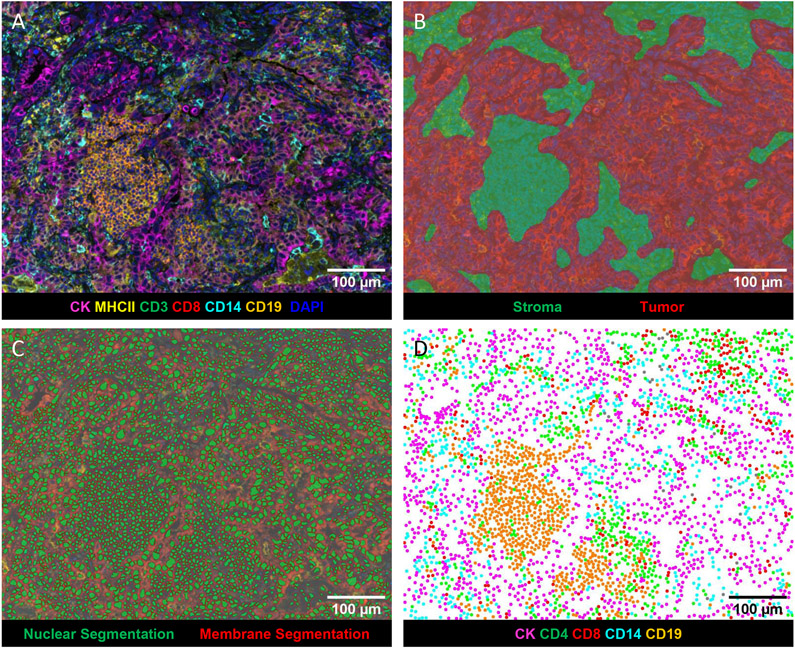
Slides from FFPE blocks were stained using Opal IHC Multiplex Assay on a Bond RX Autostainer (Leica) according to manufacturer’s recommendations (Akoya Biosciences) as previously described[9]. Multiplex IHC panels were developed using the best practices as detailed in the Society for Immunotherapy of Cancer guidelines[10]. Specifically, monoclonal antibodies used for in vitro diagnostics were selected and used per manufacturer’s suggestions (CD19, CD3, CD8, and pan-CK). Research use monoclonal antibodies were titrated on human tonsil to achieve a signal:noise ratio of at least 10:1, with membranous morphology as previously reported (CD14, MHCII, and PD-L1). The multiplex panel was designed using empirical data to achieve optimal staining of each marker. The staining morphology of each marker in the panel was confirmed by comparing to single stain controls (Supplemental Figure 1A). Opal concentrations were adjusted to achieve pixel intensities ranging from 5 – 30 for each marker. Positive control tonsils and negative regions of the same tonsil were analyzed with each batch of slides to confirm co-expression and reproducibility (Supplemental Figure 1B).Briefly, slides were sequentially stained for CD19 (clone BT51E, undiluted Ready to Use (RTU), Leica), CD3 (clone LN10, RTU, Leica), CD14 (clone SP192, dilution 1:100, Abcam), CD8 (clone C8/144B, dilution 1:200, Dako), HLA-DR + DP + DQ (MHCII) (clone CR3/43, dilution 1:250, Abcam), cytokeratin (AE1/AE3, dilution 1:250, Agilent) and spectral DAPI (Akoya Biosciences) at the Human Immune Monitoring Shared Resource at CU Anschutz Medical Campus. Using serial sections, slides were stained for PD-L1 (clone E1L3N, dilution 1:150, Cell Signaling Technologies). Whole slide scans were acquired using the 10x objective via the Vectra 3.0 imaging system (Akoya Biosciences). Three to five regions from each slide containing tumor and stroma were selected utilizing Phenochart (v1.0.12, Akoya Biosciences) for multispectral imaging using the 20x objective. The images were analyzed with inForm software (v2.4.8, Akoya Biosciences) to unmix adjacent fluorochromes, subtract autofluorescence (Figure 1A), segment the tissue into tumor and stroma regions (Figure 1B), segment the cells into nuclear, cytoplasmic, and membrane compartments (Figure 1C), and to phenotype the cells according to morphology and cell marker expression (Figure 1D).
Figure 1: Representative images generated by inForm analysis.
A) Spectrally unmixed composite image: pan-cytokeratin (CK) (magenta), CD3 (green), CD8 (red), CD14 (turquoise), CD19 (orange), MHCII (yellow), and DAPI (blue). B) Tissue segmentation map of tumor (red), and stroma (green) regions. C) Cell segmentation map: nucleus (green) and membrane (outlined in red). D) Phenotype map of CK+ cancer cells (magenta), CD4+ (CD3+CD8−) T cells (green), CD8+ T cells (red), CD14+ cells (turquoise), CD19+ B cells (orange).
Data Analysis:
inForm output data was analyzed using the R package Akoya Biosciences phenoptrReports to aggregate phenotype counts using count_phenotypes function for each slide and tissue category[11]. Nearest neighbor analysis was performed with the phenoptrReports nearest_neighbor_summary function[11]. The count_touching_cells function from phenoptrReports uses morphological analysis of nuclear and membrane segmentation maps to find touching cells of paired phenotypes[11]. To determine MHCII expression on cancer cells and immune cells, a threshold of membrane MHCII (Opal 690) mean of .05 positivity was determined by DAPI and MHCII single stain controls. To determine PD-L1 expression on all cells, a threshold of membrane PD-L1 (Opal 650) mean of .3 positivity was determined by DAPI and PD-L1 single stain controls. Hierarchical clustering algorithm (k means = 4) was used to group patients based on individual cell percent[12].
Statistics:
All statistical analysis performed was done with R version 4.0.3, R studio, or GraphPad Prism (v9.0.0, GraphPad Software). P values of p<.05 were considered significant.
Results
Cancer cell-specific MHCII expression associates with increased levels of TME immune infiltration
We quantified immune cell infiltration and MHCII expression in surgical resection specimens of patients with lung adenocarcinoma obtained from the Mayo Clinic Lung Cancer Repository. Patients were selected for multispectral imaging if they had no previous history of lung cancer and did not receive cancer directed therapy prior to surgery. Of the 153 patients evaluated 52.9% were women. Most of the patients were between ages 65-75 (75.8%), had a significant smoking history of 10 pack/years or more (73.2%), and were predominantly stage I (62%), specifically IA (42.4%), based on pathologic staging (Table 1). Initial quantification of the total number of immune cells within our cohort demonstrated a marked diversity degree and type of immune infiltration within each resection specimen (Supplemental Figure 2).
Table 1.
Patient Characteristics
| n = 153 | % | ||
|---|---|---|---|
| Sex | |||
| Male | 72 | 47.1 | |
| Female | 81 | 52.9 | |
| Age groups | |||
| <65 | 50 | 32.7 | |
| 65-74 | 58 | 37.9 | |
| ≥ 75 | 45 | 29.4 | |
| Smoking History | |||
| Never | 22 | 14.4 | |
| Light Smoker | 10 | 6.5 | |
| Heavy Smoker | 112 | 73.2 | |
| NA | 9 | 5.9 | |
| Stage (Pathological) | |||
| IA | |||
| IA1 | 9 | 5.9 | |
| IA2 | 33 | 21.6 | |
| IA3 | 23 | 15 | |
| IB | 30 | 19.6 | |
| IIA | 2 | 1.3 | |
| IIB | 27 | 17.6 | |
| IIIA | 17 | 11.1 | |
| IIIB | 7 | 4.6 | |
| IVA | 5 | 3.3 | |
| Stage (Numeric) | |||
| 1 | 95 | 62 | |
| 2 | 29 | 19 | |
| 3 | 24 | 15.7 | |
| 4 | 5 | 3.3 | |
| Cancer Cell MHCII Status | |||
| MHC II low < 5% | 56 | 36.6 | |
| MHC II high ≥ 5% | 97 | 62.7 | |
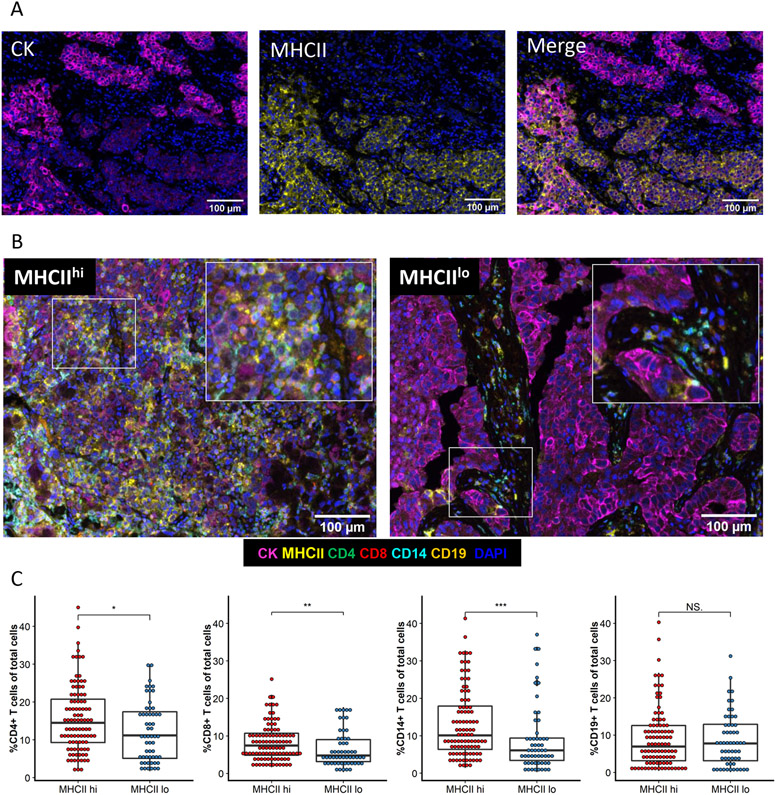
In our previous work, we reported that cancer cell-specific MHC class II expression alters the immune cell composition of the TME in murine models of lung cancer[6]. We therefore quantified the number of cancer cells positive for MHCII within each patient specimen as the percent of CK+ cells coexpressing MHCII (Figure 2A). To further determine the impact of cancer cell expression of MHCII on the TME, we classified tumor specimens as MHCII high or MHCII low based on previous work defining an MHCII high cancer cell population as ≥5% of tumor cells positive for MHCII[13, 14]. In our cohort, 63.4% (n = 97) of patients were found to have tumors with ≥5% of cancer cells expressing MHCII (MHCIIhi) and 36.6% (n = 56) had tumors with <5% of cancer cells expressing MHCII (MHCIIlo). Comparison of clinical characteristics between the MHCIIhi and MHCIIlo groups demonstrated no differences in patient distribution (Table 2). Differences were noted in the composition of the TME. The TME of MHCIIhi patients contained significantly increased total levels CD4+ and CD8+ T cell infiltrating the TME, and we also observed an increase in CD14+ cells compared to the TME of MHCIIlo patients (Figure 2B and 2C). Within the intratumoral compartment, MHCIIhi tumors contained more CD8+ T cells and increased CD14+ and CD19+ cells (Supplemental Figure 3A). Stromal infiltration of CD4+ T cells and CD14+ cells were higher in MHCIIhi tumors compared to MHCIIlo (Supplemental Figure 3B).
Figure 2: Immune infiltration is increased within the TME of MHCIIhi tumors.
A) Representative images of single stain CK and MHCII and the merged image. B) Representative multispectral images of an MHCIIhi or an MHCIIlo TME. C) Percent of immune cells present within the TME of each patient by tumor MHCII status. Unpaired t-test. *p<.05, **p<.01, ***p<.001, NS not significant.
Table 2.
Patient Characteristic by Cancer Cell MHCII Status
| MHCIIlo | MHCIIhi | ||
|---|---|---|---|
| n | 56 | 97 | |
| Sex | |||
| Male | 26 | 46 | p =0.91 |
| Female | 30 | 51 | |
| Age groups | |||
| <65 | 15 | 35 | p =0.24 |
| 65-74 | 26 | 32 | |
| ≥75 | 15 | 30 | |
| Smoking History | |||
| Never | 5 | 17 | p = 0.46 |
| Light Smoker | 3 | 7 | |
| Heavy Smoker | 44 | 68 | |
| N/A | 4 | 5 | |
| Stage (Pathological) | |||
| IA | 2 | 7 | p = 0.6 |
| IA2 | 14 | 19 | |
| IA3 | 9 | 14 | |
| IB | 12 | 18 | |
| IIA | 1 | 1 | |
| IIB | 5 | 22 | |
| IIIA | 8 | 9 | |
| IIIB | 3 | 4 | |
| IV | 2 | 3 | |
| Stage (Numeric) | |||
| 1 | 37 | 59 | p = 0.2 |
| 2 | 6 | 23 | |
| 3 | 11 | 12 | |
| 4 | 2 | 3 | |
| Adjuvant Chemotherapy | p = 0.74 | ||
| Yes | 7 | 14 | |
| No | 49 | 83 |
Increased spatial proximity between cancer cells and immune cells in the MHCIIhi TME
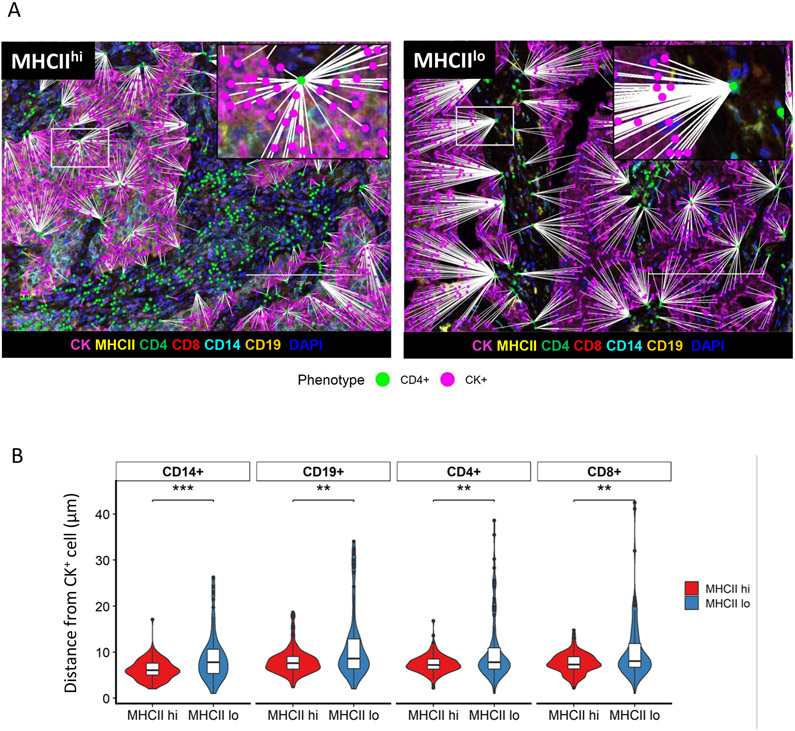
The proximity of immune cells to cancer cells within the TME is a critical determinant of immunologic activity, and we next determined the spatial localization of each cancer cell and immune cell by generating spatial coordinates for each cell type[1]. Distances between individual tumor cells and the nearest immune cell phenotypes were calculated. Spatial map views highlight the shorter distances between CK+ cancer cells and the nearest CD4+ T cell in an MHCIIhi compared to an MHCIIlo tumor (Figure 3A). Spatial analyses revealed an increased proximity of CD4+ and CD8+ T cells, CD19+, and CD14+ immune cells to the cancer cells in MHCIIhi tumors in contrast to MHCIIlo tumors (Figure 3B). In addition to the differences in cancer cell proximity, immune cells within the TME of MHCIIhi tumors more commonly expressed an activated phenotype compared to MHCIIlo tumors[15-17]. Higher levels of cell surface expression of MHCII on CD4+ and CD8+ T cells, CD14+ cells, and CD19+ cells were noted in MHCIIhi tumors compared to MHCIIlo tumors (Supplemental Figure 4). These differences remained significant when comparing tissue compartments reflecting an overall increased level in immune cell activity within the TME of MHCIIhi tumors (Supplemental Figure 4).
Figure 3: Increased spatial proximity of cancer cells to immune cells within the MHCIIhi TME.
A) Representative spatial map image of the distance of nearest CD4+ cell (green) to CK+ cell (pink) in an MHCIIhi tumor or an MHCIIlo tumor. B) Average minimum distance of CK+ cells to CD14+, CD19+, CD4+, and CD8+ cells in MHCIIhi and MHCIIlo cohorts (n =153, Unpaired T-test, **p<.01, ***p<.001)
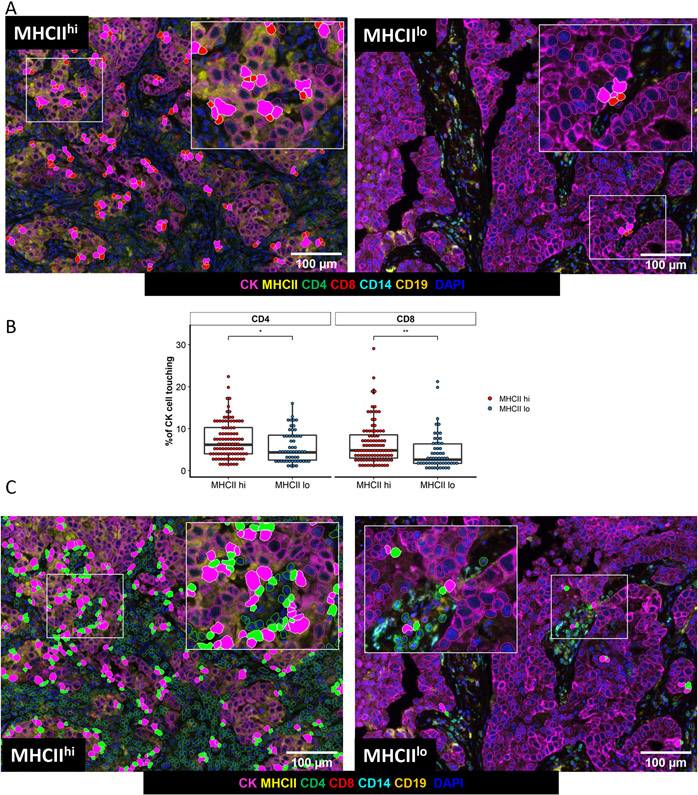
Ultimately, a successful anti-tumor response by the immune system culminates in CD8+ T cell recognition of the tumor and within our cohort we assessed this using morphologic analysis of the cell surface interface between pairs of cells[18]. Within the TME of MHCIIhi tumors, more cancer cells demonstrated a morphologic interface with CD8+ T cells in contrast to the TME of MHCIIlo tumors (Figure 4A, Figure 4B). CD8+ T cells within the TME of MHCIIhi tumors were more frequently interfaced with CD14+ cells, but not CD4+ T cells or CD19+ B cells (Supplemental Figure 5A). Similarly, tumor cells were more likely to share a surface interface with CD4+ T cells in MHCIIhi tumors (Figure 4B, Figure 4C). CD4+ T cells in the TME of MHCIIhi tumors were more frequently interfaced with CD14+ cells, but not CD8+ T cells or CD19+ B cells (Supplemental Figure 5B).
Figure 4: Cell-cell interface between cancer cells and T cells is more frequent in the MHCIIhi TME.
A) Representative images of cell interface analysis between cancer cells and CD8+ T cells in an MHCIIhi and MHCIIlo tumor. B) Percent of cancer cells with a cell surface interface with CD4 + or CD8 + T cells based on tumor MHC status, unpaired t-test, *p<.05, **p<.01. C) Representative images of cell interface analysis between cancer cells and CD4+ T cells in an MHCIIhi or an MHCIIlo tumor.
We further examined the TME by quantifying PD-L1 expression in a subset of available specimens from our patient cohort (n = 27). Using serial sections, we performed PD-L1 staining. Cells were determined positive using the mean cellular PD-L1 (Opal 690) expression of all 27 samples, and the percentage of PD-L1 positive cells was calculated. A cancer cell-specific marker (cytokeratin) was not in the panel with PD-L1, and while we were unable to correlate cancer-cell specific PD-L1 with MHCII, we were able to associate the total number of PD-L1+ cells with immune infiltration and activation status. With the PD-L1 quantification, we first investigated the association between the total number of PD-L1+ cells and tumor infiltrating leukocytes (TILs). Using an unbiased hierarchical clustering method (k means = 4), patient specimens were grouped as shown in the heat map (Supplemental Figure 6A). Four distinct clusters of patients were differentiated by PD-L1 expression and TIL infiltration and activation: Cluster 1: low total number of PD-L1+ cells and few detected TILs; Cluster 2: high levels of PD-L1+ cells co-occurring with high levels of activated TILs; Cluster 3: moderate total number of PD-L1+ cells but reduced presence of detectable TILs: Cluster 4: moderate/high total number of PD-L1+ cells and the presence of TILs with low levels of activation. We next evaluated the 4 identified TME clusters for cancer cell-specific MHCII expression (Supplemental Figure 6B). Cluster 2, which identified a group of patients with a high total number of PD-L1+ cells and the highest proportion of activated TILs, also contained a significantly higher level of cancer-cell specific MHCII expression than the other clusters (Supplemental Figure 6B). As expected, cluster 1 contained samples with very low levels of cancer cell-specific MHCII. Cluster 3 and 4, with moderate/high PD-L1 expression, both contain samples with low levels of cancer cell-specific MHCII and overall lower proportions of activated TILs, compared to Cluster 2. Overall, we observed a positive correlation between total number of PD-L1+ cells and level of cancer cell-specific MHCII (Supplemental Figure 6C). Within this subset of 27 patient samples, the MHCIIhi tumors contained more PD-L1+ cells than MHCIIlo tumors (Supplemental Figure 6D).
MHCIIhi Tumor Status Predicts Survival
As our analyses demonstrated MHCIIhi tumors have an increased quantity of total and activated immune cells and a higher frequency of T cell interfacing with cancer cells, we performed survival analyses on our patient cohort. Patients with MHCIIhi tumors experienced improved 5 year overall survival compared to patients with MHCIIlo tumors (Figure 5A). Improved survival was not observed when patients were grouped by high or low levels of immune cell infiltration based on the median of the entire cohort (Figure 5B – 5E). In multivariate analysis, cancer cell-specific MHCII status was predictive of patient outcome (Figure 6). Notably, levels of immune cell infiltration, grouped into high or low levels based on the entire cohort average, did not associate with 5 year overall survival.
Figure 5: Five year overall.
Stratified by A) Cancer cell-specific MHCII status, and levels of TME immune infiltration based on the cohort median of total B) CD4+, C) CD8+, D) CD14+, or E) CD19+ cells.
Figure 6:
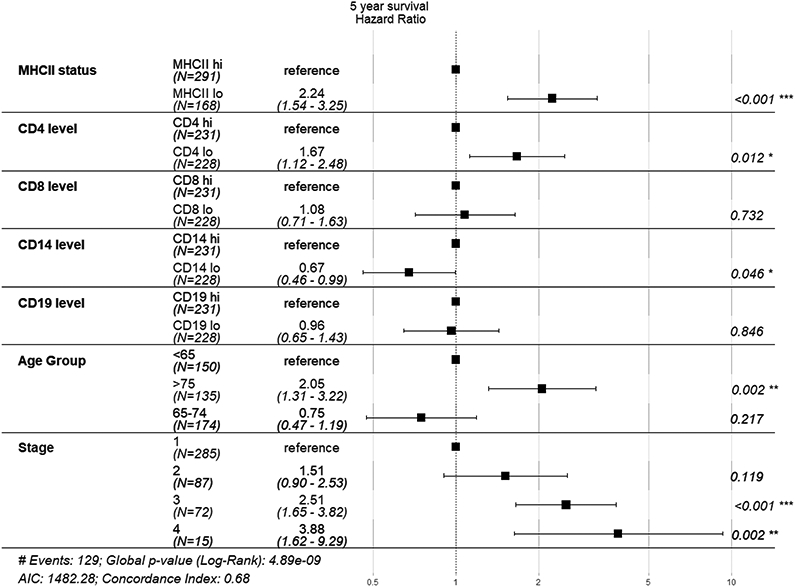
Multivariate analysis of 5 year overall survival
Discussion
While the composition of the TME has been recognized as a determinant of cancer progression and response to therapy, most analyses have focused on a limited number of cell types, and not examined multiple populations and their localization within the tumor. With the application of multispectral tissue imaging and bioinformatic approaches to analyze the TME of resected lung adenocarcinomas, we determined cancer cell MHCII expression associates with the organization and function of the immune infiltrate within the TME. The TME of MHCIIhi tumors contained higher levels of immune cell infiltration, similar to previous observations in melanoma, ovarian, and breast cancers[13, 19, 20]. In contrast to the previous studies of tumor MHCII expression and immune infiltration by IHC on serial sections, multiparameter tissue imaging allowed for simultaneous determination of multiple cell phenotypes and spatial coordinates in our cohort. With this level of single-cell resolution of phenotype and location, we found an increase in immune cell proximity to the tumor cells and degree of immune cell activation within the TME of MHCIIhi tumors. Importantly, within the TME of MHCIIhi tumors, cancer cells exhibited more cell surface in interfaces with CD4+ and CD8+ T cells, suggesting an increase in T cell recognition of cancer cells. In line with this hypothesis, we found patients with resected lung adenocarcinoma and an MHCIIhi tumor status experienced improved survival.
In part, our data of increased immune cell proximity and interface with cancer cells in MHCIIhi tumors strengthens the connection between improved patient outcomes and mechanistic data from animal models. In orthotopic models using the murine lung adenocarcinoma CMT-167 that expresses MHCII in vivo, knockdown of cancer cell-specific MHCII expression resulted in fewer activated CD4+ and CD8+ T cells within the lung cancer TME[6]. Additionally, knock down of MHCII expression in CMT-167 resulted in larger tumors that were less responsive to therapy[6]. Analogous findings were reported with the murine lung adenocarcinoma LLC, which does not express MHCII[6, 21]. Animals challenged with LLC cells transfected to express MHCII showed partial or complete abrogation of tumor growth, which was dependent on CD4+ and CD8+ T cells[21]. Notably, depletion of classical dendritic cells (cDC) in transgenic animals with the diphtheria toxin receptor under control of the CD11c promoter, did not impact the ability of animals to reject MHCII expressing LLC[21]. While other mononuclear phagocytes could serve as antigen presenting cells (APC) in the absence of cDC, one possibility is that the cancer cells expressing MHCII present antigen directly to the CD4+ T cells, resulting in activation. This in turn would lead to production of cytokines such as interferon-γ and augmentation of the immune response in a feedforward manner [21]. This potential role of tumor cell as APC was further supported in an animal model of sarcoma where tumors were not eliminated unless the cancer cell expressed an MHCII neoantigen [22]. Our observation that cancer cells in MHCIIhi tumors more frequently interfaced with CD4+ T cells suggests this cell-cell interaction may play a similar role in immune mediated tumor control in patients with lung cancer.
For patients with clinical and radiographic early stage lung cancer, such as our cohort, the current standard of care is to first proceed with tumor resection[23]. Multiple ongoing clinical trials are evaluating whether neoadjuvant immune checkpoint inhibitors alone or in combination with chemotherapy improves patient outcomes versus standard of care (Reviewed in [24]). Our data associating tumor expression of MHCII with increased immune infiltration and proximity within the TME, indicators of immune recognition of the cancer cells, suggests tumor expression of MHCII may enrich for patients with lung cancer likely to respond to immunotherapy in this setting. Similar observations have been made in other malignancies where tumor expression of MHCII correlates with response to immunotherapy. Patients with metastatic melanoma who received PD-1 or PD-L1 immunotherapy experienced prolonged progression free and overall survival if ≥5% of tumor cells expressed MHCII[13]. Tumor cell expression of MHCII was also a key differentiator for progression free survival in patients with Hodgkin lymphoma who received PD-1 immunotherapy at least 1 year out from autologous stem cell therapy[25]. For patients with HER2 negative breast cancer, response to PD-1 immunotherapy associated with tumor expression of MHCII[26]. Our data demonstrating an association between cancer cell-specific MHCII expression and total number of PD-L1+ cells within the TME suggests the presence of MHCII on cancer cells may provide additional information about the TME immune status that could augment PD-L1 expression as a biomarker for responsiveness to immunotherapy.
Our study provides translational rationale for evaluating cancer cell-specific expression of MHCII as a biomarker for immunotherapy responsiveness in patients with lung cancer. However with our findings, several limitations exist that require the analyses of more modern cohorts. Initial studies can delineate whether cancer cell-specific MHCII associates with improved outcomes for patients with metastatic lung cancer receiving immunotherapy alone or in combination with chemotherapy in squamous and non-squamous histologies. Unlike the neoadjuvant setting, the use of immunotherapy in metastatic lung cancer for first line therapy has been standard of care for several years[23]. With this larger pool of potential patient specimens, further studies can be done with more complex multispectral tissue imaging in conjunction with tissue sequencing to better identify phenotypes and activation status of lymphocytes and leukocytes within the TME. Further work with modern patient cohorts could provide a more detailed insight into the role of cancer cell-specific MHCII and responsiveness to standard of care adjuvant chemotherapy than our cohort was able to address. An extension of our findings would be the hypothesis that patients with MHCIIhi NSCLC possess an active anti-tumor response and adjuvant chemotherapy would not improve survival, akin to observations in patients with deficient mismatch repair colorectal cancer[27]. Standard of care therapy for resected NSCLC continues to evolve and recently the presence of targetable driver oncogenes are now informing adjuvant therapy approaches[28]. While the role of the immune system in targeted therapy responsiveness is unknown, preclinical and translational data suggest engagement of the immune system promotes disease control[9, 29]. Whether cancer cell-specific expression of MHCII is a determinant of the TME and outcomes in patients with targetable oncogenes is unknown and remains an active area of investigation. In summary, we report that lung cancer expression of MHCII associates with levels of immune cell infiltration, spatial localization, and activation status within the TME. Along with pre-clinical data, our results suggest lung cancer expression of MHCII may serve as a biomarker for the immune system’s recognition and activation against the tumor. These insights may inform future approaches to predicting patient responsiveness to immunotherapy.
Supplementary Material
Acknowledgements
ELS is supported by NIH grant K12 CA086913, ACS IRG #16-184-56 from the American Cancer Society to the University of Colorado Cancer Center, and a grant from the Cancer League of Colorado. RN is supported by NIH grant CA236222, DOD grant W81XWH1910221, and grants from the Cancer League of Colorado and the LUNGevity foundation.
The authors wish to thank the Pathology Research Core at Mayo Clinic for their assistance with specimen preparation. The authors wish to thank the Human Immunology Monitoring Shared Resource at the University of Colorado for their assistance with Vectra panel design and multispectral image acquisition, supported by the Cancer Center Support Grant (P30CA046934)
Footnotes
Dr. Schenk reports speaker fees from American Lung Association, Physicians Education Resource, Takeda, Roche, personal fees from Elsevier, and consultant fees from Abbvie, Guidepoint, The ROS1ders, The KOL Connection Ltd, and Bionest Partners, outside the submitted work. All other authors report no disclosures.
Publisher's Disclaimer: This is a PDF file of an unedited manuscript that has been accepted for publication. As a service to our customers we are providing this early version of the manuscript. The manuscript will undergo copyediting, typesetting, and review of the resulting proof before it is published in its final form. Please note that during the production process errors may be discovered which could affect the content, and all legal disclaimers that apply to the journal pertain.
References
- 1.Binnewies M, et al. , Understanding the tumor immune microenvironment (TIME) for effective therapy. Nat Med, 2018. 24(5): p. 541–550. [DOI] [PMC free article] [PubMed] [Google Scholar]
- 2.Remark R, et al. , The non-small cell lung cancer immune contexture. A major determinant of tumor characteristics and patient outcome. Am J Respir Crit Care Med, 2015. 191(4): p. 377–90. [DOI] [PMC free article] [PubMed] [Google Scholar]
- 3.Brambilla E, et al. , Prognostic Effect of Tumor Lymphocytic Infiltration in Resectable Non–Small-Cell Lung Cancer. Journal of Clinical Oncology, 2016. 34(11): p. 1223–1230. [DOI] [PMC free article] [PubMed] [Google Scholar]
- 4.Suzuki K, et al. , Clinical Impact of Immune Microenvironment in Stage I Lung Adenocarcinoma: Tumor Interleukin-12 Receptor ϐ2 (IL-12Rϐ2), IL-7R, and Stromal FoxP3/CD3 Ratio Are Independent Predictors of Recurrence. Journal of Clinical Oncology, 2012. 31(4): p. 490–498. [DOI] [PMC free article] [PubMed] [Google Scholar]
- 5.Donnem T, et al. , Stromal CD8+ T-cell Density—A Promising Supplement to TNM Staging in Non–Small Cell Lung Cancer. Clinical Cancer Research, 2015. 21(11): p. 2635–2643. [DOI] [PubMed] [Google Scholar]
- 6.Johnson AM, et al. , Cancer Cell-Intrinsic Expression of MHC Class II Regulates the Immune Microenvironment and Response to Anti-PD-1 Therapy in Lung Adenocarcinoma. J Immunol, 2020. 204(8): p. 2295–2307. [DOI] [PMC free article] [PubMed] [Google Scholar]
- 7.He Y, et al. , MHC class II expression in lung cancer. Lung Cancer, 2017. 112: p. 75–80. [DOI] [PubMed] [Google Scholar]
- 8.Goldstraw P, et al. , The IASLC Lung Cancer Staging Project: Proposals for Revision of the TNM Stage Groupings in the Forthcoming (Eighth) Edition of the TNM Classification for Lung Cancer. Journal of Thoracic Oncology, 2016. 11(1): p. 39–51. [DOI] [PubMed] [Google Scholar]
- 9.Maynard A, et al. , Therapy-Induced Evolution of Human Lung Cancer Revealed by Single-Cell RNA Sequencing. Cell, 2020. 182(5): p. 1232–1251 e22. [DOI] [PMC free article] [PubMed] [Google Scholar]
- 10.Taube JM, et al. , The Society for Immunotherapy of Cancer statement on best practices for multiplex immunohistochemistry (IHC) and immunofluorescence (IF) staining and validation. J Immunother Cancer, 2020. 8(1). [DOI] [PMC free article] [PubMed] [Google Scholar]
- 11.Johnson KS phenoptr: inForm Helper Functions. R package version 0.2.9. 2020; Available from: https://akoyabio.github.io/phenoptr/. [Google Scholar]
- 12.Kolde R, pheatmap: Pretty Heatmaps. 2019.
- 13.Johnson DB, et al. , Melanoma-specific MHC-II expression represents a tumour-autonomous phenotype and predicts response to anti-PD-1/PD-L1 therapy. Nat Commun, 2016. 7: p. 10582. [DOI] [PMC free article] [PubMed] [Google Scholar]
- 14.Johnson DB, et al. , Tumor-specific MHC-II expression drives a unique pattern of resistance to immunotherapy via LAG-3/FCRL6 engagement. JCI Insight, 2018. 3(24). [DOI] [PMC free article] [PubMed] [Google Scholar]
- 15.Oshima S and Eckels DD, Selective signal transduction through the CD3 or CD2 complex is required for class II MHC expression by human T cells. J Immunol, 1990. 145(12): p. 4018–25. [PubMed] [Google Scholar]
- 16.Lankar D, et al. , Dynamics of major histocompatibility complex class II compartments during B cell receptor-mediated cell activation. J Exp Med, 2002. 195(4): p. 461–72. [DOI] [PMC free article] [PubMed] [Google Scholar]
- 17.Gordon S, Alternative activation of macrophages. Nature Reviews Immunology, 2003. 3(1): p. 23–35. [DOI] [PubMed] [Google Scholar]
- 18.Fooksman DR, et al. , Functional anatomy of T cell activation and synapse formation. Annu Rev Immunol, 2010. 28: p. 79–105. [DOI] [PMC free article] [PubMed] [Google Scholar]
- 19.Callahan MJ, et al. , Increased HLA-DMB expression in the tumor epithelium is associated with increased CTL infiltration and improved prognosis in advanced-stage serous ovarian cancer. Clin Cancer Res, 2008. 14(23): p. 7667–73. [DOI] [PMC free article] [PubMed] [Google Scholar]
- 20.Park IA, et al. , Expression of the MHC class II in triple-negative breast cancer is associated with tumor-infiltrating lymphocytes and interferon signaling. PLoS One, 2017. 12(8): p. e0182786. [DOI] [PMC free article] [PubMed] [Google Scholar]
- 21.Bou Nasser Eddine F, et al. , CIITA-driven MHC class II expressing tumor cells can efficiently prime naive CD4(+) TH cells in vivo and vaccinate the host against parental MHC-II-negative tumor cells. Oncoimmunology, 2017. 6(1): p. e1261777. [DOI] [PMC free article] [PubMed] [Google Scholar]
- 22.Alspach E, et al. , MHC-II neoantigens shape tumour immunity and response to immunotherapy. Nature, 2019. 574(7780): p. 696–701. [DOI] [PMC free article] [PubMed] [Google Scholar]
- 23.National Comprehensive Cancer Network. Non-Small Cell Lung Cancer (Version 1.2021). December15, 2020]; Available from: https://www.nccn.org/professionals/physician_gls/pdf/nscl.pdf.
- 24.Gentzler RD, Riley DO, and Martin LW, Striving toward Improved Outcomes for Surgically Resectable Non-Small Cell Lung Cancer: the Promise and Challenges of Neoadjuvant Immunotherapy. Current Oncology Reports, 2020. 22(11): p. 109. [DOI] [PubMed] [Google Scholar]
- 25.Roemer MGM, et al. , Major Histocompatibility Complex Class II and Programmed Death Ligand 1 Expression Predict Outcome After Programmed Death 1 Blockade in Classic Hodgkin Lymphoma. Journal of Clinical Oncology, 2018. 36(10): p. 942–950. [DOI] [PMC free article] [PubMed] [Google Scholar]
- 26.Wulfkuhle JD, et al. , Quantitative MHC II protein expression levels in tumor epithelium to predict response to the PD1 inhibitor pembrolizumab in the I-SPY 2 Trial. Journal of Clinical Oncology, 2019. 37(15_suppl): p. 2631–2631. [Google Scholar]
- 27.Sargent DJ, et al. , Defective Mismatch Repair As a Predictive Marker for Lack of Efficacy of Fluorouracil-Based Adjuvant Therapy in Colon Cancer. Journal of Clinical Oncology, 2010. 28(20): p. 3219–3226. [DOI] [PMC free article] [PubMed] [Google Scholar]
- 28.Wu Y-L, et al. , Osimertinib in Resected EGFR-Mutated Non–Small-Cell Lung Cancer. New England Journal of Medicine, 2020. 383(18): p. 1711–1723. [DOI] [PubMed] [Google Scholar]
- 29.Gong K, et al. , EGFR inhibition triggers an adaptive response by co-opting antiviral signaling pathways in lung cancer. Nature Cancer, 2020. 1(4): p. 394–409. [DOI] [PMC free article] [PubMed] [Google Scholar]
Associated Data
This section collects any data citations, data availability statements, or supplementary materials included in this article.


