

Abstract
We investigated the concordance of mitochondrial DNA heteroplasmic mutations (heteroplasmies) in 6,745 maternal pairs of European (EA, n=4,718 pairs) and African (AA, n=2,027 pairs) Americans in whole blood. Mother-offspring pairs displayed the highest concordance rate, followed by sibling-sibling and more distantly-related maternal pairs. The allele fractions of concordant heteroplasmies exhibited high correlation (R2=0.8) between paired individuals. Discordant heteroplasmies were more likely to be in coding regions, be nonsynonymous or nonsynonymous-deleterious (p<0.001). The number of deleterious heteroplasmies was significantly correlated with advancing age (20–44, 45–64, and ≥65 years, p-trend=0.01). One standard deviation increase in heteroplasmic burden (i.e., the number of heteroplasmies carried by an individual) was associated with 0.17 to 0.26 (p<1e-23) standard deviation decrease in mtDNA copy number, independent of age. White blood cell count and differential count jointly explained 0.5% to 1.3% (p≤0.001) variance in heteroplasmic burden. A genome-wide association and meta-analysis identified a region at 11p11.12 (top signal rs779031139, p=2.0e-18, minor allele frequency=0.38) associated with the heteroplasmic burden. However, the 11p11.12 region is adjacent to a nuclear mitochondrial DNA (NUMT) corresponding to a 542 bp area of the D-loop. This region was no longer significant after removing heteroplasmic mutations within the 542 bp from the heteroplasmic burden. The discovery that blood mtDNA heteroplasmic mutations were both inherited and somatic origins and that an increase in heteroplasmic burden was strongly associated with a decrease in average number of mtDNA copy number in blood are important findings to be considered in association studies of mtDNA with disease traits.
INTRODUCTION
Mitochondria are key organelles for energy metabolism, and they play a critical role in a variety of human diseases.(Wallace and Chalkia 2013) The maternally inherited mitochondrial genome (mtDNA) is present in hundreds or thousands of copies in a cell, depending upon the cell type and its energetic needs. The mtDNA is a 16.6 kb double-stranded DNA that encodes 13 key subunits of the energy-producing oxidative phosphorylation (OXPHOS) pathway, as well as 22 transfer RNAs (tRNAs) and two ribosomal RNAs (rRNAs) for mitochondrial translation.(Voet, Voet, and Pratt 2005) A high mutation rate and maternal inheritance of the mtDNA has given rise to multiple mtDNA haplogroups that reflect the sequential accumulation of mtDNA polymorphisms (i.e. homoplasmic variants), revealing ancestry and patterns of prehistoric migration.(Cann, Stoneking, and Wilson 1987)
Due to the presence of many mtDNA copies within a cell, heteroplasmic mutations (or heteroplasmies) may arise. Heteroplasmy is a phenomenon characterized by two or more mtDNA alleles co-existing at the same locus in different copies of mtDNA within a cell or an individual.(Wallace 2011; Tatarenkov and Avise 2007; Brown, George, and Wilson 1979) Multiple heteroplasmies are common and widespread within the human population,(Li et al. 2010; Zhang et al. 2017) and more likely to be deleterious mutations and located at known disease-associated loci.(Ding et al. 2015; Liu et al. 2018; Lott et al. 2013) Previous studies investigated heteroplasmic mutations across tissues and cells in the same individuals,(Li et al. 2015; Hubner et al. 2019; Marzuki et al. 1997; Taylor et al. 2003) and found that the same heteroplasmic mutations displayed varying mutant-to-wildtype allele frequencies across a wide range of tissues(Marzuki et al. 1997; Li et al. 2015) and in human colonic crypt stem cells(Taylor et al. 2003) in the same individuals, indicating that the observed heteroplasmic mutations must have occurred very early during embryonic development, prior to the differentiation events. Additional studies provided further evidence for the transmission of heteroplasmic mutations in both human and mice.(Wilson et al. 2016; Li et al. 2016; Zaidi et al. 2019; Stewart and Chinnery 2015; Rebolledo-Jaramillo et al. 2014; Floros et al. 2018; Ding et al. 2015) Similarly, a recent study by Wei et al, compared heteroplasmic mutations in 1526 mother-offspring pairs and found that about 20% of heteroplasmic mutations were concordant.(Wei et al. 2019) Despite evidence for the inheritance of heteroplasmic mutations, the mechanisms by which heteroplasmic mutations are transmitted and maintained in humans remains to be fully elucidated.
We carried out a deep whole genome sequencing (WGS) study(Taliun et al. 2021) to investigate the transmission and maintenance of heteroplasmic mutations in extended pedigrees of European and African ancestry (Supplemental Table 1). Owing to maternal inheritance, heteroplasmic mutations are expected to be present throughout maternal lineages. Therefore, the main aim of this study was to investigate the transmission (or concordance) of heteroplasmies in first-degree and more distantly related maternal pairs in large pedigrees. We also investigated the potential functional impact of the concordant and discordant heteroplasmic mutations between paired individuals. The second aim was to investigate whether genetic loci in the nuclear genome (nDNA) are associated with heteroplasmic mutation burden in order to determine the role of nDNA in promoting or maintaining heteroplasmic mutations. To achieve these aims, we developed a comprehensive calling and quality control procedure for identifying mtDNA mutations in WGS (Supplemental Figure 1).
METHODS
Study design and study participants
This study was conducted in three studies with family structures, the Framingham Heart Study (FHS), the Jackson Heart Study (JHS), and the Cleveland Family Study (CFS) (Supplemental Tables 1 and 2). All statistical analyses were conducted in the FHS and JHS owing to their larger sample sizes. The FHS and JHS served as a validation cohort to each other. We used CFS to further validate inconsistent results between FHS and JHS. All study participants provided written informed consent for genetic studies. All study protocols were approved by the respective Institutional Review Board of the Boston University Medical Center, the University of Mississippi Medical Center, and the Mass General Brigham (previously Partners HealthCare).
The FHS is a single-site, community-based, prospective study with extended pedigrees from three generations of European American (EA) participants.(Dawber, Meadors, and Moore 1951; Feinleib et al. 1975; Splansky et al. 2007) All FHS participants have undergone regular health examinations to collect socio-demographic characteristics and cardiovascular disease risk factors. WGS was performed in whole blood samples from 4,196 FHS participants through the Trans-Omics for Precision Medicine (TOPMed) program supported by National Heart, Lung, and Blood Institute’s (NHLBI). This study used 4,036 sequences (54% women, mean age 60) at Freeze 8 after extensive quality control (QC) procedures. The JHS is a prospective, epidemiologic investigation of CVD in African American (AA) participants from Jackson, Mississippi (Wilson et al. 2005) across three exams beginning in 2000–2004. This study used 3,404 sequences (62% women, mean age 56) at Freeze 8 after QC. The JHS included nested pedigrees. The CFS is the largest family-based study of sleep apnea world-wide, recruiting families with a proband with diagnosed sleep apnea and matched neighborhood controls, to study sleep-disordered breathing (SDB) and cardiovascular risk.(Redline et al. 1995) The CFS consists of 2284 individuals (46% African American) from 361 families studied on up to 4 occasions over a period of 16 years.(Redline et al. 1995) The current study included 1,250 CFS participants (55% women, mean age 39, and 52% AA) with WGS. Based on family structures, we defined maternal lineages in both EA and AA participants. In brief, a maternal lineage contained a female founder, her offspring, and all of the grandchildren of the daughters of the founder females.(Liu et al. 2018; Liu et al. 2012)
Whole genome sequencing
Whole blood derived DNA was used for WGS in all participants by several TOPMed sequencing centers.(Taliun et al. 2021) Data acquisition, DNA library construction, and data processing methods are described in details elsewhere (https://www.nhlbiwgs.org/topmed-whole-genome-sequencing-methods-freeze-8). Briefly, ~39X whole genome sequencing was performed at different sequencing centers: New York Genome Center, Broad Institute of MIT and Harvard, University of Washington Northwest Genomics Center, and Illumina Genomic Services.(NCBI and NIH 2017) All samples for a given study were sequenced at the same center. One parent-offspring trio in the FHS was sequenced at each of four sequencing centers for QC purpose. The sequencing reads were aligned to human genome build GRCh37 at each center using similar, but not identical, processing pipelines. The resulting BAM files were transferred from each center to the TOPMed Informatics Research Center (IRC), where they were re-aligned to build GRCh37 using a common pipeline to produce a set of ‘harmonized’ BAM files. Except for the three individuals in the trio, the remaining FHS participants were sequenced at the Broad Institute of MIT and Harvard. The mean coverages were different (between 1450 and 2650) from the four repeated sequencing samples of the same parent-offspring trios by four centers, clearly showing fluctuations in sequencing manipulations across the centers (Supplemental Table 3). The JHS participants were sequenced at University of Washington Northwest Genomics Center, and the CFS participants were sequenced at University of Washington Northwest Genomics Center.
Thresholds and QC procedures to identify mtDNA heteroplasmic mutations
We removed participants without the information for year at blood draw. At each mtDNA locus, we first compared an allele in sequencing data to the revised Cambridge Reference Sequence (rCRS).(Anderson et al. 1981; Andrews et al. 1999) An alternative allele in an individual refers to a different allele observed in sequencing reads when compared to the reference allele at the same locus. The program mitoCaller of the mitoAnalyzer software(Ding et al. 2015) was applied to mtDNA sequence to derive alternative allele fractions (AAFs) for all sites to identify sequence variations including mtDNA homoplasmic variants and heteroplasmic mutations.
The Reconstructed Sapiens Reference Sequence (RSRS) was composed using a global sampling of modern human samples and samples from ancient hominids.(Behar et al. 2012) Because the identification of alternative alleles depends on the reference sequence, we also applied RSRS to participants of both European (FHS) and African (JHS) to identify any bias in comparing results between participants of both European and African. Results in the main text were based on rCRS. All results based on RSRS were displayed in Supplemental Materials.
In TOPMed, four sequencing centers performed sequencing with the same sequencing technology and minor fluctuations in sequencing reads exist across the sequencing centers. We applied four thresholds (t1 and t2), 1% and 99%, 2% and 98%, 3% and 97%, and 4% and 96%, to AAFs to identify the appropriate cutoffs to identify mtDNA sequence variations based on repeated mtDNA genomes of the one parent-offspring trio in the FHS from the four sequencing centers (Supplemental Table 3). A site was defined as a heteroplasmic mutation if its AAF was between t1 and t2 (i.e. t1<AAF< t2). A site was considered a homoplasmic variant of an alternative allele if AAF≥t2.
We developed a comprehensive strategy for QC of mtDNA sequence variations (Supplemental Figure 2). This strategy included both standard procedures used for the QC of nDNA sequence variations and procedures specific to mtDNA sequence variations. First, we investigated sequence coverage (reads) across the 16,569 mtDNA loci in the same individuals and across all individuals at each mtDNA locus. Individuals were red-flagged if their mean coverage was <500. We set an mtDNA locus as missing if the coverage was <250-fold.(Ding et al. 2015) Second, we compared homoplasmic alleles called by genotyping arrays to the ones derived from TOPMed WGS in the same individuals.(Liu et al. 2018) Individuals with >two inconsistent homoplasmic alleles (out of ~200 mtDNA variants genotyped by the arrays) were red-flagged and discrepancies examined. Third, we counted the number of mutations with AAFs between 25% and 75%. Based on our previous investigations, most heteroplasmic mutations displayed low AAF range (<25%).(Liu et al. 2018) Empirically, samples having >5–10 heteroplasmic mutations whose AAFs were between 25–75% were indicative of DNA quality issues and hence were removed from subsequent analyses. Fourth, we compared the homoplasmic variants within maternal lineage members in both EA and AA participants. The nuclear mitochondrial DNA segments (NUMTs) are sequences in nDNA that show high sequence similarity to mtDNA regions (Hazkani-Covo, Zeller, and Martin 2010). NUMTs complicates the sequencing analysis of mtDNA mutations. We followed the instructions by the GATK mitochondrial pipeline to remap mtDNA sequences to the rCRS and used bedtools the ‘intersect’ option to remove NUMT regions from mtDNA bam files. We also removed several sites listed in ‘blacklisted sites’ (301,302,310, 316, 3107, and 16182 mtDNA loci) recommended by GATK (https://console.cloud.google.com/storage/browser/gatk-best-practices/mitochondria-pipeline/).
mtDNA haplogroups
We applied Haplogrep 2 to classify mtDNA haplogroup(Weissensteiner, Pacher, et al. 2016; Kloss-Brandstatter et al. 2011; Weissensteiner, Forer, et al. 2016; van Oven 2015) based on homoplasmic mutations defined by applying the AAF>t2 threshold (Supplemental Materials).
Concordance rate of heteroplasmies between paired individuals
To investigate transmission of heteroplasmic mutations, we formed different types of maternal pairs and random pairs in both EA and AA participants (Supplemental Table 4) based on maternal lineage and mtDNA haplogroup information. The maternal pairs included mother-offspring pairs, sibling-sibling pairs, and distantly related maternal pairs (i.e., grandmother-grandchild, aunt-nephew/niece, and cousin pairs on mothers’ side). For comparison purposes, we identified father-offspring pairs and also formed two types of random pairs (n=2000 each) of individuals of independent maternal lineages. The first type of random pairs belonged to the H or L mtDNA haplogroup (the largest mtDNA haplogroup in EA and AA, respectively), and the second type of random pairs belonged to different mtDNA haplogroups. We investigated the concordance rate in paired individuals of one type (e.g., mother-offspring pairs), and we also calculated the heteroplasmy concordance rate (HCR) between the paired individuals using formula (1) in EA and AA separately.
| (1) |
Annotation of mtDNA heteroplasmic mutations
MitoMap was used to collect information regarding loci, regulatory elements, and previously associated phenotypes for all mtDNA variants (www.mitomap.org). For mtDNA variants within peptide-encoding genes that were non-synonymous, predicted functional effects were collected from MitImpact, a database that has compiled functional predictions across 14 bioinformatics platforms and five metapredictors.(Castellana, Ronai, and Mazza 2015)
To investigate whether heteroplasmic mutations, particularly those mutations predicted to be deleterious, were enriched in older individuals, we compared the proportions of heteroplasmic mutations in different functional categories (i.e., coding regions, nonsynonymous, and deleterious) in three age categories, 20–44, 45–64 and 65+. A nonsynonymous mutation was categorized to be deleterious if the scaled Combined Annotation-Dependent Depletion (CADD)(Rentzsch et al. 2019) score was 15 or above. CADD is an integrative annotation program built around more than 60 genomic features, combined with a machine-learning model trained on a binary distinction between simulated de novo mutations and mutations that exist in human populations. A scaled CADD score of 15 or greater indicates a mutation is amongst the top 5% of deleterious variants in the human genome.(Rentzsch et al. 2019) To further understand heteroplasmy inheritance, we compared proportions of heteroplasmic mutations in different functional categories among the concordant and discordant heteroplasmies in mother-offspring, sibling-sibling, and grandmother-grandchild pairs. We applied the prop.test function of the R software to test whether two proportions were significant different owing to large numbers associated with the proportions in large sample sizes. We used the prop.trend.test function of the R software to test the null hypothesis that there was no trend versus the alternative hypothesis that there was a linear increase in the proportions with the three age categories, 20–44, 45–64, and ≥65 years.
Association analyses of heteroplasmic burden with mtDNA haplogroups, white blood cell count and mtDNA copy number
mtDNA copy number was calculated by the fastMitoCalc program in the software package mitoAnalyzer (Ding et al. 2015) by TOPMed Information Research Center. The average mtDNA CN per cell was estimated as twice the ratio of average coverage of mtDNA to average coverage of the nuclear DNA (nDNA).(Ding et al. 2015) We obtained mtDNA copy number residuals by regressing mtDNA copy number on age, sex and batch variables (year of blood draw for genomic DNA extraction).(Liu et al. 2020) The overall heteroplasmic burden was log-transformed and regressed on sex, age at blood drawn, batch (year at blood drawn) to obtain residuals. Both mtDNA copy number residuals and heteroplasmic burden residual were scaled to have mean of 0 with standard deviation 1 for easier interpretation. We removed samples if their mtDNA copy number residuals or mtDNA heteroplasmic residuals more than 4 standard deviation from the mean. We performed association analyses of heteroplasmic burden residuals with mtDNA haplogroups, copy number residuals, and white blood cell counts. Age and sex were further adjusted in association analysis of heteroplasmic burden residuals with white blood cell counts. For the analysis of heteroplasmic burden residuals with haplogroup, we estimated the least square means of heteroplasmic burden in each haplogroup with the analysis of variance (ANOVA) method to account for largely different haplogroup sizes. We performed pair-wise comparison of the least square mean levels of the heteroplasmic burden between haplogroups. The Tukey’s method was used in ANOVA to account for multiple testing.
Genome-wide association testing of the overall heteroplasmic burden
We quantified heteroplasmic burden by . Here Hik=AAFk, the alternate allele fraction at mtDNA locus k in the ith individual. The overall heteroplasmic burden was log-transformed and regressed on sex, age at blood drawn, batch (year at blood drawn) to obtain residuals. The inverse-normalized residuals were used as dependent variables in genome-wide testing (GWAS) with nDNA single nucleotide polymorphisms (SNPs) of minor allele frequency (MAF)>0.1% (TOPMed Freeze 8, released in February 2019, GRCH38). The Saige Linear Mixed Model was used to account for relatedness with the ENCORE server (https://encore.sph.umich.edu/). The threshold p<5x10⁻⁸ was used for significance to report nDNA loci associated with mtDNA heteroplasmic burden. We also included imputed cell counts (platelet, total white blood cell counts, lymphocyte or neutrophil proportions, eosinophil and basophil proportions) as additional variables in the model to obtain mtDNA CN residuals for GWAS as sensitivity analysis. Several nDNA-encoded proteins for mtDNA replication include twinkle mtDNA helicase gene(Spelbrink et al. 2001) (TWNK, 10q24.31), DNA polymerase subunit γ (Van Goethem et al. 2001) (POLG1, 15q26.1) (Van Goethem et al. 2001), and the mitochondrial transcription factor gene (Larsson et al. 1998) (TRAM, 10q21.1) are essential in the replication and maintenance of mtDNA. We searched whether any variants in these candidate genes were associated with heteroplasmic burden. We also queried whether top mtDNA heteroplasmic mutation-associated loci were quantitative loci for gene expression using the eQTL database in FHS.(Joehanes et al. 2017)
Nuclear mitochondrial DNA or NUMT segments are originated from the transposition of some parts of mitochondrial DNA into the nuclear genome.(Lopez et al. 1994) A recent study reported several common NUMTs after careful validation by long-read sequencing.(Wei et al. 2019) We further investigated whether these reported NUMTs affected the GWAS signals of heteroplasmic burden. If any GWAS signals were adjacent to reported NUMT positions, we re-calculated the heteroplasmic burden by excluding the corresponding mtDNA region of a NUMT and re-performed GWAS using the revised heteroplasmic burden.
RESULTS
We determined that the 3%–97% alternative allele fraction (AAF) threshold gave rise to consistent numbers of homoplasmic and heteroplasmic in the same individuals from the four sequencing centers that yielded different average coverages after applying the sequential AAF thresholds to the repeated sequences of the parent-offspring trios in the FHS (Supplemental Materials, Supplemental Table 3), indicating that different coverage was not correlated with higher number of heteroplasmic mutations at the 3%–97% AAF threshold. Therefore, all subsequent analyses were based on 3%–97% AAF threshold. We focused on results from the FHS and JHS cohorts and used the CFS EA and CFS AA to further validate inconsistent findings between FHS and JHS. For simplicity, we used EA and AA to refer to the FHS and JHS cohort, respectively.
Characteristics of study participants
This study was conducted in three cohorts with family structure, the Framingham Heart Study (FHS) with participants of Europeans American (EA), the Jackson Heart Study (JHS) with participants of African American (AA), and the Cleveland Family Study (CFS) with both AA (51%) and EA (49%) (Supplemental Tables 1 and 2). The FHS and JHS cohorts served as validation samples to each other. The CFS was used to validate different findings between FHS and JHS. The average coverage was 2523 in FHS, 2230 in JHS, and 3000 in CFS. After quality control, 4036 (FHS), 3404 (JHS) and 1250 (CFS) participants remained in the study. The FHS (mean age 60, 54% women, 100% EA) and JHS (mean age 56, 60% women, 100% AA) consisted mostly of middle aged or older participants, while the CFS (mean age 39, 55% women, 51% AA) consisted mostly of younger adults (Supplemental Table 1). We formed paired individuals in each cohorts based on family and maternal lineage (Supplemental materials and Supplemental Tables 2 and 4). In EA participants, we had a total of 1,545 mother-offspring pairs, 1,174 sibling-sibling pairs, 2,850 distantly related maternal pairs, and 1,119 father-offspring pairs. In AA participants, we had a total of 651 mother-offspring pairs, 689 sibling-sibling pairs, and 1,828 distantly related maternal pairs, and 263 father-offspring pairs. In each of the EA and AA cohorts, we formed 2000 pairs of unrelated individuals of the same haplogroup or different haplogroups for comparison purposes.
Heteroplasmic mutations are ubiquitous across the mitochondrial genome
Details for identifying and quality control of heteroplasmic loci are presented in Supplemental Materials. The heteroplasmic loci were located across the entire mtDNA (Figure 1A and Supplemental Figure 3) and displayed similar distributions between EA and AA participants across the 37 gene and D-loop regions (Supplemental Tables 5–8). About one third of heteroplasmic mutations were located in noncoding regions and two thirds located in coding regions, and the proportion of heteroplasmic mutations in noncoding regions was much higher than expected (i.e., ~24% loci are non-coding) (p<2e-16); half of the heteroplasmic mutations in coding regions were nonsynonymous (Figure 1B). Approximately 98% of all observed heteroplasmies were present in <1% of individuals (Figure 1A). Most of the heteroplasmic mutations displayed low AAFs between 3% and 15% within the same individuals (Figure 1C), which is consistent with previous findings from our group and others.(Liu et al. 2018; Ding et al. 2015; He et al. 2010; Ye et al. 2014; Li et al. 2010) Comparison of heteroplasmic mutations identified with the revised Cambridge Reference Sequence (rCRS) and he Reconstructed Sapiens Reference Sequence (RSRS), (Anderson et al. 1981; Andrews et al. 1999) 99.6% heteroplasmic loci in EA and 96.9% loci in AA were concordant (i.e., the same number of mutations at the same mtDNA loci) in the same individuals in both EA and AA (Supplemental Materials, Supplemental Table 9).
Figure 1. Description of mtDNA heteroplasmic mutations in European Americans (FHS) and Africans Americans (JHS).

A, Distribution of mutations in mtDNA and number of individuals carrying mutations; B, Proportion of nonsynonymous (NS), synonymous (SYN) and non-coding (NC) in mutations.
Concordant heteroplasmic mutations are observed in all types of maternal pairs
The concordance rate of mtDNA heteroplasmic mutations referred to the proportion of mutations that were present in both of paired individuals over all heteroplasmic mutations in paired individuals. Mother-offspring pairs displayed the highest average concordance rate, followed by sibling-sibling pairs and other pairs with more distantly maternal pairs in both EA and AA (Figure 2A and Supplemental Figure 4). We further found that the concordant heteroplasmic mutations displayed high correlation (R2~0.80) in their AAFs between paired individuals in both EA and AA (Figures 2B and 2C, Supplemental Figures 5 and 6). Many concordant heteroplasmies did not differ in their AAFs with advancing age (the mean age difference ~23 years between mothers and offspring pairs when blood was drawn in both EA and AA).
Figure 2. Concordant heteroplasmic mutations in paired individuals of European and African Americans.

A. Concordance rates in European (blue) and African (grey) Americans, bottom and top of a box denote 25% and 75 of the values, respectively, and black bar denotes median value and red square denotes the mean value; B. Comparison of alternative allele frequency between mother-offspring pairs in European Americans; C. Comparison of alternative allele frequency between sibling-sibling pairs in European Americans; M-O, mother-offspring; S-S, sibling-sibling; EX-M, distantly related maternal pairs; F-O, father-offspring; S-L, unrelated pairs in the same mtDNA haplogroup; M-L, unrelated pairs of mixed mtDNA haplogroups.
As expected, father-offspring pairs and two types of unrelated pairs displayed much lower average concordance rates compared to any maternal pairs. Unrelated pairs of the same mtDNA haplogroup displayed slightly higher concordance rate than unrelated pairs of mixed haplogroups. Compared to that in unrelated pairs from mixed haplogroups, father-offspring pairs displayed a similar level of concordance rate, indicating that father-offspring transmission is unlikely to occur (Figure 2A and Supplemental Figure 4). Of notes, AA pairs (JHS) displayed higher concordance rates of heteroplasmic mutations compared to the respective EA pairs (FHS) when both rCRS and RSRS were applied to identify mutations; in addition, the rates were similar between the two reference sequences (Supplemental Table 10). The analyses in the CFS EA and CFS AA cohort further validated this finding (Supplemental Figure 4). Using unrelated pairs of mixed haplogroups (i.e., as a population reference), the average concordance rate was 1.5% in EA compared to 4.5% in AA (Figure 2A).
Discordant heteroplasmic mutations are more likely to be nonsynonymous and deleterious than concordant heteroplasmic mutations
The average discordance rate of heteroplasmic mutations refers to the proportion of loci that were observed in one individual but not another in a pair over all heteroplasmic mutation observed in paired individuals. A larger proportion of discordant heteroplasmies were nonsynonymous compared to concordant heteroplasmic mutations (Figure 3). For example, in sibling-sibling pairs of EA participants, 30.8% of discordant loci were nonsynonymous while 12.4% of concordant loci were nonsynonymous (Z-test for proportions, p=2.2e-16). Furthermore, a larger proportion of discordant mutations were deleterious compared to concordant ones: 9.9% of discordant loci versus 5.8% of concordant loci were deleterious in EA mother-offspring pairs (Z-test for proportions, p=1.2e-7); 13.9% of discordant loci versus 4.3% of concordant loci were deleterious in EA sibling-sibling pairs (Z-test for proportions, p=1.9e-13) (Figure 3). Similar findings were observed in mother-offspring and sibling-sibling pairs in AA participants (Supplemental Figure 7).
Figure 3. Discordant heteroplasmic mutations are more likely to be deleterious than concordant heteroplasmic mutations.

The proportion of concordant heteroplasmic mutations in noncoding, coding regions, being nonsynonymous (NS), and being deleterious with CADD ≥15 (CADD15) in Mother-offspring and sibling-sibling pairs in the Framingham Heart Study (FHS).
Older individuals carry a higher burden of deleterious heteroplasmic mutations
Of all heteroplasmic mutations in both paired individuals, older individuals carried a larger proportion of discordant mutations compared to younger individuals. For example, of all heteroplasmic mutations in EA mother-offspring pairs, 21.2% mutations were concordant between mothers and offspring, 45.5% were only observed in mothers while 33.2% were present only in offspring (Z-test for proportions, p<2.2e-16). In contrast, offspring pairs carried similar proportions of discordant heteroplasmic mutations between each other because sibling-sibling pairs were formed without regard for age (Figure 4A). Similar findings were also observed in mother-offspring and offspring-offspring pairs in AA (Supplemental Figure 8A).
Figure 4. Heteroplasmy and age in participants of European descent.
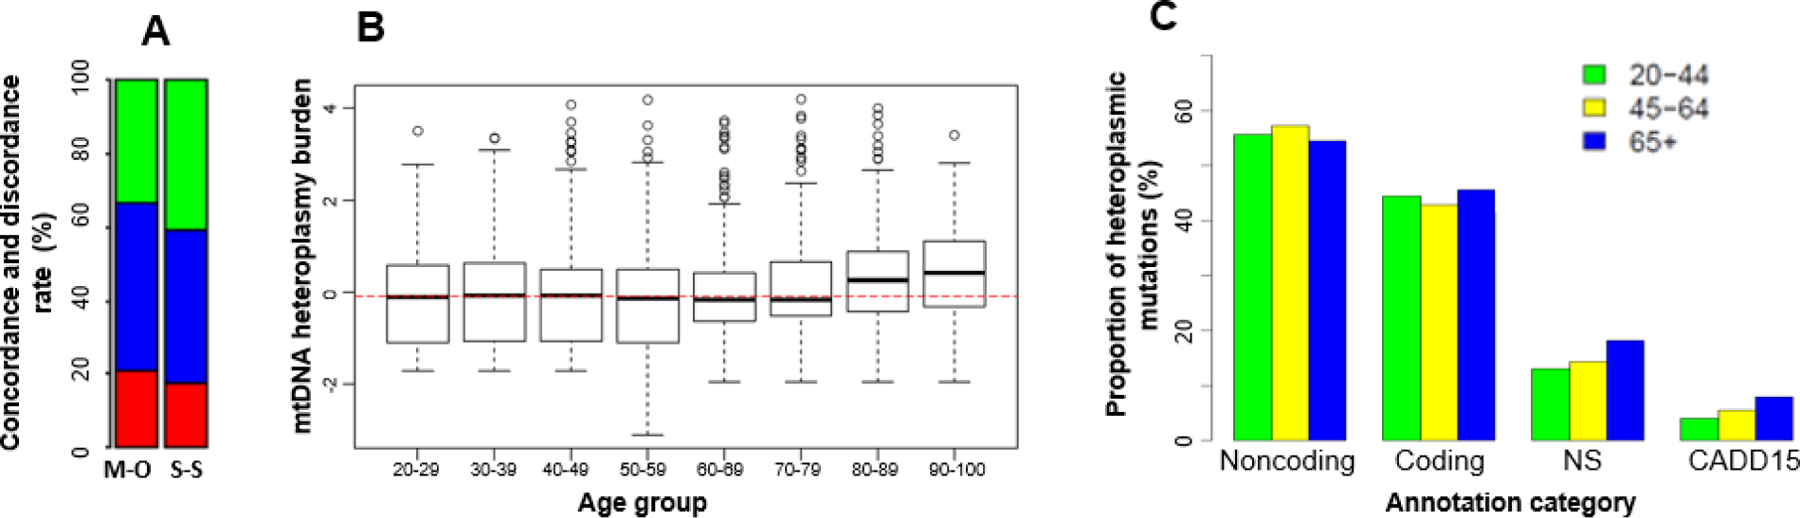
A. Concordant (red color) and discordant (green and blue colors) heteroplasmic mutations between mother-offspring (M-O) and sibling-sibling (S-S) pairs, in mother-offspring bar, the blue portion is the proportion of discordant heteroplasmic mutations in mothers only and the green portion is the proportion of discordant mutations in offspring only, the green and blue proportions in the sibling-sibling bar represent the proportion of mutations in sibling pairs; B. The overall burden of mtDNA heteroplasmic mutations in different age groups; C. The proportion of heteroplasmic mutations according to functional annotations in individuals of 20–44, 45–64 and 65 or above; Noncoding, the proportion of heteroplasmies in noncoding regions. Coding, the proportion of heteroplasmies in 13 protein-coding regions; NS, the proportion of nonsynonymous in coding heteroplasmies; CADD15, the proportion of possibly deleterious nonsynonymous mutations with CADD≥15 in coding heteroplasmies.
A comparison of the heteroplasmic burden (i.e., the total number of heteroplasmic mutations in a region or across mtDNA in an individual) in age groups found that the heteroplasmic burden was at a similar level in participants across a wide age range, but became significantly greater in individuals ≥ 80 years in EA (p<0.002) and ≥70 years in AA participants (p<0.004) (Figure 4B and Supplemental Figure 8B). This trend did not change after adjusting for cell counts (Supplemental Figure 9). We further compared heteroplasmic burden in age group, 20–44, 45–64, and ≥65 years, according to functional annotations (noncoding, coding, nonsynonymous, and possibly deleterious with Combined Annotation-Dependent Depletion (Rentzsch et al. 2019) or CADD≥15) (Figure 4C, Supplemental Figure 8C). Both AA and EA participants carried a higher burden of heteroplasmic mutations in noncoding regions than in coding regions across all age groups. Participants of 65 years and older carried a greater burden of nonsynonymous heteroplasmic mutations compared to younger individuals in both EA and AA participants. The burden of deleterious heteroplasmic mutations increased with advancing age (20–44, 45–64, and ≥65 years) with trend test p=0.010 in both EA and AA (Figure 4C, Supplemental Figure 8C). The heteroplasmic burden was not significantly different between men and women in EA (p>0.05), but was greater in men compared to women in AA (p=0.0004) after accounting for age and batch effects (Supplemental Table 11).
The heteroplasmic burden is moderately associated with white blood cell count and differential count, and mtDNA haplogroup
To test the hypothesis that the heteroplasmy burden was associated with inflammation in humans, we performed association analyses of mtDNA CN with white blood cell count variables. We found that the total heteroplasmic burden was modestly associated with imputed white blood cell counts and differentials. The cell counts jointly explained 1.3% (p=1e-7, EA) and 0.5% (p=0.001, AA) of the heteroplasmic burden (Supplemental Table 12), indicating that heteroplasmic burden may have a weak correlation with inflammation status and that heteroplasmic mutations or mutation allele frequencies are likely to be slightly different across white blood cells. We applied Haplogrep 2 to classify mtDNA haplogroup (Weissensteiner, Pacher, et al. 2016; Kloss-Brandstatter et al. 2011; Weissensteiner, Forer, et al. 2016; van Oven 2015) based on homoplasmic mutations defined by applying the AAF>t2 (97%) threshold mtDNA haplogroups were significantly associated with the total heteroplasmic burden, explaining 5.3% (p<1e-16, EA) and 8.6% (p<1e-16, AA) of the variability in heteroplasmic burden. Pairwise comparisons demonstrated that the heteroplasmic burden differed significantly between haplogroups (Supplemental Table 13).
High mtDNA heteroplasmic burden is associated with low mtDNA copy number
We tested the hypothesis that a higher heteroplasmy burden is an independent factor involved in the down regulation of the transcription of mtDNA CN. We found that one standard deviation increase in heteroplasmic burden was associated with 0.26 (p=3.2e-89, n=4,001 European Americans) and 0.17 (p=5.0e-24, n=3,369 African Americans) standard deviation decrease in mtDNA copy number. The association between mtDNA copy number residuals and heteroplasmic burden residuals remained similar with and without adjustment for white blood cell count and differential count in both European and African Americans (Supplemental materials).
A NUMT segment at 11p11–12 region is significantly associated with the overall heteroplasmic mutation burden
Using the SAIGE(Zhou et al. 2018) method provided by ENCORE (The University of Michigan), 15,037,233 (Freeze 8, EA) and 29,391,078 (Freeze 8, AA) nDNA variants (MAF>0.1%) were tested for association with the overall burden of heteroplasmy. There was little or no inflation (genomic inflation factor λ=1.00 in EA and 1.05 in AA) (Supplemental Figures 10 and 11). Hundreds of variants at the Olfactory Receptor Family 4 Subfamily C Member 12 region (OR4C12, 11p11.12) were associated with heteroplasmic burden (at p <5e-8 in both cohorts (Supplemental Figures 10 and 11). In EA, the lowest p-value was observed at rs2773516 (p= 7.1E-10; MAF=0.40, A/C; chr11: 50427662), which explained 1.3% of variability in heteroplasmic burden. In AA, the lowest p-value was observed at rs36145545 (p= 9.4E-11; MAF=0.38, G/A; chr11:50074179), which explained 1.2% of variability in heteroplasmic burden. We performed a sensitivity analysis in the same sample size with cell counts as additional covariates. The GWAS signals attenuated in the EA (Supplemental Figure 12), but it remained unchanged in the AA, after adjusting for cell counts (Supplemental Figure 13).
Meta-analysis of variants with MAF ≥1% that were associated with heteroplasmic burden identified 1,277 SNPs at 11p11.12 with p<5e-8 (the top signal at rs779031139, p=2.0e-18; frequency of A allele =0.38 in EA and 0.67 in AA) in meta-analysis of EA and AA (Supplemental Table 14). None of the variants in TWNK(Spelbrink et al. 2001), TRAM(Larsson et al. 1998), and POLG1(Van Goethem et al. 2001) were significantly associated with heteroplasmic mutation burden. Many of the top SNPs (n=1,031) act as long-range cis regulators of PTPRJ (protein tyrosine phosphatase receptor type J) (Supplemental Table 16). PTPRJ is a signaling molecule that regulates a variety of cellular processes, including cell growth, differentiation, mitotic cycle, and oncogenic transformation.
The discovered GWAS region at 11p11.12 was adjacent to the region between two Junction positions of a NUMT (11:49883569 and 11:49883572) (Wei et al. 2019) although the regions between these two positions were not among significant loci (Supplemental Table 14). The corresponding region of this NUMT in mtDNA is a 542 bp area in the D-loop (61 (−) and 16088(−)). We re-calculated the heteroplasmic burden after excluding the heteroplasmic mutations within the 542 bp region in the D-loop and re-performed GWAS using the revised heteroplasmic burden. The observed significant GWAS was no longer significant (Supplemental Figure 14) with the revised heteroplasmic burden.
DISCUSSION
Understanding the transmission of mtDNA heteroplasmic mutations is essential to study the role of mtDNA in relation to a variety of disease phenotypes. Despite maternal inheritance and the lack of germline recombination,(Zsurka et al. 2007; Hagstrom et al. 2014) the inheritance and transmission of heteroplasmies is complex. In two cohorts with the large sequencing depth in mtDNA, we have carefully chosen a threshold of alternative allele frequency to identify mtDNA sequence variations. We also compared the concordance rates of heteroplasmic mutations in mother-offspring and other types of maternal pairs in EA and AA. We replicated previous reports that many heteroplasmic mutations are transmitted from mothers to offspring.(Wei et al. 2019; Ding et al. 2015) In addition, we observed that concordant heteroplasmic mutations were present in sibling-sibling pairs and more distantly related maternal pairs. Many of the transmitted heteroplasmic mutations exhibited similar alternative allele fractions between maternal pairs. The concordance rate of heteroplasmies was highest between the founder women and their offspring, and become lower in more distantly related pairs, and continued to decay to a low level in unrelated pairs within the same mtDNA haplogroup. Based on functional annotation, concordant heteroplasmic mutations were more likely to be non-coding and synonymous, and thus, they were less likely to impact mitochondrial function. In contrast, the discordant heteroplasmic mutations were more likely to be non-synonymous and deleterious.
The observations that a larger proportion of concordant heteroplasmies in mother-offspring pairs were synonymous than non-synonymous are likely due to the bottleneck effect and purifying selection, which has been previously reported in both mice and humans. (Stewart et al. 2008; Rebolledo-Jaramillo et al. 2014; Floros et al. 2018; Hubner et al. 2019; Guo et al. 2013; Wilson et al. 2016; Zaidi et al. 2019; Li et al. 2016) The bottleneck phenomenon refers to a condition whereby a large number of mtDNA molecules are present in a mother’s germ cell, while only a subset of mtDNA molecules are transmitted into an oocyte.(Stewart and Chinnery 2015) Purifying selection, the selective removal of heteroplasmic alleles that are deleterious, is thought to be important in shaping mtDNA sequence evolution.(Ruiz-Pesini et al. 2004) A previous study using the mtDNA mutator mice expressing a proofreading-deficient mitochondrial DNA polymerase (PolyAmut) has provided the first and direct evidence that mtDNA mutations are subject to a strong purifying effect.(Stewart et al. 2008) The purifying effect and bottleneck phenomenon on deleterious mtDNA heteroplasmies have also been observed in human mother-child pairs,(Rebolledo-Jaramillo et al. 2014; Guo et al. 2013) the developing primordial germ cells (PGCs) within healthy female human embryos,(Floros et al. 2018) and between human liver lobes.(Hubner et al. 2019). In the present study, we also observed that the concordant heteroplasmies exhibited similar alternative allele fractions between maternal pairs. We do not consider this observation counterintuitive to the bottleneck effect and a substantial drift of heteroplasmy frequency between generations, because the high correlation of alternative allele fractions were only observed between concordant heteroplasmies, a small proportion of heteroplasmies that were transmitted between generations. Taken together, the dynamics of mtDNA heteroplasmy in transmission adds to the complexity of studying the role of mtDNA heteroplasmy in human diseases.
A large proportion of heteroplasmic mutations, however, was discordant between mothers and offspring. The discordant heteroplasmies may result from combinations of the three events: a bottleneck phenomenon, clonal expansion – the rapid replication of the mtDNA) occurs during oocyte maturation, and de novo mutations. The clonal expansion occurs after a subset of heteroplasmies are transmitted into an oocyte, and thus, some undetectable heteroplasmies in mothers may become detectable (and thus are considered de novo) in offspring due to the increase of alternative allele frequencies. For deleterious heteroplasmies, a non harmful mutation of a low allele frequency in a mother may be abruptly transformed into a disease-causing mutation of a high allele frequency due to this bottleneck and subsequent clonal expansion. (Rebolledo-Jaramillo et al. 2014) The fact that a much larger proportion of heteroplasmies was observed in older individuals within maternal pairs may reflect both de novo mutations and an increase in alternative allele frequencies during aging. Further research is needed to investigate the functional significance of de novo heteroplasmies and those that increase their allele frequencies during aging.
In this cross-sectional study, we observed that the level of heteroplasmic burden in whole blood was at similar levels, on average, across most of the age ranges in a large number of participants of European and African Americans. The lifespan of white blood cells ranges from 13–20 days.(Kline and Cliffton 1952) Old white blood cells are destroyed and replaced by newly generated white blood cells from stem cells in bone marrow. This turnover of white blood cells may explain the stable heteroplasmic burden across the most of the age range of our study sample. However, this turnover mechanism of white blood cells is not able to explain the observation of a significant increase in heteroplasmic burden in older age. It can neither explain the observation that the burden of deleterious (combined annotation-dependent depletion score ≥15) heteroplasmies was significantly correlated with advancing age (20–44, 45–64, and ≥65 years). Therefore, there might exist a molecular ‘brake’ on the regulation of mtDNA heteroplasmic mutations. This molecular ‘brake’ is likely to become less effective during aging. The accumulation of deleterious mtDNA mutations disturbs the integrity of mtDNA, which may lead to impaired mitochondrial function contributing to the pathogenesis of age-related disease.(Chistiakov et al. 2014) Although the true impact of heteroplasmic mutations on human health remains to be investigated, this study observed that that a higher heteroplasmy burden was significantly associated with a lower level of mtDNA CN in whole blood. This observation indicates that heteroplasmy burden may be an independent factor involved in the down regulation of the transcription of mtDNA CN, and in turn, that it reduces mitochondrial function and increases the chance of the development of a disease condition. In addition, the significant association of the heteroplasmy burden with white blood cell count indicates that the heteroplasmy burden may also play a role in the inflammation processes, such as atherosclerosis, diabetes, and obesity.
Because nDNA plays an essential role in the replication of mtDNA, we conducted a GWAS of heteroplasmic burden. Of note, none of variants in the candidate mtDNA regulatory genes (TWNK(Spelbrink et al. 2001), TRAM(Larsson et al. 1998), and POLG1(Van Goethem et al. 2001)) are significantly associated with heteroplasmic burden. Instead, we found that a long chromosomal region at 11p11.12 is significantly associated with overall heteroplasmic burden. This region harbors the olfactory receptor family 4 gene and several pseudogenes that do not show clear functional inference regarding their roles in promoting or maintaining mtDNA heteroplasmy. However, the observed significant GWAS was no longer significant after we excluded the heteroplasmic mutations within a 542 bp region in the D-loop, confirming that this long region in which most SNPs are in strong LD is a long NUMT region that masquerades as a heteroplasmic haplotype in human population.(Wei et al. 2019)
Strengths and limitations
We developed comprehensive quality control strategies for the identification of heteroplasmic mutations using WGS. Consistent quality control and identification of heteroplasmic mutations is critical to facilitate trait-association analysis of heteroplasmic mutations across the TOPMed cohorts. We applied the same AAF thresholds to identify heteroplasmic mutations in participants of both EA and AA. Despite the multiple strengths in this study, several limitations should be noted.
Despite multiple strengths in this study, the findings in this study, i.e., the location, the heteroplasmic allele frequency, and the burden of heteroplasmic mutations in whole blood may not be reflective of that in other tissues. A previous study sequenced the entire mtDNA genome (~3,500-fold coverage) from all 12 tissues (including blood, ovary, skin, cerebrum, cerebellum, cortex, skeletal muscle, myocardial muscle, liver, kidney, large intestine, small intestine) that were obtained at autopsy from 152 individuals.(Li et al. 2015) Surprisingly, this study observed that different heteroplasmic frequencies were present at different mtDNA positions across different tissues. In addition, this study also found liver-specific heteroplasmic contained a high proportion of nonsynonymous heteroplasmies that were predicted to have an impact on protein function.(Li et al. 2015) Similar findings were reported from another study that compared the mtDNA heteroplasmies from two liver lobes and whole blood from 83 human samples obtained at autopsy: this study observed that the two liver lobes harbored a significant higher number of heteroplasmies, especially in the protein coding regions, than whole blood samples from the same individuals.(Hubner et al. 2019) Additionally, more than two-third of the heteroplasmies observed in liver were discordant between the two lobes.(Hubner et al. 2019) This tissue-specific segregation of mtDNA heteroplasmic mutations implies that strong nuclear-mitochondrial interactions play important roles in the transmission and selection of mtDNA mutations.(Stewart et al. 2008) Nevertheless, 43% of the total heteroplasmies in the 12 tissues were observed in three or more tissues in an individual,(Li et al. 2015) suggesting that heteroplasmies found in peripheral blood, the most easily accessible and least invasive tissue to obtain, may still provide important information in mtDNA disease susceptibility.
Supplementary Material
HIGHLIGHTS.
The concordance rate of mitochondrial DNA heteroplasmic mutation in whole blood is highest in mother-offspring pairs, followed by sibling-sibling and more distantly-related maternal pairs.
Discordant heteroplasmies are more likely to be in coding regions, be nonsynonymous or nonsynonymous-deleterious.
The number of deleterious heteroplasmies is significantly correlated with advancing age.
The heteroplasmic burden is significantly correlated with the decrease in mitochondrial DNA copy number, independent of age.
Acknowledgement
This work is funded by R01AG059727 and R21HL144877.
We appreciate Dr Andrew Paterson for his valuable suggestions regarding the NUMT in GWAS of heteroplasmic mutation burden. Dr. Paterson is from Program in Genetics and Genome Biology, The Hospital for Sick Children, Toronto, ON, Canada.
TOPMed Acknowledgements
Molecular data for the Trans-Omics in Precision Medicine (TOPMed) program was supported by the National Heart, Lung and Blood Institute (NHLBI). See the TOPMed Omics Support Table in the Supplemental Materials for study specific omics support information. Core support including centralized genomic read mapping and genotype calling, along with variant quality metrics and filtering were provided by the TOPMed Informatics Research Center (3R01HL-117626–02S1; contract HHSN268201800002I). Core support including phenotype harmonization, data management, sample-identity QC, and general program coordination were provided by the TOPMed Data Coordinating Center (R01HL-120393; U01HL-120393; contract HHSN268201800001I). We gratefully acknowledge the studies and participants who provided biological samples and data for TOPMed. See Supplemental Materials for additional study specific acknowledgements.
Footnotes
Publisher's Disclaimer: This is a PDF file of an unedited manuscript that has been accepted for publication. As a service to our customers we are providing this early version of the manuscript. The manuscript will undergo copyediting, typesetting, and review of the resulting proof before it is published in its final form. Please note that during the production process errors may be discovered which could affect the content, and all legal disclaimers that apply to the journal pertain.
Publisher's Disclaimer: Disclaimer: The views expressed in this manuscript are those of the authors and do not necessarily represent the views of the National Heart, Lung, and Blood Institute; the National Institutes of Health; or the U.S. Department of Health and Human Services.
References
- Anderson S, Bankier AT, Barrell BG, de Bruijn MH, Coulson AR, Drouin J, Eperon IC, Nierlich DP, Roe BA, Sanger F, Schreier PH, Smith AJ, Staden R, and Young IG 1981. ‘Sequence and organization of the human mitochondrial genome’, Nature, 290: 457–65. [DOI] [PubMed] [Google Scholar]
- Andrews RM, Kubacka I, Chinnery PF, Lightowlers RN, Turnbull DM, and Howell N 1999. ‘Reanalysis and revision of the Cambridge reference sequence for human mitochondrial DNA’, Nat Genet, 23: 147. [DOI] [PubMed] [Google Scholar]
- Behar DM, van Oven M, Rosset S, Metspalu M, Loogvali EL, Silva NM, Kivisild T, Torroni A, and Villems R 2012. ‘A “Copernican” reassessment of the human mitochondrial DNA tree from its root’, Am J Hum Genet, 90: 675–84. [DOI] [PMC free article] [PubMed] [Google Scholar]
- Brown WM, George M Jr., and Wilson AC 1979. ‘Rapid evolution of animal mitochondrial DNA’, Proc Natl Acad Sci U S A, 76: 1967–71. [DOI] [PMC free article] [PubMed] [Google Scholar]
- Cann RL, Stoneking M, and Wilson AC 1987. ‘Mitochondrial DNA and human evolution’, Nature, 325: 31–6. [DOI] [PubMed] [Google Scholar]
- Castellana S, Ronai J, and Mazza T 2015. ‘MitImpact: an exhaustive collection of pre-computed pathogenicity predictions of human mitochondrial non-synonymous variants’, Hum Mutat, 36: E2413–22. [DOI] [PubMed] [Google Scholar]
- Chistiakov DA, Sobenin IA, Revin VV, Orekhov AN, and Bobryshev YV 2014. ‘Mitochondrial aging and age-related dysfunction of mitochondria’, Biomed Res Int, 2014: 238463. [DOI] [PMC free article] [PubMed] [Google Scholar]
- Dawber TR, Meadors GF, and Moore FE Jr. 1951. ‘Epidemiological approaches to heart disease: the Framingham Study’, Am J Public Health Nations Health, 41: 279–81. [DOI] [PMC free article] [PubMed] [Google Scholar]
- Ding J, Sidore C, Butler TJ, Wing MK, Qian Y, Meirelles O, Busonero F, Tsoi LC, Maschio A, Angius A, Kang HM, Nagaraja R, Cucca F, Abecasis GR, and Schlessinger D 2015. ‘Assessing Mitochondrial DNA Variation and Copy Number in Lymphocytes of ~2,000 Sardinians Using Tailored Sequencing Analysis Tools’, PLoS Genet, 11: e1005306. [DOI] [PMC free article] [PubMed] [Google Scholar]
- Feinleib M, Kannel WB, Garrison RJ, McNamara PM, and Castelli WP 1975. ‘The Framingham Offspring Study. Design and preliminary data’, Prev Med, 4: 518–25. [DOI] [PubMed] [Google Scholar]
- Floros VI, Pyle A, Dietmann S, Wei W, Tang WCW, Irie N, Payne B, Capalbo A, Noli L, Coxhead J, Hudson G, Crosier M, Strahl H, Khalaf Y, Saitou M, Ilic D, Surani MA, and Chinnery PF 2018. ‘Segregation of mitochondrial DNA heteroplasmy through a developmental genetic bottleneck in human embryos’, Nat Cell Biol, 20: 144–51. [DOI] [PMC free article] [PubMed] [Google Scholar]
- Guo Y, Li CI, Sheng Q, Winther JF, Cai Q, Boice JD, and Shyr Y 2013. ‘Very low-level heteroplasmy mtDNA variations are inherited in humans’, J Genet Genomics, 40: 607–15. [DOI] [PMC free article] [PubMed] [Google Scholar]
- Hagstrom E, Freyer C, Battersby BJ, Stewart JB, and Larsson NG 2014. ‘No recombination of mtDNA after heteroplasmy for 50 generations in the mouse maternal germline’, Nucleic Acids Res, 42: 1111–6. [DOI] [PMC free article] [PubMed] [Google Scholar]
- Hazkani-Covo E, Zeller RM, and Martin W 2010. ‘Molecular poltergeists: mitochondrial DNA copies (numts) in sequenced nuclear genomes’, PLoS Genet, 6: e1000834. [DOI] [PMC free article] [PubMed] [Google Scholar]
- He Y, Wu J, Dressman DC, Iacobuzio-Donahue C, Markowitz SD, Velculescu VE, Diaz LA Jr., Kinzler KW, Vogelstein B, and Papadopoulos N 2010. ‘Heteroplasmic mitochondrial DNA mutations in normal and tumour cells’, Nature, 464: 610–4. [DOI] [PMC free article] [PubMed] [Google Scholar]
- Hubner A, Wachsmuth M, Schroder R, Li M, Eis-Hubinger AM, Madea B, and Stoneking M 2019. ‘Sharing of heteroplasmies between human liver lobes varies across the mtDNA genome’, Sci Rep, 9: 11219. [DOI] [PMC free article] [PubMed] [Google Scholar]
- Joehanes R, Zhang X, Huan T, Yao C, Ying SX, Nguyen QT, Demirkale CY, Feolo ML, Sharopova NR, Sturcke A, Schaffer AA, Heard-Costa N, Chen H, Liu PC, Wang R, Woodhouse KA, Tanriverdi K, Freedman JE, Raghavachari N, Dupuis J, Johnson AD, O’Donnell CJ, Levy D, and Munson PJ 2017. ‘Integrated genome-wide analysis of expression quantitative trait loci aids interpretation of genomic association studies’, Genome Biol, 18: 16. [DOI] [PMC free article] [PubMed] [Google Scholar]
- Kline DL, and Cliffton EE 1952. ‘Lifespan of leucocytes in man’, J Appl Physiol, 5: 79–84. [DOI] [PubMed] [Google Scholar]
- Kloss-Brandstatter A, Pacher D, Schonherr S, Weissensteiner H, Binna R, Specht G, and Kronenberg F 2011. ‘HaploGrep: a fast and reliable algorithm for automatic classification of mitochondrial DNA haplogroups’, Hum Mutat, 32: 25–32. [DOI] [PubMed] [Google Scholar]
- Larsson NG, Wang J, Wilhelmsson H, Oldfors A, Rustin P, Lewandoski M, Barsh GS, and Clayton DA 1998. ‘Mitochondrial transcription factor A is necessary for mtDNA maintenance and embryogenesis in mice’, Nat Genet, 18: 231–6. [DOI] [PubMed] [Google Scholar]
- Li M, Rothwell R, Vermaat M, Wachsmuth M, Schroder R, Laros JF, van Oven M, de Bakker PI, Bovenberg JA, van Duijn CM, van Ommen GJ, Slagboom PE, Swertz MA, Wijmenga C, Consortium Genome of Netherlands, Kayser M, Boomsma DI, Zollner S, de Knijff P, and Stoneking M 2016. ‘Transmission of human mtDNA heteroplasmy in the Genome of the Netherlands families: support for a variable-size bottleneck’, Genome Res, 26: 417–26. [DOI] [PMC free article] [PubMed] [Google Scholar]
- Li M, Schonberg A, Schaefer M, Schroeder R, Nasidze I, and Stoneking M 2010. ‘Detecting heteroplasmy from high-throughput sequencing of complete human mitochondrial DNA genomes’, Am J Hum Genet, 87: 237–49. [DOI] [PMC free article] [PubMed] [Google Scholar]
- Li M, Schroder R, Ni S, Madea B, and Stoneking M 2015. ‘Extensive tissue-related and allele-related mtDNA heteroplasmy suggests positive selection for somatic mutations’, Proc Natl Acad Sci U S A, 112: 2491–6. [DOI] [PMC free article] [PubMed] [Google Scholar]
- Liu C, Fetterman JL, Liu P, Luo Y, Larson MG, Vasan RS, Zhu J, and Levy D 2018. ‘Deep sequencing of the mitochondrial genome reveals common heteroplasmic sites in NADH dehydrogenase genes’, Hum Genet, 137: 203–13. [DOI] [PMC free article] [PubMed] [Google Scholar]
- Liu C, Yang Q, Hwang SJ, Sun F, Johnson AD, Shirihai OS, Vasan RS, Levy D, and Schwartz F 2012. ‘Association of genetic variation in the mitochondrial genome with blood pressure and metabolic traits’, Hypertension, 60: 949–56. [DOI] [PMC free article] [PubMed] [Google Scholar]
- Liu X, Longchamps RJ, Wiggins K, Raffield L, Bielak L, Zhao W, Pitsillides AN, Blackwell T, Yao J, Guo X, Kurniansyah N, Thyagarajan B, Pankratz N, Rich SS, Taylor KD, Peyser PA, Heckbert SR, Seshadri S, Cupples LA, Boerwinkle E, Grove ML, Larson N, Smith JA, Vasan RS, Sofer T, Fitzpatrick AL, Fornage M, Ding J, Correa A, Abecasis G, Psaty BM, Wilson JG, Levy D, Rotter JI, Bis JC, Satizabal CL, Arking DE, and Liu C 2020. ‘Association of mitochondrial DNA copy number with cardiometabolic diseases in a large cross-sectional study of multiple ancestries’, medRxiv [DOI] [PMC free article] [PubMed] [Google Scholar]
- Lopez JV, Yuhki N, Masuda R, Modi W, and O’Brien SJ 1994. ‘Numt, a recent transfer and tandem amplification of mitochondrial DNA to the nuclear genome of the domestic cat’, J Mol Evol, 39: 174–90. [DOI] [PubMed] [Google Scholar]
- Lott MT, Leipzig JN, Derbeneva O, Xie HM, Chalkia D, Sarmady M, Procaccio V, and Wallace DC 2013. ‘mtDNA Variation and Analysis Using Mitomap and Mitomaster’, Curr Protoc Bioinformatics, 44: 1 231–26. [DOI] [PMC free article] [PubMed] [Google Scholar]
- Marzuki S, Berkovic SF, Saifuddin Noer A, Kapsa RM, Kalnins RM, Byrne E, Sasmono T, and Sudoyo H 1997. ‘Developmental genetics of deleted mtDNA in mitochondrial oculomyopathy’, J Neurol Sci, 145: 155–62. [DOI] [PubMed] [Google Scholar]
- NCBI, and NIH. 2017. ‘TOPMed Whole Genome Sequencing Project’.
- Rebolledo-Jaramillo B, Su MS, Stoler N, McElhoe JA, Dickins B, Blankenberg D, Korneliussen TS, Chiaromonte F, Nielsen R, Holland MM, Paul IM, Nekrutenko A, and Makova KD 2014. ‘Maternal age effect and severe germ-line bottleneck in the inheritance of human mitochondrial DNA’, Proc Natl Acad Sci U S A, 111: 15474–9. [DOI] [PMC free article] [PubMed] [Google Scholar]
- Redline S, Tishler PV, Tosteson TD, Williamson J, Kump K, Browner I, Ferrette V, and Krejci P 1995. ‘The familial aggregation of obstructive sleep apnea’, Am J Respir Crit Care Med, 151: 682–7. [DOI] [PubMed] [Google Scholar]
- Rentzsch P, Witten D, Cooper GM, Shendure J, and Kircher M 2019. ‘CADD: predicting the deleteriousness of variants throughout the human genome’, Nucleic Acids Res, 47: D886–D94. [DOI] [PMC free article] [PubMed] [Google Scholar]
- Ruiz-Pesini E, Mishmar D, Brandon M, Procaccio V, and Wallace DC 2004. ‘Effects of purifying and adaptive selection on regional variation in human mtDNA’, Science, 303: 223–6. [DOI] [PubMed] [Google Scholar]
- Spelbrink JN, Li FY, Tiranti V, Nikali K, Yuan QP, Tariq M, Wanrooij S, Garrido N, Comi G, Morandi L, Santoro L, Toscano A, Fabrizi GM, Somer H, Croxen R, Beeson D, Poulton J, Suomalainen A, Jacobs HT, Zeviani M, and Larsson C 2001. ‘Human mitochondrial DNA deletions associated with mutations in the gene encoding Twinkle, a phage T7 gene 4-like protein localized in mitochondria’, Nat Genet, 28: 223–31. [DOI] [PubMed] [Google Scholar]
- Splansky GL, Corey D, Yang Q, Atwood LD, Cupples LA, Benjamin EJ, D’Agostino RB Sr., Fox CS, Larson MG, Murabito JM, O’Donnell CJ, Vasan RS, Wolf PA, and Levy D 2007. ‘The Third Generation Cohort of the National Heart, Lung, and Blood Institute’s Framingham Heart Study: design, recruitment, and initial examination’, Am J Epidemiol, 165: 1328–35. [DOI] [PubMed] [Google Scholar]
- Stewart JB, and Chinnery PF 2015. ‘The dynamics of mitochondrial DNA heteroplasmy: implications for human health and disease’, Nat Rev Genet, 16: 530–42. [DOI] [PubMed] [Google Scholar]
- Stewart JB, Freyer C, Elson JL, Wredenberg A, Cansu Z, Trifunovic A, and Larsson NG 2008. ‘Strong purifying selection in transmission of mammalian mitochondrial DNA’, PLoS Biol, 6: e10. [DOI] [PMC free article] [PubMed] [Google Scholar]
- Taliun D, Harris DN, Kessler MD, Carlson J, Szpiech ZA, Torres R, Taliun SAG, Corvelo A, Gogarten SM, Kang HM, Pitsillides AN, LeFaive J, Lee SB, Tian X, Browning BL, Das S, Emde AK, Clarke WE, Loesch DP, Shetty AC, Blackwell TW, Smith AV, Wong Q, Liu X, Conomos MP, Bobo DM, Aguet F, Albert C, Alonso A, Ardlie KG, Arking DE, Aslibekyan S, Auer PL, Barnard J, Barr RG, Barwick L, Becker LC, Beer RL, Benjamin EJ, Bielak LF, Blangero J, Boehnke M, Bowden DW, Brody JA, Burchard EG, Cade BE, Casella JF, Chalazan B, Chasman DI, Chen YI, Cho MH, Choi SH, Chung MK, Clish CB, Correa A, Curran JE, Custer B, Darbar D, Daya M, de Andrade M, DeMeo DL, Dutcher SK, Ellinor PT, Emery LS, Eng C, Fatkin D, Fingerlin T, Forer L, Fornage M, Franceschini N, Fuchsberger C, Fullerton SM, Germer S, Gladwin MT, Gottlieb DJ, Guo X, Hall ME, He J, Heard-Costa NL, Heckbert SR, Irvin MR, Johnsen JM, Johnson AD, Kaplan R, Kardia SLR, Kelly T, Kelly S, Kenny EE, Kiel DP, Klemmer R, Konkle BA, Kooperberg C, Kottgen A, Lange LA, Lasky-Su J, Levy D, Lin X, Lin KH, Liu C, Loos RJF, Garman L, Gerszten R, Lubitz SA, Lunetta KL, Mak ACY, Manichaikul A, Manning AK, Mathias RA, McManus DD, McGarvey ST, Meigs JB, Meyers DA, Mikulla JL, Minear MA, Mitchell BD, Mohanty S, Montasser ME, Montgomery C, Morrison AC, Murabito JM, Natale A, Natarajan P, Nelson SC, North KE, O’Connell JR, Palmer ND, Pankratz N, Peloso GM, Peyser PA, Pleiness J, Post WS, Psaty BM, Rao DC, Redline S, Reiner AP, Roden D, Rotter JI, Ruczinski I, Sarnowski C, Schoenherr S, Schwartz DA, Seo JS, Seshadri S, Sheehan VA, Sheu WH, Shoemaker MB, Smith NL, Smith JA, Sotoodehnia N, Stilp AM, Tang W, Taylor KD, Telen M, Thornton TA, Tracy RP, Van Den Berg DJ, Vasan RS, Viaud-Martinez KA, Vrieze S, Weeks DE, Weir BS, Weiss ST, Weng LC, Willer CJ, Zhang Y, Zhao X, Arnett DK, Ashley-Koch AE, Barnes KC, Boerwinkle E, Gabriel S, Gibbs R, Rice KM, Rich SS, Silverman EK, Qasba P, Gan W, Nhlbi Trans-Omics for Precision Medicine Consortium, Papanicolaou GJ, Nickerson DA, Browning SR, Zody MC, Zollner S, Wilson JG, Cupples LA, Laurie CC, Jaquish CE, Hernandez RD, O’Connor TD, and Abecasis GR 2021. ‘Sequencing of 53,831 diverse genomes from the NHLBI TOPMed Program’, Nature, 590: 290–99. [DOI] [PMC free article] [PubMed] [Google Scholar]
- Tatarenkov A, and Avise JC 2007. ‘Rapid concerted evolution in animal mitochondrial DNA’, Proc Biol Sci, 274: 1795–8. [DOI] [PMC free article] [PubMed] [Google Scholar]
- Taylor RW, Barron MJ, Borthwick GM, Gospel A, Chinnery PF, Samuels DC, Taylor GA, Plusa SM, Needham SJ, Greaves LC, Kirkwood TB, and Turnbull DM 2003. ‘Mitochondrial DNA mutations in human colonic crypt stem cells’, J Clin Invest, 112: 1351–60. [DOI] [PMC free article] [PubMed] [Google Scholar]
- Van Goethem G, Dermaut B, Lofgren A, Martin JJ, and Van Broeckhoven C 2001. ‘Mutation of POLG is associated with progressive external ophthalmoplegia characterized by mtDNA deletions’, Nat Genet, 28: 211–2. [DOI] [PubMed] [Google Scholar]
- van Oven M 2015. ‘PhyloTree Build 17: Growing the human mitochondrial DNA tree’, Forensic Science International Genetics Supplement Series, 5: E392–E94. [Google Scholar]
- Voet D, Voet JG, and Pratt CW 2005. ‘Fundamentals of Biochemistry. 2nd Edition. John Wiley and Sons, Inc; ’: pp. 547, 56. ISBN 0-471-21495-7. [Google Scholar]
- Wallace DC 2011. ‘Bioenergetic origins of complexity and disease’, Cold Spring Harb Symp Quant Biol, 76: 1–16. [DOI] [PMC free article] [PubMed] [Google Scholar]
- Wallace DC, and Chalkia D 2013. ‘Mitochondrial DNA genetics and the heteroplasmy conundrum in evolution and disease’, Cold Spring Harb Perspect Biol, 5: a021220. [DOI] [PMC free article] [PubMed] [Google Scholar]
- Wei W, Tuna S, Keogh MJ, Smith KR, Aitman TJ, Beales PL, Bennett DL, Gale DP, Bitner-Glindzicz MAK, Black GC, Brennan P, Elliott P, Flinter FA, Floto RA, Houlden H, Irving M, Koziell A, Maher ER, Markus HS, Morrell NW, Newman WG, Roberts I, Sayer JA, Smith KGC, Taylor JC, Watkins H, Webster AR, Wilkie AOM, Williamson C, Nihr BioResource-Rare Diseases, Genomes Project-Rare Diseases Pilot, Ashford S, Penkett CJ, Stirrups KE, Rendon A, Ouwehand WH, Bradley JR, Raymond FL, Caulfield M, Turro E, and Chinnery PF 2019. ‘Germline selection shapes human mitochondrial DNA diversity’, Science, 364. [DOI] [PubMed] [Google Scholar]
- Weissensteiner H, Forer L, Fuchsberger C, Schopf B, Kloss-Brandstatter A, Specht G, Kronenberg F, and Schonherr S 2016. ‘mtDNA-Server: next-generation sequencing data analysis of human mitochondrial DNA in the cloud’, Nucleic Acids Res, 44: W64–9. [DOI] [PMC free article] [PubMed] [Google Scholar]
- Weissensteiner H, Pacher D, Kloss-Brandstatter A, Forer L, Specht G, Bandelt HJ, Kronenberg F, Salas A, and Schonherr S 2016. ‘HaploGrep 2: mitochondrial haplogroup classification in the era of high-throughput sequencing’, Nucleic Acids Res, 44: W58–63. [DOI] [PMC free article] [PubMed] [Google Scholar]
- Wilson IJ, Carling PJ, Alston CL, Floros VI, Pyle A, Hudson G, Sallevelt SC, Lamperti C, Carelli V, Bindoff LA, Samuels DC, Wonnapinij P, Zeviani M, Taylor RW, Smeets HJ, Horvath R, and Chinnery PF 2016. ‘Mitochondrial DNA sequence characteristics modulate the size of the genetic bottleneck’, Hum Mol Genet, 25: 1031–41. [DOI] [PMC free article] [PubMed] [Google Scholar]
- Wilson JG, Rotimi CN, Ekunwe L, Royal CD, Crump ME, Wyatt SB, Steffes MW, Adeyemo A, Zhou J, Taylor HA Jr., and Jaquish C 2005. ‘Study design for genetic analysis in the Jackson Heart Study’, Ethn Dis, 15: S6-30-37. [PubMed] [Google Scholar]
- Ye K, Lu J, Ma F, Keinan A, and Gu Z 2014. ‘Extensive pathogenicity of mitochondrial heteroplasmy in healthy human individuals’, Proc Natl Acad Sci U S A, 111: 10654–9. [DOI] [PMC free article] [PubMed] [Google Scholar]
- Zaidi AA, Wilton PR, Su MS, Paul IM, Arbeithuber B, Anthony K, Nekrutenko A, Nielsen R, and Makova KD 2019. ‘Bottleneck and selection in the germline and maternal age influence transmission of mitochondrial DNA in human pedigrees’, Proc Natl Acad Sci U S A, 116: 25172–78. [DOI] [PMC free article] [PubMed] [Google Scholar]
- Zhang R, Wang Y, Ye K, Picard M, and Gu Z 2017. ‘Independent impacts of aging on mitochondrial DNA quantity and quality in humans’, BMC Genomics, 18: 890. [DOI] [PMC free article] [PubMed] [Google Scholar]
- Zhou W, Nielsen JB, Fritsche LG, Dey R, Gabrielsen ME, Wolford BN, LeFaive J, VandeHaar P, Gagliano SA, Gifford A, Bastarache LA, Wei WQ, Denny JC, Lin M, Hveem K, Kang HM, Abecasis GR, Willer CJ, and Lee S 2018. ‘Efficiently controlling for case-control imbalance and sample relatedness in large-scale genetic association studies’, Nat Genet, 50: 1335–41. [DOI] [PMC free article] [PubMed] [Google Scholar]
- Zsurka G, Hampel KG, Kudina T, Kornblum C, Kraytsberg Y, Elger CE, Khrapko K, and Kunz WS 2007. ‘Inheritance of mitochondrial DNA recombinants in double-heteroplasmic families: potential implications for phylogenetic analysis’, Am J Hum Genet, 80: 298–305. [DOI] [PMC free article] [PubMed] [Google Scholar]
Associated Data
This section collects any data citations, data availability statements, or supplementary materials included in this article.