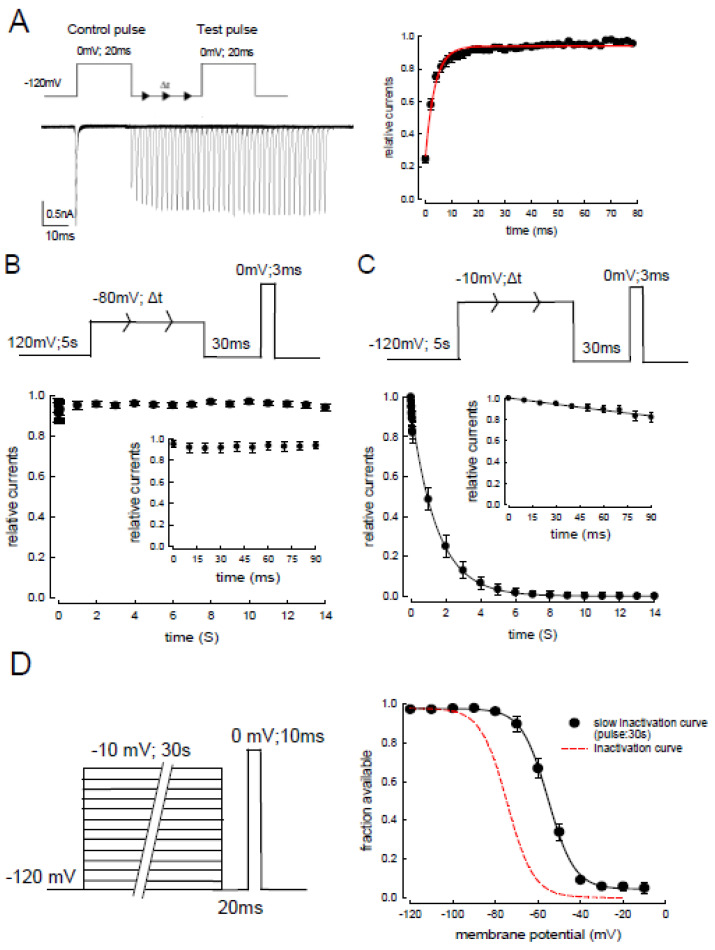
Figure 4.
Recovery course from the fast and slow-inactivation curves in Nav1.4 channels. (A) The cell was held at −120 mV and pulsed twice to 0 mV (for 20 ms each) every 2 s, with a gradually lengthened gap between the two pulses at −120 mV. Sweeps were arranged so that the currents in the second pulse gradually shifted rightward as the gap lengthened (by 1 ms each sweep, left panel). The relative current, defined as the normalized peak current in the second pulse to that in the first pulse, is plotted against the duration of the intervening gap (n = 5, right panel). The plot shows that most channels entering the fast inactivation recovered after approximately 20 ms at −120 mV. (B) The electric protocol to evaluate the kinetics of slow-inactivation at −80 mV. The patch CHO-K1 cell was held at −120 mV for approximately 5 s, followed by a depolarized pulse −80 mV for a certain time. Then, the current of −120 mV for 30 ms was applied to the cell to allow full recovery from the fast inactivation. A test pulse at 0 mV for 3 ms was employed to evaluate the slow-inactivation. The elicited currents were normalized to the control current, relative currents, which was then plotted against the duration of the inactivating pulse at −80 mV (time in seconds). The inset figure is a close-up view of the first 90 ms of data. Most (>90%) of the Nav1.4 channels remained in the fast-inactivated state at −80 mV. (C) The electric protocol to evaluate the kinetics of slow-inactivation at −10 mV. The same protocols and analyses were employed as shown in Figure 4B, except that the inactivating pulse was set to −10 mV (n = 5). In this case, most Nav1.4 channels (>90%) entered the slow-inactivated state with a time constant of 1.43 s from the exponential fit to these points. (D) The patched cell was held at −120 mV, and the pulse protocol was repeated every 30 s. Depolarizing prepulses of varying voltages from −120 to −10 mV (approximately 30 s) were applied to the cells, followed by a gap voltage at −120 mV for 20 ms to allow recovery from fast inactivation. Subsequently, a test pulse at 0 mV for 10 ms was applied to evaluate the fraction of available channels. The curve was fitted using the Boltzmann function 1/1 + exp[(V − Vh)/k], where the Vh value was −54.9 ± 0.7 mV and the k value was −7.3 ± 0.5 (the black curve, right panel). The left of the inactivation curve from Figure 3B is replotted with a dashed line on the voltage axis.

