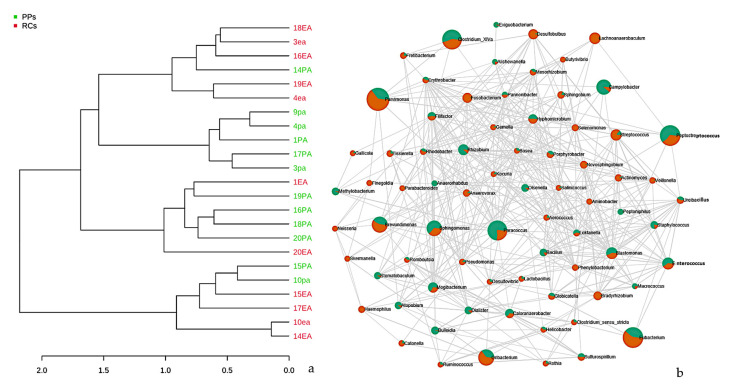
Figure 7.
(a) Dendrogram showing the similarities between the samples of RCs and PPs. The dendrogram was created using the Jaccard index as a distance measure and Ward’s clustering algorithm considering a 1000-repetition bootstrap. (b) Correlation and co-occurrence analysis of cases of root canals (green) and periodontal pockets (orange) genera. The interactions (connections) represent the relationship (Spearman’s ρ > 0.6) and the significance (p < 0.01). Circles represent the relative abundance of each condition of study; the thickness of each connection between two nodes is proportional to the value of Spearman’s correlation coefficients.3.4. Metabolic prediction in RCs and PPs.

