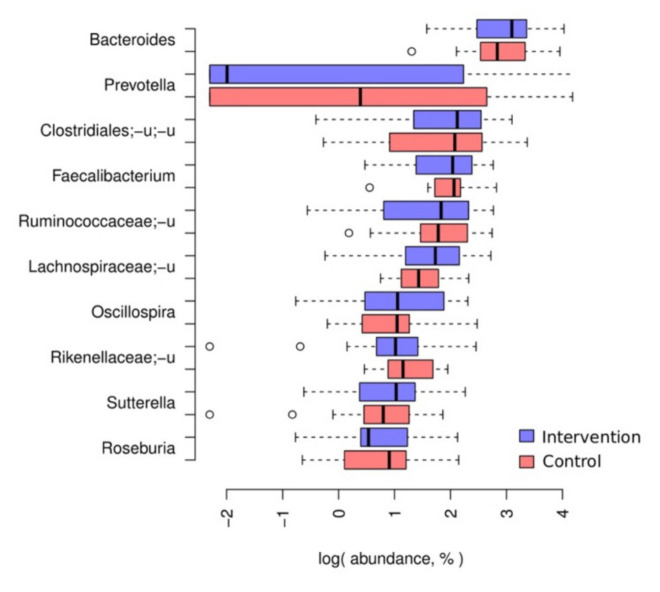
Figure 2.
Major taxa. Boxplots detailing the distribution of relative abundance for the 10 most abundant genera; for appropriate display on a log scale, zero values were replaced with a pseudocount (0.1%). In addition, boxplots detailing the distribution of relative abundance for the 25 most abundant taxa in each taxonomic rank at baseline are available in the Supplementary Materials section.

