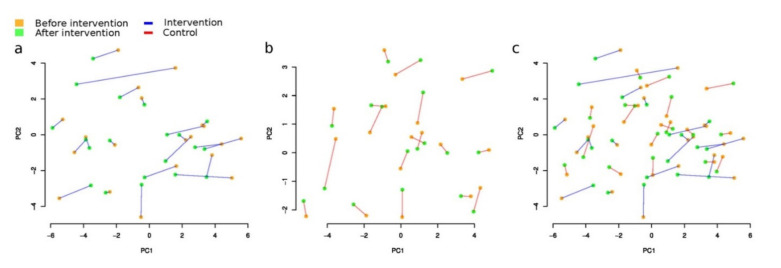
Figure 3.
General changes of microbiome composition after the intervention (Aitchison distance): (a) intervention (Group A) (PERMANOVA p = 0.01, R2 = 0.88%); (b) control (Group B), (p = 0.571, R2 = 0.27%); (c) intervention and control groups combined. Please note that the red dots denote the samples before the intervention, and the blue dots, after.

