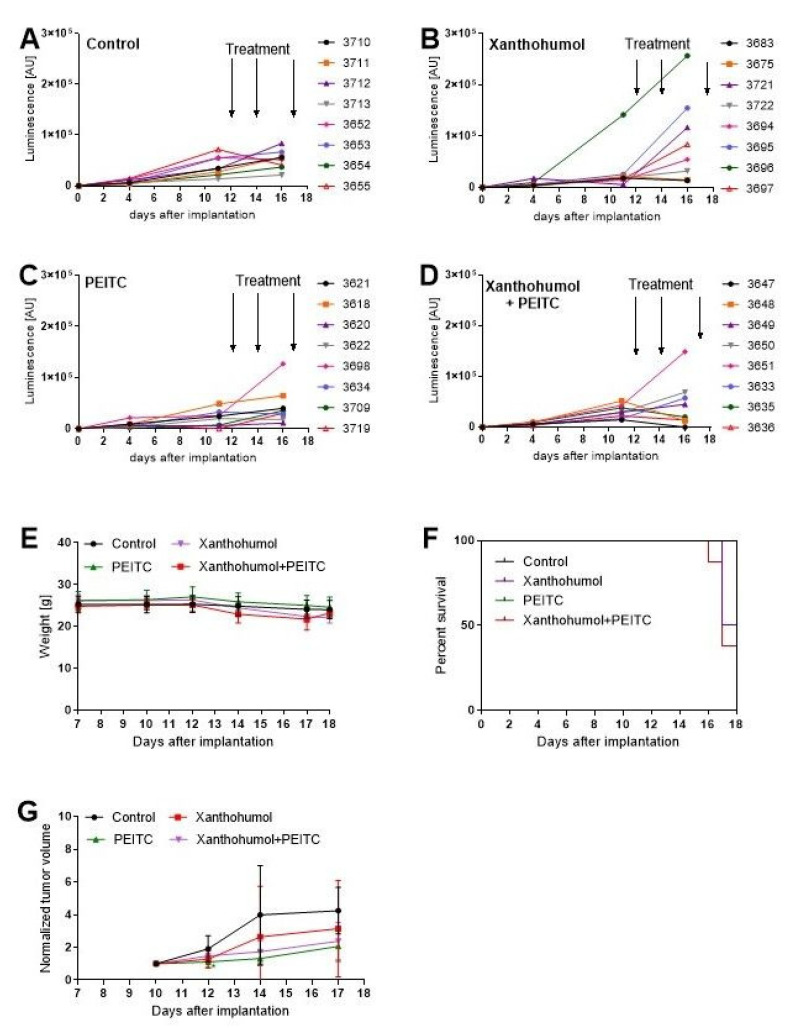
Figure 14.
The in vivo efficacy and toxicity of single compounds and combination. Panels (A–D) present the luminescence of tumors, measured at day 4, 11, and 16 after implantation; panel (E) present the changes in mice weight during the experiments; Panel (F) presents the survival using the Kaplan–Meier curve; panel (G) presents the normalized tumor volume; tumor volume was measured using the formula V = 0.5 × W2 × L, where W and L mean width, and length, respectively. Tumor size was measured using a caliper. Statistical analysis was performed using GraphPad version 8.00 (GraphPad Software, San Diego, CA, USA). The data are shown as the means ± SD. The statistical significance was analyzed using one-way ANOVA with post-hoc Dunnett’s test. A p-value less than 0.05 was considered significant.

