

Abstract
Purpose:
Assessment of the blood–brain barrier (BBB) permeability without the need for contrast agent is desirable, and the ability to measure the permeability to small molecules such as water may further increase the sensitivity in detecting diseases. This study proposed a time-efficient, noncontrast method to measure BBB permeability to water, evaluated its test–retest reproducibility, and compared it with a contrast agent–based method.
Methods:
A single-delay water extraction with phase-contrast arterial spin tagging (WEPCAST) method was devised in which spatial profile of the signal along the superior sagittal sinus was used to estimate bolus arrival time, and the WEPCAST signal at the corresponding location was used to compute water extraction fraction, which was combined with global cerebral blood flow to estimate BBB permeability surface area product to water. The reliability of WEPCAST sequence was examined in terms of intrasession, intersession, and inter-vendor (Philips [Ingenia, Best, the Netherlands] and Siemens [Prisma, Erlangen, Germany]) reproducibility. Finally, we compared this new technique to a contrast agent–based method.
Results:
Single-delay WEPCAST reduced the scan duration from approximately 20 min to 5 min. Extract fraction values estimated from single-delay WEPCAST showed good consistency with the multi-delay method (R = 0.82, P = .004). Group-averaged permeability surface area product values were found to be 137.5 ± 9.3 mL/100 g/min. Intrasession, intersession, and inter-vendor coefficient of variation of the permeability surface area product values were 6.6 ± 4.5%, 6.9 ± 3.7%, and 8.9 ± 3.0%, respectively. Finally, permeability surface area product obtained from WEPCAST MRI showed a significant correlation with that from the contrast-based method (R = .73, P = .02).
Conclusion:
Single-delay WEPCAST MRI can measure BBB permeability to water within 5 min with an intrasession, intersession, and inter-vendor test–retest reproducibility of 6% to 9%. This method may provide a useful marker of BBB breakdown in clinical studies.
Keywords: arterial spin labelling, blood–brain barrier, permeability, reproducibility, WEPCAST
1 |. INTRODUCTION
Blood–brain barrier (BBB) is a selective and tight barrier formed by endothelial cells, astrocytes, and pericytes.1 It regulates the Blood–brain exchange of substances and maintains a constant microenvironment that is crucial for normal function of the nervous system. Alterations in BBB permeability have been associated with many disorders, such as Alzheimer disease,2 multiple sclerosis,3 stroke,4 and brain tumor.5
Contrast agent-based MRI method has been used to evaluate BBB permeability to gadolinium (Gd) chelates — qualitatively by examining postcontrast T1 enhancement or quantitatively with dynamic contrast-enhanced MRI.6 Although this method can be used to measure major BBB breakdowns, its sensitivity to small disruption of BBB at the early stage of disease is relatively low,7–9 and its acquisition time is usually long. Additionally, injection of Gd contrast agent can be complicated by difficulty obtaining intravenous access as well as the possibility of contrast extravasation, allergic reaction to contrast, nephrogenic systemic fibrosis, and potential negative impact of Gd deposition in the brain.10,11
Recently, there has been an increasing interest in examining the BBB’s permeability to water, an endogenous tracer with a smaller molecular size.12,13 It is known that water is not freely diffusible across the BBB in healthy brain (eg, unlike [11C]Butanol),14–18 and thus quantification of water permeability may provide information about subtle change in BBB integrity. Several MRI methods have been proposed to measure BBB water permeability by separating intravascular and extravascular water signal based on their differences in spatial location,19 T1,17,20,21 T2,22–25 or diffusion properties.13,18,26–32 Other methods using contrast agent also exploited the sensitivity to water permeability.33–36 However, a limitation of the previous methods is that the measurements often involved multiple scans with a long acquisition time and thus may present an obstacle for clinical applications.
Water extraction with phase-contrast arterial spin tagging (WEPCAST) MRI is a recently proposed noncontrast technique that provides a measurement of global water extraction fraction (E) and BBB permeability surface area product (PS) by selectively measuring arterial spin labeling (ASL)37–39 signals in venous vessels (thereby evaluating the rate of water exchange across BBB).19 The approach used in an earlier proof-of-principle study19 required the acquisition of signals at multiple post-labeling delay times (PLD), which resulted in a total scan time of more than 20 min. The goal of the present study is therefore to develop a clinically applicable, single-delay method of WEPCAST MRI with a target scan time of approximately 5 min. We conducted 3 substudies to develop and evaluate this method. In study I, we developed theoretical, experimental, and analysis procedures for single-delay WEPCAST and compared the data to multi-delay results. In study II, the reliability of the single-delay WEPCAST technique was characterized by evaluating its intrasession and intersession reproducibility on the same scanner as well as reproducibility across scanners of different vendors. Finally, in study III we compared this noncontrast BBB technique of water permeability to a contrast agent–based method.
2 |. METHODS
All procedures in this study have been approved by the institutional review board of the Johns Hopkins University School of Medicine, Baltimore, Maryland. Written informed consent was obtained before the participants were enrolled in the study. A total of 29 healthy participants were studied. The experiments were performed on a 3 Tesla Philips system (Ingenia, Best, the Netherlands), except for the cross-vendor study in which a 3 Tesla Siemens system (Prisma, Erlangen, Germany) was additionally used.
2.1 |. Study I: Development of Single-delay WEPCAST MRI
2.1.1 |. Pulse sequence and theory
The pulse sequence of WEPCAST MRI is displayed in Figure 1A. This sequence labels water in the arterial blood at the cervical spine (Figure 1B) with a pseudo-continuous ASL module. At the capillary–tissue interface, water exchanges across BBB and a fraction of the labeled water molecules are extracted into the tissue, whereas the remaining unextracted water is drained to the venous vessels (Figure 1C). With this fundamental concept, WEPCAST MRI employs a velocity-sensitive gradient to selectively measure the amount of labeled water in draining veins such as the superior sagittal sinus (SSS) (Figure 1B), which drains most cerebral tissues, yielding an estimation of global extraction fraction of water (E) (Figure 1C). Together with global cerebral blood flow (CBF), BBB permeability to water, denoted by PS, can be estimated as40:
| (1) |
FIGURE 1.
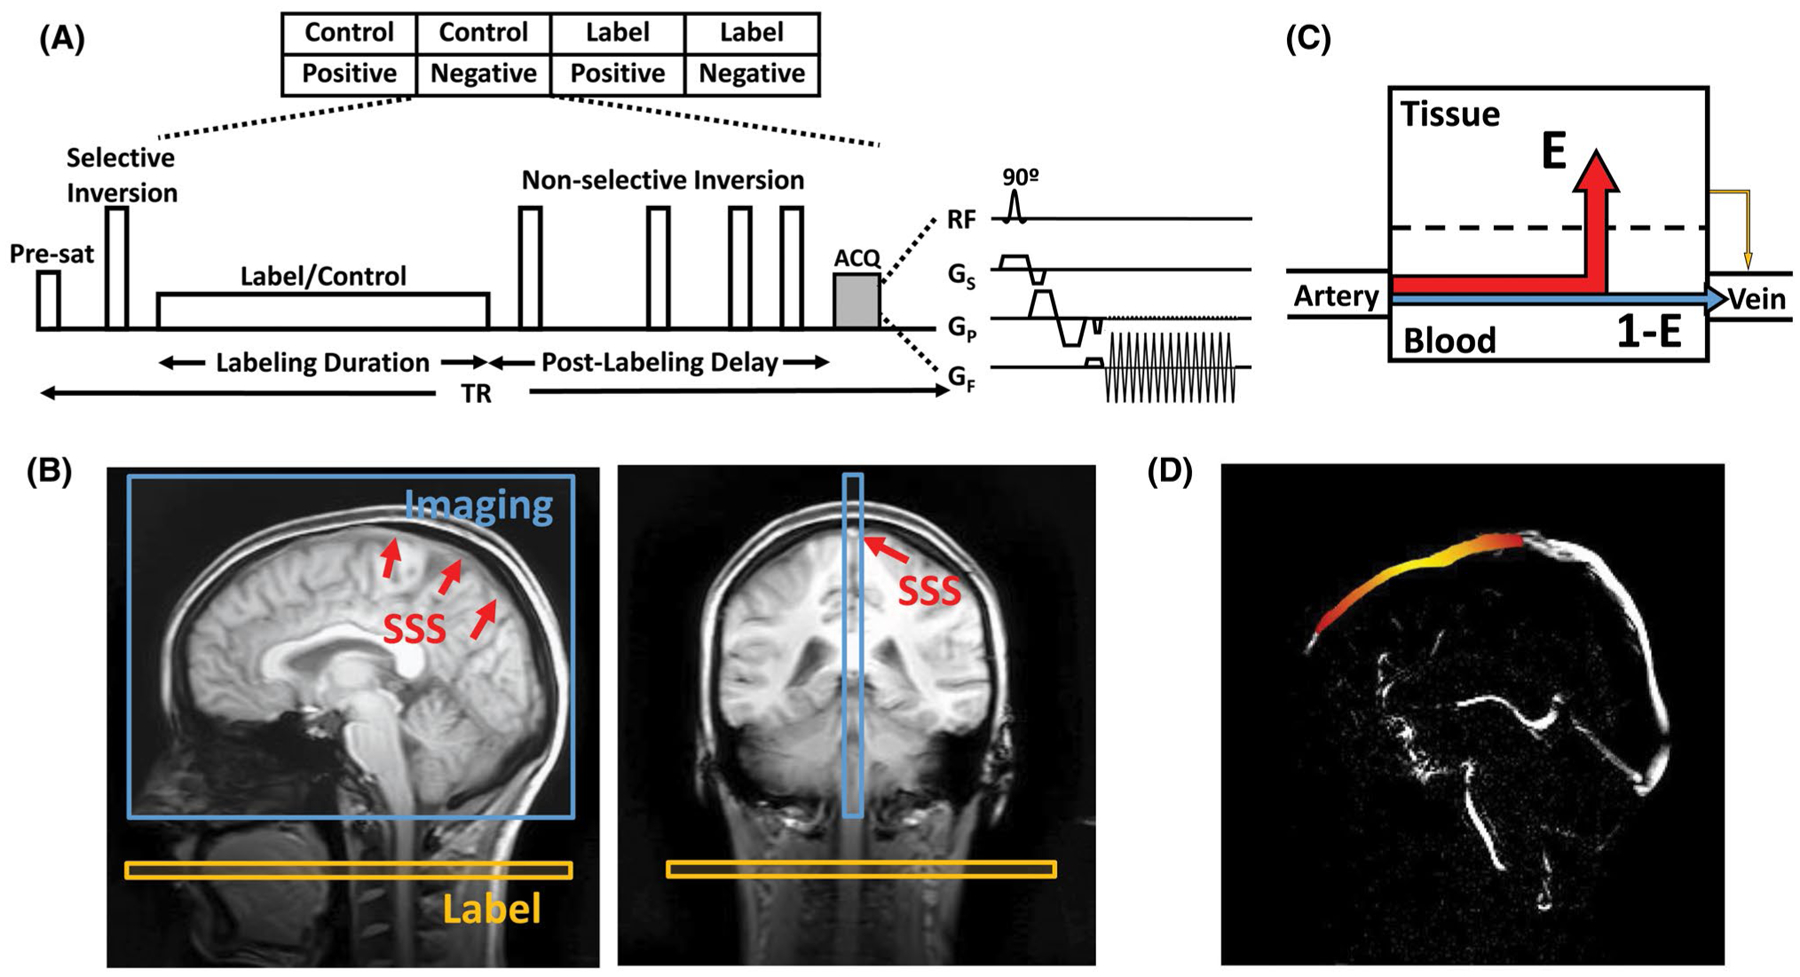
WEPCAST MRI technique for noncontrast assessment of BBB permeability. (A) WEPCAST MRI sequence diagram. (B) Typical sagittal and coronal imaging position of WEPCAST MRI. (C) Water exchange model across BBB. E can be estimated from venous ASL signal. (D) Illustration of the spatial distribution of WEPCAST signal bolus on superior sagittal sinus for a hypothetical subject. Due to dispersion, the bolus has a higher signal in the middle (yellow) and lower signal on the edges (red). ASL, extraction fraction; BBB, blood–brain barrier; E, extraction fraction; WEPCAST, water extraction with phase-contrast arterial spin tagging
The WEPCAST signal (ie, control – label) in the vein can be written as
| (2) |
where
| (3) |
denotes the spins that are not extracted by tissue and drained directly to the vein (Figure 1C, blue); da (t, δv) = c(t, δv) ⊗ G(t);
| (4) |
represents the extracted spins that are re-exchanged into the vessel (Figure 1C, yellow); and db(t, δv) = c (t, δv) ⊗ [r(t)m(t)] ⊗ G(t). In Equations (3) and (4), M0,blood is the equilibrium magnetization of blood and can be experimentally determined; δv is the bolus arrival time for vein; f is CBF; is the arterial input function; τ is labeling duration; r(t) = e−ft/λ is the residue function; λ is the blood–brain partition coefficient; represents the T1 relaxation of the signal; and denotes the Gaussian kernel due to dispersion of the labeled bolus. σ is the SD of the distribution and, based on the literature of arterial value of approximately 0.25 s,41 we assumed a venous σ of 0.5 s (ie, twice the arterial value). ⨂ denotes convolution operation, and α is the labeling efficiency. Aside from the assumed bolus dispersion kernel parameters, the only unknowns in Equations (2–4) are E and δv.
In the previous proof-of-principle report,19 the approach to solve for 2 unknowns in 1 equation was to perform WEPCAST experiments at several delay times (t) and then fit the signals to the model and simultaneously estimate both parameters. Here, our approach is to solve for δv and E sequentially using data from 1 delay time. First, rather than using the previous approach to select a spatial location on the vein and ask what the δv of this voxel is, we took advantage of the fact that we measured WEPCAST signal at multiple locations along the SSS (Figure 1D) and ask where the location is along the vein that has a known δv. Specifically, when performing a single-delay experiment with a delay time of PLD, the unextracted WEPCAST signal (ie, Equation (3)) at different locations (l) can be written as:
| (5) |
where l is the distance from a reference location that has a δv of , that is, middle of the labeled bolus. By assuming a flow velocity in SSS, V, we can rewrite the Equation (5) as
| (6) |
We can further reformat Equation (6) into
| (7) |
As such, we have transformed a function of t into a function of l (see Figure 1D for an illustration of expected signals). Plotting the function da (Supporting Information Figure S1), we can see that the term on the right-hand side of Equation (7) achieves its largest value when l = 0. In other words, when we identify the highest signal amplitude for the left-hand side term along the spatial profile of SSS, that location should represent l = 0 and has a δv of .
Once δv is known, E can then be estimated using the signal amplitude (ΔM) at that location and Equation (3). Because ΔMb is expected to be about 1 order lower than ΔMa, its contribution is neglected in the single-delay WEPCAST method. To evaluate the effect of this simplification, a simulation was performed to examine the relative fraction of ΔMb to ΔM within the typical range of PS values (Supporting Information Figure S2A). We also studied the effect of neglecting ΔMb on the PS estimation (see Supporting Information Figure S2B). It was found that neglecting ΔMb resulted in an underestimation of PS in high PS cases, but the size of the effect was relatively small.
2.1.2 |. MRI experiment
Ten young healthy volunteers were studied (age: 24.8 ± 4.0 years, 5 males/5 females). The Single-delay WEPCAST scan used the following parameters: labeling duration = 2000 ms; PLD = 3500 ms (chosen based on an average δv of 4310 ms to SSS in the original report19); single-shot EPI readout; TE = 13 ms; TR = 7143 ms; encoding velocity (Venc) = 15 cm/s; FOV = 200 × 200 mm; single slice at the mid-sagittal plane (Figure 1B); slice thickness = 10 mm; matrix = 64 × 64; voxel size = 3.13 × 3.13 mm2; parallel imaging acceleration factor = 2; flip angle = 90°; number of control/label pairs = 10; and scan duration = 4 min 49 s. A M0,blood scan with the same TE and Venc but a long TR of 10 s was also acquired for normalization. For comparison, a multi-PLD WEPCAST was also performed, including 3 additional PLD times (3000, 4000, and 4500 ms), with TR values of 6643, 7643, and 8143 ms; and with scan duration of 4 min 28 s, 5 min 9 s, 5 min 30 s, respectively. Thus, a multi-PLD WEPCAST data set takes approximately 20 min to acquire.
2.1.3 |. Data analysis
All MRI data were processed using in-house MatLab (version R2016a, MathWorks, Natick, MA) scripts. In WEPCAST MRI, images were acquired under 4 different conditions consisting of the complete combinations of 2 label/control conditions and 2 velocity-encoding conditions. Paired subtraction of velocity-encoded images yielded vessel-only images without tissue signal, similar to a phase-contrast MRI scan. Next, another subtraction was performed for the vessel-only images collected under control and label conditions, yielding the final WEPCAST images, that is, arterially labeled signals that remained in the vein.
Next, we sought to determine where on the SSS the δv equals . Based on the theory described above, a mask encompassing the entire SSS was drawn manually on the velocity-encoded control image, which has an excellent contrast between tissue and vessel. Then, a fast-marching algorithm was applied to identify the skeleton of the vessel on the sagittal images.42 The skeleton was evenly divided by nodes that are 6 voxels (ie, 18.7 mm) apart and, for each node, the 20 nearest voxels within the SSS formed a region of interest (ROI) corresponding to that node. WEPCAST signals of voxels in each ROI were averaged. To account for vessel size, flow velocity, and other potential sources of signal intensity variations such as coil sensitivity, the signals were normalized by the ROI-specific M0,blood value calculated from the corresponding M0,blood image. The signal was further corrected by the terms as described in Equation (7), where the distance l between nodes was obtained from fast-marching algorithm; V was assumed to be 13 cm/s43; and T1,blood was assumed to be 1584 ms.44 The peak signal among the ROIs was then identified and considered to have a δv of . The signal at this location was used to calculate E using Equation (3), with the assumptions of α = 86%.45
For comparison, E was also estimated from the multi-delay WEPCAST data following procedures described previously,19 with the following additional assumptions: λ = 0.9 mL/g,38 and T1,tissue = 1165 ms46; CBF in study I was based on an assumed value of 55 mL/100 g/min for males and 62 mL/100 g/min for females.19 It should be pointed out that, because the CBF term only appears in ΔMb and not the larger dominant ΔMa, the estimation of E is not strongly dependent on the CBF assumption. Three ROIs corresponding to anterior, middle, and posterior segments of the SSS were analyzed, and their E values were averaged. Consistency of E obtained from 2 methods was evaluated using Pearson correlation.
Finally, considering the assumptions used in analysis, including SSS velocity, T1,blood, dispersion (σ), and CBF, we conducted sensitivity analysis to test to what extent the E estimation varies when altering these variable values by ±10%. We also tested the dependence of the method on ROI choice by using different ROI sizes (15, 20, and 25 voxels) and different ROI numbers (3, 6, and 9 voxel intervals between ROIs).
2.2 |. Study II: Assessment of intrasession, intersession, and inter-vendor reproducibility
2.2.1 |. MRI experiment
Shortening of the scan duration from 20 min to 5 min afforded the feasibility to conduct multiple measurements in 1 subject. Therefore, to evaluate the reliability of the Single-delay WEPCAST technique, we characterized its intrasession, intersession, and inter-vendor test–retest reproducibility. The sequence was implemented on two 3 Tesla platforms: a Philips Ingenia system (Ingenia, Best, the Netherlands) and a Siemens Prisma system (Prisma, Erlangen, Germany). For the spin labeling module, both implementations use the pseudo-continuous ASL approach with same labeling pulse, selective gradient, and average gradient strength. The background-suppression pulses were also carefully matched in terms of pulse shape and pulse duration. Identical imaging parameters were used on both scanners: single-shot EPI readout with TE = 13 ms; TR = 7200 ms; labeling duration = 2000 ms; PLD = 3500 ms; Venc = 15 cm/s; FOV = 200 × 200 mm; single slice; matrix = 64 × 64; voxel size = 3.13 × 3.13 mm2; slice thickness = 10 mm; parallel imaging acceleration factor = 2; flip angle = 90°; number of control/label pairs = 10; scan duration = 4 min 55 s.
Ten healthy volunteers (age: 24.6 ± 2.3 years, 5 males/5 females) were studied. Each participant was scanned on both systems on the same day within a period of 2 hours. The order of Philips and Siemens scanner was counterbalanced across subjects. Both systems used a 32-channel head coil. The procedure of the experiment is illustrated in Figure 2. On each scanner, the subject went through 2 identical sessions with a short break and reposition between sessions, which allowed a quantification of intersession reproducibility of the technique. Within each session, WEPCAST scan was performed twice, which gave an evaluation of the intrasession reproducibility. After each WEPCAST scan, an additional M0,blood image was acquired for normalization. Phase-contrast (PC) MRI at 4 main feeding arteries (left/right internal carotid arteries and left/right vertebral arteries)47 were also performed for global CBF quantification. Before session 1, a T1-MPRAGE structural scan was acquired for brain volume measures. See Supporting Information Supporting Methods for detailed imaging parameters of these sequences.
FIGURE 2.
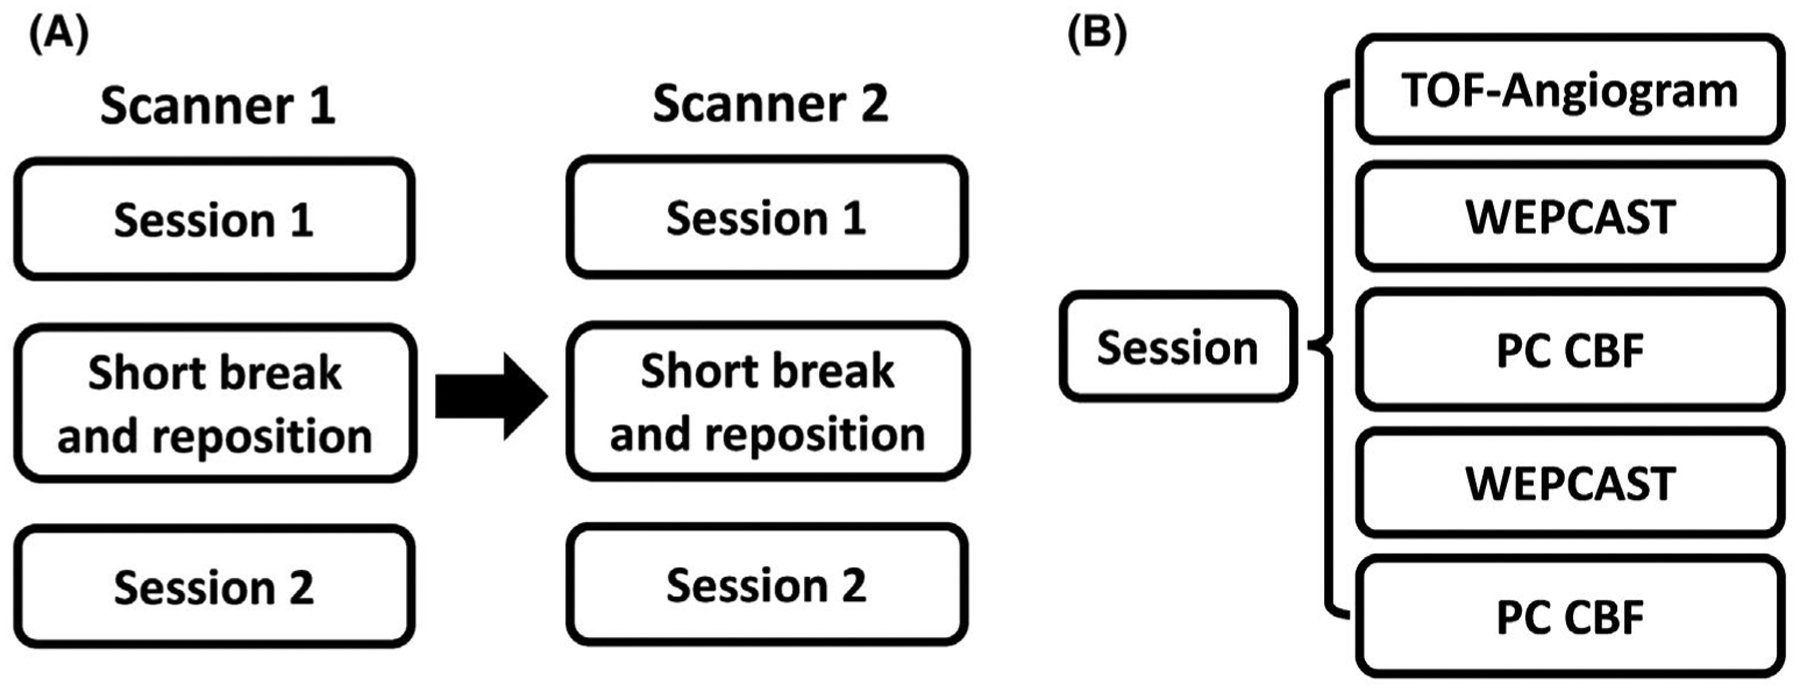
Experimental design of the cross-vendor reproducibility study. (A) Each subject went through 2 sessions on each scanner, with a short break and repositioning between 2 sessions. The subject was scanned on scanner 1 first and then escorted to scanner 2 to repeat the same procedure as in scanner 1. Before session 1, a T1-MPRAGE was also acquired. (B) Each session began with a TOF-angiogram. Then, WEPCAST MRI and PC-MRI for 4 vessels was performed twice. PC, phase contrast
2.2.2 |. Data analysis
For each subject, 8 measures of E, CBF, and PS were obtained (4 from each scanner) using the method described in study I. The analysis of PC MRI was described in Supporting Information. For each parameter (E, CBF, or PS), the following statistical analysis were performed: Repeated measures analysis of variance with Greenhouse-Geisser correction for sphericity violation was performed to examine whether the parameter was different between runs within 1 session, between sessions, or between scanners. Correspondence of the parameter measured on intrasession, intersession, and inter-vendor was evaluated with interclass correlation coefficient based on a single-rating 2-way mixed-effects model.48 Bland-Altman plot was used to assess the dependence of difference on the parameter itself. Test–retest reproducibility was evaluated by coefficient of variation (CoV), including intrasession CoV, intersession CoV, and inter-vendor CoV. A paired t test was used to compare the intrasession and intersession CoV between scanners.
Finally, because the WEPCAST processing involved a manual step of drawing a mask around the SSS, we also tested the interrater variability by having 2 raters analyze the same data sets independently. A dice index was calculated based on the overlapping voxel number of the masks divided by the average voxel number. Interclass correlation coefficient was used to determine the dependence of the PS results on raters.
2.3 |. Study III: Comparison of WEPCAST MRI with contrast agent–based method
2.3.1 |. MRI experiments
Although there has not been a gold standard MRI method to measure BBB permeability to water, several contrast agent–based approaches have been suggested to be sensitive to this index based on the notion that faster water exchange will result in more pronounced T1 relaxivity in the tissue.33–35,49 Therefore, in this substudy, we compared WEPCAST to a contrast agent–based method reported in Uh et al.49 Nine healthy volunteers were enrolled (age: 34.0 ± 11.3 years, 2 males/7 females). Each subject underwent a noncontrast WEPCAST MRI followed by a dynamic contrast agent–based MRI scan.
WEPCAST MRI was conducted with the same parameters as in study II, except that TR = 7050 ms; TE = 14 ms; and scan duration = 4 min 49 s. An M0,blood image was acquired for normalization. PC MRI and a T1-MPRAGE were also acquired for CBF measurement. The parameters of PC and MPRAGE scans were identical to those used in study II.
After WEPCAST MRI, the contrast agent method was performed, which consisted of an M0 scan and 30 T1-weighted images acquired with a multiple spin-echo inversion recovery sequence known as the vascular space occupancy (VASO) sequence.49 The M0 scan used identical acquisition parameters as the VASO, but no inversion pulse was played out and the TR was 10 s. Figure 3A illustrates the scan procedure. The imaging parameters were as follows: 8-echo spin echo with an echo interval (τCPMG) of 10 ms; TR = 6000 ms; TI = 1088 ms; FOV = 230 × 230 mm2; scan matrix = 128 × 128; single slice with slice thickness = 5 mm; EPI factor = 7; SENSE factor = 2; and duration = 54 s. The total scan time was 27.3 min. The use of multi-echo acquisition allowed the separation of T1 and T2 relaxivity effects of the contrast agent because we are primarily interested in the T1 relaxivity in permeability assessments. Contrast agent (gadoteridol) was administrated intravenously at a dosage of 0.1 mmol/kg at the beginning of the 4th dynamic with a rate of 5 mL/s via a power injector (Figure 3A).
FIGURE 3.
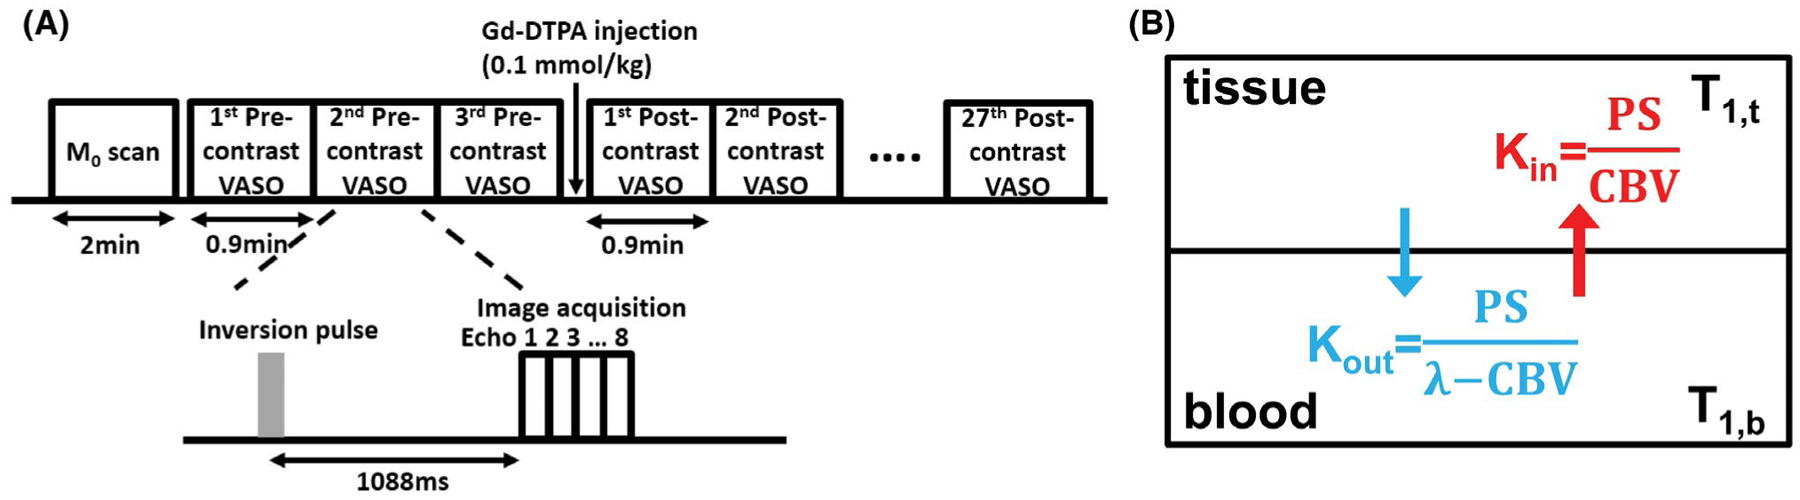
Contrast agent–based method for the measurement of BBB permeability to water. (A) Experimental protocol. A total of 30 vascular space occupancy (VASO) MRI scans were performed at the timing shown: 3 scans before contrast agent injection and 27 immediately after. Each VASO scan used an inversion recovery multi-spin echo sequence. The multi-echo data can be extrapolated to a TE = 0 ms, thereby minimizing T2 effect of Gd. (B) Two compartment water exchange model used for VASO signal fitting. Kin and Kout are exchange rates of water between blood and tissue. The exchange rate is affected by BBB permeability (PS) and cerebral blood volume (CBV). λ is brain–blood partition coefficient for water. CBV, cerebral blood volume; PS, permeability surface area product; VASO, vascular space occupancy
2.3.2 |. Data analysis
WEPCAST and PC MRI data were processed following the procedure described in study I and II. For contrast-agent data, quantitative analysis focused on gray matter because it has a higher vessel density and thus signal reliability. The gray matter ROI was obtained by segmenting the MPRAGE image using SPM12 (Wellcome Trust, University College London, UK), and the signals of the voxels within the ROI were averaged. The multi-echo ROI data were first fitted as a function of TE to obtain T2 and S0 time courses. Next, the initial concentration of Gd in the gray matter ROI ([Gd]) was estimated for each participant from the T2 difference between precontrast and first postcontrast images based on
| (8) |
where J is the T2 relaxivity of the Gd contrast agent (assumed to be 5 s−1 mM−1).49 Then, [Gd]0 was averaged across all participants to improve reliability and was used as the initial Gd concentration in all subjects.
The Gd concentration decay was modeled as a biexponential decay so that the Gd concentration in blood can be written as
| (9) |
with , where n1 and n2 are gadolinium decay rates; a1 and a2 are coefficients associated with the 2 components; and CBV is cerebral blood volume. We also assumed that n2 = 0.0434*n1 and a2 = 0.5*a1 based on the work of Uh et al.49
The [Gd]b (t) time course is in turn related to the S0 time course through a 2-compartment water exchange model (see Supporting Information), which is experimentally measured (ie, the VASO S0 signal). In this fitting, the unknowns are the gray matter PS (PSVASO,gm), CBV, and Gd decay rate (n1) (Figure 3B).35,50 Details of the model and the fitting procedures are described in Supporting Information.
To facilitate the comparison of the contrast-agent results with that of WEPCAST MRI, which is a global measurement and reflects an average of gray and white matter PS, PSVASO,gm was converted to PSVASO,global using:
| (10) |
where Vgm and Vwm are volumes of gray and white matter measured from the individual’s MPRAGE image, and R is the ratio of white matter and gray matter PS and was assumed to be 0.27 based on the CBV ratio.51 Pearson correlation was then used to evaluate the consistency of PS obtained from the 2 methods (PSWEPCAST and PSVASO,global).
3 |. RESULTS
3.1 |. Study I: Development of Single-delay WEPCAST MRI
Figure 4A shows representative data from a single-delay WEPCAST scan, including control, label, and difference images. As can be seen, due to the phase-contrast flow-encoded acquisition scheme, vessel signals are selectively measured and tissue signals are successfully suppressed. A spatial profile of the normalized WEPCAST signals along the SSS is shown in Figure 4B. A clear peak can be seen. As described in the Methods section, this location is then considered to have a δv of 4500 ms, and its signal is used to estimate E. Across the whole group (N = 10), the water extraction fraction E was found to be 92.2 ± 2.8%.
FIGURE 4.
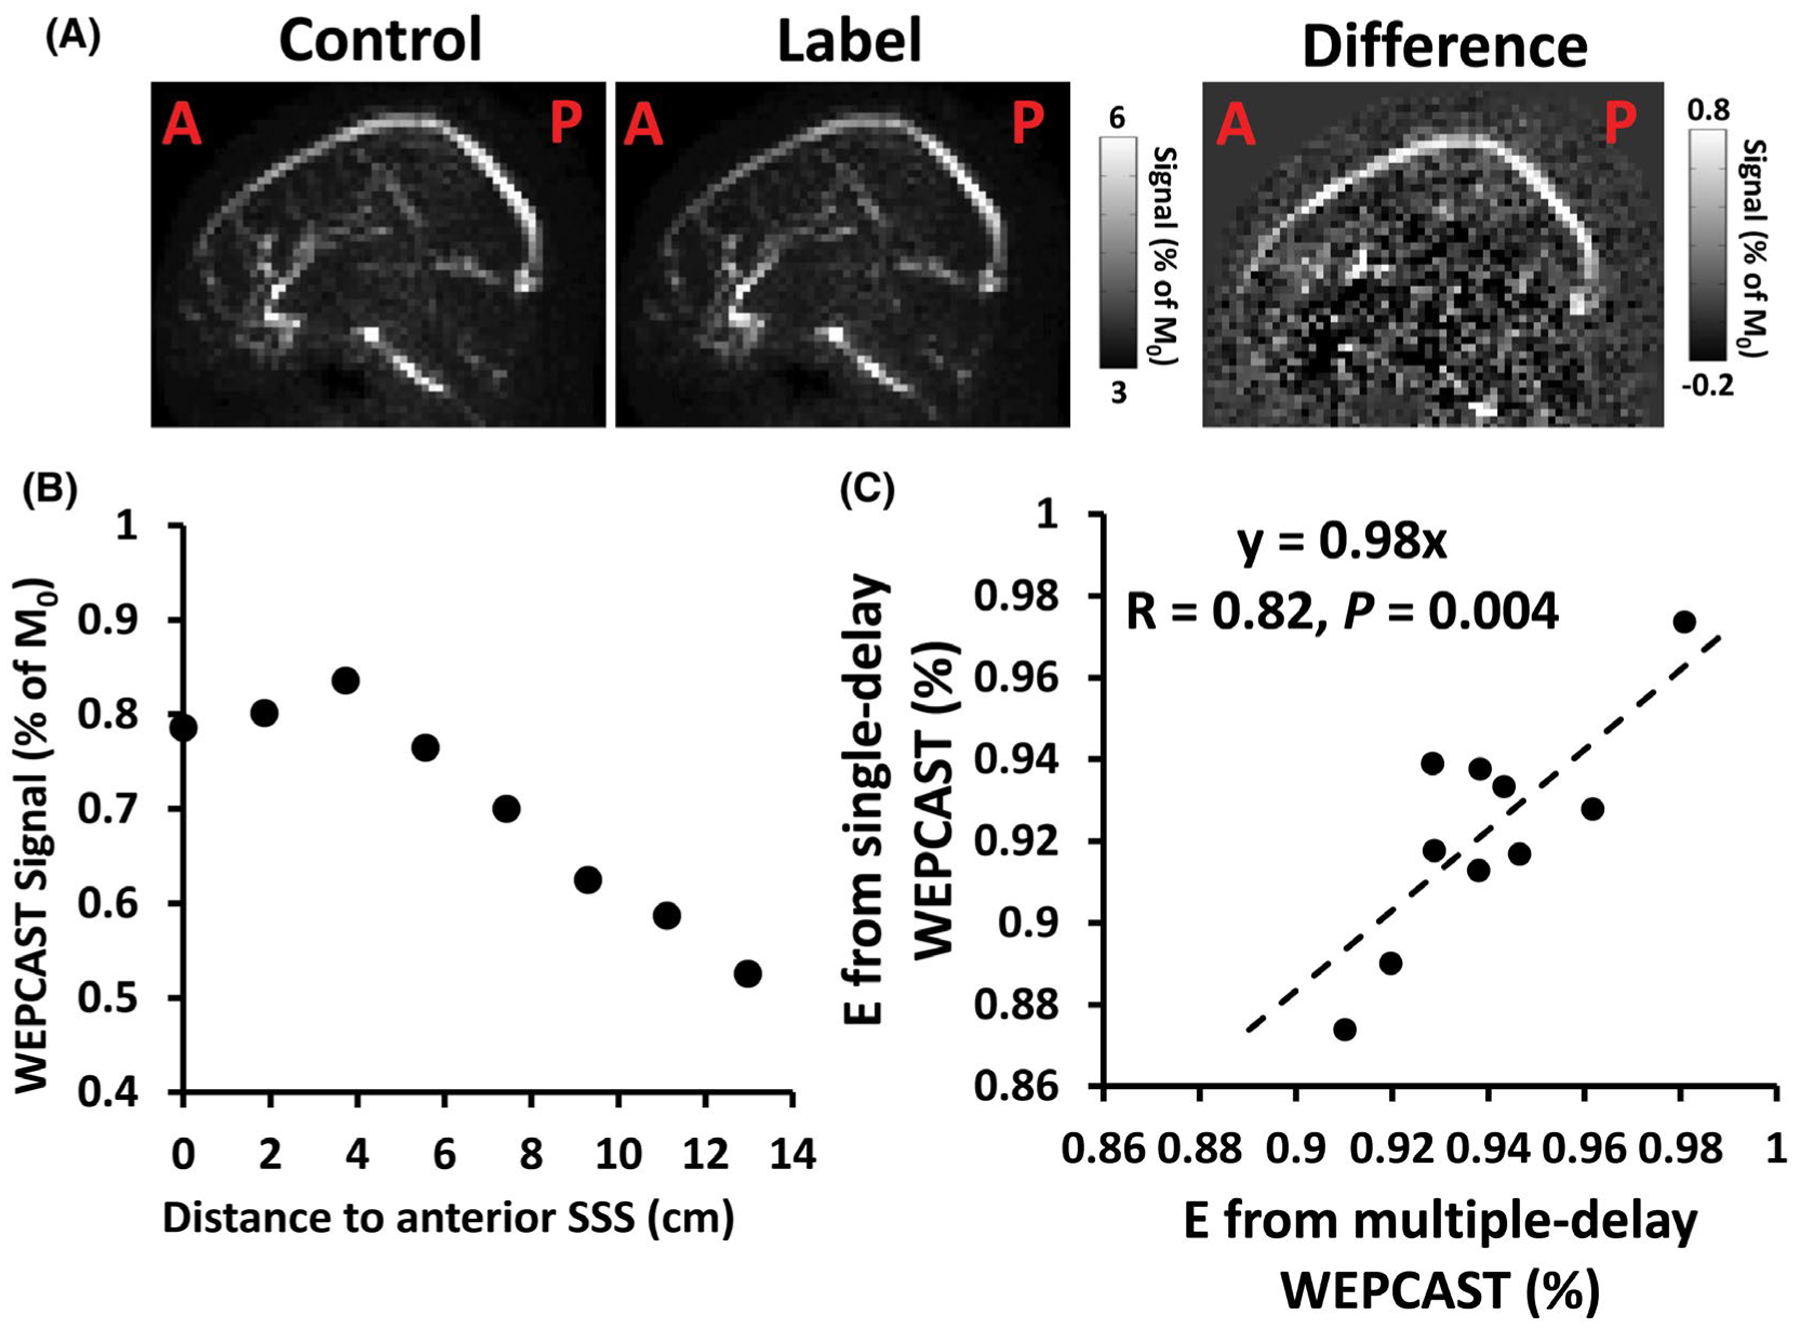
Representative images of WEPCAST MRI and relationship between single- and multi-delay results. (A) Single-delay WEPCAST control, label, and difference images from a representative subject. (B) WEPCAST signal profile along SSS. (C) Scatter plot of E obtained from Single-delay WEPCAST and multi-delay WEPCAST across all participants (N = 10). SSS, superior sagittal sinus
Next, we evaluated the dependence of E estimates on model assumptions as well as on ROI sizes and numbers. The results are shown in Table 1. To study the error propagations, we also included the PS values. As can be seen, the parameter assumptions have relatively small effects on E and PS estimates. Blood T1 seemed to have the greatest effect on the estimation.
TABLE 1.
Dependence of estimated water extraction fraction and permeability surface area product on model assumptions and ROI choices region
| E (%) | PS (mL/100 g/min) | |
|---|---|---|
| Main text | 92.2 ± 2.8 | 152.5 ± 18.7 |
| T1,blood − 10% | 89.5 ± 4.0 | 136.6 ± 25.4 |
| T1,blood + 10% | 93.8 ± 2.2 | 166.3 ± 18.6 |
| SSS velocity − 10% | 92.3 ± 2.9 | 155.0 ± 25.0 |
| SSS velocity + 10% | 92.0 ± 2.9 | 152.6 ± 18.8 |
| σ − 10% | 92.4 ± 2.7 | 153.7 ± 18.7 |
| σ + 10% | 92.0 ± 2.8 | 151.1 ± 18.8 |
| CBF −10% | 92.2 ± 2.8 | 137.3 ± 16.9 |
| CBF+ 10% | 92.2 ± 2.8 | 167.8 ± 20.6 |
| ROI size = 15 voxels | 91.6 ± 2.6 | 147.5 ± 17.6 |
| ROI size = 25 voxels | 92.6 ± 3.0 | 157.7 ± 25.2 |
| ROI interval = 3 voxel long | 92.3 ± 2.9 | 153.0 ± 18.9 |
| ROI interval = 9 voxel long | 92.3 ± 2.6 | 152.6 ± 17.8 |
CBF, cerebral blood flow; E, extraction fraction; PS, permeability surface area product; ROI, region of interest; SSS, superior sagittal sinus.
Analysis of the multi-delay WEPCAST data (with a scan time of 20 min) yielded an E of 94.0 ± 2.0%. Figure 4C shows a scatter plots between the Single-delay and multi-delay results. A strong correlation between results from the 2 methods is seen (R = 0.82 and P = .004), suggesting that the Single-delay method can provide comparable results to that of multi-delay while reducing the scan time by 4 times to a clinically applicable duration of approximately 5 min.
3.2 |. Study II: Assessment of intrasession, intersession, and inter-vendor reproducibility
Figure 5A displays WEPCAST control, label, and difference images of a representative participant from both Philips and Siemens scanners. Figure 5B shows the corresponding WEPCAST signals along the SSS. Table 2 summarizes the PS values across all participants in all measurements. Analysis of variance analysis revealed no differences in E, CBF, or PS between intrasession, intersession, or inter-vendor results (P = .94, 0.57 and 0.40 for E; P = .45, 0.75 and 0.06 for CBF; P = .59, 0.78 and 0.47 for PS).
FIGURE 5.
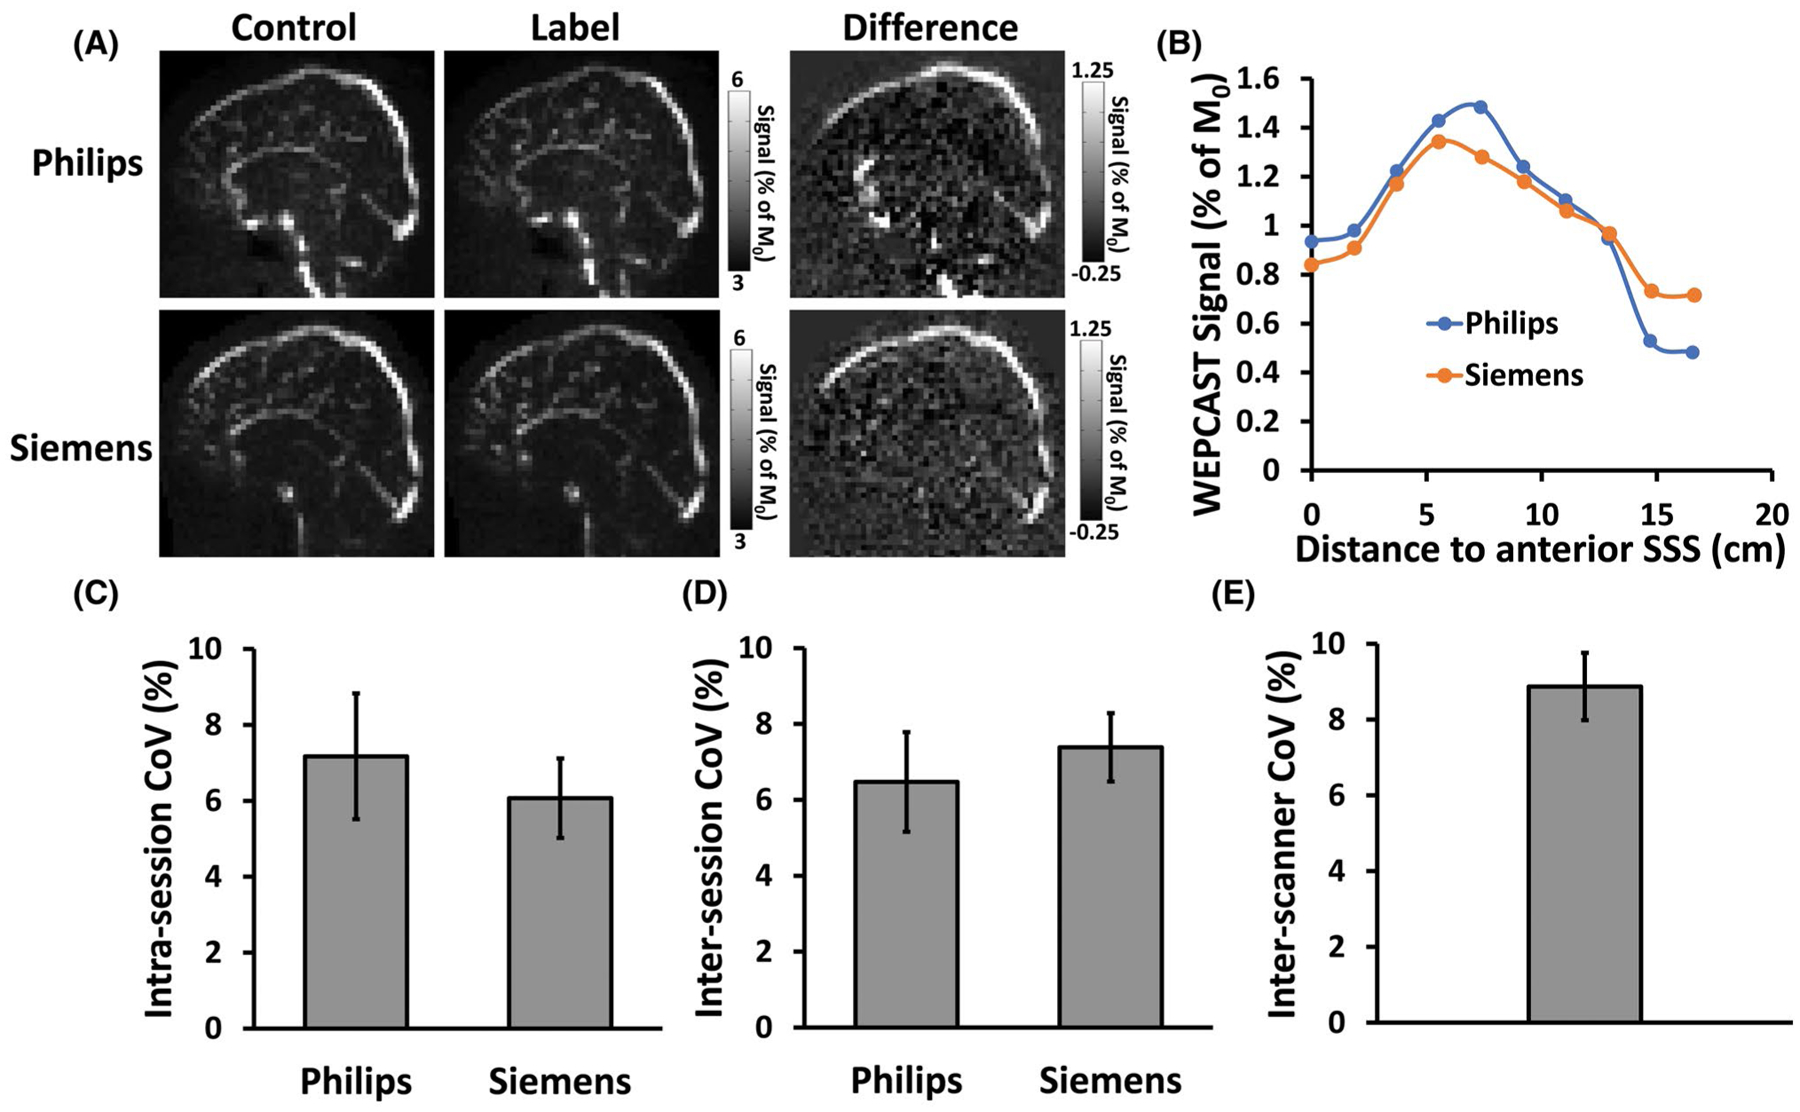
Test–retest reproducibility of WEPCAST MRI. (A) WEPCAST control, label, and difference images of 1 subject from 2 scanners. (B) WEPCAST signal profile along superior sagittal sinus of the subjects for 2 scanners. (C) Intrasession CoV of PS. (D) Intersession CoV of PS. (E) Inter-scanner CoV of PS. CoV, coefficient of variation
TABLE 2.
Summary of PS (mL/100 g/min) results from all participants (Mean ± SE, N = 10)
| Session 1 | Session 2 | |||
|---|---|---|---|---|
| Run 1 | Run 2 | Run 1 | Run 2 | |
| Philips (Best, the Netherlands) | 133.7 ± 5.3 | 143.4 ± 6.0 | 138.1 ± 4.2 | 141.6 ± 4.5 |
| Siemens (Erlangen, Germany) | 136.0 ± 6.0 | 135.4 ± 6.5 | 138.3 ± 3.6 | 133.6 ± 4.2 |
SE, standard error.
Figure 5C through E display the intrasession, intersession, and inter-vendor CoV for PS. It can be seen that the intrasession and intersession CoV on both scanners were between 5% and 8%, suggesting a good reliability of the technique. The CoV values obtained from 2 scanners were not significantly different (P = .58 for intra-session; P = .65 for intersession). The inter-vendor CoV was 8.9 ± 3.0%, indicating that different scanners may yield additional variations. The intersubject CoV in PS was also computed and found to be 6.7%. The corresponding CoV values for E and CBF, which were used to calculate PS, are summarized in Supporting Information Table S1. As can be seen, they had lower CoV compared to PS. As an additional observation, we found that there was a significant correlation between E and CBF across participants. Individuals with a higher CBF tended to have a lower E (Supporting Information Figure S3) (R = −0.81, P = .005).
Interclass correlation coefficient results of E, CBF, and PS are summarized in Table 3. A significant correlation was observed in all comparisons, except for inter-vendor PS values. Figure 6 shows scatter plots of these measures for intra-session results. Bland-Altman plots comparing these measures for intrasession, intersession, and inter-vendor results are shown in Supporting Information Figure S4.
TABLE 3.
Summary of intrasession, intersession, and inter-vendor ICC results
| ICC | CI | P Value | ||
|---|---|---|---|---|
| E | Intrasession | 0.53 | [0.27, 0.72] | <.001 |
| Intersession | 0.72 | [0.41, 0.88] | <.001 | |
| Inter-vendor | 0.76 | [0.30, 0.94] | .003 | |
| CBF | Intrasession | 0.88 | [0.78, 0.93] | <.001 |
| Intersession | 0.88 | [0.72, 0.95] | <.001 | |
| Inter-vendor | 0.84 | [0.49, 0.96] | <.001 | |
| PS | Intrasession | 0.37 | [0.08, 0.61] | .008 |
| Intersession | 0.48 | [0.06, 0.76] | .014 | |
| Inter-vendor | 0.26 | [−0.41, 0.74] | .22 |
CI, confidence interval; ICC, interclass correlation coefficient.
FIGURE 6.
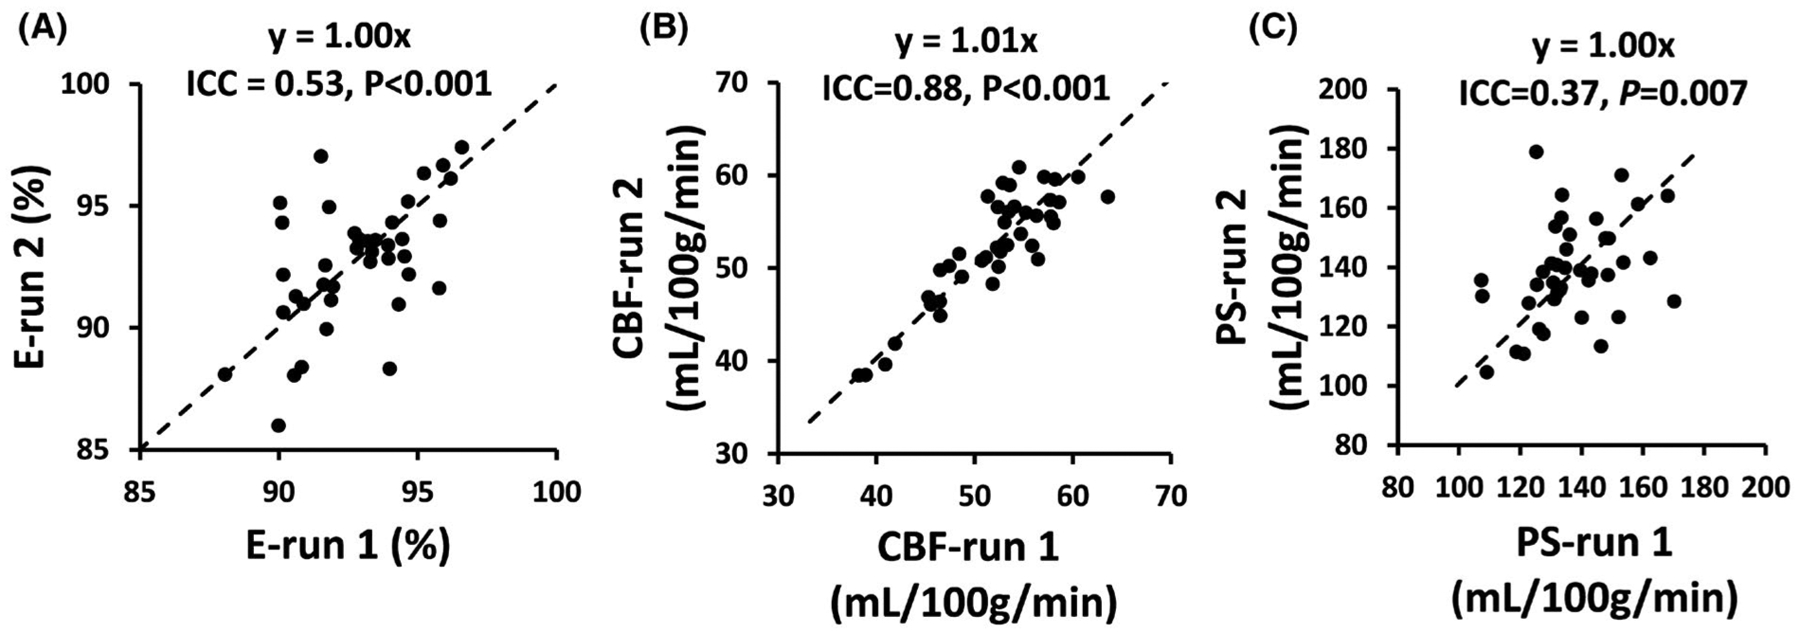
Scatter plots of intrasession reproducibility data. (A) Scatter plot of E from 2 runs. (B) Scatter plot of CBF from 2 runs. (C) Scatter plot of PS from 2 runs. CBF, cerebral blood flow
Finally, interrater reliability of the results was also examined using data from all repetitions for all participants (ie, 80 data sets in total). The dice index of the ROIs drawn by 2 independent raters was 0.86 ± 0.04. Scatter plots of the PS values obtained by the raters are shown in Supporting Information Figure S5, demonstrating good consistency (interclass correlation coefficient = 0.90 with 95% C.I. [0.85, 0.93], P < .0001).
3.3 |. Study III: Comparison of WEPCAST MRI with contrast agent–based method
From WEPCAST MRI, E was found to be 91.2 ± 3.8% (mean ± SD, N = 9). Global CBF measured with PC MRI was 55.8 ± 9.2 mL/100 g/min. PSWEPCAST was then estimated to be 138.1 ± 26.2 mL/100 g/min.
PS was also measured with contrast agent–based method. Figure 7A shows dynamic VASO images for pre- and postcontrast agent conditions as a function of time. The time course of gray matter S0 signal is shown in Figure 7B. It can be seen that, following the Gd injection, the VASO signal revealed an immediate increase due to the effects of the contrast agent on intravascular (CBV-related) and extravascular (water exchange–related) tissue. Fitting the signal time course to the kinetic model yielded a PSVASO,global of 161.0 ± 62.5 mL/100 g/min (N = 9) with a CBV of 3.7 ± 0.6% and Gd decay time constants of 1.0 ± 0.5 min and 23.9 ± 11.1 min. Figure 7C shows a scatter plot between PSWEPCAST and PSVASO,global. It can be seen that the PS obtained from WEPCAST MRI showed a significant correlation with that from the contrast agent–based method (R = 0.73, P = .02).
FIGURE 7.
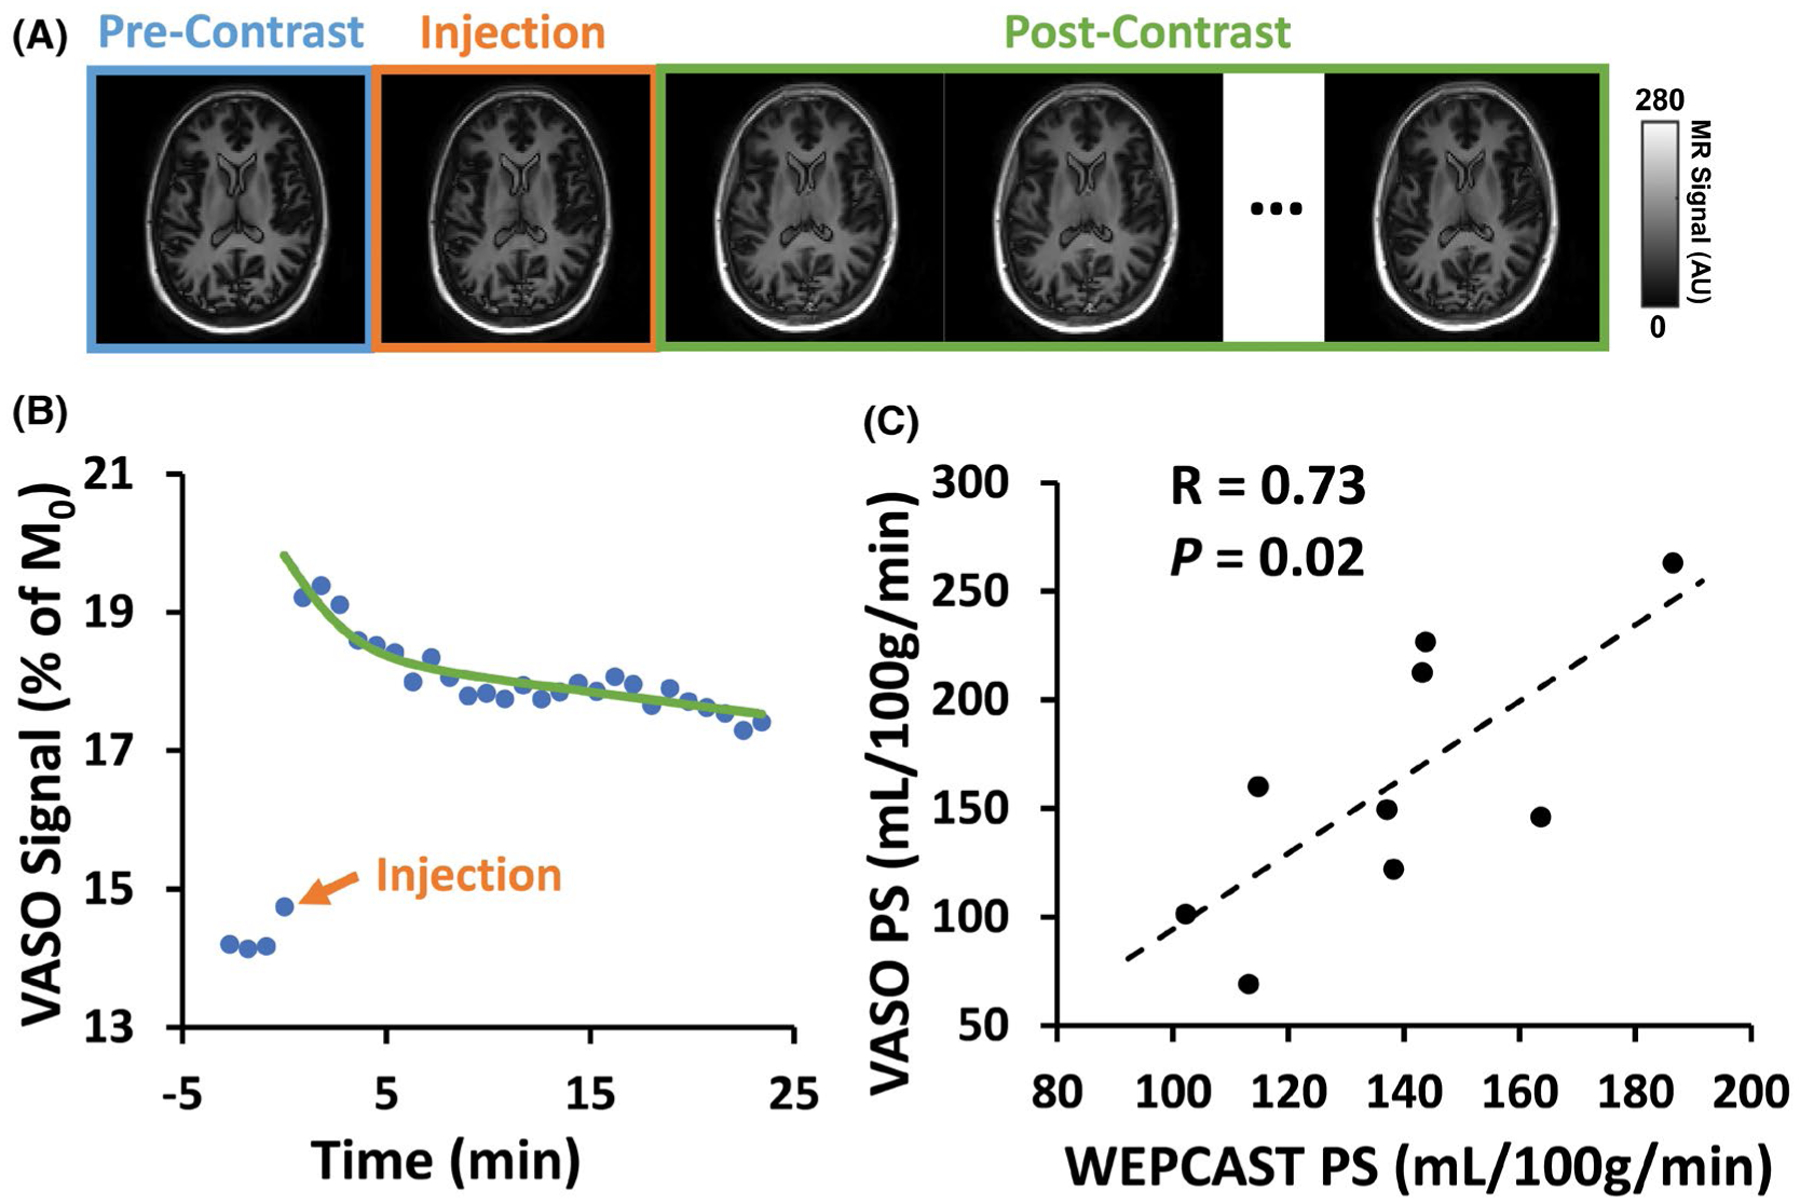
Results of contrast agent–based BBB method in comparison with Single-delay WEPCAST. (A) Representative VASO images (first echo) before and after contrast agent injection. (B) Gray matter VASO signal as a function of time and corresponding fitting result from 1 subject. (C) Scatter plot of PS results from WEPCAST and VASO MRI across all participants (N = 9)
4 |. DISCUSSION
Noncontrast assessment of BBB permeability to water represents a new area of research and may become useful biomarkers in several diseases; however, the current methods often require a long scan time. The present work proposed a new, Single-delay WEPCAST method that can provide an estimation of BBB permeability within a scan time of approximately 5 min. Reliability of the method was evaluated in terms of intrasession, intersession, and inter-vendor test–retest reproducibility, and this revealed a CoV range of 6% to 9%. Although there are no gold standard MRI techniques for water permeability measurement, some contrast-agent methods have been suggested to be sensitive to this parameter. Therefore, we also compared the non-contrast WEPCAST technique with a contrast agent–based method and observed a significant correlation in results from these 2 methods.
Abnormalities in blood–brain barrier permeability have been implicated in a large number of diseases, such as Alzheimer disease,2 multiple sclerosis,3 traumatic brain injury,52 sickle cell anemia,53 and cerebrovascular diseases.4,54 Existing BBB permeability techniques suitable for humans are largely based on the measurement of permeability to gadolinium using dynamic contrast-enhanced MRI6 or permeability to albumin using lumbar puncture.55 Recently there has been a surging interest in the measurement of water permeability using MRI. Such techniques have the advantages that they are completely noninvasive, and because water is a small molecule, they may be sensitive to early BBB disruptions. The basic principle of such methods is to use water as an endogenous tracer (through spin labeling) and aims to differentiate blood water molecules that are exchanged at the capillary–tissue interface from those remaining in the vessel. The relative fractions of these 2 spin pools can then be used to obtain a quantification of BBB permeability to water, following some kinetic modeling that accounts for T1 relaxation, bolus arrival time, post-labeling delay, and so forth. One method to distinguish the intravascular and extravascular spins is based on the diffusion properties of the water, in which spins in the capillary network experiences a much greater apparent diffusion coefficient following the intravascular incoherent motion principle.13,18,26–30,32 Another method exploited the T2 differences between tissue and blood and used multi-TE acquisition in combination of biexponential fitting to determine the fractions of intravascular and extravascular spins.22–25 Other methods utilizing T1 difference or magnetization transfer effect between intravascular and extravascular compartments were also proposed.17,20,21,56 The WEPCAST technique takes advantage of the differences in spatial destiny between exchanged and non-exchanged spins and measures the signals in large draining veins. The acquisition module of the sequence was also devised to be velocity-selective such that extravascular signal was further suppressed. Much technical work is still needed on each of the above-mentioned approaches to provide an efficient and reliable method ready for routine clinical use. The present work represents an effort to advance the WEPCAST method toward this general goal.
As in other methods, the parameter we want to determine in WEPCAST, that is, unexchanged water fraction, is tangled with other parameters such as bolus arrival time in terms of their effects on the MR signal. This necessitates multiple experimental measures in order to tease apart these parameters. In the proof-of-principle report of WEPCAST MRI, this was achieved by performing the experiments at multiple PLD times, which resulted in a long scan time of approximately 20 min. The conceptual advance in the present method is that we utilized the spatial profile of the signal along the SSS and exploited the spatiotemporal relationship of flowing spins to transform the model into a function of space rather than time, allowing the estimation of E using a single-delay scan of 5 min. In terms of the choice of the Single-delay time, the guiding principle is that the peak of the WEPCAST signal (eg, Figure 1D) should be located on the SSS. That is, the delay time should not be too short that the labeled bolus has not reached the SSS, and it should not be too long that the bolus has left the vein. Because the peak of the signal occurs at , the PLD should be chosen to be approximately , where δv is the range of bolus arrival time on the SSS. Previous reports have suggested that δv for posterior SSS is about 4810 ms.19 Thus, a PLD of 3500 ms was used in the present study. It is also expected that, for older participants, a longer PLD should be used.
Test–retest reproducibility is a critical index in the assessment of a technique in terms of its potential in clinical applications. This study showed that PS measured with the proposed technique has an intrasession and intersession CoV of around 6%, which is comparable or slightly lower than that of ASL (around 10%).57–59 In the context of pathological alterations in BBB permeability, it was reported that BBB permeability to water can change by 28.2% in diabetes,13 19.5% in hypercholesterolemia,13 31.0% in multiple sclerosis,34 and 93.8% in brain tumor.34 It has also been reported that BBB permeability to water could increase by 32% in aging mice60 and 50% to 100% in rat models of Alzheimer disease.33 Thus, the reliability of the WEPCAST measure is expected to be sufficient for detection of the BBB abnormalities in diseases. On the contrary, because the WEPCAST signal is proportional to 1-E and the 1-E term in healthy subjects is only ~8% on average, the dynamic range for 1-E to further decrease in disease (when PS increases) may be limited. This also means that CoV of PS in patients may be higher than that observed in healthy subjects. To prepare the technique for multi-site studies, we further harmonized the sequence across MRI vendors and found an inter-vendor CoV of 8.4%, suggesting that the technique has a good reproducibility across MRI platforms.
There is not a gold standard method for water permeability measurement in humans; therefore, validation of the proposed technique has not been feasible. In the literature of contrast-agent MRI, on the contrary, a few reports have suggested the sensitivity of T1-weighted signal to water permeability.33–35,49 With these frameworks, dynamic acquisition of T1-weighted MRI is performed before and after Gd contrast-agent injection. Whereas the signal change is primarily indicative of Gd leakage, thereby BBB permeability to Gd, the MR signal can also be shown to be sensitive to water exchange across the capillary–tissue interface under the fast-exchange regime. Although this effect is relatively small and intensive research is still ongoing to separate it from Gd leakage and CBV effects, it is nonetheless informative to compare the WEPCAST method to such contrast agent–based techniques. The results revealed a significant correlation between PS values measured from the 2 approaches.
The current study has several limitations: First, although the single-delay WEPCAST technique reduced the scan time by 75%, it also required more assumptions, data analysis steps, and a manual drawing of ROI. These additional considerations may present confounding factors. Two of the assumptions used were blood T1 and pseudo-continuous ASL labeling efficiency, which may be experimentally determined with additional sequences.39,45,61 The venous flow velocity along the SSS could also be measured with a separate phase-contrast scan using a thin slice. Second, only 2 MRI vendors, that is, Philips and Siemens, were included in the study. Further effort will be needed to implement the techniques on other platforms. Third, whereas the comparison with contrast-agent method provides some corroboration of the proposed technique, it has not been compared with a gold standard technique. Future study should compare the WEPCAST technique to other methods, for example, [11C]Butanol positron emission tomography,15 and apply experimental techniques that are able to transiently modulate BBB permeability. Finally, WEPCAST MRI is a global technique but does not provide regional information of BBB permeability in the present implementation. Therefore, compared to regional BBB techniques proposed in the literature,13,24–26,28,29,33,60 this method may not be sensitive to diseases that only affect a small region of the brain such as brain tumor or that detect early focal changes occurring in small structures such as hippocampus in early Alzheimer disease. Future studies shall focus on the measurement of WEPCAST signal in smaller draining veins such as internal cerebral veins and straight sinus, which may provide region-specific information of BBB integrity.
5 |. CONCLUSION
In this study, we proposed a time-efficient, Single-delay WEPCAST technique that can provide an assessment of global BBB permeability to water within a scan time of 5 min. We determined the benchmarks of this technique in terms of intrasession, intersession, and inter-vendor test–retest reproducibility. The results of the noncontrast method were also corroborated by a contrast agent–based method. Single-delay WEPCAST MRI may provide a useful tool for the assessment of BBB breakdown in neurologic and psychiatric diseases.
Supplementary Material
FIGURE S1 Simulated plots of function da(t, δv) in Equation (5) for different location (l = −10, 0, 10 cm) at superior sagittal sinus (SSS) with labeling duration (τ) = 2s and post-labeling delay (PLD) = 3.5s. Location l = 0 cm has a bolus arrival time of . Red line denotes time of acquisition t = PLD + τ, ie, 5.5s in this case
FIGURE S2 Simulation on the effect of neglecting re-exchanged spins on PS estimation. (A) Relative fraction of re-exchanged spin signal (ΔMb) to the total WEPCAST signal as a function of PS. The PS range was selected to be mean ± 2 standard deviations of values reported in previous PET literature. (B) Estimated PS when neglecting the contribution of ΔMb as a function of true PS
FIGURE S3 Scatter plot between E and CBF across participants (N = 10). Individuals who have a higher CBF had a lower E
FIGURE S4 Bland-Altman plots of E, CBF and PS for intra-session, inter-session and inter-vendor comparisons
FIGURE S5 Scatter plot of the PS values obtained from two independent raters
TABLE S1 CoV (%) results of E and CBF (N = 10) from the reproducibility study
Funding information
This work was supported by the National Institutes of Health (NIH), grants R01 AG064792, R01 NS106711, R01 NS106702, P41 EB015909, RF1 NS110041, S10 OD021648, and the American Heart Association (AHA), grant 19PRE34380371
Footnotes
SUPPORTING INFORMATION
Additional Supporting Information may be found online in the Supporting Information section.
REFERENCES
- 1.Abbott NJ, Patabendige AA, Dolman DE, Yusof SR, Begley DJ. Structure and function of the blood-brain barrier. Neurobiol Dis. 2010;37:13–25. [DOI] [PubMed] [Google Scholar]
- 2.Erickson MA, Banks WA. Blood-brain barrier dysfunction as a cause and consequence of Alzheimer’s disease. J Cereb Blood Flow Metab. 2013;33:1500–1513. [DOI] [PMC free article] [PubMed] [Google Scholar]
- 3.Kermode AG, Thompson AJ, Tofts P, et al. Breakdown of the blood-brain barrier precedes symptoms and other MRI signs of new lesions in multiple sclerosis. Pathogenetic and clinical implications. Brain. 1990;113:1477–1489. [DOI] [PubMed] [Google Scholar]
- 4.Sandoval KE, Witt KA. Blood-brain barrier tight junction permeability and ischemic stroke. Neurobiol Dis. 2008;32:200–219. [DOI] [PubMed] [Google Scholar]
- 5.Long DM. Capillary ultrastructure and the blood-brain barrier in human malignant brain tumors. J Neurosurg. 1970;32:127–144. [DOI] [PubMed] [Google Scholar]
- 6.Tofts PS, Kermode AG. Measurement of the blood-brain barrier permeability and leakage space using dynamic MR imaging. 1. Fundamental concepts. Magn Reson Med. 1991;17:357–367. [DOI] [PubMed] [Google Scholar]
- 7.Barbier EL, St Lawrence KS, Grillon E, Koretsky AP, Decorps M. A model of blood-brain barrier permeability to water: accounting for blood inflow and longitudinal relaxation effects. Magn Reson Med. 2002;47:1100–1109. [DOI] [PubMed] [Google Scholar]
- 8.Starr JM, Farrall AJ, Armitage P, McGurn B, Wardlaw J. Blood-brain barrier permeability in Alzheimer’s disease: a case-control MRI study. Psychiatry Res. 2009;171:232–241. [DOI] [PubMed] [Google Scholar]
- 9.van de Haar HJ, Burgmans S, Jansen JF, et al. Blood-brain barrier leakage in patients with early Alzheimer disease. Radiology. 2016;281:527–535. [DOI] [PubMed] [Google Scholar]
- 10.Kanda T, Oba H, Toyoda K, Furui S. Recent advances in understanding gadolinium retention in the brain. AJNR Am J Neuroradiol. 2016;37:E1–E2. [DOI] [PMC free article] [PubMed] [Google Scholar]
- 11.Olchowy C, Cebulski K, Lasecki M, et al. The presence of the gadolinium-based contrast agent depositions in the brain and symptoms of gadolinium neurotoxicity—a systematic review. PLoS One. 2017;12:e0171704. [DOI] [PMC free article] [PubMed] [Google Scholar]
- 12.Dickie BR, Parker GJM, Parkes LM. Measuring water exchange across the blood-brain barrier using MRI. Prog Nucl Magn Reson Spectrosc. 2020;116:19–39. [DOI] [PubMed] [Google Scholar]
- 13.Shao X, Ma SJ, Casey M, D’Orazio L, Ringman JM, Wang DJJ. Mapping water exchange across the blood-brain barrier using 3D diffusion-prepared arterial spin labeled perfusion MRI. Magn Reson Med. 2019;81:3065–3079. [DOI] [PMC free article] [PubMed] [Google Scholar]
- 14.Eichling JO, Raichle ME, Grubb RL Jr, Ter-Pogossian MM. Evidence of the limitations of water as a freely diffusible tracer in brain of the rhesus monkey. Circ Res. 1974;35:358–364. [DOI] [PubMed] [Google Scholar]
- 15.Herscovitch P, Raichle ME, Kilbourn MR, Welch MJ. Positron emission tomographic measurement of cerebral blood flow and permeability-surface area product of water using [15O]water and [11C]butanol. J Cereb Blood Flow Metab. 1987;7:527–542. [DOI] [PubMed] [Google Scholar]
- 16.Paulson OB, Hertz MM, Bolwig TG, Lassen NA. Water filtration and diffusion across the blood brain barrier in man. Acta Neurol Scand Suppl. 1977;64:492–493. [PubMed] [Google Scholar]
- 17.Parkes LM, Tofts PS. Improved accuracy of human cerebral blood perfusion measurements using arterial spin labeling: accounting for capillary water permeability. Magn Reson Med. 2002; 48:27–41. [DOI] [PubMed] [Google Scholar]
- 18.Silva AC, Williams DS, Koretsky AP. Evidence for the exchange of arterial spin-labeled water with tissue water in rat brain from diffusion-sensitized measurements of perfusion. Magn Reson Med. 1997;38:232–237. [DOI] [PubMed] [Google Scholar]
- 19.Lin Z, Li Y, Su P, et al. Non-contrast MR imaging of blood-brain barrier permeability to water. Magn Reson Med. 2018;80:1507–1520. [DOI] [PMC free article] [PubMed] [Google Scholar]
- 20.Li KL, Zhu X, Hylton N, Jahng GH, Weiner MW, Schuff N. Four-phase single-capillary stepwise model for kinetics in arterial spin labeling MRI. Magn Reson Med. 2005;53:511–518. [DOI] [PMC free article] [PubMed] [Google Scholar]
- 21.Carr JP, Buckley DL, Tessier J, Parker GJ. What levels of precision are achievable for quantification of perfusion and capillary permeability surface area product using ASL? Magn Reson Med. 2007;58:281–289. [DOI] [PubMed] [Google Scholar]
- 22.Gregori J, Schuff N, Kern R, Gunther M. T2-based arterial spin labeling measurements of blood to tissue water transfer in human brain. J Magn Reson Imaging. 2013;37:332–342. [DOI] [PMC free article] [PubMed] [Google Scholar]
- 23.Mahroo A, Breutigam N, Gunther M. Assessing repeatability of blood brain barrier permeability measure using contrast-free MRI. ISMRM & SMRT Virtual Conference & Exhibition. August 2020. p. 32 [Google Scholar]
- 24.Ohene Y, Harrison IF, Nahavandi P, et al. Non-invasive MRI of brain clearance pathways using multiple echo time arterial spin labelling: an aquaporin-4 study. Neuroimage. 2019;188:515–523. [DOI] [PMC free article] [PubMed] [Google Scholar]
- 25.Wells JA, Siow B, Lythgoe MF, Thomas DL. Measuring biexponential transverse relaxation of the ASL signal at 9.4 T to estimate arterial oxygen saturation and the time of exchange of labeled blood water into cortical brain tissue. J Cereb Blood Flow Metab. 2013;33:215–224. [DOI] [PMC free article] [PubMed] [Google Scholar]
- 26.St Lawrence KS, Owen D, Wang DJ. A two-stage approach for measuring vascular water exchange and arterial transit time by diffusion-weighted perfusion MRI. Magn Reson Med. 2012;67:1275–1284. [DOI] [PMC free article] [PubMed] [Google Scholar]
- 27.Tiwari YV, Lu J, Shen Q, Cerqueira B, Duong TQ. Magnetic resonance imaging of blood-brain barrier permeability in ischemic stroke using diffusion-weighted arterial spin labeling in rats. J Cereb Blood Flow Metab. 2017;37:2706–2715. [DOI] [PMC free article] [PubMed] [Google Scholar]
- 28.Wang J, Fernandez-Seara MA, Wang S, St Lawrence KS. When perfusion meets diffusion: in vivo measurement of water permeability in human brain. J Cereb Blood Flow Metab. 2007;27:839–849. [DOI] [PubMed] [Google Scholar]
- 29.Wengler K, Bangiyev L, Canli T, Duong TQ, Schweitzer ME, He X. 3D MRI of whole-brain water permeability with intrinsic diffusivity encoding of arterial labeled spin (IDEALS). Neuroimage. 2019;189:401–414. [DOI] [PubMed] [Google Scholar]
- 30.Zhang Q, Nguyen T, Ivanidze J, Wang Y. High resolution water exchange rate mapping using 3D diffusion prepared arterial spin labeled perfusion MRI. In Proceedings of theISMRM & SMRT Virtual Conference & Exhibition, 2020. p. 34. [Google Scholar]
- 31.Zhang X, Ingo C, Teeuwisse WM, Chen Z, van Osch MJP. Comparison of perfusion signal acquired by arterial spin labeling-prepared intravoxel incoherent motion (IVIM) MRI and conventional IVIM MRI to unravel the origin of the IVIM signal. Magn Reson Med. 2018;79:723–729. [DOI] [PubMed] [Google Scholar]
- 32.Palomares JA, Tummala S, Wang DJ, et al. Water exchange across the blood-brain barrier in obstructive sleep apnea: an MRI diffusion-weighted pseudo-continuous arterial spin labeling study. J Neuroimaging. 2015;25:900–905. [DOI] [PMC free article] [PubMed] [Google Scholar]
- 33.Dickie BR, Vandesquille M, Ulloa J, Boutin H, Parkes LM, Parker GJM. Water-exchange MRI detects subtle blood-brain barrier breakdown in Alzheimer’s disease rats. Neuroimage. 2019;184:349–358. [DOI] [PubMed] [Google Scholar]
- 34.Rooney WD, Li X, Sammi MK, Bourdette DN, Neuwelt EA, Springer CS Jr. Mapping human brain capillary water lifetime: high-resolution metabolic neuroimaging. NMR Biomed. 2015;28:607–623. [DOI] [PMC free article] [PubMed] [Google Scholar]
- 35.Schwarzbauer C, Morrissey SP, Deichmann R, et al. Quantitative magnetic resonance imaging of capillary water permeability and regional blood volume with an intravascular MR contrast agent. Magn Reson Med. 1997;37:769–777. [DOI] [PubMed] [Google Scholar]
- 36.Zaharchuk G, Bogdanov AA Jr, Marota JJ, et al. Continuous assessment of perfusion by tagging including volume and water extraction (CAPTIVE): a steady-state contrast agent technique for measuring blood flow, relative blood volume fraction, and the water extraction fraction. Magn Reson Med. 1998;40:666–678. [DOI] [PubMed] [Google Scholar]
- 37.Petersen ET, Zimine I, Ho YC, Golay X. Non-invasive measurement of perfusion: a critical review of arterial spin labelling techniques. Br J Radiol. 2006;79:688–701. [DOI] [PubMed] [Google Scholar]
- 38.Alsop DC, Detre JA, Golay X, et al. Recommended implementation of arterial spin-labeled perfusion MRI for clinical applications: a consensus of the ISMRM perfusion study group and the European consortium for ASL in dementia. Magn Reson Med. 2015;73:102–116. [DOI] [PMC free article] [PubMed] [Google Scholar]
- 39.Zhao L, Vidorreta M, Soman S, Detre JA, Alsop DC. Improving the robustness of pseudo-continuous arterial spin labeling to off-resonance and pulsatile flow velocity. Magn Reson Med. 2017;78:1342–1351. [DOI] [PMC free article] [PubMed] [Google Scholar]
- 40.Crone PB. Counting of tubercle bacilli. Mon Bull Minist Health Public Health Lab Serv. 1963;22:44–46. [PubMed] [Google Scholar]
- 41.Chappell MA, Woolrich MW, Kazan S, Jezzard P, Payne SJ, MacIntosh BJ. Modeling dispersion in arterial spin labeling: validation using dynamic angiographic measurements. Magn Reson Med. 2013;69:563–570. [DOI] [PubMed] [Google Scholar]
- 42.Van Uitert R, Bitter I. Subvoxel precise skeletons of volumetric data based on fast marching methods. Med Phys. 2007;34:627–638. [DOI] [PubMed] [Google Scholar]
- 43.Schuchardt F, Schroeder L, Anastasopoulos C, et al. In vivo analysis of physiological 3D blood flow of cerebral veins. Eur Radiol. 2015;25:2371–2380. [DOI] [PubMed] [Google Scholar]
- 44.Lu H, Clingman C, Golay X, van Zijl PC. Determining the longitudinal relaxation time (T1) of blood at 3.0 Tesla. Magn Reson Med. 2004;52:679–682. [DOI] [PubMed] [Google Scholar]
- 45.Aslan S, Xu F, Wang PL, et al. Estimation of labeling efficiency in pseudocontinuous arterial spin labeling. Magn Reson Med. 2010;63:765–771. [DOI] [PMC free article] [PubMed] [Google Scholar]
- 46.Liu P, Uh J, Lu H. Determination of spin compartment in arterial spin labeling MRI. Magn Reson Med. 2011;65:120–127. [DOI] [PMC free article] [PubMed] [Google Scholar]
- 47.Peng SL, Su P, Wang FN, et al. Optimization of phase-contrast MRI for the quantification of whole-brain cerebral blood flow. J Magn Reson Imaging. 2015;42:1126–1133. [DOI] [PMC free article] [PubMed] [Google Scholar]
- 48.Shrout PE, Fleiss JL. Intraclass correlations: uses in assessing rater reliability. Psychol Bull. 1979;86:420–428. [DOI] [PubMed] [Google Scholar]
- 49.Uh J, Lewis-Amezcua K, Varghese R, Lu H. On the measurement of absolute cerebral blood volume (CBV) using vascular-space-occupancy (VASO) MRI. Magn Reson Med. 2009;61:659–667. [DOI] [PMC free article] [PubMed] [Google Scholar]
- 50.Wechsler D WAIS-R Manual: Wechsler Adult Intelligence Scale—Revised Manual. New York, NY: The Psychological Corporation; 1981. [Google Scholar]
- 51.Lu H, Law M, Johnson G, Ge Y, van Zijl PC, Helpern JA. Novel approach to the measurement of absolute cerebral blood volume using vascular-space-occupancy magnetic resonance imaging. Magn Reson Med. 2005;54:1403–1411. [DOI] [PubMed] [Google Scholar]
- 52.Chodobski A, Zink BJ, Szmydynger-Chodobska J. Blood-brain barrier pathophysiology in traumatic brain injury. Transl Stroke Res. 2011;2:492–516. [DOI] [PMC free article] [PubMed] [Google Scholar]
- 53.Tran H, Mittal A, Sagi V, et al. Mast cells induce blood brain barrier damage in SCD by causing endoplasmic reticulum stress in the endothelium. Front Cell Neurosci. 2019;13:56. [DOI] [PMC free article] [PubMed] [Google Scholar]
- 54.Wardlaw JM. Blood-brain barrier and cerebral small vessel disease. J Neurol Sci. 2010;299:66–71. [DOI] [PubMed] [Google Scholar]
- 55.Wada H Blood-brain barrier permeability of the demented elderly as studied by cerebrospinal fluid-serum albumin ratio. Intern Med. 1998;37:509–513. [DOI] [PubMed] [Google Scholar]
- 56.Mahmud S, Denney TRB, Bashir A. Measurement of blood-brain barrier permeability in human brain using magnetization transfer effect at 7T. In Proceedings of theISMRM & SMRT Virtual Conference & Exhibition, 2020. p. 545. [Google Scholar]
- 57.Mutsaerts HJ, Steketee RM, Heijtel DF, et al. Inter-vendor reproducibility of pseudo-continuous arterial spin labeling at 3 Tesla. PLoS One. 2014;9:e104108. [DOI] [PMC free article] [PubMed] [Google Scholar]
- 58.Chen Y, Wang DJ, Detre JA. Test-retest reliability of arterial spin labeling with common labeling strategies. J Magn Reson Imaging. 2011;33:940–949. [DOI] [PMC free article] [PubMed] [Google Scholar]
- 59.Petersen ET, Mouridsen K, Golay X; all named co-authors of the QUASAR test-retest study. The QUASAR reproducibility study, Part II: results from a multi-center Arterial Spin Labeling test-retest study. Neuroimage. 2010;49:104–113. [DOI] [PMC free article] [PubMed] [Google Scholar]
- 60.Ohene Y, Harrison IF, Evans PG, Thomas DL, Lythgoe MF, Wells JA. Increased blood-brain barrier permeability to water in the aging brain detected using noninvasive multi-TE ASL MRI. Magn Reson Med. 2021;85:326–333. [DOI] [PMC free article] [PubMed] [Google Scholar]
- 61.Li W, Liu P, Lu H, Strouse JJ, van Zijl PCM, Qin Q. Fast measurement of blood T1 in the human carotid artery at 3T: accuracy, precision, and reproducibility. Magn Reson Med. 2017;77: 2296–2302. [DOI] [PMC free article] [PubMed] [Google Scholar]
Associated Data
This section collects any data citations, data availability statements, or supplementary materials included in this article.
Supplementary Materials
FIGURE S1 Simulated plots of function da(t, δv) in Equation (5) for different location (l = −10, 0, 10 cm) at superior sagittal sinus (SSS) with labeling duration (τ) = 2s and post-labeling delay (PLD) = 3.5s. Location l = 0 cm has a bolus arrival time of . Red line denotes time of acquisition t = PLD + τ, ie, 5.5s in this case
FIGURE S2 Simulation on the effect of neglecting re-exchanged spins on PS estimation. (A) Relative fraction of re-exchanged spin signal (ΔMb) to the total WEPCAST signal as a function of PS. The PS range was selected to be mean ± 2 standard deviations of values reported in previous PET literature. (B) Estimated PS when neglecting the contribution of ΔMb as a function of true PS
FIGURE S3 Scatter plot between E and CBF across participants (N = 10). Individuals who have a higher CBF had a lower E
FIGURE S4 Bland-Altman plots of E, CBF and PS for intra-session, inter-session and inter-vendor comparisons
FIGURE S5 Scatter plot of the PS values obtained from two independent raters
TABLE S1 CoV (%) results of E and CBF (N = 10) from the reproducibility study